
Alzheimer’s Disease-Related Phospho-Tau181 Signals Are Localized to Demyelinated Axons of Parvalbumin-Positive GABAergic Interneurons in an App Knock-In Mouse Model of Amyloid-β Pathology
Abstract
Background:
The tau protein phosphorylated at Thr181 (p-tau181) in cerebrospinal fluid and blood is a sensitive biomarker for Alzheimer’s disease (AD). Increased p-tau181 levels correlate well with amyloid-β (Aβ) pathology and precede neurofibrillary tangle formation in the early stage of AD; however, the relationship between p-tau181 and Aβ-mediated pathology is less well understood. We recently reported that p-tau181 represents axonal abnormalities in mice with Aβ pathology (AppNLGF). However, from which neuronal subtype(s) these p-tau181-positive axons originate remains elusive.
Objective:
The main purpose of this study is to differentiate neuronal subtype(s) and elucidate damage associated with p-tau181-positive axons by immunohistochemical analysis of AppNLGF mice brains.
Methods:
Colocalization between p-tau181 and (1) unmyelinated axons positive for vesicular acetylcholine transporter or norepinephrine transporter and (2) myelinated axons positive for vesicular glutamate transporter, vesicular GABA transporter, or parvalbumin in the brains of 24-month-old AppNLGF and control mice without Aβ pathology were analyzed. The density of these axons was also compared.
Results:
Unmyelinated axons of cholinergic or noradrenergic neurons did not overlap with p-tau181. By contrast, p-tau181 signals colocalized with myelinated axons of parvalbumin-positive GABAergic interneurons but not of glutamatergic neurons. Interestingly, the density of unmyelinated axons was significantly decreased in AppNLGF mice, whereas that of glutamatergic, GABAergic, or p-tau181-positive axons was less affected. Instead, myelin sheaths surrounding p-tau181-positive axons were significantly reduced in AppNLGF mice.
Conclusion:
This study demonstrates that p-tau181 signals colocalize with axons of parvalbumin-positive GABAergic interneurons with disrupted myelin sheaths in the brains of a mouse model of Aβ pathology.
INTRODUCTION
Phospho-tau proteins have been reported as promising fluid biomarkers for Alzheimer’s disease (AD). Increases in the levels of tau phosphorylated at Thr181 (p-tau181), Thr217 (p-tau217), and Thr231 (p-tau231) in cerebrospinal fluid (CSF) and plasma correlate well with amyloid-positron emission tomography (PET) positivity [1, 2] and detect AD during the preclinical period with high accuracy [3–8]. Moreover, a study in a mouse model of familial AD has shown that extracellular amyloid-β (Aβ) pathology is sufficient to increase p-tau181 and p-tau217 levels in CSF in the absence of tau tangles [9]. However, relationships between these p-tau proteins and Aβ-mediated brain pathology are less well understood.
By utilizing the App knock-in mouse model of Aβ pathology (AppNLGF mice), we recently reported that p-tau217 and p-tau231 signals were specifically detected around Aβ plaques in the brains of AppNLGF mice and colocalized with the postsynaptic marker, postsynaptic density protein 95 (PSD-95). This suggests that the appearance of p-tau217 and p-tau231 may represent postsynaptic pathology of glutamatergic neurons associated with Aβ plaques [10]. By contrast, most p-tau181 signals did not colocalize with p-tau217 or p-tau231; rather, they were readily detectable in the axons of wild-type (WT) mouse brains, and these axonal structures were disrupted in AppNLGF mice [10]. Interestingly, although tau proteins are ubiquitously expressed in neuronal axons, p-tau181 signals are localized to only certain axons. Whether a specific neuronal subtype(s) is responsible for p-tau181-positive axons, and the type of axonal damage caused by Aβ pathology, remains elusive.
Widespread brain regions and several neurotransmitter systems are affected in AD brains. For example, aberrant neurotransmission and neurodegeneration in the cholinergic system are observed in the early stage of AD [11, 12] and have been a therapeutic target for improving clinical symptoms [13, 14]. The nucleus basalis of Meynert (NBM) is a major source of cortical cholinergic innervation with long and thin unmyelinated axons [15]. In the prodromal stage of AD, reduced cholinergic projections and tau pathology have been observed [16–20]. Monoaminergic neurons, including the noradrenergic system, are also affected in the early stage of AD, which is thought to cause cognitive deficits. Noradrenergic neurons in the locus coeruleus extend their unmyelinated axons throughout the cortex [21–24] and are reported to degenerate and develop tau pathology in the early stage of AD [25–29]. These reports suggest that p-tau181 signals might be localized to unmyelinated axons.
In addition to unmyelinated neurons in subcortical and brainstem regions, excitatory-inhibitory imbalance in myelinated neurons in the cortex has been linked to cognitive decline in early AD [30]. During AD progression, neuronal hyperactivity is hypothesized to be induced by Aβ pathology, followed by neuronal loss. And altered GABAergic transmission [31], especially fast-spiking parvalbumin-expressing interneurons, is suggested to play a role in this network dysfunction [32, 33]. Several studies have also shown that glutamatergic and GABAergic synapses are damaged by Aβ accumulation in the brains of AD patients [34–37]. These reports suggest that p-tau181 signals might localize to myelinated glutamatergic and/or GABAergic axons.
To elucidate from which neuronal subtype(s) p-tau181-positive axons originate, and the type of axonal damage induced by Aβ pathology, we utilized an App knock-in mouse model of Aβ pathology [38]. AppNLGF mice harbor three familial AD mutations (Swedish [NL], Arctic [G], and Beyreuther/Iberian [F]) and show progressive Aβ pathology in the brain parenchyma along with severe neuroinflammation and cognitive deficits [38, 39]. Our systematic immunohistochemical analyses revealed that p-tau181 signals overlapped with myelinated axons of parvalbumin-expressing GABAergic interneurons but not those of glutamatergic, cholinergic, or noradrenergic neurons, and that myelin sheaths of p-tau181-positive axons were disrupted in AppNLGF mice. These results suggest that p-tau181 may reflect demyelination of parvalbumin-expressing GABAergic interneurons upon Aβ accumulation in the early stage of AD.
MATERIALS AND METHODS
Animals
Experiments were performed using 6- or 24-month-old male C57BL/6J and App knock-in (AppNL, AppNLGF) mice [38]. All handling and experimental procedures were previously described [10] and performed in accordance with the NIH Guide for the Care and Use of Laboratory Animals and other national regulations and policies with the approval of the Animal Care and Use Committee at National Center for Geriatrics and Gerontology, Japan (Approval number: 2– 45).
Tissue preparation
All animals were deeply anesthetized by intraperitoneal administration of a combination of medetomidine (0.3 mg/kg), midazolam (4.0 mg/kg), and butorphanol (5.0 mg/kg), and whole brains were collected and processed for cryosectioning, as previously described [10].
Immunohistochemistry
Immunohistochemical staining was performed as described previously [10]. The primary and secondary antibodies used in this study were listed in Supplementary Table 1. For nuclear staining, 4′,6-diamidino-2-phenylindole (DAPI) or propidium iodide (PI) were used in an appropriate combination. For detection of Aβ amyloidosis, 1-fluoro-2,5-bis (3-carboxy-4-hydroxystyryl) benzene (FSB) was used.
Image acquisition and analysis
As described previously [10, 40], images were acquired using either a LSM700 or LSM780 confocal laser-scanning microscope (Carl Zeiss, Germany) fitted with 20× or 63× objectives. All image processing and analyses were performed with Fiji software using appropriate plugin.
Measurement of coverage with vesicular acetylcholine transporter (VAChT)- and myelin basic protein (MBP)-positive fibers
Procedures for measuring coverage with the fibers from the acquired images were described previously [10, 40]. We captured images using a LSM700 confocal microscopy with a 20× objective, and 10μm Z-stacks (0.85μm interval between images) were reconstructed with a maximum intensity projection. Immunoreactivities for VAChT or MBP were defined as numbers of signal-positive pixels within an entire image, which were determined by thresholding with an automated method (Li’s method for VAChT and Otsu’s method for MBP).
Counting of choline acetyltransferase (ChAT)-positive cell in the NBM
For counting number of ChAT-positive cells in the NBM, we captured images using a LSM780 confocal microscopy with a 20× objective and reconstructed 25μm Z-stacks (2.88μm interval between images) with a maximum intensity projection. We chose the coronal sections including the NBM evenly through rostral to caudal portions (– 0.34 to – 0.94 mm from bregma) and counted ChAT-positive cell number according to the procedure previously described [10, 40].
Measurement of immunoreactivity for p-tau181, vesicular glutamate transporter 1 (VGLUT1) and vesicular GABA transporter (VGAT)
Procedures for measuring immunoreactivity from the acquired images were described previously [10, 40]. For acquisition of immunofluorescence for p-tau181, VGLUT1, and VGAT, we captured images using a LSM700 confocal microscopy with a 20× objective, and reconstructed 10μm Z-stacks (0.85μm interval between images) with a maximum intensity projection. Fluorescent intensity from each signal was evaluated and expressed as relative percentage to WT mice.
Statistical analysis
All statistical analyses were conducted using GraphPad Prism 9 (GraphPad software) as previously described [10]. One-way ANOVA followed by the Tukey’s post hoc tests or Student’s t-test was used. Data are presented as mean±SEM. All alpha levels were set at 0.05. *p < 0.05, **p < 0.01, ***p < 0.001.
RESULTS
p-tau181-positive axons do not overlap with unmyelinated cholinergic or noradrenergic axons in mouse brains
We recently reported that p-tau181 signals were localized to neuronal axons in WT mice [10], and that these structures were disrupted in AppNLGF mice, which develop massive Aβ plaques but not neurofibrillary tangles [38, 41]. However, whether a specific neuronal subtype(s) is associated with p-tau181 signals was unclear. Here, we first examined whether p-tau181 signals overlap with unmyelinated axons of cholinergic and noradrenergic neurons in AppNLGF mice and control mice without Aβ pathology.
The AppNLGF mice exhibit age-dependent Aβ deposits in the cortex and hippocampus, but do not show tau pathology such as neurofibrillary tangles [41, 42]. Thus, AppNLGF mice are thought to recapitulate Aβ pathology at the preclinical and early stages of AD. In addition to WT mice with the same C57BL/6J background, we also included AppNL mice, which harbor a familial AD-related Swedish [NL] mutation and produce human Aβ and AβPP fragments but do not develop Aβ pathology as controls [39, 43]. We costained brain sections from 24-month-old AppNLGF, AppNL, and WT mice with antibodies against p-tau181 and vesicular acetylcholine transporter (VAChT), a marker of cholinergic axon terminals (Fig. 1A1–A5, B1–B4, and C1–C5), or norepinephrine transporter (NET), a marker of noradrenergic axon terminals (Fig. D1–D5, E1–E4, and F1–F5) in the cortex. High-magnification images revealed that these signals did not overlap (Fig. 1 A5, C5, D5, and F5). To further confirm these results, we used 3D reconstruction imaging techniques and found that there was no overlap between p-tau181-positive signals and VAChT or NET signals (Supplementary Movies 1 and 2).
Fig. 1
p-tau181-positive axons do not overlap with unmyelinated cholinergic or noradrenergic axons in mouse brains. Representative images of the cortex from frozen coronal brain sections immunostained with antibodies against VAChT (A1– C1; magenta in A3– C3), NET (D1– F1; magenta in D3– F3), and p-tau181 (A2– F2; green in A3– F3). FSB was used for detecting Aβ plaques (blue in A3– F3). Scale bars, 100μm. (A4– F4) Higher magnification of framed regions indicated in A3– F3. Scale bars, 20μm. (A5– F5) Higher magnification of framed regions indicated in A4 – F4. Scale bars, 2.5μm.
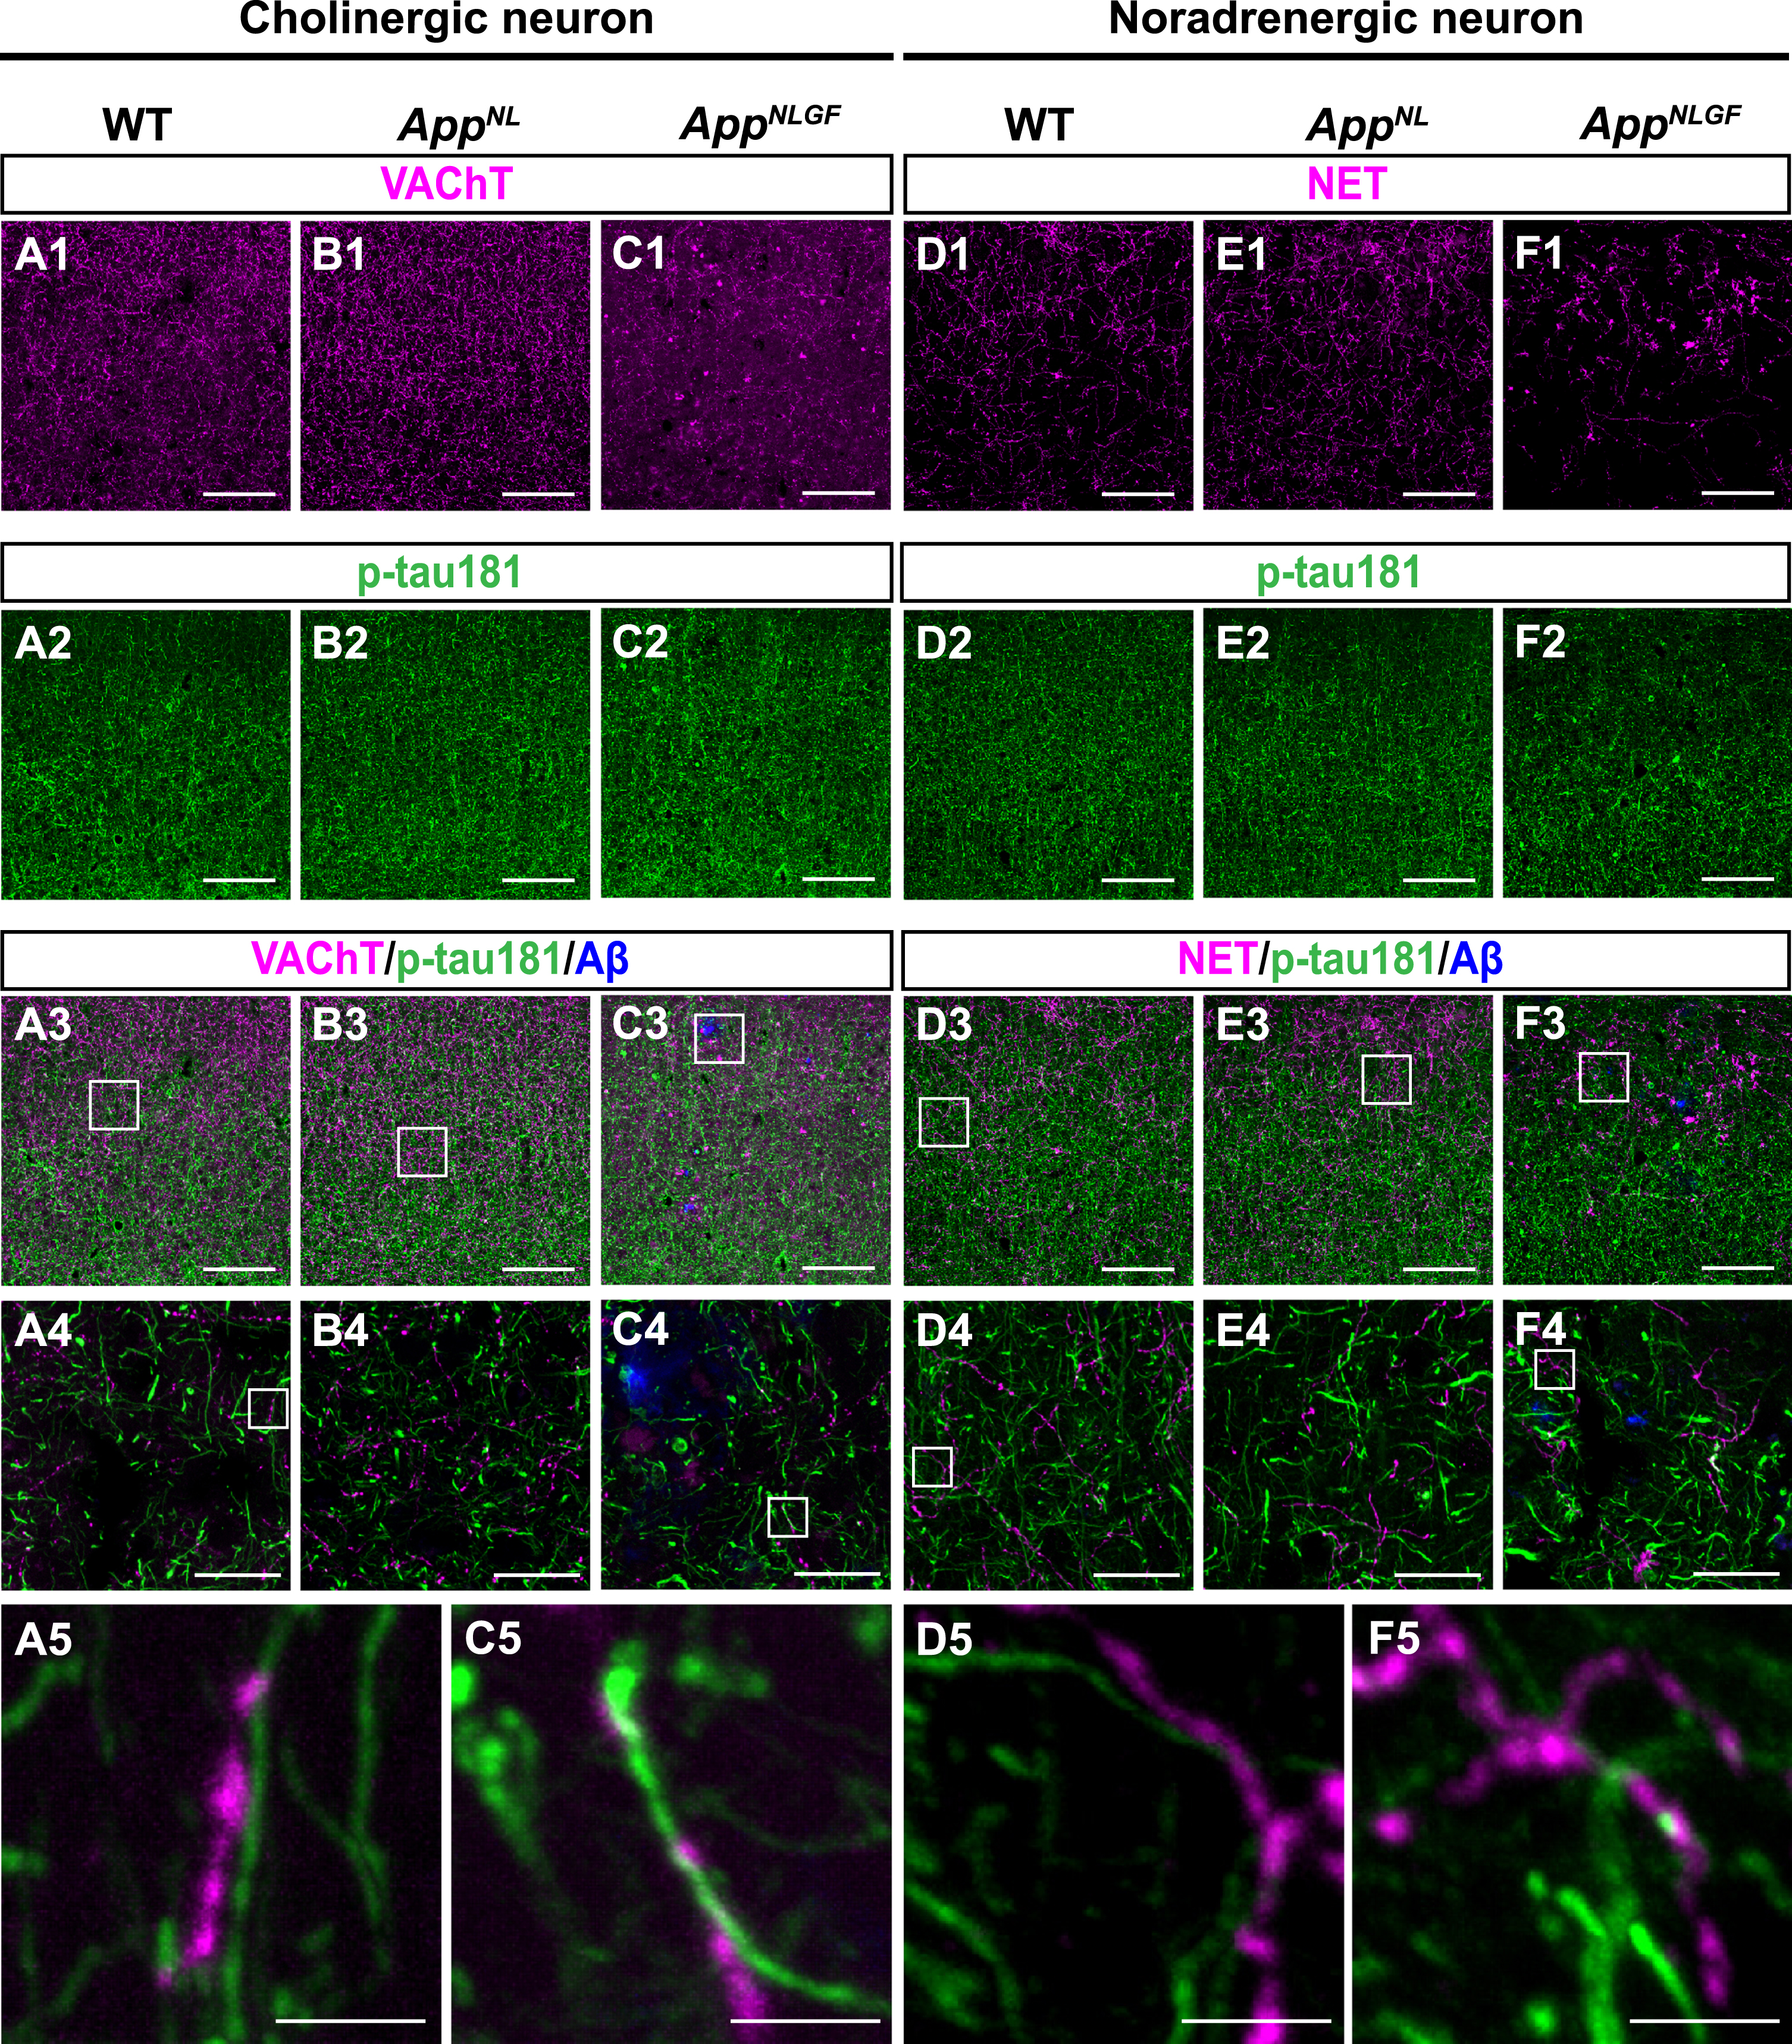
Taken together, these results indicate that p-tau181 signals are not localized to unmyelinated cholinergic or noradrenergic axons in mouse brains.
The density of cholinergic axons, but not p-tau181 signals, is significantly reduced in the cortex of AppNLGF mice
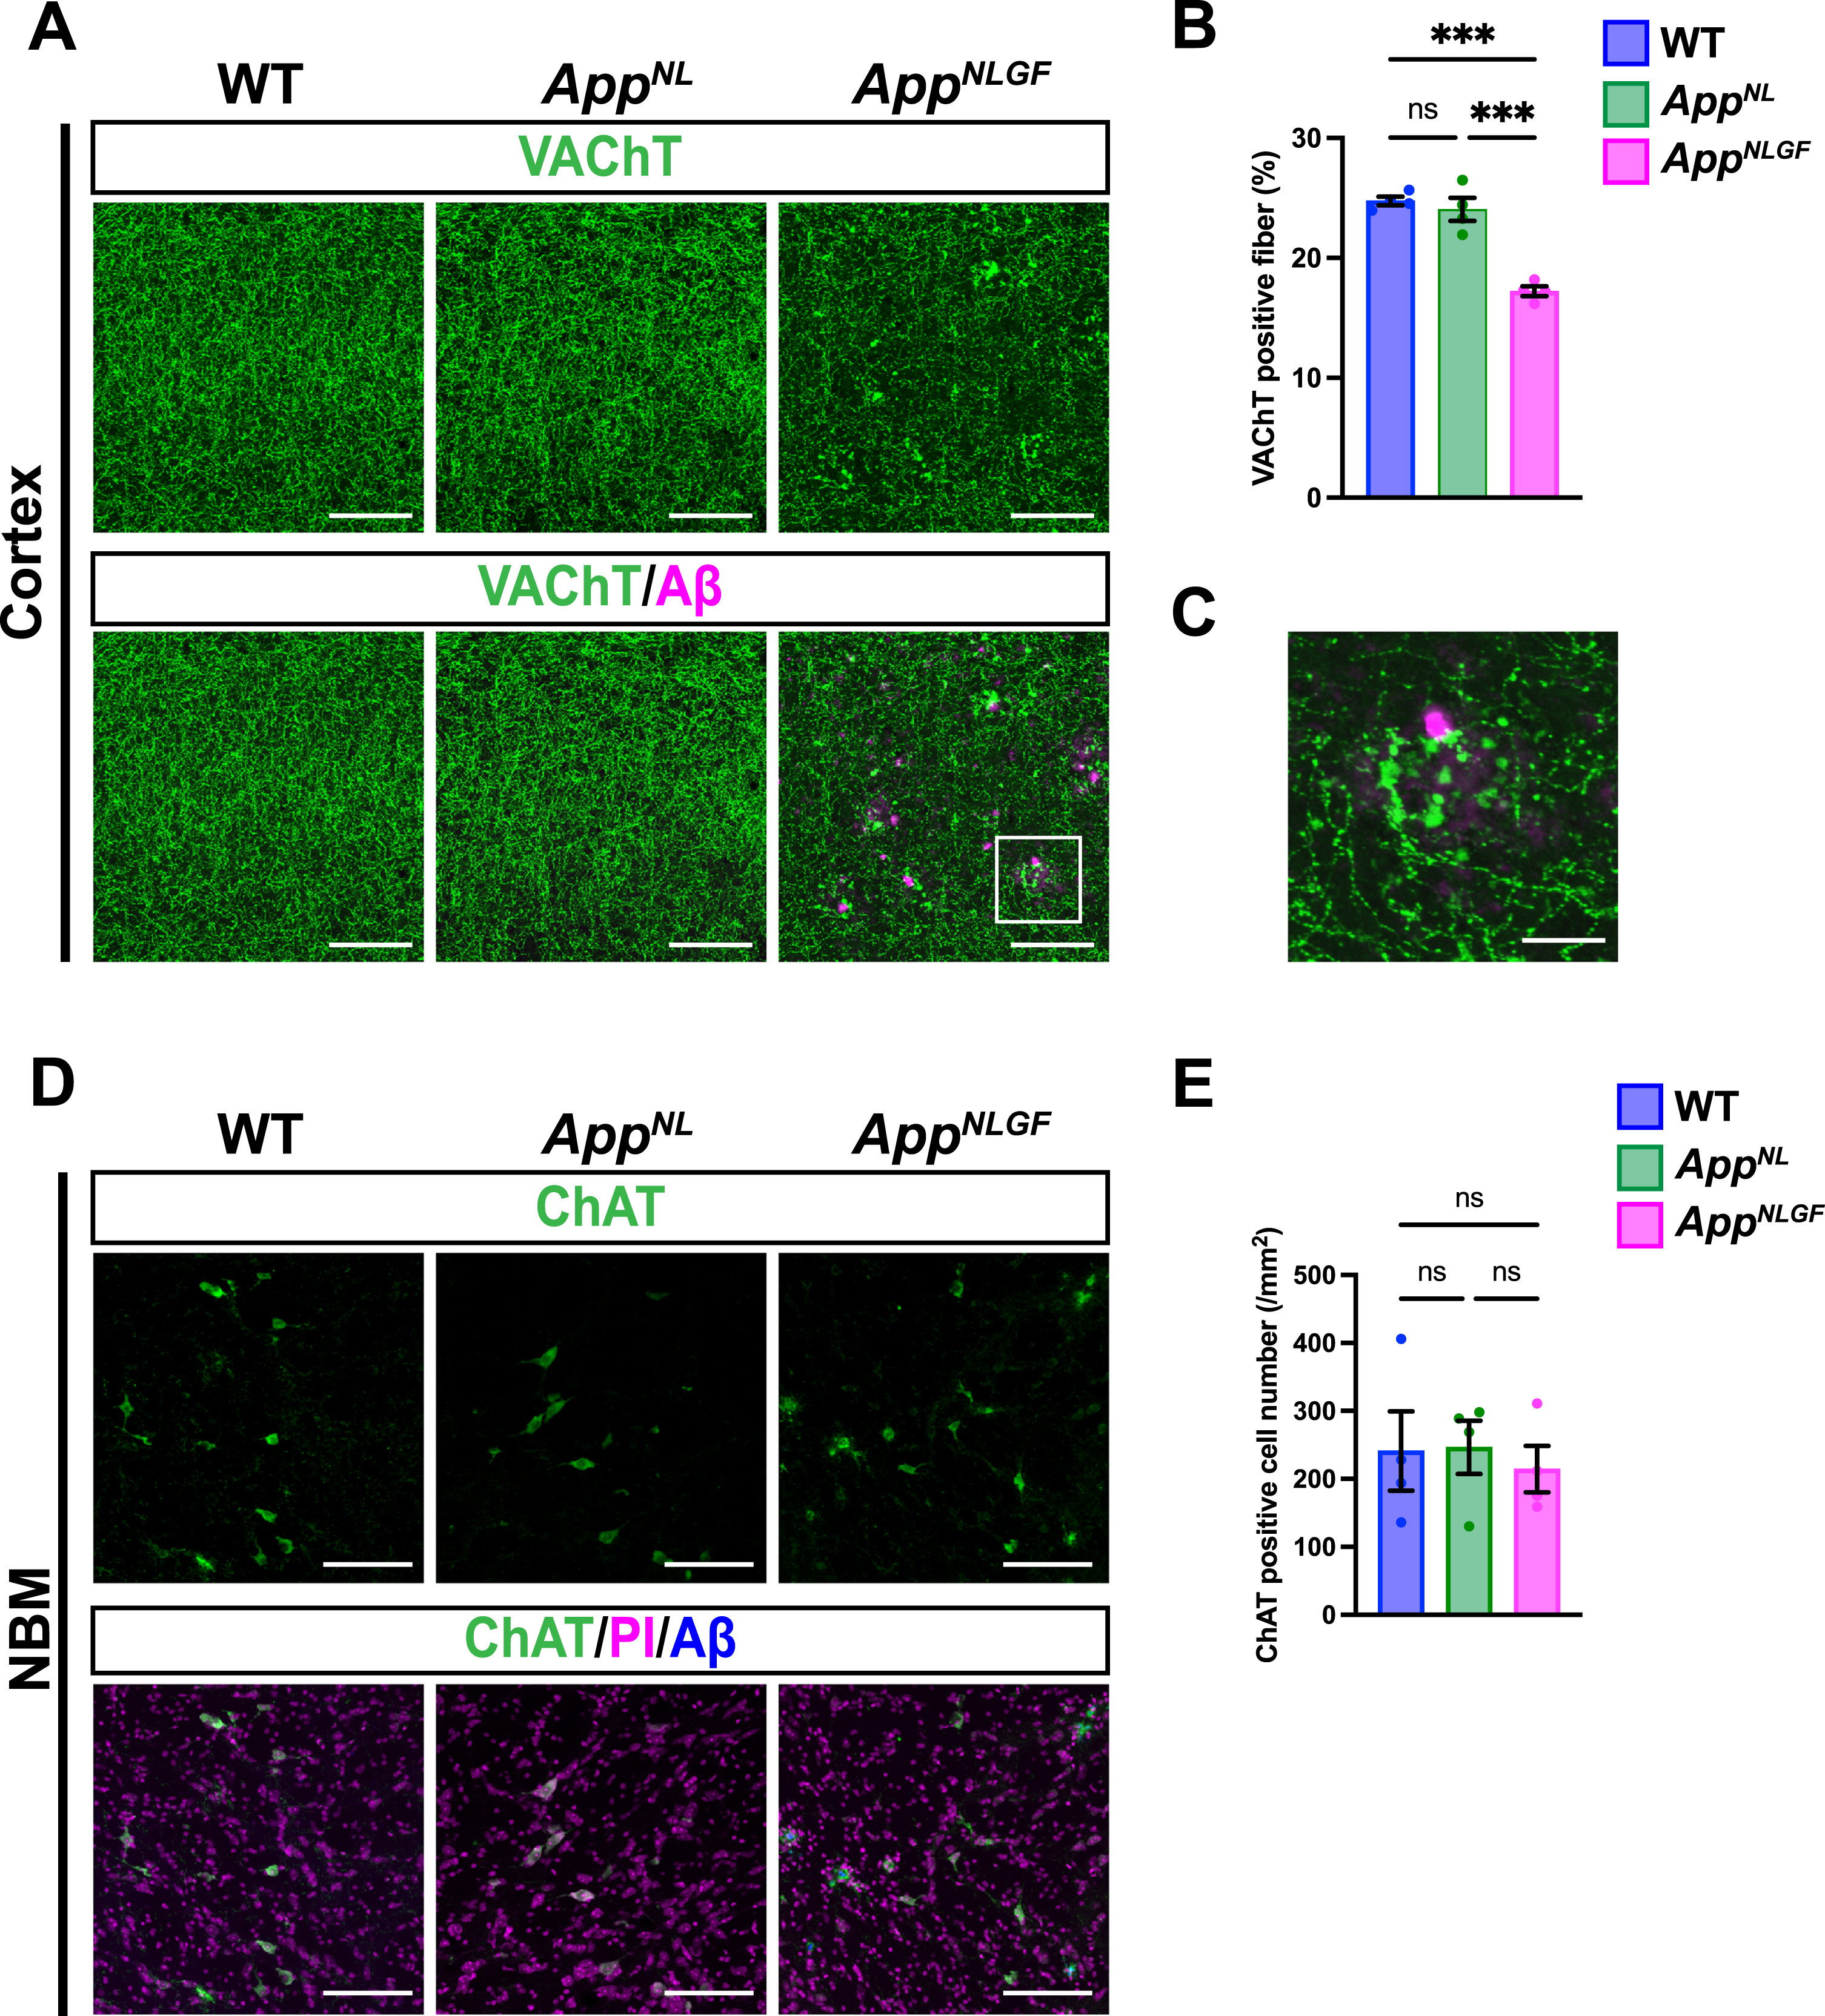
We next analyzed and compared how cholinergic axons and p-tau181-positive axons were affected in the brains of AppNLGF mice. Brain sections from 24-month-old AppNLGF, AppNL, and WT mice were stained with an antibody against VAChT, and the area of VAChT immunoreactivity was quantified. The density of VAChT-positive fibers was significantly reduced in AppNLGF mice compared with the density of those in AppNL or WT mice, both in the cortex (Fig. 2A, B) and hippocampus (Supplementary Figure 1A, B). In addition, cholinergic axons showed axonal dystrophy around Aβ plaques in AppNLGF mice (Fig. 2C, higher magnification of framed region in 2A). By contrast, the density of VAChT-positive fibers was similar between AppNL and WT mice (Fig. 2A, B). To determine whether a reduction in cholinergic afferents in the cortex reflects neuron loss in the NBM, we immunostained brain sections containing the NBM from AppNLGF, AppNL, and WT mice with an antibody against choline acetyltransferase (ChAT), a marker of cholinergic neurons (Fig. 2D). Quantitative analysis revealed similar numbers of ChAT-positive neurons in the NBM regions of all genotypes (Fig. 2E), indicating that the reduced density of cholinergic afferents in AppNLGF mice is not due to NBM neuron loss. These results are similar to those of our previous study showing that the density of unmyelinated noradrenergic afferents is significantly reduced without neuron loss in the locus coeruleus in AppNLGF mice [40].
Fig. 2
The density of cholinergic axons is significantly reduced in the cortex of AppNLGF mice. (A) Representative images of the cortex from frozen coronal brain sections immunostained with antibodies against VAChT (green). FSB was used for detecting Aβ plaques (magenta). Scale bars, 100μm. (B) VAChT immunoreactivity was quantified and expressed as positive area (%). n = 4 /group. ***p < 0.001. (C) A higher magnification of framed region indicated in A. Scale bar, 20μm. (D) Representative images of the NBM from frozen coronal brain sections immunostained with antibodies against ChAT (green) were shown (magenta indicated PI staining). FSB was used for detecting Aβ plaques (blue). (E) The number of ChAT-positive cells was counted and expressed as cell number per area (/mm2). Scale bar, 100μm. n = 4 /group. ns, not significant.
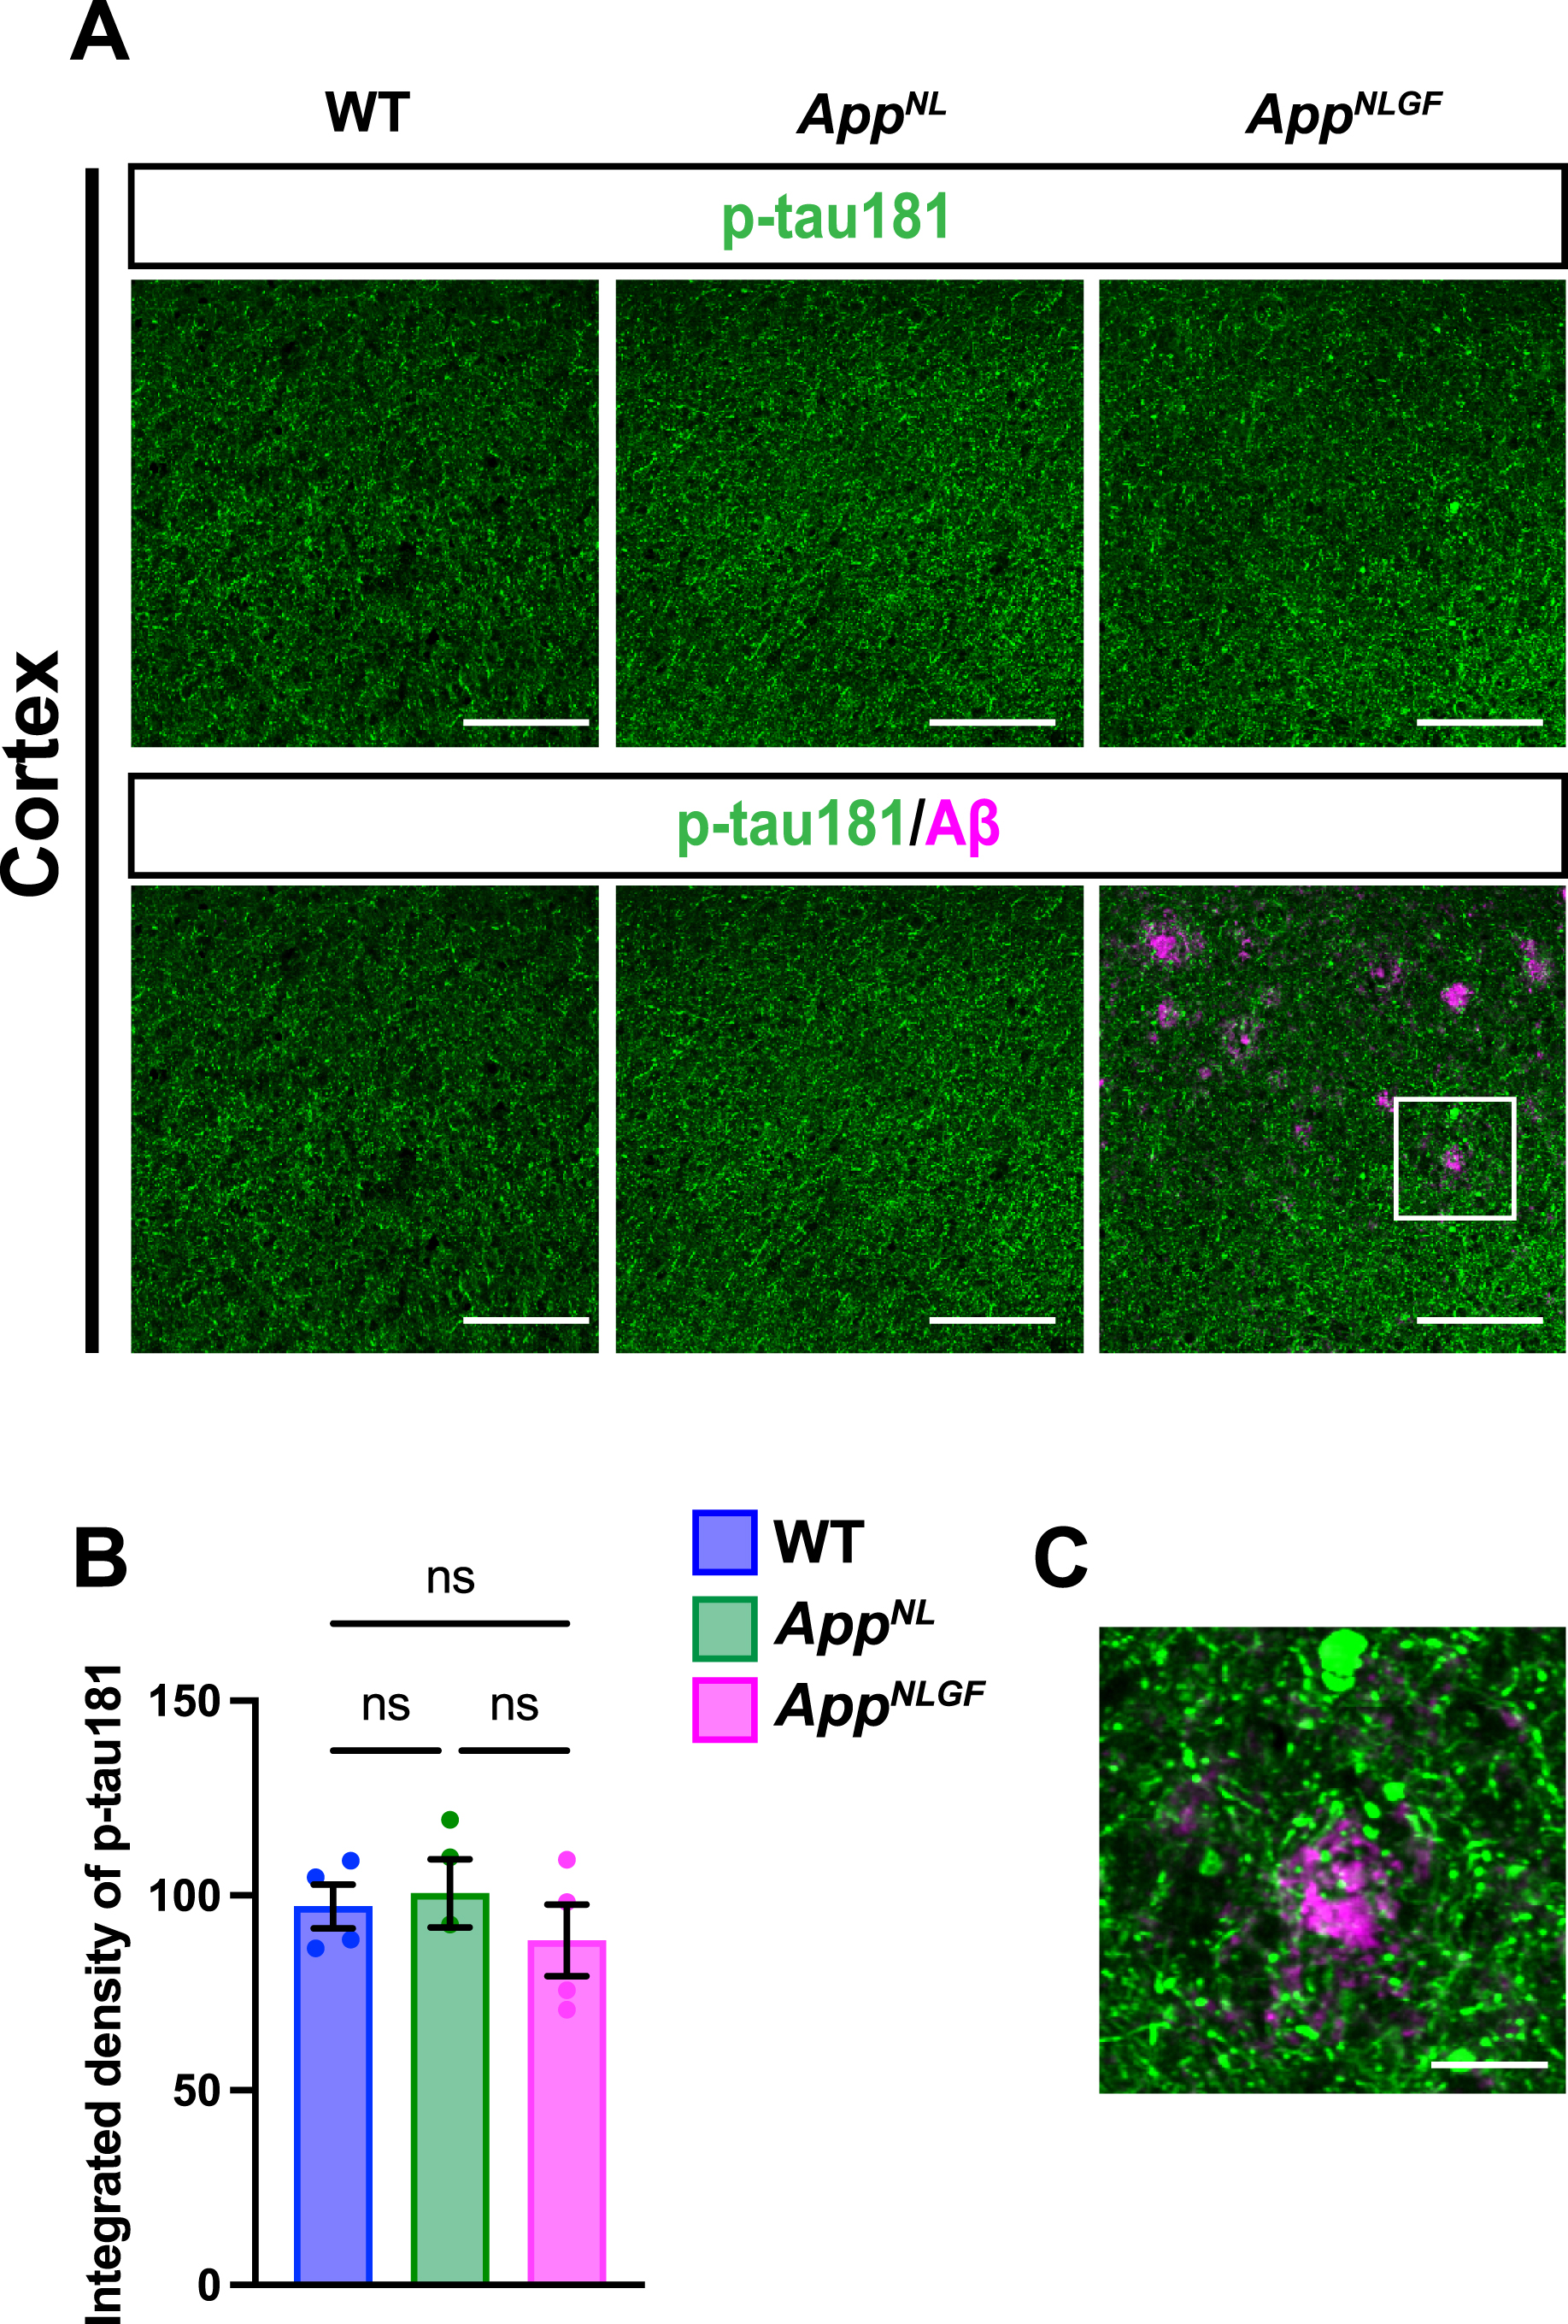
We next stained brain sections with an antibody against p-tau181, and the signal intensity was quantified (Fig. 3A, B). Although p-tau181-positive axons showed axonal dystrophy around Aβ plaques (Fig. 3C, higher magnification of framed region in 3A), the density of p-tau181-positive axons was not significantly reduced in the cortex of AppNLGF mice compared to that in AppNL or WT mice (Fig. 3A, B).
Fig. 3
The density of p-tau181 signals is not significantly reduced in the cortex of AppNLGF mice. (A) Representative images of the cortex from frozen coronal brain sections immunostained with antibodies against p-tau181 (green) and Aβ (magenta). Scale bars, 100μm. (B) P-tau181 immunoreactivity was quantified and expressed as relative percentage to WT. n = 4 /group. ns; not significant. (C) A higher magnification of framed region indicated in A. Scale bars, 20μm.
Myelin sheaths of p-tau181-positive axons are disrupted in AppNLGF mice
As p-tau181 signals did not overlap with unmyelinated axons, we next examined whether p-tau181 signals are localized to myelinated axons. Brain sections from 24-month-old AppNLGF, AppNL, and WT mice were costained with antibodies against p-tau181 and myelin basic protein (MBP), a major component of myelin sheaths (Fig. 4A1–A5, B1–B4, and C1–C5). High-magnification images revealed that these signals overlapped well in the cortex of WT and AppNLGF mice (Fig. 4A5 and C5, white arrows). Further 3D reconstruction confirmed that p-tau181-positive axons were located close to MBP-positive myelin sheaths in the cortex of WT and AppNLGF mice (Supplementary Movie 3).
Fig. 4
Myelin sheaths of p-tau181-positive axons are disrupted in AppNLGF mice. Representative images of the cortex (A1– C3) and hippocampal CA1 subfield (D1– F3) from frozen coronal brain sections immunostained with antibodies against MBP (magenta) and p-tau181 (green). FSB was used for detecting Aβ plaques (blue). Scale bars, 100μm. (A4– C4) Higher magnification of framed regions indicated in A3– C3. Scale bars, 20μm. (A5 and C5) Higher magnification of framed regions indicated in A4 and C4. White arrows indicate p-tau181-positive axons overlapped with MBP-positive myelin sheaths. Scale bars, 2.5μm. (G) MBP immunoreactivity in the cortex or hippocampal CA1 subfield was quantified and expressed as positive area (%). n = 4 /group. *p < 0.05, ns, not significant.
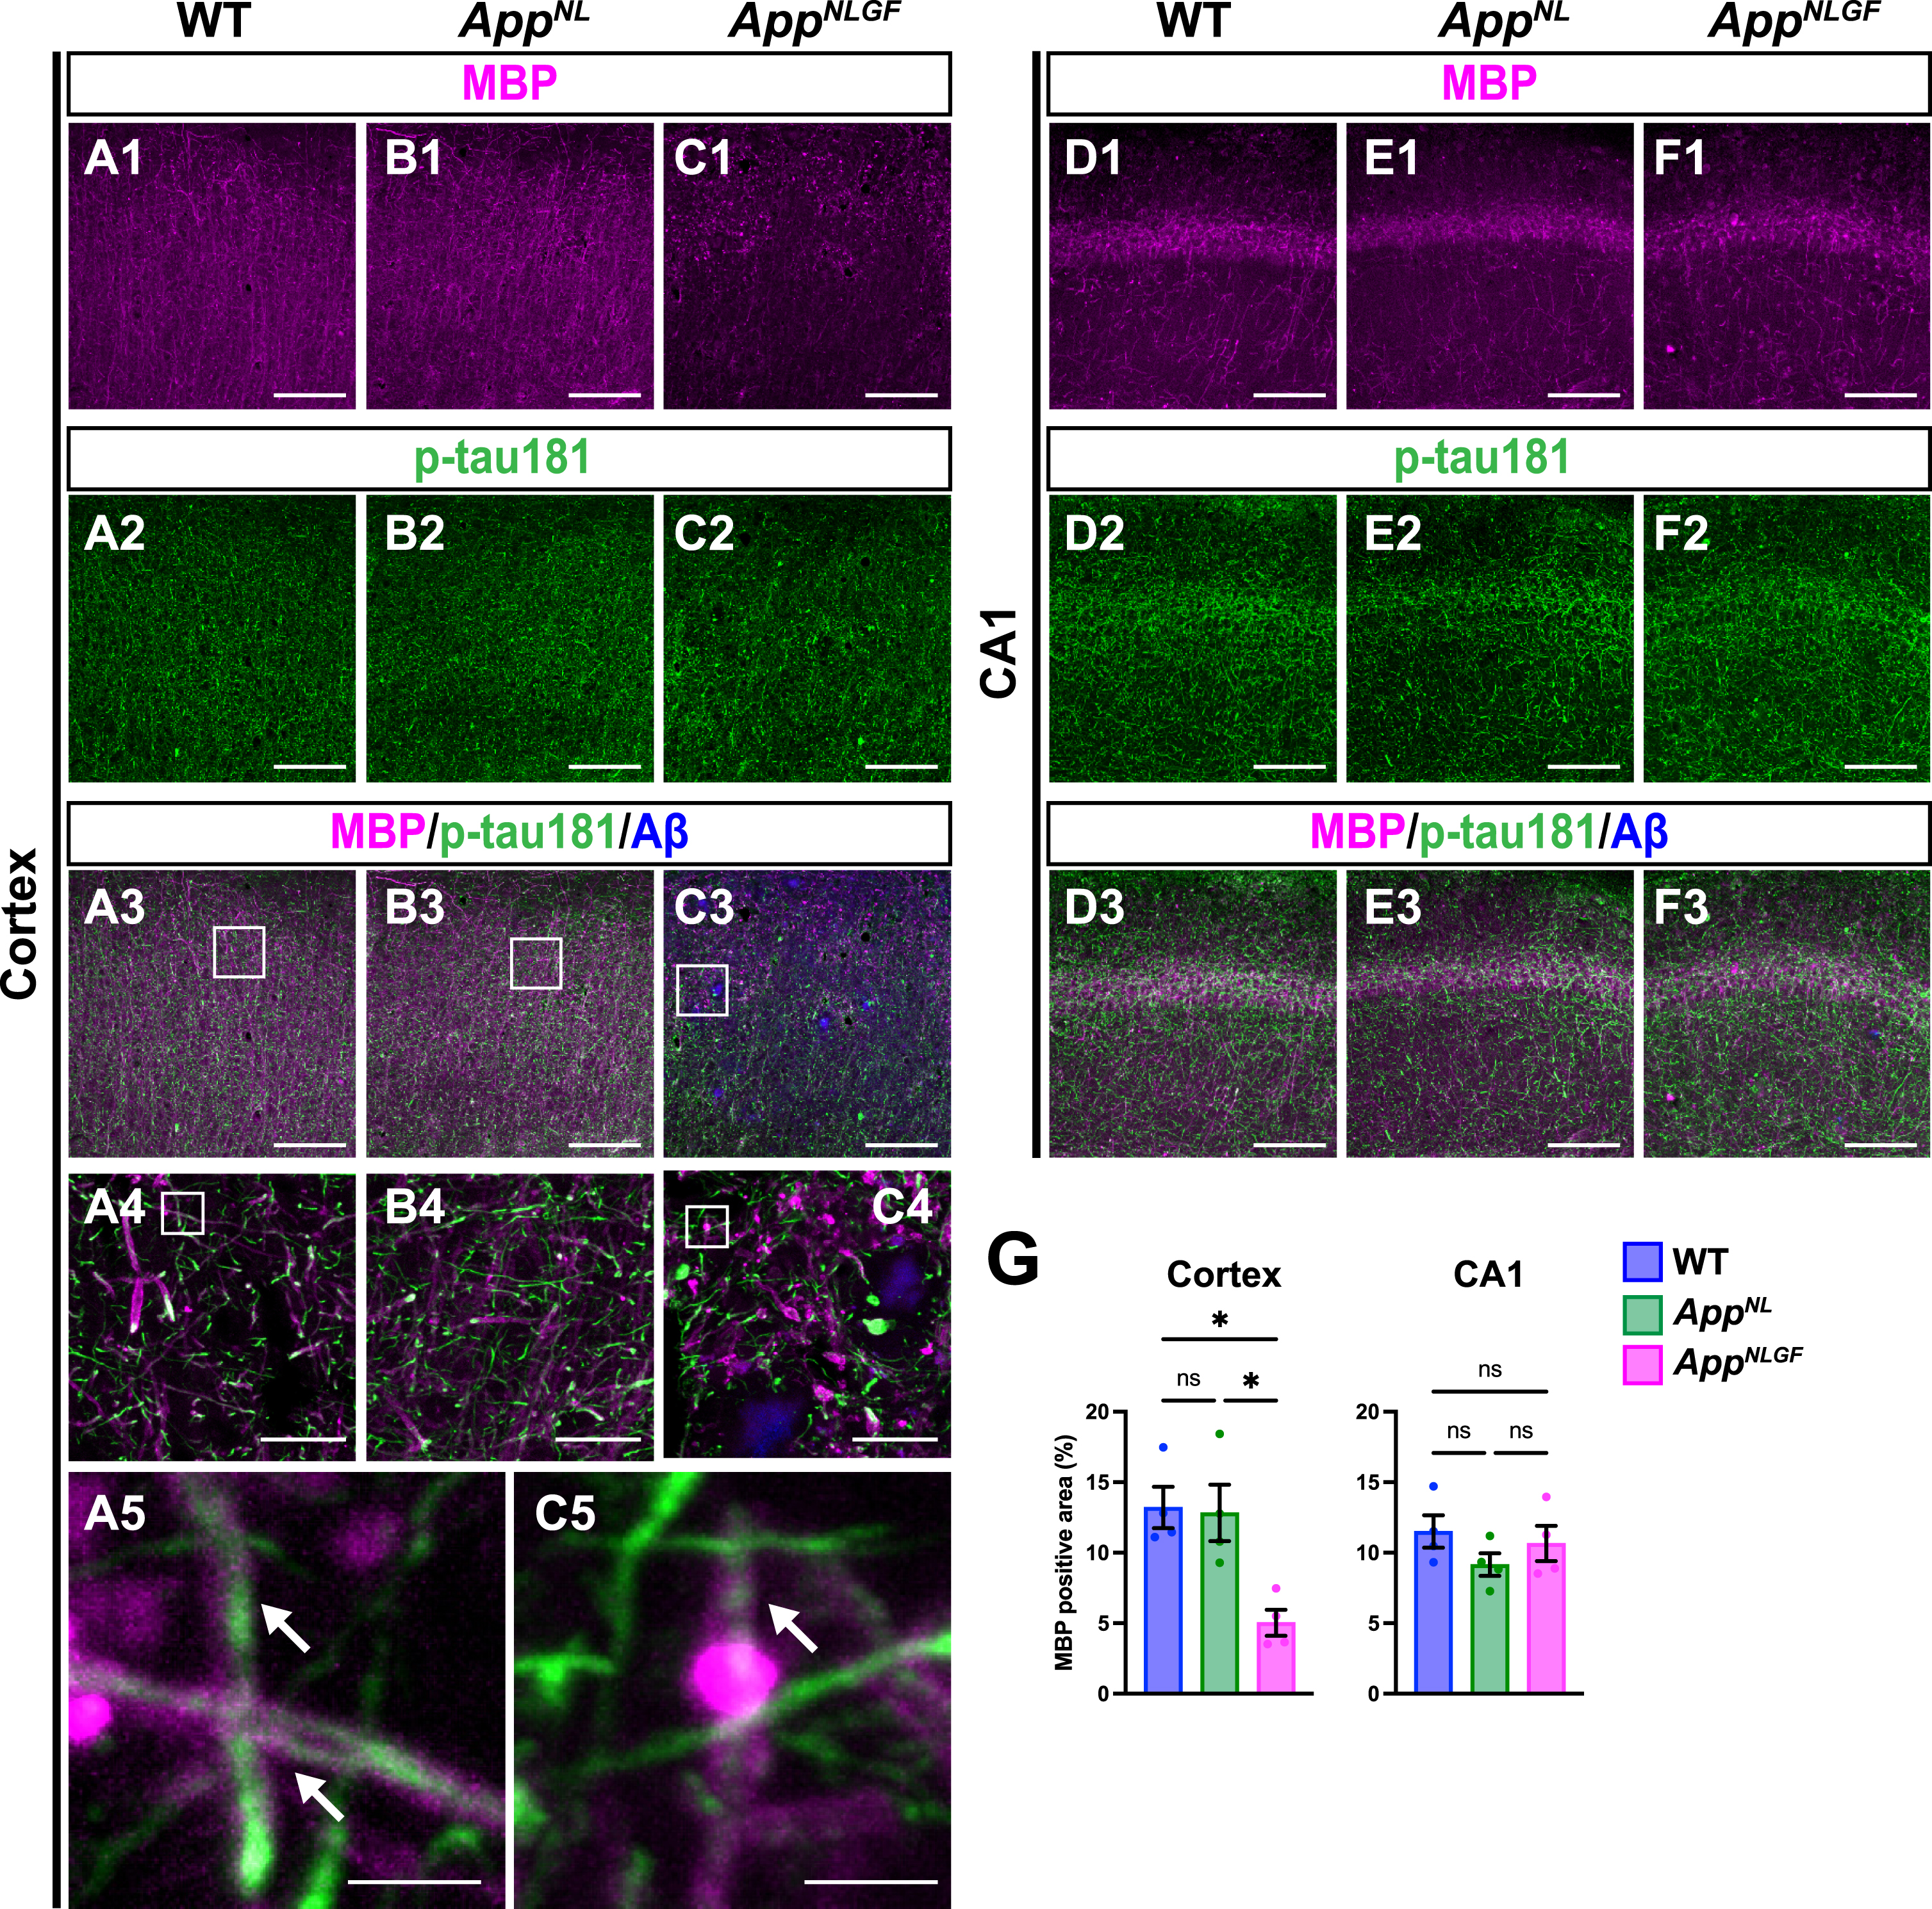
Of particular interest, coverage with MBP-positive myelin sheaths was significantly reduced in the cortex of AppNLGF mice compared to that in WT and AppNL mice (Fig. 4A1, B1, C1, and G). Myelin sheaths were disrupted in AppNLGF mice with massive Aβ pathology (Fig. 4C1), but not in AppNL mice (Fig. 4B1), which overproduce soluble Aβ but do not exhibit Aβ plaques, suggesting that the disruption of myelin sheaths was correlated with insoluble Aβ deposits. We also noticed that reductions in myelin sheaths were not limited to areas near Aβ plaques but also were evident in areas distant from Aβ plaques, suggesting that disruption of myelin sheaths was not only due to physical damages caused by Aβ plaques but also due to altered brain homeostasis induced by Aβ pathology, such as neuroinflammation. To ask whether the disruption of myelin sheaths is due to developmental defects, we stained brain sections from 6-month-old AppNLGF and WT mice with antibodies against MBP and p-tau181. Again, these two signals were well colocalized (Supplementary Figure 2A), however, unlike 24-month-old mice, MBP-positive myelin sheaths enwrapping p-tau181-positive axons were not significantly reduced in the brains of 6-month-old AppNLGF mice (Supplementary Figure 2B). These results indicate that disruption of myelin sheaths in 24-month-old AppNLGF mice is not due to developmental defects but is a progressive event in response to accumulation of Aβ pathology.
In contrast to the cortex, myelin sheaths were not significantly affected in the hippocampus of AppNLGF mice compared to that in WT and AppNL mice (Fig. 4D1, E1, F1, and G), which is presumably due to that Aβ pathology in the hippocampus is less severe than that in the cortex in AppNLGF mice as previously reported [38].
Taken together, these results indicate that p-tau181 signals are localized to cortical myelinated axons whose myelin sheaths are significantly disrupted by Aβ pathology.
p-tau181-positive axons do not overlap with glutamatergic axons in mouse brains
As axons of glutamatergic excitatory neurons and GABAergic interneurons are both highly myelinated by oligodendrocytes [44], we first examined whether p-tau181 signals overlapped with axons of glutamatergic neurons. Brain sections of the cortices of 24-month-old AppNLGF, AppNL, and WT mice were costained with antibodies against p-tau181 and the glutamatergic terminal marker vesicular glutamate transporter 1 (VGLUT1) (Fig. 5A1–A5, B1–B4, and C1–C5). High-magnification images revealed that these signals did not overlap (Fig. 5A5 and C5), and 3D reconstruction imaging confirmed this result (Supplementary Movie 4). We also analyzed the distribution pattern of VGLUT1 and p-tau181 signals in the CA1 subfield of the hippocampus and found that their staining patterns were dissimilar (Fig. 5D1–D3, E1–E3, and F1–F3). Consistent with previous reports [45–47], VGLUT1 signals were widely distributed through the synaptic laminae (stratum oriens and stratum radiatus) with low immunoreactivity in the somatic layers (stratum pyramidale) (Fig. 5D1, E1, and F1). By contrast, p-tau181-positive axons were distributed more densely in the somatic layers than in the synaptic laminae (Fig. 5D2, E2, and F2). Together, these results indicate that p-tau181-positive signals are not localized to glutamatergic axons in mouse brains.
Fig. 5
p-tau181-positive axons do not overlap with glutamatergic axons in mouse brains. Representative images of the cortex (A1– C3) and hippocampal CA1 subfield (D1– F3) from frozen coronal brain sections immunostained with antibodies against VGLUT1 (magenta) and p-tau181 (green). FSB was used for detecting Aβ plaques (blue). Scale bars, 100μm. (A4– C4) Higher magnification of framed regions indicated in A3– C3. Scale bars, 20μm. (A5 and C5) Higher magnification of framed regions indicated in A4 and C4. Scale bars, 2.5μm. (G) VGLUT1 immunoreactivity in the cortex or hippocampal CA1 subfield was quantified and expressed as relative percentage to WT. n = 4 /group. ns, not significant.
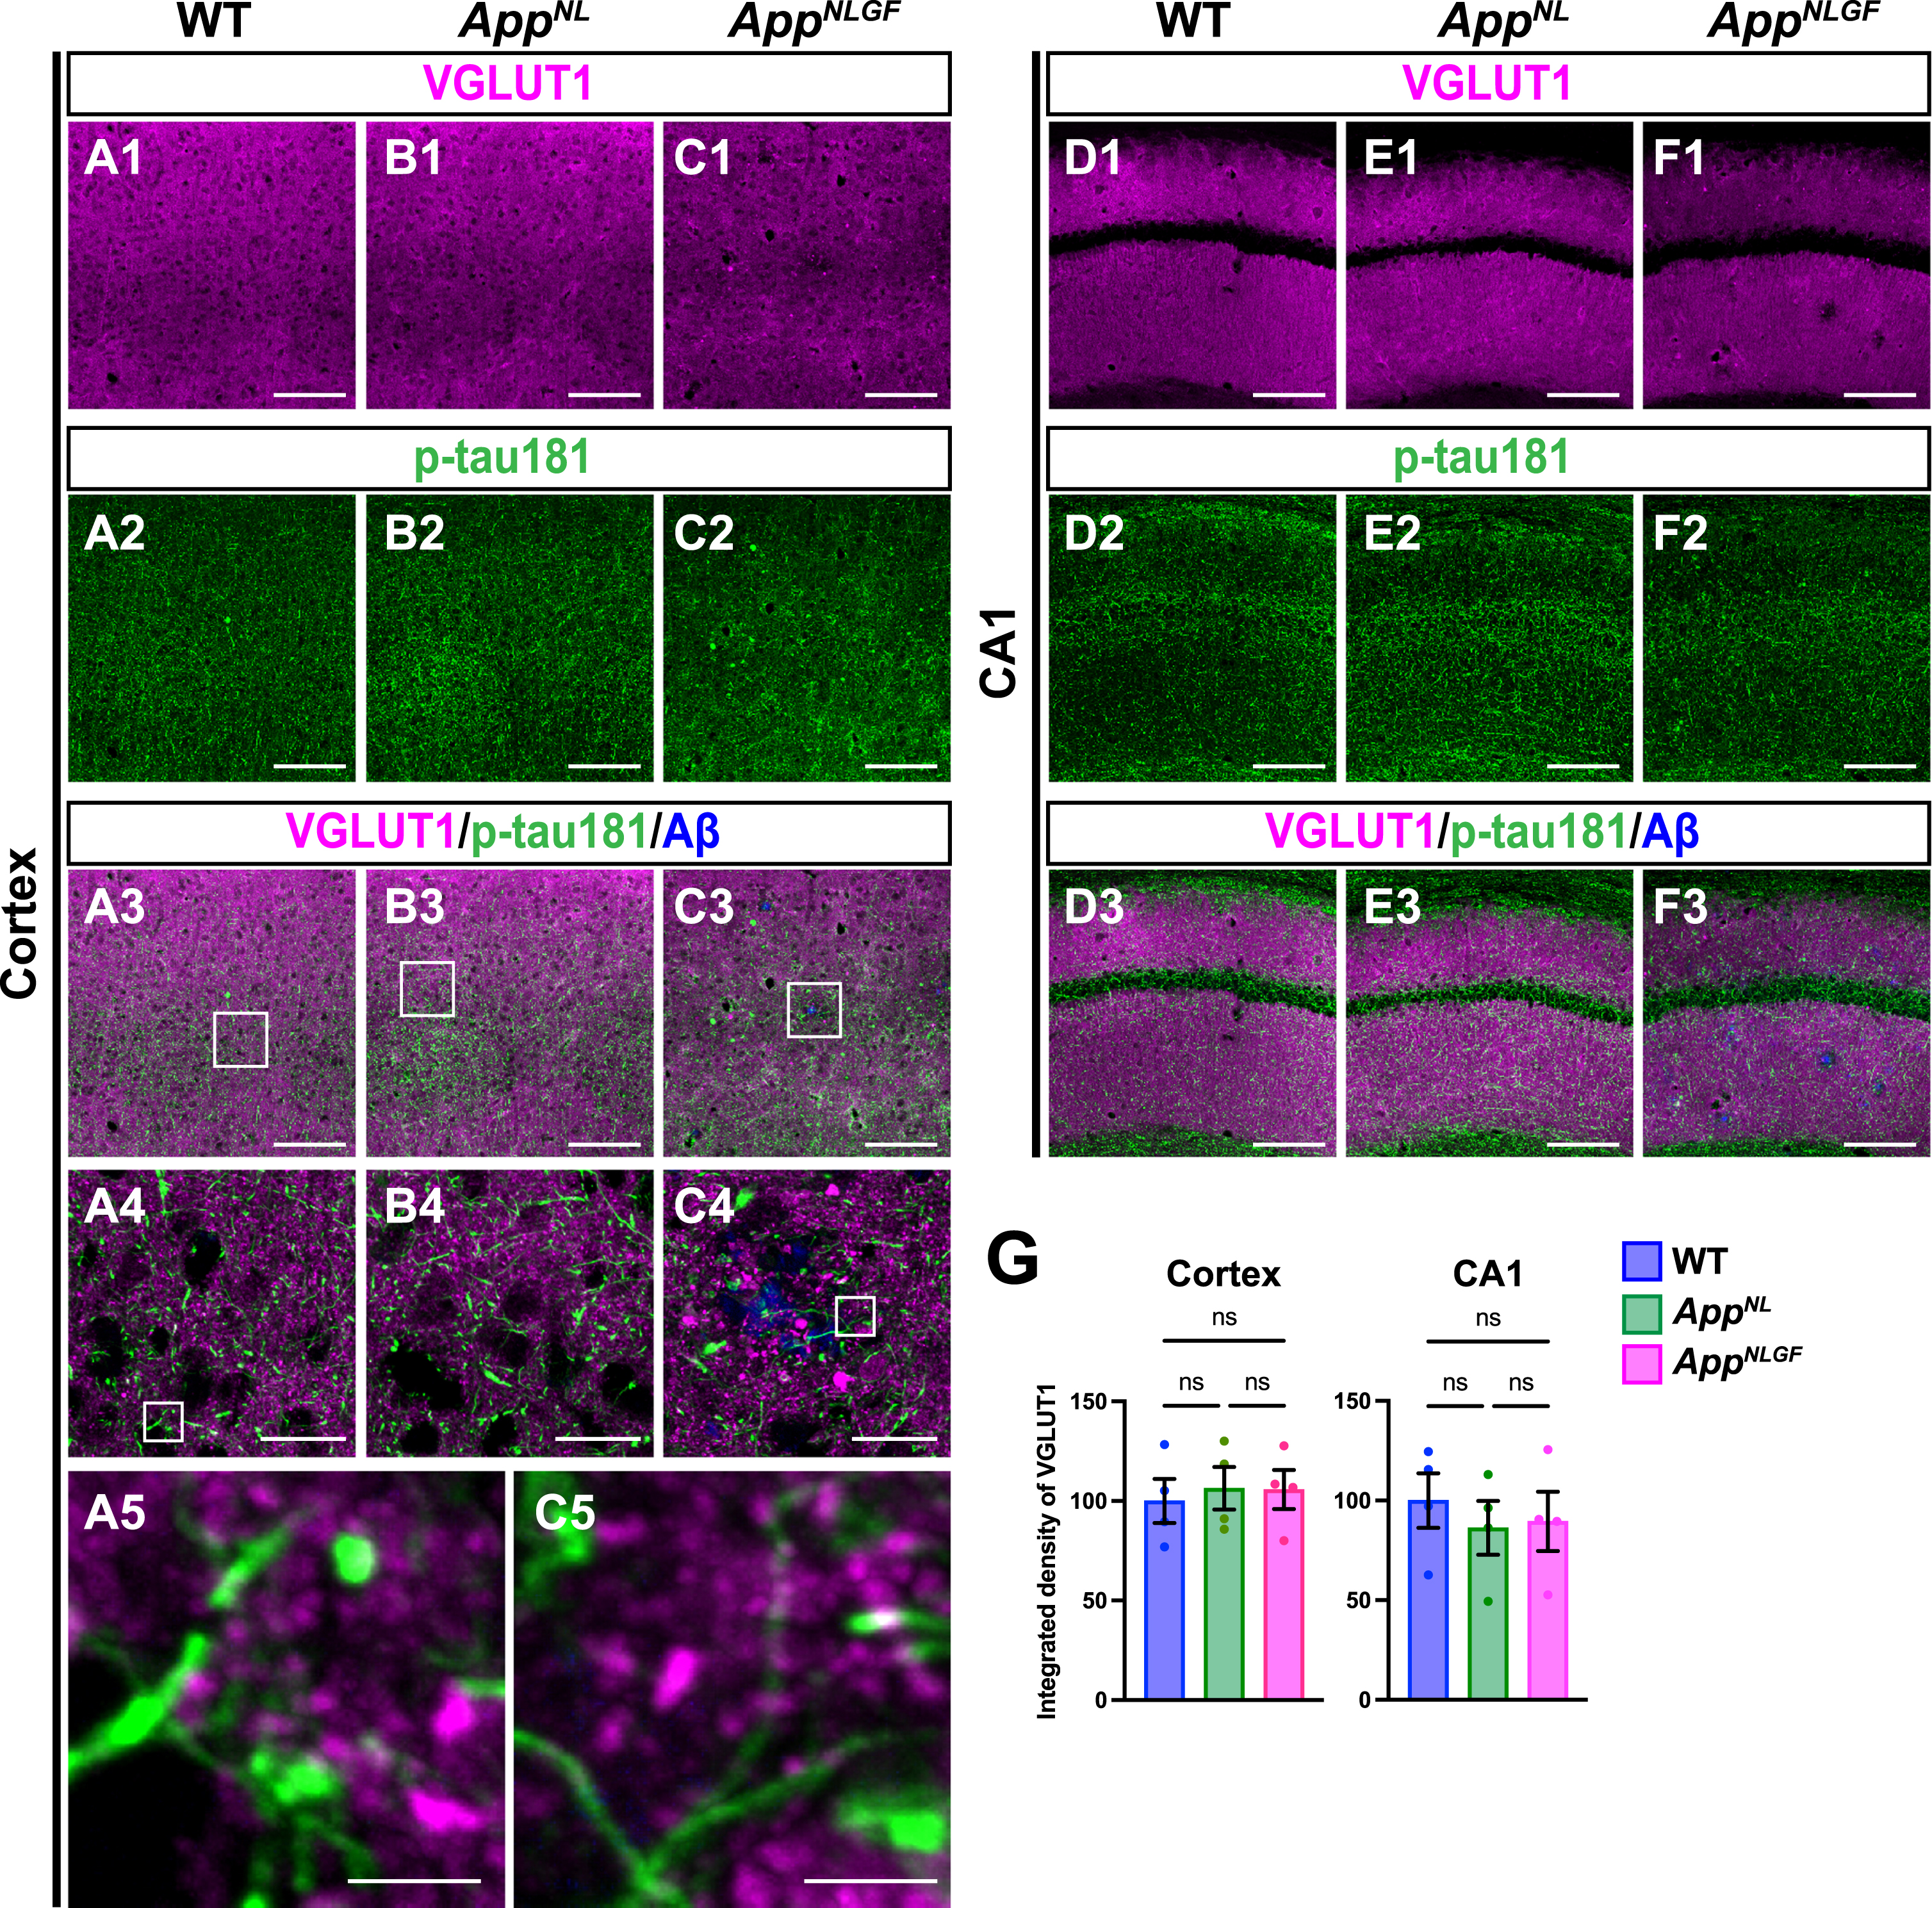
We also analyzed the density of glutamatergic axons in AppNLGF and control mice. Unlike unmyelinated cholinergic axons (Fig. 2A, B), the overall density of VGLUT1-positive axon terminals was not significantly reduced in the cortex or hippocampus in AppNLGF mice compared to those in WT or AppNL mice (Fig. 5G).
p-tau181-positive axons overlap with GABAergic axons in mouse brains
We next examined whether p-tau181-positive axons overlap with GABAergic interneurons. Brain sections of the cortices of 24-month-old AppNLGF, AppNL, and WT mice were costained with antibodies against p-tau181 and the GABAergic terminal marker vesicular GABA transporter (VGAT) (Fig. 6A1–A5, B1–B4, and C1–C5). High-magnification images revealed that these two signals strongly overlapped in the cortex (Fig. 6A5 and C5, white arrows), and 3D reconstruction imaging confirmed this result (Supplementary Movie 5). We also analyzed the overlap between VGAT and p-tau181 signals in the CA1 subfield of the hippocampus in AppNLGF, AppNL, and WT mice. The distribution pattern of VGAT-positive axon terminals was similar to that of p-tau181-positive axons (Fig. 6D1–D5, E1–E4, and F1–F5). Both VGAT-positive axons (Fig. 6D1, E1, and F1) and p-tau181-positive axons (Fig. 6D2, E2, and F2) were evident in the somatic layers (stratum pyramidale) with less immunoreactivity in the synaptic laminae (stratum oriens and stratum radiatus). High-magnification imaging (Fig. 6D5 and F5, white arrows) and 3D reconstruction (Supplementary Movie 6) demonstrated clear colocalization of VGAT and p-tau181 signals. These results indicate that p-tau181 signals are localized to GABAergic axons in mouse brains.
Fig. 6
p-tau181-positive axons overlap with GABAergic axons in mouse brains. Representative images of the cortex (A1– C3) and hippocampal CA1 subfield (D1– F3) from frozen coronal brain sections immunostained with antibodies against VGAT (magenta) and p-tau181 (green). FSB was used for detecting Aβ plaques (blue). Scale bars, 100μm. (A4– C4 and D4– F4) Higher magnification of framed regions indicated in A3– C3 and D3– F3, respectively. Scale bars, 20μm. (A5, C5, D5, F5) Higher magnification of framed regions indicated in A4, C4, D4, and F4, respectively. White arrows indicate colocalization of VGAT and p-tau181 signals. Scale bars, 2.5μm. (G) VGAT immunoreactivity in the cortex or hippocampal CA1 subfield was quantified and expressed as relative percentage to WT. n = 4 /group. **p < 0.01, ***p < 0.001, ns, not significant.
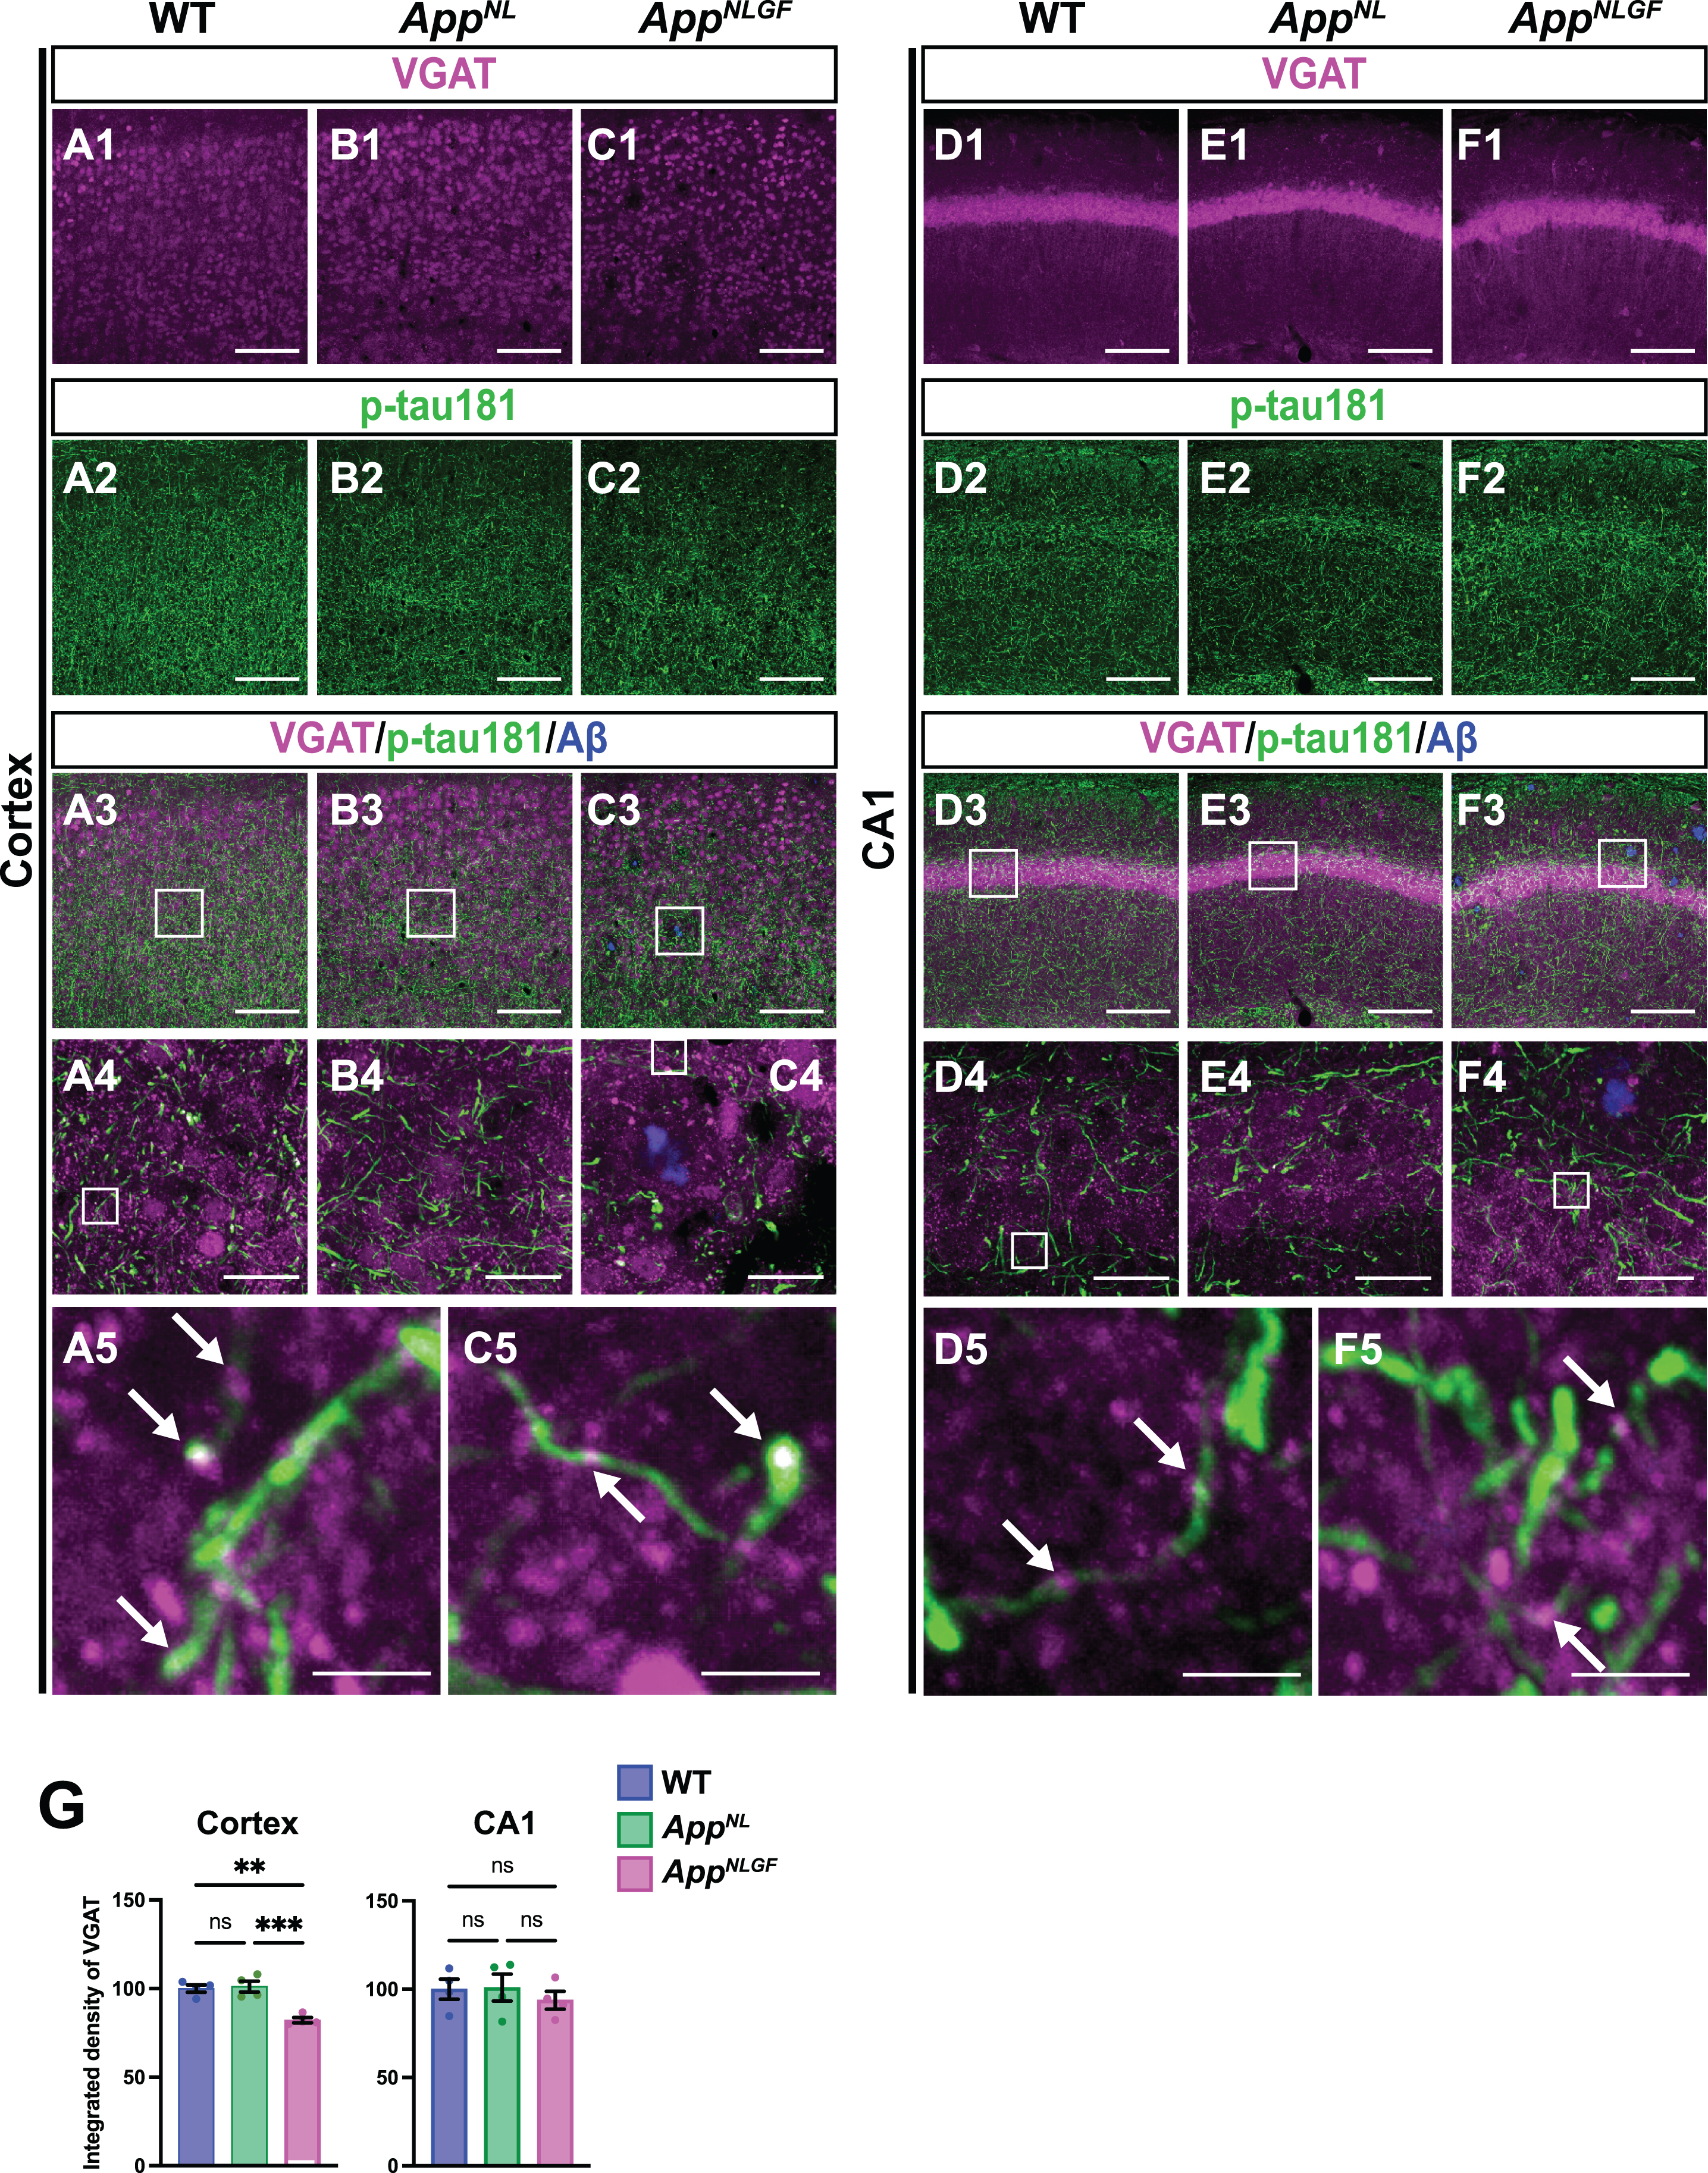
We also analyzed the density of GABAergic axons in AppNLGF, AppNL, and WT mice. Compared to those in WT or AppNL mice, the overall density of VGAT-positive axon terminals was significantly reduced in the cortex but not in the hippocampus of AppNLGF mice (Fig. 6G). Unlike in the cortex, the immunoreactivity of MBP in the hippocampus was not significantly reduced in AppNLGF mice (Fig. 4D1, E1, F1, and G), so that GABAergic axons might be injured in the cortex, but not in the hippocampus.
Taken altogether, these results suggest that axons of GABAergic interneurons may be more affected than those from glutamatergic excitatory neurons in the brains with Aβ pathology.
p-tau181-positive axons overlap with parvalbumin-expressing axons in mouse brains
To further validate the above results, we examined whether p-tau181-positive axons overlap with axons of parvalbumin-expressing interneurons, which comprise nearly half of the interneuron population in the cortex [48, 49]. Brain sections of the cortices of 24-month-old AppNLGF, AppNL, and WT mice were costained with antibodies against p-tau181, parvalbumin and MBP (Fig. 7A1–A6, B1–B5, and C1–C6). High-magnification images revealed that these three signals strongly overlapped in the cortex (Fig. 7A6 and C6, white arrows), and 3D reconstruction imaging confirmed this result (Supplementary Movie 7).
Fig. 7
p-tau181-positive axons overlap with parvalbumin-expressing axons in mouse brains. (A1– C4) Representative images of the cortex from frozen coronal brain sections immunostained with antibodies against parvalbumin (magenta), p-tau181 (green), and MBP (cyan). FSB was used for detecting Aβ plaques (blue). Scale bars, 100μm. (A5– C5) Higher magnification of framed regions indicated in A4– C4. Scale bars, 20μm. (A6, C6) Higher magnification of framed regions indicated in A5 and C5. White arrows indicate MBP signals enwrapped with the p-tau181-positive axons of parvalbumin-expressing interneurons. Scale bars, 2.5μm.
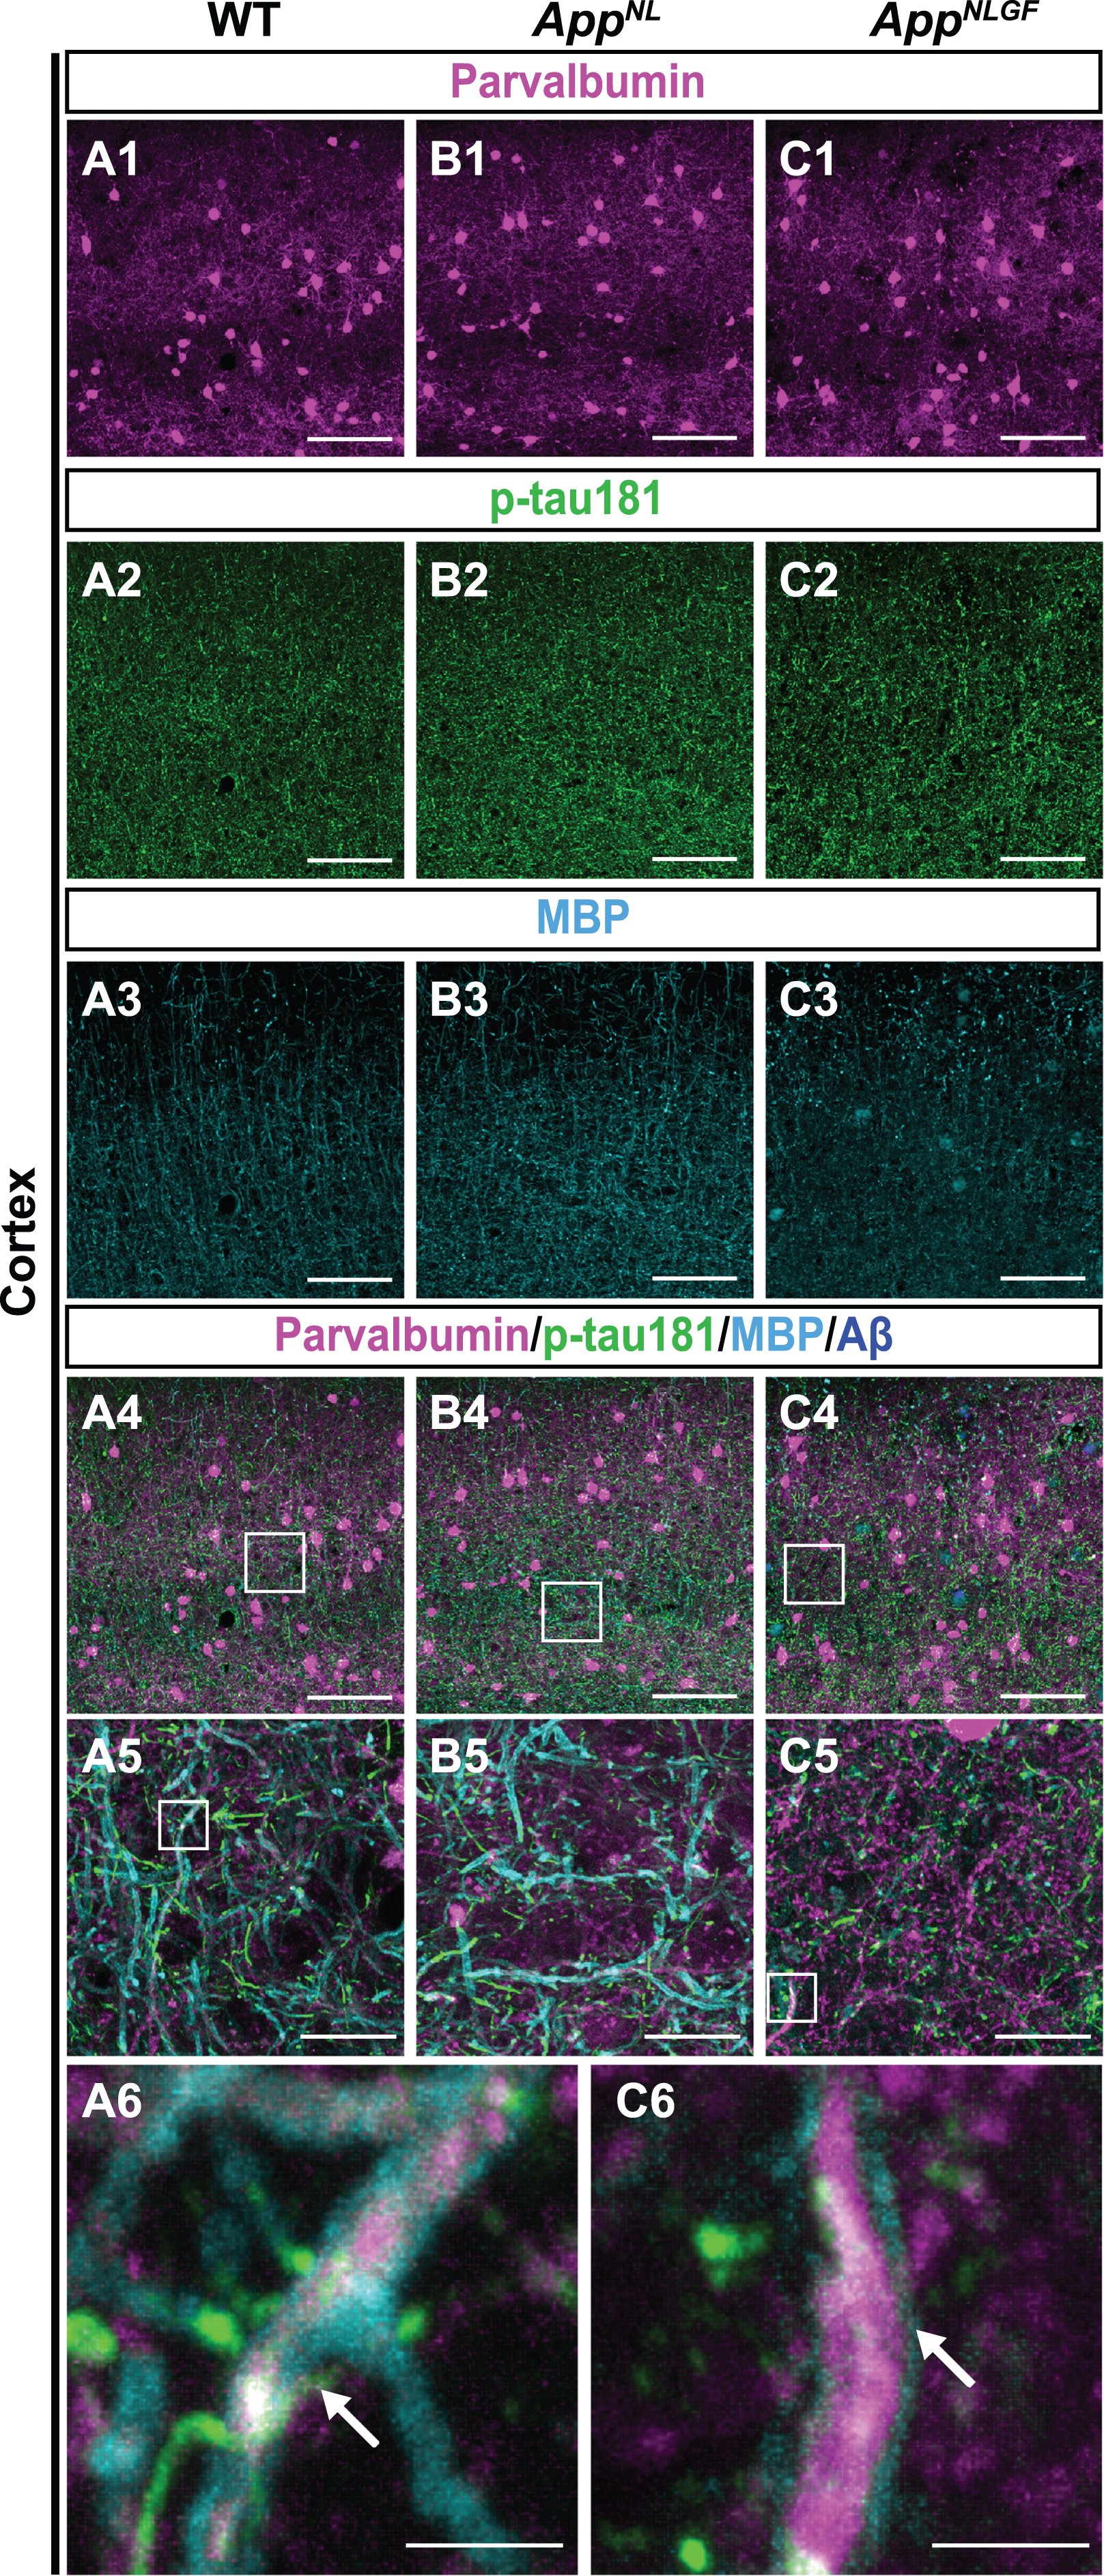
Taken together, these results indicate that p-tau181-positive signals are localized to parvalbumin-expressing GABAergic interneurons in mouse brains, and that the myelin sheaths of these interneurons are significantly disrupted in the AppNLGF mouse model of Aβ pathology.
DISCUSSION
p-tau181 in CSF is an established biomarker for AD [6, 50, 51], and recent studies demonstrate that increased levels of p-tau181 in plasma as well as CSF correlate with Aβ pathology in the preclinical and early stages of AD [1, 2]. Using AppNLGF mice, which represent a model of Aβ pathology, we previously reported that p-tau181 localizes to axons and may reflect axonal abnormalities caused by Aβ accumulation [10]. However, whether these p-tau181-positive axons originate from specific neuronal subtype(s) remains elusive. In this study, we demonstrated that p-tau181 signals colocalized with myelinated, parvalbumin-expressing, GABAergic interneurons (Fig. 7) but not with cholinergic, noradrenergic, or glutamatergic neurons (Figs. 1 and 5). Moreover, their myelin sheaths were significantly disrupted upon Aβ accumulation (Fig. 4), suggesting that increased p-tau181 levels in fluids may reflect demyelinated axons of parvalbumin-expressing GABAergic interneurons under Aβ pathology.
Excitatory-inhibitory imbalance may cause abnormal network activity and influence neuronal oscillations important for cognitive functions in early AD [52–54]. Neurophysiological studies in humans have shown that neuronal hyperactivity is associated with amyloid-PET positivity [55], suggesting that aberrant excitatory responses are induced by Aβ accumulation [56]. Several studies indicate that functional impairments of inhibitory GABAergic interneurons, especially fast-spiking parvalbumin-expressing neurons, underlie network hyperactivity in early AD [57] as inhibitory interneurons play critical roles in synchronizing neuronal activity and generating neuronal oscillations [58, 59]. Of particular interest, studies using resting-state magnetoencephalography and electroencephalography showed that lower Aβ42 levels and higher p-tau181 levels in CSF were associated with cortical network disruption in early AD [60, 61]. Our data demonstrate that p-tau181 is associated with axonal abnormalities in parvalbumin-expressing GABAergic interneurons in Aβ pathology in mouse brains (Fig. 7). This suggests links among p-tau181, impaired inhibitory neurotransmission, and Aβ pathology in early AD.
Evidence from neuroimaging studies demonstrates that Aβ pathology correlates well with myelin damage in the early stage of AD [62, 63]. A previous study has reported a relationship between myelin water fraction (MWF), a surrogate of myelin content, and p-tau181/Aβ42 ratio in the CSF from preclinical AD patients, in which higher levels of p-tau181/Aβ42 resulted in an increased decline in MWF with age [63]. Also, elevated plasma p-tau181 has been associated with lower axonal density quantified by MWF in the occipital lobe [64]. These reports suggest that increased levels of fluid p-tau181 correlate with reduced myelin content in human brains.
Single-cell transcriptomic analyses have also revealed that oligodendrocytes show AD pathology-responsive transcriptional signatures, suggesting that disruption of myelination plays a key role in AD pathogenesis [65]. A recent study demonstrated that myelin on parvalbumin-expressing inhibitory interneurons is critical for feedforward inhibition of cortical circuits [66], and that myelin loss reduces the number of presynaptic terminals from these interneurons and alters neural oscillations [67]. Interestingly, a large fraction of the myelin present in the cortex enwraps mainly the axons of parvalbumin-expressing GABAergic interneurons in mouse brains [44, 68, 69]. Our results showed that myelin sheaths are significantly disrupted (Fig. 4), and that, interestingly, axons of GABAergic interneurons (Fig. 6), but not of glutamatergic neurons (Fig. 5), are significantly reduced in the cortex of AppNLGF mice. These results suggest that GABAergic interneurons are more vulnerable in early AD due to myelin disruption caused by Aβ pathology. A preclinical study using a mouse model of AD showed that enhancing myelination reversed cognitive impairment [70]. This suggests that myelin repair may be a therapeutic approach to prevent inhibitory dysfunction in early AD [71], and that p-tau181 may be a useful biomarker to monitor therapeutic efficacy.
Another interesting finding from this study is that p-tau181 signals colocalize well with axons of myelinated interneurons (Fig. 6) but not those of unmyelinated cholinergic or noradrenergic neurons (Fig. 1). We recently reported that signals of p-tau217 and p-tau231, other fluid biomarkers for Aβ pathology in the preclinical stage of AD, colocalized with the postsynaptic marker of myelinated glutamatergic neurons but not of unmyelinated cholinergic or noradrenergic neurons [10]. These results suggest that currently used p-tau biomarkers may reflect synaptic and axonal abnormalities of myelinated neurons but not of unmyelinated neurons. Dysfunction and degeneration of unmyelinated cholinergic and monoaminergic neurons are associated with cognitive decline and psychological symptoms in the early stage of AD [72–75] and have been important therapeutic targets to improve clinical symptoms [11, 76, 77]. Thus, developing biomarkers that reflect abnormalities in unmyelinated subcortical neurons will be important for AD diagnosis and drug development.
This study has several limitations. For example, this study did not address whether p-tau181 was released from demyelinated axons of parvalbumin-positive GABAergic interneurons into the CSF or plasma in mouse models. Further study is required to investigate the correlation among p-tau181 levels in the CSF/plasma/interstitial fluid, Aβ pathology and disruption of myelinated structures of parvalbumin-positive GABAergic axons in the brains of AppNLGF mice. Another limitation is that this study focused on the analysis of p-tau181 localization in mouse brains. In human brain, six tau isoforms with three or four microtubule-binding domain repeats (3R or 4R tau, respectively) are expressed [78], whereas only three tau isoforms with 4R tau are expressed in mouse brain [79–81]. In addition, although the primary structures of human and mouse tau proteins are highly conserved, they differ in several amino acids. These differences might influence tau aggregation, phosphorylation profile, and metabolism in neurons. Thus, key findings from this study must be validated in human brains in the preclinical stage of AD in future studies.
In conclusion, this study demonstrates that AD-related p-tau181 is localized to myelinated axons of parvalbumin-expressing GABAergic interneurons in mouse brains. This study also suggests that increased p-tau181 levels in the CSF and plasma may reflect loss of myelin sheaths and dysfunction of GABAergic interneurons upon Aβ accumulation. This is thought to underlie cognitive deficits in the preclinical and early stages of AD.
ACKNOWLEDGMENTS
We thank Dr. Takaomi Saido at RIKEN Center for Brain Science and Dr. Takashi Saito at Nagoya City University for providing App knock-in mice.
FUNDING
This study was supported by the Research Funding for Longevity Science from National Center for Geriatrics and Gerontology, Japan, Grant No. 21-13 to KMI and MS, JSPS KAKENHI Grant No. JP20H03571 to KMI, No. JP22H02963 to MS, No. JP21K17655 to YS and No. JP21J00767 to YH.
CONFLICT OF INTEREST
The authors have no conflict of interest to report.
DATA AVAILABILITY
All data generated or analyzed during this study are included in this published article.
SUPPLEMENTARY MATERIAL
[1] The supplementary material is available in the electronic version of this article: https://dx.doi.org/10.3233/JAD-230121.
REFERENCES
[1] | Mattsson-Carlgren N , Andersson E , Janelidze S , Ossenkoppele R , Insel P , Strandberg O , Zetterberg H , Rosen HJ , Rabinovici G , Chai X , Blennow K , Dage JL , Stomrud E , Smith R , Palmqvist S , Hansson O ((2020) ) Abeta deposition is associated with increases in soluble and phosphorylated tau that precede a positive Tau PET in Alzheimer’s disease. Sci Adv 6: , eaaz2387. |
[2] | Barthelemy NR , Bateman RJ , Hirtz C , Marin P , Becher F , Sato C , Gabelle A , Lehmann S ((2020) ) Cerebrospinal fluid phospho-tau T217 outperforms T181 as a biomarker for the differential diagnosis of Alzheimer’s disease and PET amyloid-positive patient identification. Alzheimers Res Ther 12: , 26. |
[3] | Palmqvist S , Janelidze S , Quiroz YT , Zetterberg H , Lopera F , Stomrud E , Su Y , Chen Y , Serrano GE , Leuzy A , Mattsson-Carlgren N , Strandberg O , Smith R , Villegas A , Sepulveda-Falla D , Chai X , Proctor NK , Beach TG , Blennow K , Dage JL , Reiman EM , Hansson O ((2020) ) Discriminative accuracy of plasma phospho-tau217 for Alzheimer disease vs other neurodegenerative disorders. JAMA 324: , 772–781. |
[4] | Thijssen EH , La Joie R , Strom A , Fonseca C , Iaccarino L , Wolf A , Spina S , Allen IE , Cobigo Y , Heuer H , VandeVrede L , Proctor NK , Lago AL , Baker S , Sivasankaran R , Kieloch A , Kinhikar A , Yu L , Valentin MA , Jeromin A , Zetterberg H , Hansson O , Mattsson-Carlgren N , Graham D , Blennow K , Kramer JH , Grinberg LT , Seeley WW , Rosen H , Boeve BF , Miller BL , Teunissen CE , Rabinovici GD , Rojas JC , Dage JL , Boxer AL , Advancing Research and Treatment for Frontotemporal Lobar Degeneration investigators ((2021) ) Plasma phosphorylated tau 217 and phosphorylated tau 181 as biomarkers in Alzheimer’s disease and frontotemporal lobar degeneration: A retrospective diagnostic performance study. Lancet Neurol 20: , 739–752. |
[5] | Suarez-Calvet M , Karikari TK , Ashton NJ , Lantero Rodriguez J , Mila-Aloma M , Gispert JD , Salvado G , Minguillon C , Fauria K , Shekari M , Grau-Rivera O , Arenaza-Urquijo EM , Sala-Vila A , Sanchez-Benavides G , Gonzalez-de-Echavarri JM , Kollmorgen G , Stoops E , Vanmechelen E , Zetterberg H , Blennow K , Molinuevo JL , Study A ((2020) ) Novel tau biomarkers phosphorylated at T181, T217 or T231 rise in the initial stages of the preclinical Alzheimer’s continuum when only subtle changes in Abeta pathology are detected, EMBO Mol Med 12: , e12921. |
[6] | Karikari TK , Pascoal TA , Ashton NJ , Janelidze S , Benedet AL , Rodriguez JL , Chamoun M , Savard M , Kang MS , Therriault J , Scholl M , Massarweh G , Soucy JP , Hoglund K , Brinkmalm G , Mattsson N , Palmqvist S , Gauthier S , Stomrud E , Zetterberg H , Hansson O , Rosa-Neto P , Blennow K ((2020) ) Blood phosphorylated tau 181 as a biomarker for Alzheimer’s disease: A diagnostic performance and prediction modelling study using data from four prospective cohorts. Lancet Neurol 19: , 422–433. |
[7] | Hanes J , Kovac A , Kvartsberg H , Kontsekova E , Fialova L , Katina S , Kovacech B , Stevens E , Hort J , Vyhnalek M , Boonkamp L , Novak M , Zetterberg H , Hansson O , Scheltens P , Blennow K , Teunissen CE , Zilka N ((2020) ) Evaluation of a novel immunoassay to detect p-tau Thr217 in the CSF to distinguish Alzheimer disease from other dementias, Neurology 95: , e3026–e3035. |
[8] | Ashton NJ , Pascoal TA , Karikari TK , Benedet AL , Lantero-Rodriguez J , Brinkmalm G , Snellman A , Scholl M , Troakes C , Hye A , Gauthier S , Vanmechelen E , Zetterberg H , Rosa-Neto P , Blennow K ((2021) ) Plasma p-tau231: A new biomarker for incipient Alzheimer’s disease pathology. Acta Neuropathol 141: , 709–724. |
[9] | Kaeser SA , Hasler LM , Lambert M , Bergmann C , Bottelbergs A , Theunis C , Mercken M , Jucker M ((2022) ) CSF p-tau increase in response to Abeta-type and Danish-type cerebral amyloidosis and in the absence of neurofibrillary tangles. Acta Neuropathol 143: , 287–290. |
[10] | Hirota Y , Sakakibara Y , Ibaraki K , Takei K , Iijima KM , Sekiya M ((2022) ) Distinct brain pathologies associated with Alzheimer’s disease biomarker-related phospho-tau 181 and phospho-tau 217 in App knock-in mouse models of amyloid-beta amyloidosis, Brain Commun 4: , fcac286. |
[11] | Hampel H , Mesulam MM , Cuello AC , Farlow MR , Giacobini E , Grossberg GT , Khachaturian AS , Vergallo A , Cavedo E , Snyder PJ , Khachaturian ZS ((2018) ) The cholinergic system in the pathophysiology and treatment of Alzheimer’s disease. Brain 141: , 1917–1933. |
[12] | Martinez JL , Zammit MD , West NR , Christian BT , Bhattacharyya A ((2021) ) Basal forebrain cholinergic neurons: Linking Down syndrome and Alzheimer’s disease. Front Aging Neurosci 13: , 703876. |
[13] | Joe E , Ringman JM ((2019) ) Cognitive symptoms of Alzheimer’s disease: Clinical management and prevention, BMJ 367: , l6217. |
[14] | Richter N , Beckers N , Onur OA , Dietlein M , Tittgemeyer M , Kracht L , Neumaier B , Fink GR , Kukolja J ((2018) ) Effect of cholinergic treatment depends on cholinergic integrity in early Alzheimer’s disease. Brain 141: , 903–915. |
[15] | Schliebs R , Arendt T ((2011) ) The cholinergic system in aging and neuronal degeneration. Behav Brain Res 221: , 555–563. |
[16] | Vana L , Kanaan NM , Ugwu IC , Wuu J , Mufson EJ , Binder LI ((2011) ) Progression of tau pathology in cholinergic Basal forebrain neurons in mild cognitive impairment and Alzheimer’s disease. Am J Pathol 179: , 2533–2550. |
[17] | Grothe M , Heinsen H , Teipel SJ ((2012) ) Atrophy of the cholinergic Basal forebrain over the adult age range and in early stages of Alzheimer’s disease. Biol Psychiatry 71: , 805–813. |
[18] | Arendt T , Bruckner MK , Morawski M , Jager C , Gertz HJ ((2015) ) Early neurone loss in Alzheimer’s disease: Cortical or subcortical? Acta Neuropathol Commun 3: , 10. |
[19] | Mesulam MM ((2013) ) Cholinergic circuitry of the human nucleus basalis and its fate in Alzheimer’s disease. J Comp Neurol 521: , 4124–4144. |
[20] | Sassin I , Schultz C , Thal DR , Rub U , Arai K , Braak E , Braak H ((2000) ) Evolution of Alzheimer’s disease-related cytoskeletal changes in the basal nucleus of Meynert. Acta Neuropathol 100: , 259–269. |
[21] | Feinstein DL , Kalinin S , Braun D ((2016) ) Causes, consequences, and cures for neuroinflammation mediated via the locus coeruleus: Noradrenergic signaling system, J Neurochem 139: (Suppl 2), 154–178. |
[22] | Poe GR , Foote S , Eschenko O , Johansen JP , Bouret S , Aston-Jones G , Harley CW , Manahan-Vaughan D , Weinshenker D , Valentino R , Berridge C , Chandler DJ , Waterhouse B , Sara SJ ((2020) ) Locus coeruleus: A new look at the blue spot. Nat Rev Neurosci 21: , 644–659. |
[23] | Sara SJ ((2009) ) The locus coeruleus and noradrenergic modulation of cognition. Nat Rev Neurosci 10: , 211–223. |
[24] | Theofilas P , Dunlop S , Heinsen H , Grinberg LT ((2015) ) Turning on the light within: Subcortical nuclei of the isodentritic core and their role in Alzheimer’s diseaseathogenesis. J Alzheimers Dis 46: , 17–34. |
[25] | Satoh A , Iijima KM ((2019) ) Roles of tau pathology in the locus coeruleus (LC) in age-associated pathophysiology and Alzheimer’s disease pathogenesis: Potential strategies to protect the LC against aging. Brain Res 1702: , 17–28. |
[26] | Gannon M , Che P , Chen Y , Jiao K , Roberson ED , Wang Q ((2015) ) Noradrenergic dysfunction in Alzheimer’s disease. Front Neurosci 9: , 220. |
[27] | Simic G , Babic Leko M , Wray S , Harrington CR , Delalle I , Jovanov-Milosevic N , Bazadona D , Buee L , de Silva R , Di Giovanni G , Wischik CM , Hof PR ((2017) ) Monoaminergic neuropathology in Alzheimer’s disease. Prog Neurobiol 151: , 101–138. |
[28] | Weinshenker D ((2018) ) Long road to ruin: Noradrenergic dysfunction in neurodegenerative disease. Trends Neurosci 41: , 211–223. |
[29] | Matchett BJ , Grinberg LT , Theofilas P , Murray ME ((2021) ) The mechanistic link between selective vulnerability of the locus coeruleus and neurodegeneration in Alzheimer’s disease. Acta Neuropathol 141: , 631–650. |
[30] | Maestu F , de Haan W , Busche MA , DeFelipe J ((2021) ) Neuronal excitation/inhibition imbalance: Core element of a translational perspective on Alzheimer pathophysiology. Ageing Res Rev 69: , 101372. |
[31] | van Nifterick AM , Gouw AA , van Kesteren RE , Scheltens P , Stam CJ , de Haan W ((2022) ) A multiscale brain network model links Alzheimer’s disease-mediated neuronal hyperactivity to large-scale oscillatory slowing. Alzheimers Res Ther 14: , 101. |
[32] | Palop JJ , Mucke L ((2010) ) Amyloid-beta-induced neuronal dysfunction in Alzheimer’s disease: From synapses toward neural networks. Nat Neurosci 13: , 812–818. |
[33] | Palop JJ , Mucke L ((2016) ) Network abnormalities and interneuron dysfunction in Alzheimer disease. Nat Rev Neurosci 17: , 777–792. |
[34] | Kashani A , Lepicard E , Poirel O , Videau C , David JP , Fallet-Bianco C , Simon A , Delacourte A , Giros B , Epelbaum J , Betancur C , El Mestikawy S ((2008) ) Loss of VGLUT1 and VGLUT2 in the prefrontal cortex is correlated with cognitive decline in Alzheimer disease. Neurobiol Aging 29: , 1619–1630. |
[35] | Kirvell SL , Esiri M , Francis PT ((2006) ) Down-regulation of vesicular glutamate transporters precedes cell loss and pathology in Alzheimer’s disease. J Neurochem 98: , 939–950. |
[36] | Garcia-Marin V , Blazquez-Llorca L , Rodriguez JR , Boluda S , Muntane G , Ferrer I , Defelipe J ((2009) ) Diminished perisomatic GABAergic terminals on cortical neurons adjacent to amyloid plaques. Front Neuroanat 3: , 28. |
[37] | Kurucu H , Colom-Cadena M , Davies C , Wilkins L , King D , Rose J , Tzioras M , Tulloch JH , Smith C , Spires-Jones TL ((2022) ) Inhibitory synapse loss and accumulation of amyloid beta in inhibitory presynaptic terminals in Alzheimer’s disease. Eur J Neurol 29: , 1311–1323. |
[38] | Saito T , Matsuba Y , Mihira N , Takano J , Nilsson P , Itohara S , Iwata N , Saido TC ((2014) ) Single App knock-in mouse models of Alzheimer’s disease. Nat Neurosci 17: , 661–663. |
[39] | Sakakibara Y , Sekiya M , Saito T , Saido TC , Iijima KM ((2019) ) Amyloid-beta plaque formation and reactive gliosis are required for induction of cognitive deficits in App knock-in mouse models of Alzheimer’s disease. BMC Neurosci 20: , 13. |
[40] | Sakakibara Y , Hirota Y , Ibaraki K , Takei K , Chikamatsu S , Tsubokawa Y , Saito T , Saido TC , Sekiya M , Iijima KM ((2021) ) Widespread reduced density of noradrenergic locus coeruleus axons in the app knock-in mouse model of amyloid-beta amyloidosis. J Alzheimers Dis 82: , 1513–1530. |
[41] | Sasaguri H , Nilsson P , Hashimoto S , Nagata K , Saito T , De Strooper B , Hardy J , Vassar R , Winblad B , Saido TC ((2017) ) APP mouse models for Alzheimer’s disease preclinical studies. EMBO J 36: , 2473–2487. |
[42] | Saito T , Mihira N , Matsuba Y , Sasaguri H , Hashimoto S , Narasimhan S , Zhang B , Murayama S , Higuchi M , Lee VMY , Trojanowski JQ , Saido TC ((2019) ) Humanization of the entire murine MAPT gene provides a murine model of pathological human tau propagation. J Biol Chem 294: , 12754–12765. |
[43] | Salas IH , Callaerts-Vegh Z , D’Hooge R , Saido TC , Dotti CG , De Strooper B ((2018) ) Increased insoluble amyloid-beta induces negligible cognitive deficits in old AppNL/NL knock-in mice. J Alzheimers Dis 66: , 801–809. |
[44] | Zonouzi M , Berger D , Jokhi V , Kedaigle A , Lichtman J , Arlotta P ((2019) ) Individual oligodendrocytes show bias for inhibitory axons in the neocortex, Cell Rep 27: , 2799–2808 e2793. |
[45] | Balschun D , Moechars D , Callaerts-Vegh Z , Vermaercke B , Van Acker N , Andries L , D’Hooge R ((2010) ) Vesicular glutamate transporter VGLUT1 has a role in hippocampal long-term potentiation and spatial reversal learning. Cereb Cortex 20: , 684–693. |
[46] | Heise C , Schroeder JC , Schoen M , Halbedl S , Reim D , Woelfle S , Kreutz MR , Schmeisser MJ , Boeckers TM ((2016) ) Selective localization of shanks to VGLUT1-positive excitatory synapses in the mouse hippocampus. Front Cell Neurosci 10: , 106. |
[47] | Liguz-Lecznar M , Skangiel-Kramska J ((2007) ) Vesicular glutamate transporters (VGLUTs): The three musketeers of glutamatergic system. Acta Neurobiol Exp (Wars) 67: , 207–218. |
[48] | Hu H , Gan J , Jonas P ((2014) ) Interneurons. Fast-spiking, parvalbumin(+) GABAergic interneurons: From cellular design to microcircuit function. Science 345: , 1255263. |
[49] | Tremblay R , Lee S , Rudy B ((2016) ) GABAergic interneurons in the neocortex: From cellular properties to circuits. Neuron 91: , 260–292. |
[50] | Blennow K , Hampel H , Weiner M , Zetterberg H ((2010) ) Cerebrospinal fluid and plasma biomarkers in Alzheimer disease. Nat Rev Neurol 6: , 131–144. |
[51] | Shaw LM , Arias J , Blennow K , Galasko D , Molinuevo JL , Salloway S , Schindler S , Carrillo MC , Hendrix JA , Ross A , Illes J , Ramus C , Fifer S ((2018) ) Appropriate use criteria for lumbar puncture and cerebrospinal fluid testing in the diagnosis of Alzheimer’s disease. Alzheimers Dement 14: , 1505–1521. |
[52] | Styr B , Slutsky I ((2018) ) Imbalance between firing homeostasis and synaptic plasticity drives early-phase Alzheimer’s disease. Nat Neurosci 21: , 463–473. |
[53] | Scaduto P , Lauterborn JC , Cox CD , Fracassi A , Zeppillo T , Gutierrez BA , Keene CD , Crane PK , Mukherjee S , Russell WK , Taglialatela G , Limon A ((2023) ) Functional excitatory to inhibitory synaptic imbalance and loss of cognitive performance in people with Alzheimer’s disease neuropathologic change. Acta Neuropathol 145: , 303–324. |
[54] | Bi D , Wen L , Wu Z , Shen Y ((2020) ) GABAergic dysfunction in excitatory and inhibitory (E/I) imbalance drives the pathogenesis of Alzheimer’s disease. Alzheimers Dement 16: , 1312–1329. |
[55] | Nakamura A , Cuesta P , Kato T , Arahata Y , Iwata K , Yamagishi M , Kuratsubo I , Kato K , Bundo M , Diers K , Fernandez A , Maestu F , Ito K ((2017) ) Early functional network alterations in asymptomatic elders at risk for Alzheimer’s disease. Sci Rep 7: , 6517. |
[56] | Busche MA , Eichhoff G , Adelsberger H , Abramowski D , Wiederhold KH , Haass C , Staufenbiel M , Konnerth A , Garaschuk O ((2008) ) Clusters of hyperactive neurons near amyloid plaques in a mouse model of Alzheimer’s disease. Science 321: , 1686–1689. |
[57] | Ambrad Giovannetti E , Fuhrmann M ((2019) ) Unsupervised excitation: GABAergic dysfunctions in Alzheimer’s disease. Brain Res 1707: , 216–226. |
[58] | Huh CY , Amilhon B , Ferguson KA , Manseau F , Torres-Platas SG , Peach JP , Scodras S , Mechawar N , Skinner FK , Williams S ((2016) ) Excitatory inputs determine phase-locking strength and spike-timing of CA1 stratum oriens/alveus parvalbumin and somatostatin interneurons during intrinsically generated hippocampal theta rhythm. J Neurosci 36: , 6605–6622. |
[59] | Bartos M , Vida I , Jonas P ((2007) ) Synaptic mechanisms of synchronized gamma oscillations in inhibitory interneuron networks. Nat Rev Neurosci 8: , 45–56. |
[60] | Canuet L , Pusil S , Lopez ME , Bajo R , Pineda-Pardo JA , Cuesta P , Galvez G , Gaztelu JM , Lourido D , Garcia-Ribas G , Maestu F ((2015) ) Network disruption and cerebrospinal fluid amyloid-beta and phospho-tau levels in mild cognitive impairment. J Neurosci 35: , 10325–10330. |
[61] | Smailovic U , Koenig T , Kareholt I , Andersson T , Kramberger MG , Winblad B , Jelic V ((2018) ) Quantitative EEG power and synchronization correlate with Alzheimer’s disease CSF biomarkers. Neurobiol Aging 63: , 88–95. |
[62] | Bouhrara M , Reiter DA , Bergeron CM , Zukley LM , Ferrucci L , Resnick SM , Spencer RG ((2018) ) Evidence of demyelination in mild cognitive impairment and dementia using a direct and specific magnetic resonance imaging measure of myelin content. Alzheimers Dement 14: , 998–1004. |
[63] | Dean DC , 3rd , Hurley SA , Kecskemeti SR , O’Grady JP , Canda C , Davenport-Sis NJ , Carlsson CM , Zetterberg H , Blennow K , Asthana S , Sager MA , Johnson SC , Alexander AL , Bendlin BB ((2017) ) Association of amyloid pathology with myelin alteration in preclinical Alzheimer disease. JAMA Neurol 74: , 41–49. |
[64] | Walker KA , Duggan MR , Gong Z , Dark HE , Laporte JP , Faulkner ME , An Y , Lewis A , Moghekar AR , Resnick SM , Bouhrara M ((2023) ) MRI and fluid biomarkers reveal determinants of myelin and axonal loss with aging. Ann Clin Transl Neurol 10: , 397–407. |
[65] | Mathys H , Davila-Velderrain J , Peng Z , Gao F , Mohammadi S , Young JZ , Menon M , He L , Abdurrob F , Jiang X , Martorell AJ , Ransohoff RM , Hafler BP , Bennett DA , Kellis M , Tsai LH ((2019) ) Single-cell transcriptomic analysis of Alzheimer’s disease. Nature 570: , 332–337. |
[66] | Benamer N , Vidal M , Balia M , Angulo MC ((2020) ) Myelination of parvalbumin interneurons shapes the function of cortical sensory inhibitory circuits. Nat Commun 11: , 5151. |
[67] | Dubey M , Pascual-Garcia M , Helmes K , Wever DD , Hamada MS , Kushner SA , Kole MHP ((2022) ) Myelination synchronizes cortical oscillations by consolidating parvalbumin-mediated phasic inhibition, Elife 11: , e73827. |
[68] | Micheva KD , Wolman D , Mensh BD , Pax E , Buchanan J , Smith SJ , Bock DD ((2016) ) A large fraction of neocortical myelin ensheathes s of local inhibitory neurons, Elife 5: , e15784. |
[69] | Stedehouder J , Couey JJ , Brizee D , Hosseini B , Slotman JA , Dirven CMF , Shpak G , Houtsmuller AB , Kushner SA ((2017) ) Fast-spiking parvalbumin interneurons are frequently myelinated in the cerebral cortex of mice and humans. Cereb Cortex 27: , 5001–5013. |
[70] | Chen JF , Liu K , Hu B , Li RR , Xin W , Chen H , Wang F , Chen L , Li RX , Ren SY , Xiao L , Chan JR , Mei F ((2021) ) Enhancing myelin renewal reverses cognitive dysfunction in a murine model of Alzheimer’s disease, Neuron 109: , 2292–2307 e2295. |
[71] | Hirschfeld LR , Risacher SL , Nho K , Saykin AJ ((2022) ) Myelin repair in Alzheimer’s disease: A review of biological pathways and potential therapeutics. Transl Neurodegener 11: , 47. |
[72] | Grothe M , Heinsen H , Teipel S ((2013) ) Longitudinal measures of cholinergic forebrain atrophy in the transition from healthy aging to Alzheimer’s disease. Neurobiol Aging 34: , 1210–1220. |
[73] | Babic Leko M , Hof PR , Simic G ((2021) ) Alterations and interactions of subcortical modulatory systems in Alzheimer’s disease. Prog Brain Res 261: , 379–421. |
[74] | Patthy A , Murai J , Hanics J , Pinter A , Zahola P , Hokfelt TGM , Harkany T , Alpar A ((2021) ) Neuropathology of the brainstem to mechanistically understand and to treat Alzheimer’s disease. J Clin Med 10: , 1555. |
[75] | Pan X , Kaminga AC , Jia P , Wen SW , Acheampong K , Liu A ((2020) ) Catecholamines in Alzheimer’s disease: A systematic review and meta-analysis. Front Aging Neurosci 12: , 184. |
[76] | David M , Malhotra PA ((2022) ) New approaches for the quantification and targeting of noradrenergic dysfunction in Alzheimer’s disease. Ann Clin Transl Neurol 9: , 582–596. |
[77] | David MCB , Del Giovane M , Liu KY , Gostick B , Rowe JB , Oboh I , Howard R , Malhotra PA ((2022) ) Cognitive and neuropsychiatric effects of noradrenergic treatment in Alzheimer’s disease: Systematic review and meta-analysis. J Neurol Neurosurg Psychiatry 93: , 1080–1090. |
[78] | Schmidt ML , Zhukareva V , Newell KL , Lee VM , Trojanowski JQ ((2001) ) Tau isoform profile and phosphorylation state in dementia pugilistica recapitulate Alzheimer’s disease. Acta Neuropathol 101: , 518–524. |
[79] | Gotz J , Probst A , Spillantini MG , Schafer T , Jakes R , Burki K , Goedert M ((1995) ) Somatodendritic localization and hyperphosphorylation of tau protein in transgenic mice expressing the longest human brain tau isoform. EMBO J 14: , 1304–1313. |
[80] | Goedert M , Spillantini MG , Jakes R , Rutherford D , Crowther RA ((1989) ) Multiple isoforms of human microtubule-associated protein tau: Sequences and localization in neurofibrillary tangles of Alzheimer’s disease. Neuron 3: , 519–526. |
[81] | Gotz J , Bodea LG , Goedert M ((2018) ) Rodent models for Alzheimer disease. Nat Rev Neurosci 19: 583–598. |

