
Evaluation of Blood-Based Plasma Biomarkers as Potential Markers of Amyloid Burden in Preclinical Alzheimer’s Disease
Abstract
Background:
Participant eligibility for the A4 Study was determined by amyloid PET imaging. Given the disadvantages of amyloid PET imaging in accessibility and cost, blood-based biomarkers may serve as a sufficient biomarker and more cost-effective screening tool for patient enrollment into preclinical AD trials.
Objective:
To determine if a blood-based screening test can adequately identify amyloid burden in participants screened into a preclinical AD trial.
Methods:
In this cross-sectional study, 224 participants from the A4 Study received an amyloid PET scan (18Florbetapir) within 90 days of blood sample collection. Blood samples from all study participants were processed within 2 h after phlebotomy. Plasma amyloid measures were quantified by Shimazdu and C2 N Diagnostics using mass spectrometry-based platforms. A corresponding subset of blood samples (n = 100) was processed within 24 h after phlebotomy and analyzed by C2 N.
Results:
Plasma Aβ42/Aβ40 demonstrated the highest association for Aβ accumulation in the brain with an AUC 0.76 (95%CI = 0.69, 0.82) at C2 N and 0.80 (95%CI = 0.75, 0.86) at Shimadzu. Blood samples processed to plasma within 2 h after phlebotomy provided a better prediction of amyloid PET status than blood samples processed within 24 h (AUC 0.80 versus 0.64; p < 0.001). Age, sex, and APOE ɛ4 carrier status did not the diagnostic performance of plasma Aβ42/Aβ40 to predict amyloid PET positivity in A4 Study participants.
Conclusion:
Plasma Aβ42/Aβ40 may serve as a potential biomarker for predicting elevated amyloid in the brain. Utilizing blood testing over PET imaging may improve screening efficiency into clinical trials.
INTRODUCTION
Alzheimer’s disease (AD) is a common neurodegenerative disease associated with aging. In the United States, more than 6.2 million individuals over the age of 65 are affected by AD dementia, a number that is expected to increase to 13.8 million by the year 2050 [1]. AD is thought to begin with a predementia stage that slowly progresses to mild cognitive impairment (MCI) then to symptomatic AD [2]. Older clinically normal (CN) individuals with evidence of amyloid pathology (Aβ+) demonstrate more rapid declines on longitudinal neurophysiological testing results; more rapid decline in cognitive function; and at a greater risk of progression to mild cognitive impairment (MCI) and dementia [2].
The current state of AD diagnostics allows for asymptomatic or CN individuals to be diagnosed with preclinical AD by examining the presence of Aβ, now detectable with neuroimaging modalities such amyloid positron emission tomography (PET) and cerebrospinal fluid (CSF) analysis. These methods are traditionally employed to indicate the presence of brain amyloid plaques in CN individuals. Numerous studies have correlated elevated brain Aβ levels and lower CSF Aβ42/Aβ40 levels with cognitive decline [3–5]. However, these methods are expensive, not readily accessible in primary care settings, time consuming, and invasive [6–8]. These limitations have sparked researchers to examine the feasibility of using blood biomarker measures (e.g., Aβ40, Aβ42, Aβ42/Aβ40, tau, phospho-tau) to detect amyloid pathology as blood sample collection is procedurally simple and readily accessible in primary care settings to minority populations in rural areas, the elderly, and those of diverse socioeconomic groups [9, 10]. Moreover, blood-based biomarkers may serve as a more cost-effective screening tool for patient enrollment into preclinical AD trials. Early detection is considered critical, in that AD-modifying interventions designed to stop or slow disease progression during asymptomatic stages are likely to be most effective [11]. Lastly, identifying and treating a cognitively impaired patient at earlier and more treatable time points may alleviate the financial hardships and caregiver burden imposed on close relatives and on the healthcare system [12].
In 2014, Anti-Amyloid Treatment in Asymptomatic Alzheimer’s Disease (A4) Study, a first-of-its-kind secondary prevention trial was initiated to assess the efficacy of a preclinical drug intervention in CN older individuals who were “at risk” for progression to AD [13, 14]. Participant eligibility into the A4 Study was determined by amyloid PET imaging (elevated Aβ+versus non elevated Aβ-). Given the advantages of using blood-based biomarkers over PET imaging [9, 15–17], we investigated whether blood-based biomarker screening tests can predict brain amyloid pathology in the pre-randomization A4 participants. Quantifying plasma amyloid biomarkers has the potential to improve the efficiency of screening and enrolling participants into clinical trials similar to the A4 Study [11, 18, 19]. Over the past few years, accumulating evidence has demonstrated that lower plasma Aβ42/Aβ40 ratios, as measured using mass spectrometry (MS)-based methods, are associated with brain amyloid pathology, accelerated cognitive decline, and increased risk of developing AD dementia in CN, older adults [20, 21].
In the current study, we examined whether plasma Aβ40, Aβ42, and Aβ42/Aβ40 levels, as measured by two different MS platforms (MALDI-TOF-MS and LC-MS/MS), can predict brain amyloid PET positivity in cognitively normal, A4 Study participants. Secondly, we compared the impact of two different plasma processing protocols (2 h versus 24 h) on the plasma Aβ40, Aβ42, and Aβ42/Aβ40 levels to predict amyloid PET positivity.
METHODS
2.1Patient characterization, blood sample testing, and amyloid PET imaging
Blood plasma samples from 224 A4 trial screened participants were included in this study [13, 14]. The A4 Study was approved by the independent ethics committee and registered at Clinicaltrials.gov (identifier: NCT02008357). All participating subjects signed the study’s informed consent form which had also been approved by the independent ethics committee.
Patient characterizations and demographics are described in Table 1. Briefly, A4 trial participants received amyloid PET scan (18Florbetapir) within 90 days of blood sample collection, as previously described [13, 14]. Amyloid status (elevated Aβ+ or non-elevated Aβ-) was defined using a combination of both quantitative mean cortical standard uptake value ratio (SUVr) and qualitative visual inspection. A quantitative SUVr threshold of ≥1.15 was utilized to define brain amyloid positivity, the primary criterion. An SUVr between 1.10 and 1.15 was considered amyloid positive (Aβ+) only when the corresponding visual read was also considered positive by a two-reader consensus determination. One half of the 224 screened A4 trial participants were classified as Aβ+ (n = 112) and the other half of the A4 trial participants were classified as Aβ- (n = 112). Aβ+ PET positive participants were stratified equally based on gender and APOE genotype (Table 1) while Aβ- PET negative participants were majority female and APOE ɛ4 non-carriers (Table 1). Average age for all participants across both groups is 72.7 years of age while the average MMSE score for all participants across both groups is 28.7 (Table 1).
Table 1
Demographic and clinical data for the 224 participants with plasma samples collected using Protocol 1 that were analyzed using both MALDI-TOF-MS and LC-MS/MS platforms. Categorical variables are summarized using counts and percentages (%); continuous variables summarized using means and standard deviations (SD). MMSE, Mini-Mental State Exam; CFI, Cognitive Function Index
| Patient Demographic Data (n = 224) | ||||
| Characteristic | Aβ- | Aβ+ | Combined | |
| (N = 112) | (N = 112) | (N = 224) | ||
| APOE ɛ4 | Negative | 79 (35.27%) | 57 (25.45%) | 136 (60.71%) |
| Positive | 31 (13.84%) | 54 (24.11%) | 85 (37.95%) | |
| (Missing) | 2 (0.89%) | 1 (0.45%) | 3 (1.34%) | |
| Ethnicity | Hispanic or Latino | 3 (1.34%) | 1 (0.45%) | 4 (1.64%) |
| Not Hispanic or Latino | 108 (48.21%) | 110 (49.11%) | 218 (97.32%) | |
| (Missing) | 1 (0.45%) | 1 (0.45%) | 2 (0.89%) | |
| Race | American Indian or Alaska Native | 1 (0.45%) | 0 (0.00%) | 1 (0.45%) |
| Asian | 4 (1.79%) | 0 (0.00%) | 4 (1.79%) | |
| Black or African American | 8 (3.57%) | 0 (0.00%) | 8 (3.57%) | |
| White | 98 (43.75%) | 112 (50.00%) | 210 (93.75%) | |
| (Missing) | 1 (0.45%) | 0 (0.00%) | 1 (0.45%) | |
| Sex | Female | 71 (31.70%) | 57 (25.45%) | 128 (57.14%) |
| Male | 41 (18.30%) | 55 (24.55%) | 96 (42.86%) | |
| Age, mean (SD) | 72.08 (5.27) | 73.29 (4.86) | 72.69 (5.10) | |
| MMSE, mean (SD) | 28.83 (1.11) | 28.54 (1.43) | 28.69 (1.29) | |
| CFI, mean (SD) | 3.83 (3.82) | 3.97 (3.75) | 3.90 (3.78) | |
| Clinical Biomarker Summaries | ||||
| C2 N –Protocol 2 | Amyloid protein concentrations, mean (SD) | |||
| Aβ40 (pg/mL) | 508.07 (102.24) | 499.92 (69.44) | 504.00 (87.29) | |
| Aβ42 (pg/mL) | 47.15 (10.26) | 42.61 (6.49) | 44.88 (8.86) | |
| Aβ42/Aβ40 | 0.093 (0.008) | 0.085 (0.007) | 0.089 (0.009) | |
| Shimadzu –Protocol 2 | ||||
| Aβ40 (pg/mL) | 8.92 (2.61) | 8.31 (1.93) | 8.61 (2.31) | |
| Aβ42 (pg/mL) | 0.49 (0.14) | 0.40 (0.10) | 0.45 (0.13) | |
| Aβ42/Aβ40 | 0.055 (0.01) | 0.048 (0.01) | 0.052 (0.01) | |
Blood plasma samples from 224 A4 trial screened participants were collected into K2 EDTA tubes and processed using one of two protocols: blood samples were collected and express shipped on cold packs to the Rissman lab Biomarker Core at the University of California, San Diego (UCSD), where they were processed to plasma (centrifuged at 3000 rpm for 10 min at room temperature) approximately 24 h after phlebotomy. Under Protocol 1, plasma processed within 24 h were frozen in 0.5 mL aliquots at -80°C and stored at the Rissman lab Biomarker Core. Under Protocol 2, blood samples were processed to plasma at the collection site, frozen in 0.5 mL aliquots within 2 h after phlebotomy, and the frozen plasma was shipped on dry ice to UCSD for storage at -80°C.
Two hundred and twenty-four (224) duplicate frozen plasma samples, processed within 2 h (Protocol 2) were shipped on dry ice to Shimadzu and C2 N labs. Plasma amyloid measures Aβ40, Aβ42, and Aβ42/Aβ40 were quantified in singlicate using state-of-the-art mass spectrometry-based analytical platforms (Shimadzu Techno-Research Inc., MALDI-TOF-MS and C2 N Diagnostics, LC-MS/MS) as previously described [19, 21, 22]. Shimadzu measures also included a Composite score that was generated by averaging the normalized scores (z-score to NCGG database) of APP669–711/Aβ1–42 and Aβ1–40/Aβ1–42 as previously described [19, 23]. A corresponding subset of 100, randomly selected, frozen plasma samples processed within 24 h (Protocol 1) were shipped only to C2 N Diagnostics where plasma Aβ40, Aβ42, and Aβ42/Aβ40 were quantified using LC-MS/MS. Both labs were blinded to participant demographics and meta-data during plasma sample analysis. After analysis, plasma biomarker values were transferred from the two MS labs to Rissman lab Biomarker Core (UC San Diego) for statistical analysis. Data integration
C2 N Diagnostics and Shimadzu plasma biomarker values were transferred to ATRI statisticians and merged with A4 pre-randomization study data that was frozen on June 25, 2019. The C2 N Diagnostics biomarker measures were transferred to Rissman lab Biomarker Core in April 2020. The Shimadzu lab provided biomarker measures in two formats: initial measures from the original MALDI-TOF-MS analysis; and a second dataset of measures that used available QC data to recalibrate the biomarker values derived from the original MALDI-TOF-MS analysis. Since the QC recalibration approach is meaningful for comparisons among multiple sites, but less meaningful for single site data such as this, we have presented biomarker data from the initial MALDI-TOF-MS analysis.
Statistical analysis
Receiver operating characteristic (ROC) curve analysis was conducted to test the ability of plasma amyloid biomarkers to identify brain amyloid PET status in A4 participants. ROC curves were calculated for each biomarker and paired statistical comparisons of analytical platform (MALDI-TOF-MS vs LC-MS/MS), and Rissman lab Biomarker Core sample collection, processing, and transport protocols (24 h versus 2 h) were performed using Sun and Xu [24] algorithm of the DeLong and Clarke-Pearson [25] method. All ROC curves were summarized using the area under the curve (AUC), AUC 95%confidence intervals (CI), Youden’s Index [25] and corresponding sensitivity, specificity, accuracy for the optimal plasma Aβ42/Aβ40 cut off value. Multivariable logistic regression model with a log link function was used to determine if age, sex, and/or APOE genotype influenced the ability of plasma amyloid biomarkers to predict amyloid PET status in all participants. For this analysis, age was categorized into four groups (50-65, 71-75, 76-80, and 81+) and stratified bootstrapping resampling was performed using 5-fold cross-validation within each age group. The predictive performance for each iteration (500 iterations total) was then estimated by predicting the out-of-fold sample, for each fold, and then performing ROC analysis. An AUC of 0.8 was predetermined to be clinically important and results are reported using point estimates and corresponding 95%CI. All statistical analyses were conducted using the statistical software R.
Exploratory PET scan savings analysis
An exploratory analysis was conducted to estimate the potential impact of using plasma amyloid biomarker testing as a screening tool prior to amyloid PET. We estimated the number of PET scans that would be required to achieve 1,000 amyloid PET positive screens along with the number of participants requiring an initial plasma screening sample (pool size). For the purposes of these analyses, a prevalence level of 0.3 was used [13, 26].
RESULTS
Two hundred and twenty-four EDTA plasma samples processed within 2 h (Protocol 2) were shipped frozen and analyzed for Aβ40 and Aβ42 concentrations (pg/mL) and Aβ42/Aβ40 concentration ratio at the Shimadzu and C2 N labs. Participants’ baseline demographics and amyloid biomarker protein concentrations determined using both analytical platforms are summarized in Tables 1 and 2, overall and by amyloid PET status.
Table 2
Demographics for the subset of 100 patient’s blood samples collected and processed using Protocols 1 and 2 and analyzed by C2 N labs using LC-MS/MS. Categorical variables are summarized using counts and percentages (%) with continuous variables summarized using means and standard deviations (SD)
| Demographic Data (n = 100) | ||||
| Characteristic | Aβ- | Aβ+ | Combined | |
| (n = 50) | (n = 50) | (n = 100) | ||
| APOE ɛ4 | Negative | 39 (39.00%) | 27 (27.00%) | 66 (66.00%) |
| Positive | 11 (11.00%) | 23 (23.00%) | 34 (34.00%) | |
| Ethnicity | Hispanic or Latino | 0 (0.00%) | 0 (0.00%) | 0 (0.00%) |
| Not Hispanic or Latino | 50 (50.00%) | 50 (50.00%) | 100 (100.00%) | |
| Race | American Indian or Alaska Native | 0 (0.00%) | 0 (0.00%) | 0 (0.00%) |
| Asian | 2 (2.00%) | 0 (0.00%) | 2 (2.00%) | |
| Black or African American | 6 (6.00%) | 0 (0.00%) | 6 (6.00%) | |
| White | 42 (42.00%) | 50 (50.00%) | 92 (92.00%) | |
| Sex | Female | 35 (35.00%) | 32 (32.00%) | 67 (67.00%) |
| Male | 15 (15.00%) | 18 (18.00%) | 33 (33.00%) | |
| Age, mean (SD) | 73.21 (6.05) | 73.47 (4.78) | 73.34 (5.43) | |
| MMSE, mean (SD) | 28.88 (0.94) | 28.40 (1.53) | 28.64 (1.28) | |
| CFI, mean (SD) | 3.64 (4.05) | 3.89 (3.92) | 3.76 (3.97) | |
| Clinical Biomarker Summaries | ||||
| Protocol 1 | Amyloid protein concentrations (pg/mL), mean (SD) | |||
| Aβ40 | 426.12 (109.63) | 408.41 (64.22) | 417.26 (89.83) | |
| Aβ42 | 31.42 (7.92) | 28.84 (6.90) | 30.13 (7.50) | |
| Aβ42/Aβ40 | 0.074 (0.011) | 0.070 (0.010) | 0.072 (0.011) | |
| Protocol 2 | ||||
| Aβ40 | 514.94 (116.58) | 502.47 (66.46) | 508.70 (94.62) | |
| Aβ42 | 48.60 (11.40) | 42.91 (7.27) | 45.76 (9.93) | |
| Aβ42/Aβ40 | 0.095 (0.008) | 0.085 (0.008) | 0.090 (0.009) | |
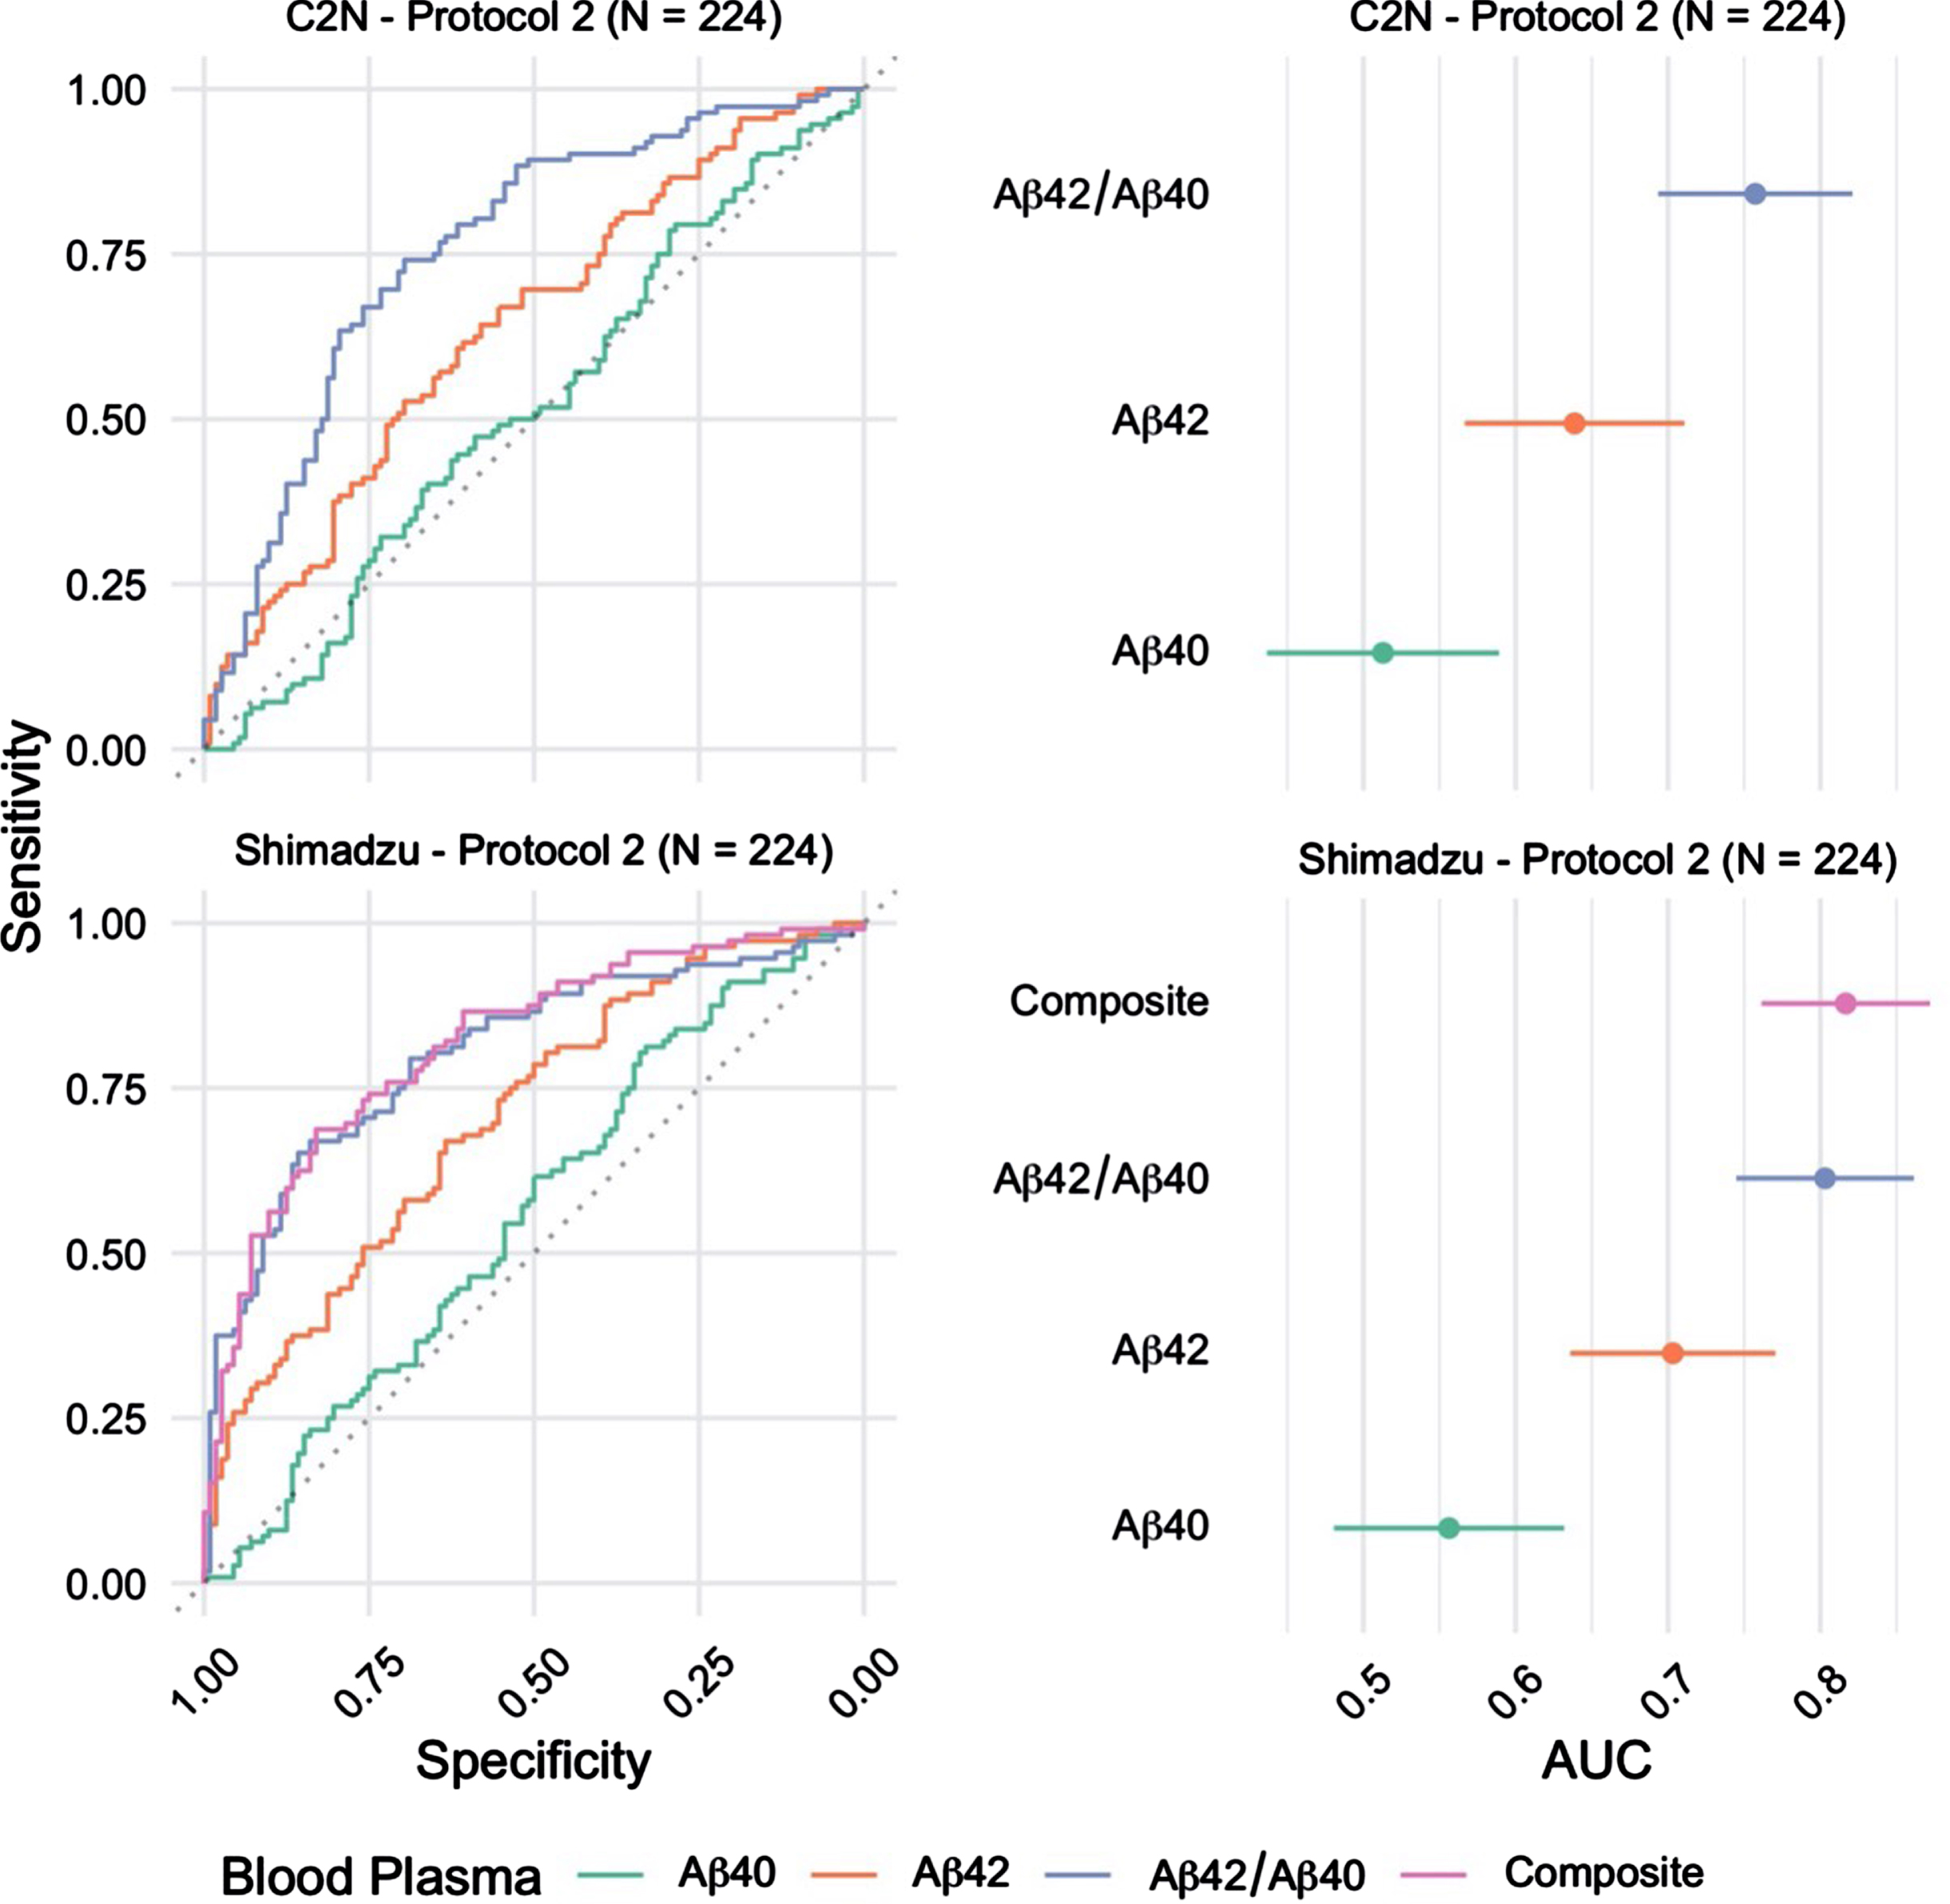
The ability to identify brain amyloid status using plasma Aβ42/Aβ40 quantified using MALDI-TOF-MS (Shimadzu) or LC-MS/MS (C2 N) was evaluated using ROC curve analysis (Fig. 1). Plasma Aβ42/Aβ40 quantified using MALDI-TOF-MS identified brain amyloid PET status with AUC-ROC=0.80 (95%CI = 0.75 –0.86), and LC-MS/MS analysis identified brain amyloid PET status with AUC-ROC=0.76 (95%CI = 0.69 –0.82) (p = 0.13 for ROC comparison by DeLong). Individual concentrations of plasma Aβ42 and Aβ40 were quantified using both analytical platforms. MALDI-TOF-MS analysis identified brain amyloid PET status with AUC-ROC=0.70 (Aβ42) and 0.56 (Aβ40) (95%CI = 0.64 –0.77). LC-MS/MS analysis of Aβ42 and Aβ40 identified brain amyloid PET status with AUC-ROC=0.64 (Aβ42) and 0.51 (Aβ40) (95%CI = 0.57 –0.71). Shimadzu lab also provided an additional marker; the Composite blood plasma marker score (APP669–711/Aβ42 and Aβ40/Aβ42) which returned an AUC of 0.82 (95%CI 0.76 - 0.87).
Fig. 1
Receiver operating characteristic (ROC) curves for the blood plasma samples (n = 224) Processed using Protocol 2 (2 h post phlebotomy) and analyzed at C2 N and Shimadzu laboratories (left). The corresponding area under curve (AUC) estimates and 95%confidence intervals (right).
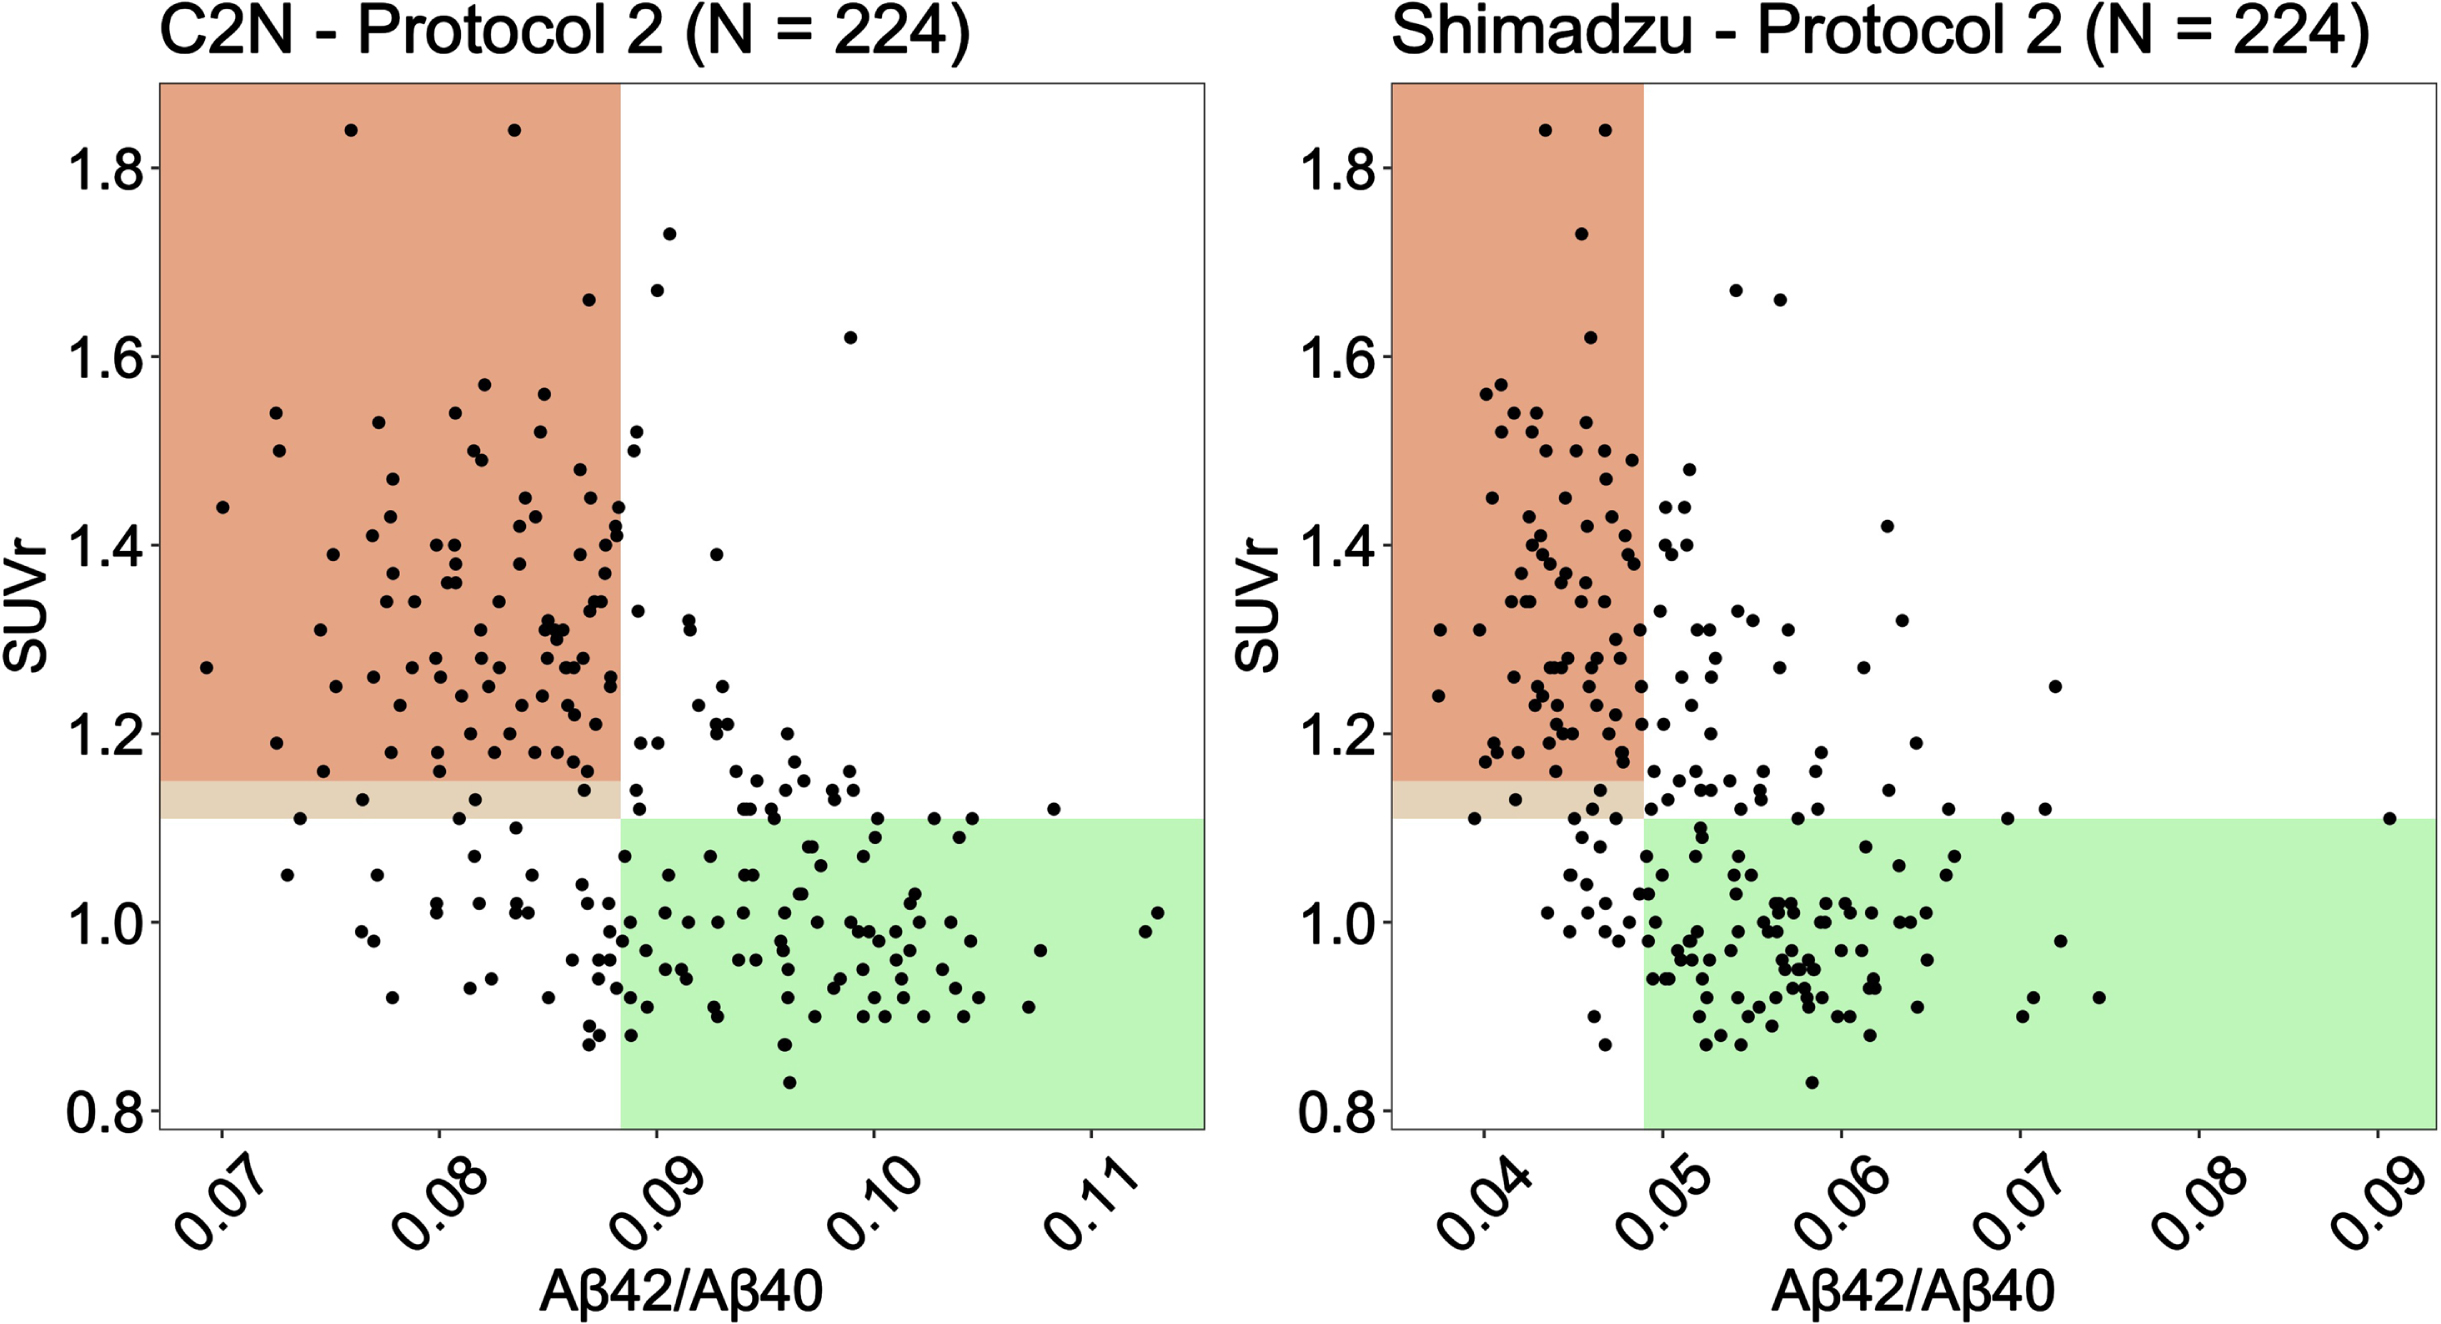
Aβ cut points identified from the Youden Index (see Table 3) were used to generate scatter plots of Aβ against PET SUVr for C2 N and Shimadzu under Protocol 2 (2 h processing) (Fig. 2). Shaded regions represent the areas where the plasma biomarker correctly identifies patients as amyloid negative (green) and amyloid positive (orange). The lighter color shaded between 1.11 and 1.15 SUVr is the region where a participant was considered amyloid positive only when the corresponding visual read was also considered positive by a two-reader consensus determination.
Table 3
Table summarizes Area Under the Curve (AUC); AUC 95%confidence intervals; cut point, and corresponding accuracy, Youden index value, sensitivity, and specificity estimates for each blood plasma biomarker analyzed at C2 N lab, and Shimadzu. The cut point was determined by maximizing the Youden Index value. Table summarizes ROC estimates and odds ratio (OR) estimates for Aβ42/Aβ40 with additional covariates (sex, age, and APOE ɛ4 + /-) for samples analyzed by C2 N and Shimadzu labs. PACC, Preclinical Alzheimer’s Cognitive Composite score. CFI, cognitive function index
| Process | Biomarker | AUC (95%CI) | Cut Point | Accuracy | Youden | Sensitivity | Specificity |
| C2 N LC-MS/MS (n = 224) | Aβ40 | 0.51 (0.44, 0.59) | 453.19 | 0.54 | 0.08 | 0.80 | 0.29 |
| Aβ42 | 0.64 (0.57, 0.71) | 43.73 | 0.61 | 0.22 | 0.64 | 0.58 | |
| Aβ42/Aβ40 | 0.76 (0.69, 0.82) | 0.088 | 0.72 | 0.44 | 0.74 | 0.70 | |
| Shimadzu MALDI-TOF-MS (n = 224) | Aβ40 | 0.56 (0.48, 0.63) | 9.74 | 0.57 | 0.14 | 0.81 | 0.33 |
| Aβ42 | 0.70 (0.64, 0.77) | 0.42 | 0.65 | 0.30 | 0.67 | 0.63 | |
| Aβ42/Aβ40 | 0.80 (0.75, 0.86) | 0.05 | 0.75 | 0.51 | 0.67 | 0.84 | |
| C2 N LC-MS/MS; Protocol 1 (n = 100) | Aβ40 | 0.50 (0.39, 0.62) | 390.49 | 0.60 | 0.20 | 0.72 | 0.48 |
| Aβ42 | 0.58 (0.47, 0.70) | 39.42 | 0.59 | 0.18 | 0.96 | 0.22 | |
| Aβ42/Aβ40 | 0.64 (0.52, 0.75) | 0.075 | 0.66 | 0.32 | 0.76 | 0.56 | |
| C2 N LC-MS/MS; Protocol 2 (n = 100) | Aβ40 | 0.55 (0.44, 0.67) | 500.58 | 0.60 | 0.20 | 0.56 | 0.64 |
| Aβ42 | 0.65 (0.54, 0.76) | 45.03 | 0.63 | 0.26 | 0.70 | 0.56 | |
| Aβ42/Aβ40 | 0.80 (0.71, 0.89) | 0.094 | 0.76 | 0.52 | 0.92 | 0.60 | |
| ROC Estimates for Aβ42/Aβ40 (n = 224) with Additional Covariates (sex, age, and APOE ɛ4 + /-) | |||||||
| Biomarker | AUC (95%CI) | Cut Point | Accuracy | Youden | Sensitivity | Specificity | |
| C2 N | Aβ42/Aβ40 | 0.72 (0.67, 0.82) | 0.323 | 0.67 | 0.35 | 0.89 | 0.46 |
| Shimadzu | Aβ42/Aβ40 | 0.78 (0.72, 0.86) | 0.528 | 0.73 | 0.46 | 0.68 | 0.78 |
| Odds Ratio (OR) Estimates for Aβ42/Aβ40 (n = 224) | |||||||
| Aβ42/Aβ40 | Age (y) 71 –75 | Age (y) 76 –80 | Age (y) 81+ | APOE ɛ4+ | PACC | CFI | |
| C2 N (95%CI) | 2.32 (1.67, 3.72) | 1.73 (0.80, 3.99) | 2.41 (0.89, 7.12) | 0.98 (0.32,3.10) | 1.76 (0.83, 4.50) | 0.98 (0.85, 1.10) | 0.99 (0.91, 1.08) |
| Shimadzu (95%CI) | 1.52 (1.31, 1.95) | 1.56 (0.61, 4.08) | 2.77 (0.97, 8.07) | 1.11 (0.33, 4.54) | 1.96 (0.93, 4.27) | 1.00 (0.89, 1.16) | 0.97 (0.90, 1.04) |
Fig. 2
Scatter plots of Aβ against PET SUVr for C2 N and Shimadzu under Protocol 2 (2 h post phlebotomy). Shaded regions represent the areas where the plasma biomarker correctly identifies patients as amyloid negative (green) and amyloid positive (orange).
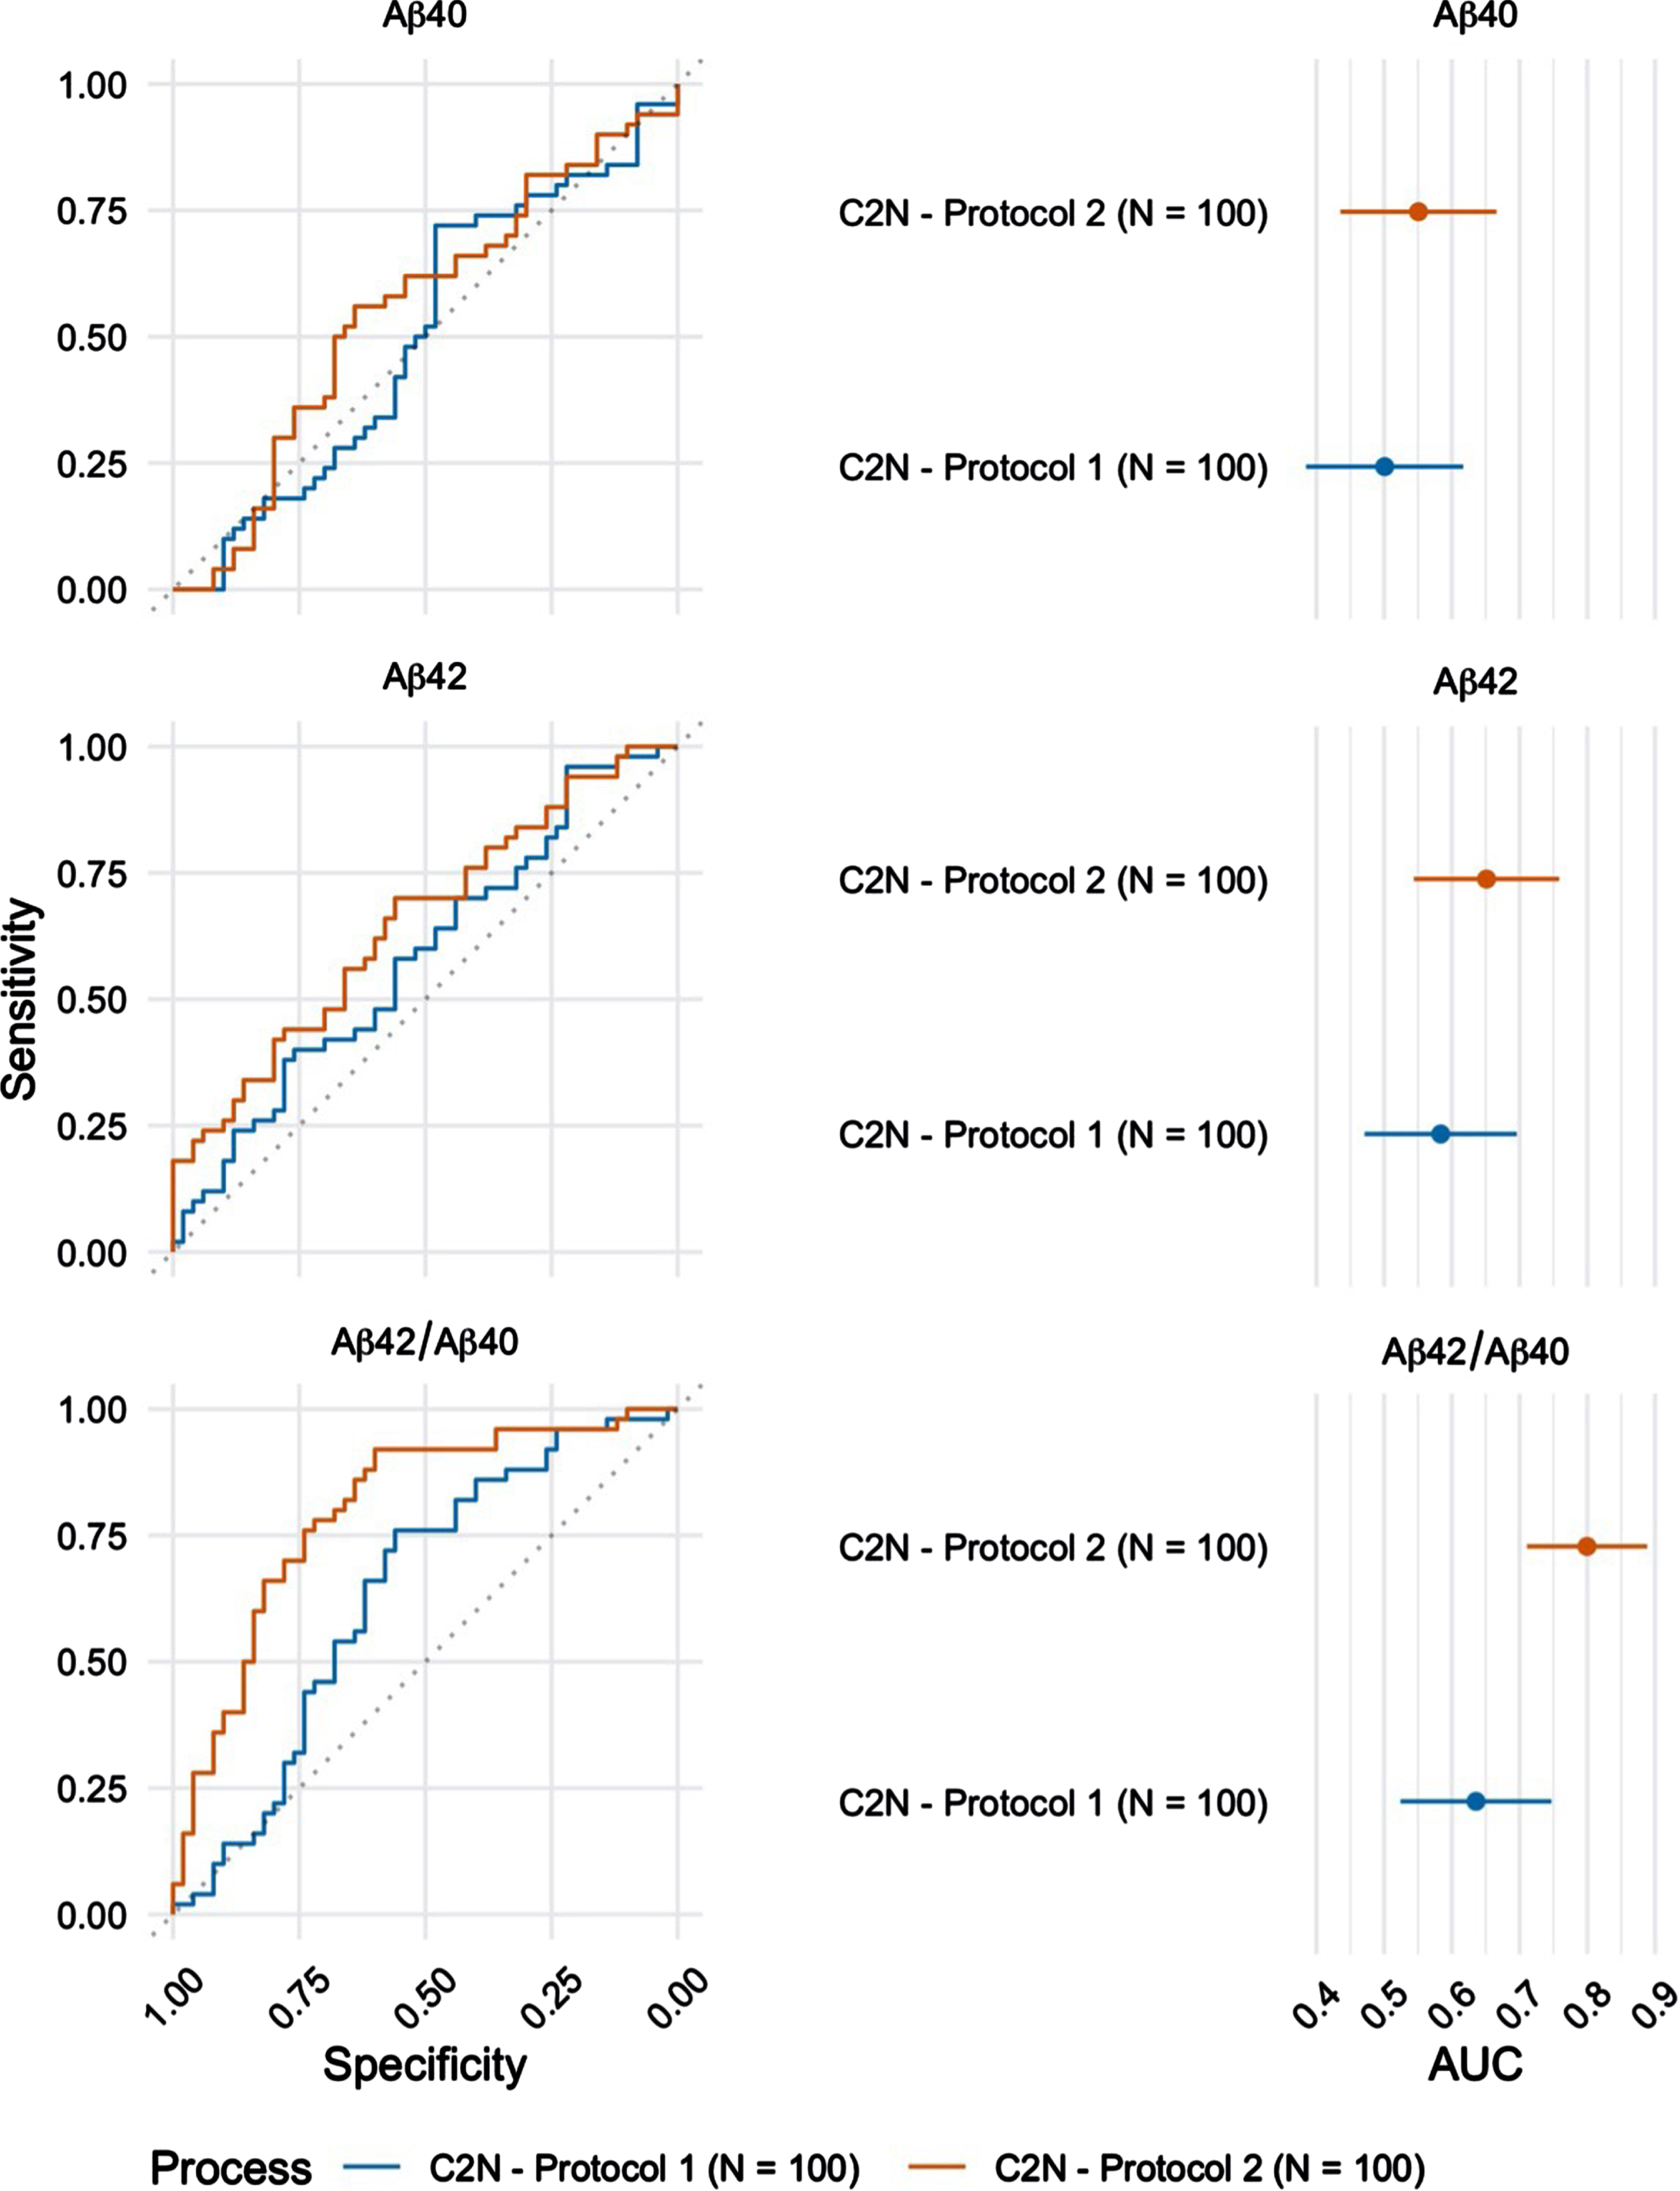
Plasma Aβ42/Aβ40 was also quantified by LC-MS/MS in a subset (n = 100) of the 224 participants. These randomly selected blood samples were processed using both protocols (Protocol 1: blood processed to plasma 24 h after phlebotomy versus Protocol 2: blood processed to plasma within 2 h after phlebotomy; Table 2) and results were compared to examine the effects of blood processing and handling, prior to biomarker analysis. Samples processed within 2 h after phlebotomy returned a significantly higher AUC-ROC (0.80 (95%CI = 0.71 –0.89) as compared to samples processed within 24 h after phlebotomy (AUC-ROC=0.64 (95%CI = 0.52 –0.75) (Fig. 3, p < 0.001).
Fig. 3
ROC curves for the blood plasma samples (n = 100) collected using Protocol 1 (24 h post phlebotomy) and Protocol 2 (2 h post phlebotomy) and analyzed at C2 N laboratory (left). The corresponding AUC estimates and 95%confidence intervals (right).
Biomarker predictability with the inclusion of age, sex, and APOE status
Multivariable analysis was conducted on the 224 A4 trial plasma samples (Protocol 2 –2 h) to determine whether demographic covariates (age, sex, and/or APOE genotype) improved ability of plasma Aβ42/Aβ40 to predict amyloid PET status, as measured by AUC. Odds ratio (OR) estimates determined that participants aged 76-80 were approximately 2.5 times more likely to be amyloid PET positive than participants aged 65-70 (Table 3). When APOE genotype (having one or two ɛ4 alleles) was considered, APOE ɛ4+ carriers were approximately 2 times more likely to be amyloid PET positive as compared to non-carriers (Table 3). The out-of-fold sample was then used to calculate the ROC estimates at each iteration for all plasma amyloid predictors. Here, we determined that the addition of these pre-specified covariates (age, sex, and APOE genotype) did not improve the predictive ability of plasma Aβ42/Aβ40, as measured by the AUC score (Table 3).
Implications for reducing reliance on amyloid PET scans
An exploratory analysis was conducted to determine the potential impact of using plasma testing as the primary screening tool for enrollment into a clinical trial similar to the A4 Study. We determined that approximately 6,7000 trial participants would need to have an initial plasma screening in order to identify 1,000 amyloid PET positive participants. No statistically significant differences were observed in the estimated sample size and number needed to screen (NNS) as measured by both analytical platforms used (MALDI or LC-MS/MS). Additional work is ongoing to obtain an understanding of the potential financial savings from the two approaches.
DISCUSSION
Plasma Aβ biomarkers were quantified by two independent laboratories in samples collected from screened, cognitively normal, A4 study participants with brain amyloid PET status determined by central readers. Our findings show that plasma Aβ42/Aβ40 quantified using either of the available MALDI-TOF-MS or LC-MS/MS analytical platforms can predict amyloid PET positivity among asymptomatic participants enrolled in the A4 trial. Blood samples were collected and processed to plasma within 2 h after phlebotomy (Protocol 2) provided a better prediction of amyloid PET status than blood samples that were collected and shipped on cold packs to the laboratory, where they were processed to plasma within 24 h after phlebotomy (Protocol 1). The findings imply that these plasma Aβ42/Aβ40 measures and analytical platforms can be used to pre-screen cognitively normal volunteers for eligibility into AD prevention trials; reduce traditional screen-failure rates; and save time and funds when used to screen for enrollment into prevention trials.
In 224 participant samples that were processed within 24 h, we determined that plasma Aβ42/Aβ40 quantified using the Shimadzu MALDI-TOF-MS platform provided a numerically better AUC = 0.80 than the C2 N LC-MS/MS platform (AUC = 0.76), however these AUC values were not statistically different (p = 0.13). Conversely, the C2 N LC-MS/MS platform provided an AUC = 0.80 for plasma Aβ42/Aβ40 in a subset of 100 participant plasma samples that were processed within 2 h. This was an improvement in AUC that was significantly better than what was achieved in the same 100 participants’ samples that were processed within 24 h (AUC = 0.64). Finally, Shimadzu calculated an additional Composite plasma biomarker that was generated by averaging the normalized scores of APP669–711/Aβ42 and Aβ40/Aβ42 score [19, 23]. With an AUC of 0.82, we determined that measuring the Composite plasma marker could serve as a potential biomarker for predicting elevated brain amyloid, however further investigation is required. Previous studies have reported the combination of APP669-711/Aβ42 ratio and Aβ40/Aβ42 ratio can serve as highly predictive surrogates for brain amyloid pathology [27]. We were not able to compare the biomarker performance of the Composite score between the MALDI-TOF-MS and LC-MS/MS methods as this marker is not measured by the C2 N LC-MS/MS assay.
Plasma Aβ42/Aβ40 performed similarly between the two MS–based methods; however, we observed that the AUCs for plasma Aβ42/Aβ40 ratios were significantly lower than previously published reports (AUC 0.88 –0.97) [21, 27–30]. Moreover, the sensitivity (SN) and specificity (SP) varied significantly across individual plasma amyloid measures and across both analytical platforms. Plasma Aβ42/Aβ40 measures generated by C2 N were highly sensitive (0. 74 –0.92) yet poorly specific (0.56 –0.70) in its ability to identify a participant who was not amyloid PET positive. While plasma Aβ42/Aβ40 measures generated by Shimadzu was highly specific (0.84) yet lack sensitivity (0.67) to identify an amyloid PET positive participant. Given the variance in sensitivity and specificity across both MS-based planforms, its plausible that our data may better interpreted as a measure to screen out those who are amyloid negative versus predicting those who are actually amyloid positive. Rabe and colleagues [31] determined that pre-analytical errors of plasma Aβ42/Aβ40 measures may lead to patient misclassifications (i.e., incorrectly ruling out amyloid pathology or vice versa) thus impacting sensitivity or specificity. As researchers continue to interpret their findings based on AUCs, additional clinical performance measures including the number of false positive and false negative [21] robustness [31–33] and population performance [34] must also need to be considered to support the use of plasma amyloid measures as reliable and accurate biomarkers for AD.
In general, MS-based assays are thought to have superior performance to detect amyloid pathology in brain as compared to immunoassays [35]. Recently, it has been reported that their level of performance as measured by AUC differed substantially among several MS-based and immunoassay-based analytical platforms that quantify plasma Aβ42/Aβ40 concentration ratio and identify brain amyloid status [35]. In particular, the immunoprecipitation LC-MS/MS assay (as performed by Bateman et al.) outperformed seven other analytical assays for detecting plasma Aβ42/Aβ40 [35]. The C2 N LC-MS/MS analytical used herein is based on the Bateman laboratory assay. In addition, some disparities among analytical platform performance observed by Janelidze et al. [35] were attributed to differences in patient cohort characteristics and variations in sample processing. The current study supports prior reports [36] that sample handling procedures prior to analysis can significantly impact the sensitivity and specificity of plasma Aβ42/Aβ40 as biomarker for predicting amyloid PET positivity and this topic requires further investigation.
The interpretation of our data may be further complicated by the imaging protocols used to establish amyloid PET positivity. The existence of multiple imaging tracers with varying amyloid positivity (SUVr) cutoffs could have a direct impact on the ability of plasma Aβ42/Aβ40 to predict amyloid burden in the brain [37, 38]. Clinical trials, including the A4 Study, are opting to use newer generation, FDA approved, 18F-based radioligand tracers, such as florbetapir over the commonly used Pittsburgh compound B (PiB) amyloid tracer for imaging. Florbetapir enables a wider application due it its longer half-life (110 min) as compared to PiB (20 min) [38]. However, studies report that florbetapir-based amyloid measurements had higher variability due to nonspecific white matter deposition in the brain [37]. Because of this, tracers like florbetapir are likely to be less suitable for detecting subtle amyloid deposition in the brain [37, 38]. Future studies are needed to assess how amyloid tracer sensitivity influences the blood amyloid measurements across the spectrum of disease states. Understanding this will be vital for AD prevention trials where subtle amyloid deposition is more likely to occur in CN adults.
Despite age and APOE genotype being considered as risk factors for AD, we determined that these covariates included sex did not improve the ability of plasma Aβ42/Aβ40 to predict amyloid PET positivity. While previous studies have shown significant improvements in the sensitivity of plasma amyloid biomarkers when age, sex, and APOE ɛ4 carrier status are accounted for [19, 21, 29], several others have demonstrated similar results to ours. Keshavan and colleagues demonstrated that sex and APOE ɛ4 carrier status did not improve plasma Aβ42/Aβ40 ability to predict PET amyloid positivity in CN older adults [39] while Yamashita and colleagues [30] observed a slight numerical increase in the performance of the plasma Aβ42/Aβ40 ratio when incorporating the APOE ɛ4 status. Further investigation is required to reconcile these conflicting reports.
One major limitation of the current study is our relatively small sample number and the lack of racial and ethnic diversity among the trial participants. Blacks/African Americans and Hispanics/Latino(s) have a higher prevalence of AD as compared to non-Hispanic whites; yet they are consistently underrepresented in clinical trials for AD and other dementias [40]. A recent cross-sectional study found that blacks, Hispanics, and Asian participants were more likely to be ineligible for the A4 Study after the first screening visit [40]. In our sample, out of the 224 trial participants we analyzed, only 14 (9%) screened participants belonged to a minoritized ethnic group. Given that our data was generated from a relatively homogenous population, this may explain why our covariate analysis did not show any significant differences in AUC. Recent observational studies have revealed notable differences in the performance of AD biomarkers among different racial groups [41–43], therefore it is imperative that efforts are made to increase the diversity among trial participants. We anticipate that blood testing will increase accessibility to diverse minority and socioeconomic groups as well as improve screening and retention of trial participants [44].
In summary, our work and work of several others [21, 27–30] determined that plasma Aβ42/Aβ40 may serve as a potential biomarker for predicting elevated brain amyloid in cognitively normal adults. Additionally, the combination of APP669-711/Aβ42 ratio and Aβ42/Aβ40 ratio may also serve as predictive surrogate for brain amyloid pathology as more studies are investigating a multi-biomarker approach for predicting cognitive decline and amyloid PET positivity [45]. Plasma p-tau181/Aβ1 - 42 ratio [46] and t p-tau 217 [47] has recently emerged as alternative biomarker for predicting cognitive decline and amyloid PET positivity. A head-to-head comparison is necessary to determine which biomarker would be the most effective at predicting cognitive decline and amyloid PET positivity in older, CN adults.
Lastly, our exploratory analysis reveals the potential savings associated with using a blood test as a screening tool for enrollment into secondary prevention clinical trials like the A4 Study. Previous analysis has suggested that a blood test can reduce the use of amyloid PET scans by 50%[39]; however, future studies are still needed to understand how sample APOE status, race and ethnicity, and amyloid tracer sensitivity impacts plasma Aβ42/Aβ40 ability to predict amyloid brain pathology in normal controls.
ACKNOWLEDGMENTS
The authors have no acknowledgments to report.
FUNDING
This work was supported by NIH/NIA R01 grants AG058252, AG073979, and AG051848 to RAR and biomarker core funds to RAR from AG057437 (USC ACTC), AG010483 (UCSD ADCS), and AG062429 (UCSD ADRC). Biomarker assays in Japan were supported by AMED under Grant Number 18dk0207027h0003.
CONFLICT OF INTEREST
Kevin Yarasheski and Tim West are employees of C2 N Diagnostics.
Colin L. Masters and Robert A. Rissman are Editorial Board members of this journal but were not involved in the peer-review process nor had access to any information regarding its peer-review.
All other authors have no conflict of interest to report.
DATA AVAILABILITY
The datasets used and/or analyzed during the current study are available on request. Please contact the corresponding author for access to all datasets for re-analysis.
References
[1] | ((2021) ) 2021 Alzheimer’s disease facts and figures. Alzheimers Dement 17: , 327–406. |
[2] | Dubois B , Feldman HH , Jacova C , Dekosky ST , Barberger-Gateau P , Cummings J , Delacourte A , Galasko D , Gauthier S , Jicha G , Meguro K , O’brien J , Pasquier F , Robert P , Rossor M , Salloway S , Stern Y , Visser PJ , Scheltens P ((2007) ) Research criteria for the diagnosis of Alzheimer’s disease: Revising the NINCDS-ADRDA criteria. .Lancet Neurol 6: , 734–746. |
[3] | Donohue MC , Sperling RA , Petersen R , Sun CK , Weiner MW , Aisen PS , Initiative AsDN ((2017) ) Association between elevated brain amyloid and subsequent cognitive decline among cognitively normal persons. JAMA 317: , 2305–2316. |
[4] | Mormino EC , Papp KV , Rentz DM , Donohue MC , Amariglio R , Quiroz YT , Chhatwal J , Marshall GA , Donovan N , Jackson J , Gatchel JR , Hanseeuw BJ , Schultz AP , Aisen PS , Johnson KA , Sperling RA ((2017) ) Early and late change on the preclinical Alzheimer’s cognitive composite in clinically normal older individuals with elevated amyloid β. .Alzheimers Dement 13: , 1004–1012. |
[5] | Petersen RC , Wiste HJ , Weigand SD , Rocca WA , Roberts RO , Mielke MM , Lowe VJ , Knopman DS , Pankratz VS , Machulda MM , Geda YE , Jack CR ((2016) ) Association of elevated amyloid levels with cognition and biomarkers in cognitively normal people from the community. .JAMA Neurol 73: , 85–92. |
[6] | Blennow K , Dubois B , Fagan AM , Lewczuk P , de Leon MJ , Hampel H ((2015) ) Clinical utility of cerebrospinal fluid biomarkers in the diagnosis of early Alzheimer’s disease. .Alzheimers Dement 11: , 58–69. |
[7] | Ray S , Britschgi M , Herbert C , Takeda-Uchimura Y , Boxer A , Blennow K , Friedman LF , Galasko DR , Jutel M , Karydas A , Kaye JA , Leszek J , Miller BL , Minthon L , Quinn JF , Rabinovici GD , Robinson WH , Sabbagh MN , So YT , Sparks DL , Tabaton M , Tinklenberg J , Yesavage JA , Tibshirani R , Wyss-Coray T ((2007) ) Classification and prediction of clinical Alzheimer’s diagnosis based on plasma signaling proteins.Nat Med 13: , 1359–1362. |
[8] | Laske C , Sohrabi HR , Frost SM , López-de-Ipiña K , Garrard P , Buscema M , Dauwels J , Soekadar SR , Mueller S , Linnemann C , Bridenbaugh SA , Kanagasingam Y , Martins RN , O’Bryant SE ((2015) ) Innovative diagnostic tools for early detection of Alzheimer’sdisease.Alzheimers Dement 11: , 561–578. |
[9] | Henriksen K , O’Bryant SE , Hampel H , Trojanowski JQ , Montine TJ , Jeromin A , Blennow K , Lönneborg A , Wyss-Coray T , Soares H , Bazenet C , Sjögren M , Hu W , Lovestone S , Karsdal MA , Weiner MW , Group B-BBI ((2014) ) The future of blood-based biomarkers for Alzheimer’s disease.Alzheimers Dement 10: , 115–131. |
[10] | O’Bryant SE , Edwards M , Johnson L , Hall J , Villarreal AE , Britton GB , Quiceno M , Cullum CM , Graff-Radford NR ((2016) ) A blood screening test for Alzheimer’s disease. .Alzheimers Dement (Amst) 3: , 83–90. |
[11] | Lopez OL , Klunk WE , Mathis CA , Snitz BE , Chang Y , Tracy RP , Kuller LH ((2020) ) Relationship of amyloid-β1-42 in blood and brain amyloid: Ginkgo Evaluation of Memory Study.Brain Commun 2: , fcz038. |
[12] | Reiman EM , Mattke S , Kordower JH , Khachaturian ZS , Khachaturian AS ((2022) ) Developing a pathway to support the appropriate, affordable, and widespread use of effective Alzheimer’s prevention drugs. .Alzheimers Dement 18: , 7–9. |
[13] | Doody RS , Thomas RG , Farlow M , Iwatsubo T , Vellas B , Joffe S , Kieburtz K , Raman R , Sun X , Aisen PS , Siemers E , Liu-Seifert H , Mohs R , Alzheimer’s.Disease Cooperative Study Steering Committee Solanezumab Study Group ((2014) )Phase 3 trials of solanezumab for mild-to-moderate Alzheimer’s disease.N Engl J Med 370: , 311–321. |
[14] | Sperling RA , Donohue MC , Raman R , Sun CK , Yaari R , Holdridge K , Siemers E , Johnson KA , Aisen PS , Team AS ((2020) ) Association of factors with elevated amyloid burden in clinically normal older individuals.JAMA Neurol 77: , 735–745. |
[15] | O’Bryant SE , Xiao G , Barber R , Huebinger R , Wilhelmsen K , Edwards M , Graff-Radford N , Doody R , Diaz-Arrastia R , Texas Alzheimer’s Research & Care Consortium; Alzheimer’s Disease Neuroimaging Initiative((2011) ) A blood-based screening tool for Alzheimer’s disease that spans serum and plasma: Findings from TARC and ADNI.PLoS One 6: , e28092. |
[16] | Winston CN , Goetzl EJ , Akers JC , Carter BS , Rockenstein EM , Galasko D , Masliah E , Rissman RA ((2016) ) Prediction of conversion from mild cognitive impairment to dementia with neuronally derived blood exosome protein profile.Alzheimers Dement (Amst) 3: , 63–72. |
[17] | Fiandaca MS , Kapogiannis D , Mapstone M , Boxer A , Eitan E , Schwartz JB , Abner EL , Petersen RC , Federoff HJ , Miller BL , Goetzl EJ ((2015) ) Identification of preclinical Alzheimer’s disease by a profile of pathogenic proteins in neurally derived blood exosomes: A case-control study.Alzheimers Dement 11: , 600–607 e601. |
[18] | Schindler SE , Bollinger JG , Ovod V , Mawuenyega KG , Li Y , Gordon BA , Holtzman DM , Morris JC , Benzinger TLS , Xiong C , Fagan AM , Bateman RJ ((2019) ) High-precision plasma β-amyloid 42/40 predicts current and future brain amyloidosis.Neurology 93: , e1647–e1659. |
[19] | Nakamura A , Kaneko N , Villemagne VL , Kato T , Doecke J , Doré V , Fowler C , Li QX , Martins R , Rowe C , Tomita T , Matsuzaki K , Ishii K , Arahata Y , Iwamoto S , Ito K , Tanaka K , Masters CL , Yanagisawa K ((2018) ) High performance plasma amyloid-β biomarkers forAlzheimer’s disease.Nature 554: ,249–254. |
[20] | Fandos N , Pérez-Grijalba V , Pesini P , Olmos S , Bossa M , Villemagne VL , Doecke J , Fowler C , Masters CL , Sarasa M , Group AR ((2017) ) Plasma amyloid β 42/40 ratios as biomarkers foramyloid β cerebral deposition in cognitively normal individuals.Alzheimers Dement (Amst) 8: , 179–187. |
[21] | Hu Y , Kirmess KM , Meyer MR , Rabinovici GD , Gatsonis C , Siegel BA , Whitmer RA , Apgar C , Hanna L , Kanekiyo M , Kaplow J , Koyama A , Verbel D , Holubasch MS , Knapik SS , Connor J , Contois JH , Jackson EN , Harpstrite SE , Bateman RJ , Holtzman DM , Verghese PB , Fogelman I , Braunstein JB , Yarasheski KE , West T ((2022) ) Assessment of a plasma amyloid probability score to estimate amyloid positron emission tomography findings among adults with cognitive impairment.JAMA Netw Open 5: , e228392. |
[22] | West T , Kirmess KM , Meyer MR , Holubasch MS , Knapik SS , Hu Y , Contois JH , Jackson EN , Harpstrite SE , Bateman RJ , Holtzman DM , Verghese PB , Fogelman I , Braunstein JB , Yarasheski KE ((2021) ) A blood-based diagnostic test incorporating plasma Aβ42/40 ratio, ApoE proteotype, and age accurately identifies brain amyloid status: Findings from a multi cohort validity analysis.Mol Neurodegener 16: , 30. |
[23] | Lim YY , Maruff P , Kaneko N , Doecke J , Fowler C , Villemagne VL , Kato T , Rowe CC , Arahata Y , Iwamoto S , Ito K , Tanaka K , Yanagisawa K , Masters CL , Nakamura A ((2020) ) Plasma amyloid-β biomarker associated with cognitive decline in preclinical Alzheimer’s disease.J Alzheimers Dis 77: , 1057–1065. |
[24] | Sun X , Xu W ((2014) ) Fast implementation of DeLong’s algorithm for comparing the areas under correlated receiver operating characteristic curves.IEEE Signal Process Lett 21: , 1389–1393. |
[25] | DeLong ER , DeLong DM , Clarke-Pearson DL ((1988) ) Comparing the areas under two or more correlated receiver operating characteristic curves: A nonparametric approach.Biometrics 44: , 837–845. |
[26] | Skaltsa K , Jover L , Carrasco JL ((2010) ) Estimation of the diagnostic threshold accounting for decision costs and sampling uncertainty.Biom J 52: , 676–697. |
[27] | Kaneko N , Nakamura A , Washimi Y , Kato T , Sakurai T , Arahata Y , Bundo M , Takeda A , Niida S , Ito K , Toba K , Tanaka K , Yanagisawa K ((2014) ) Novel plasma biomarker surrogating cerebral amyloid deposition.Proc Jpn Acad Ser B Phys Biol Sci 90: , 353–364. |
[28] | Vergallo A , Mégret L , Lista S , Cavedo E , Zetterberg H , Blennow K , Vanmechelen E , De Vos A , Habert MO , Potier MC , Dubois B , Neri C , Hampel H INSIGHT-preAD study group; Alzheimer Precision Medicine Initiative (APMI)((2019) ) Plasma amyloid β 40/42 ratiopredicts cerebral amyloidosis in cognitively normal individuals atrisk for Alzheimer’s disease.Alzheimers Dement 15: , 764–775. |
[29] | Doecke JD , Pérez-Grijalba V , Fandos N , Fowler C , Villemagne VL , Masters CL , Pesini P , Sarasa M , AIBL Research Group ((2020) ) TotalAβ42/Aβ40 ratio in plasma predicts amyloid-PETstatus, independent of clinical AD diagnosis.Neurology 94: , e1580–e1591. |
[30] | Yamashita K , Miura M , Watanabe S , Ishiki K , Arimatsu Y , Kawahira J , Kubo T , Sasaki K , Arai T , Hagino K , Irino Y , Nagai K , Verbel D , Koyama A , Dhadda S , Niiro H , Iwanaga S , Sato T , Yoshida T , Iwata A ((2022) ) Fully automated and highly specific plasma β-amyloid immunoassays predict β-amyloid status defined by amyloid positron emission tomography with high accuracy.Alzheimers Res Ther 14: , 86. |
[31] | Rabe C , Bittner T , Jethwa A , Suridjan I , Manuilova E , Friesenhahn M , Stomrud E , Zetterberg H , Blennow K , Hansson O , Alzheimer’s Disease Neuroimaging Initiative†and the Swedish BioFINDER study (2022) Clinical performance and robustness evaluation of plasma amyloid-β. Alzheimers Dement, doi: 10.1002/alz.12801. |
[32] | Benedet AL , Brum WS , Hansson O , Karikari TK , Zimmer ER , Zetterberg H , Blennow K , Ashton NJ , Alzheimer’s Disease Neuroimaging Initiative ((2022) ) The accuracy and robustness of plasma biomarker models for amyloid PET positivity.Alzheimers Res Ther 14: , 26. |
[33] | Simrén J , Leuzy A , Karikari TK , Hye A , Benedet AL , Lantero-Rodriguez J , Mattsson-Carlgren N , Schöll M , Mecocci P , Vellas B , Tsolaki M , Kloszewska I , Soininen H , Lovestone S , Aarsland D , Hansson O , Rosa-Neto P , Westman E , Blennow K , Zetterberg H , Ashton NJ ((2021) ) The diagnostic and prognostic capabilities ofplasma biomarkers in Alzheimer’s disease.Alzheimers Dement 17: , 1145–1156. |
[34] | Pepe MS , Feng Z , Huang Y , Longton G , Prentice R , Thompson IM , Zheng Y ((2008) ) Integrating the predictiveness of a marker with its performance as a classifier.Am J Epidemiol 167: , 362–368. |
[35] | Janelidze S , Teunissen CE , Zetterberg H , Allué JA , Sarasa L , Eichenlaub U , Bittner T , Ovod V , Verberk IMW , Toba K , Nakamura A , Bateman RJ , Blennow K , Hansson O ((2021) ) Head-to-head comparison of 8 plasma amyloid-β 42/40 assays in Alzheimer disease.JAMA Neurol78: ,1375–1382. |
[36] | Verberk IMW , Misdorp EO , Koelewijn J , Ball AJ , Blennow K , Dage JL , Fandos N , Hansson O , Hirtz C , Janelidze S , Kang S , Kirmess K , Kindermans J , Lee R , Meyer MR , Shan D , Shaw LM , Waligorska T , West T , Zetterberg H , Edelmayer RM , Teunissen CE ((2021) ) Characterization of pre-analytical sample handling effects on a panel of Alzheimer’s disease-related blood-based biomarkers: Results from the Standardization of Alzheimer’s Blood Biomarkers (SABB) working group.Alzheimers Dement 18: , 1484–1497. |
[37] | Su Y , Flores S , Wang G , Hornbeck RC , Speidel B , Joseph-Mathurin N , Vlassenko AG , Gordon BA , Koeppe RA , Klunk WE , Jack CR , Farlow MR , Salloway S , Snider BJ , Berman SB , Roberson ED , Brosch J , Jimenez-Velazques I , van Dyck CH , Galasko D , Yuan SH , Jayadev S , Honig LS , Gauthier S , Hsiung GR , Masellis M , Brooks WS , Fulham M , Clarnette R , Masters CL , Wallon D , Hannequin D , Dubois B , Pariente J , Sanchez-Valle R , Mummery C , Ringman JM , Bottlaender M , Klein G , Milosavljevic-Ristic S , McDade E , Xiong C , Morris JC , Bateman RJ , Benzinger TLS ((2019) ) Comparison of Pittsburgh compound B and florbetapir in cross-sectional and longitudinal studies.Alzheimers Dement (Amst) 11: , 180–190. |
[38] | Suppiah S , Didier MA , Vinjamuri S ((2019) ) The who, when, why, and how of PET amyloid imaging in management of Alzheimer’s disease-review of literature and interesting images.Diagnostics (Basel) 9: ,65. |
[39] | Keshavan A , Pannee J , Karikari TK , Rodriguez JL , Ashton NJ , Nicholas JM , Cash DM , Coath W , Lane CA , Parker TD , Lu K , Buchanan SM , Keuss SE , James SN , Murray-Smith H , Wong A , Barnes A , Dickson JC , Heslegrave A , Portelius E , Richards M , Fox NC , Zetterberg H , Blennow K , Schott JM ((2021) ) Population-based blood screening for preclinical Alzheimer’s disease in a British birth cohort at age 70.Brain 144: , 434–449. |
[40] | Raman R , Quiroz YT , Langford O , Choi J , Ritchie M , Baumgartner M , Rentz D , Aggarwal NT , Aisen P , Sperling R , Grill JD ((2021) ) Disparities by race and ethnicity among adults recruited for a preclinical Alzheimer disease trial.JAMA Netw Open 4: , e2114364. |
[41] | Howell JC , Watts KD , Parker MW , Wu J , Kollhoff A , Wingo TS , Dorbin CD , Qiu D , Hu WT ((2017) ) Race modifies the relationship between cognition and Alzheimer’s disease cerebrospinal fluid biomarkers.Alzheimers Res Ther 9: , 88. |
[42] | Morris JC , Schindler SE , McCue LM , Moulder KL , Benzinger TLS , Cruchaga C , Fagan AM , Grant E , Gordon BA , Holtzman DM , Xiong C ((2019) ) Assessment of racial disparities in biomarkers for Alzheimer disease.JAMA Neurol 76: , 264–273. |
[43] | Garrett SL , McDaniel D , Obideen M , Trammell AR , Shaw LM , Goldstein FC , Hajjar I ((2019) ) Racial disparity in cerebrospinal fluid amyloid and tau biomarkers and associated cutoffs for mild cognitive impairment.JAMA Netw Open 2: , e1917363. |
[44] | Manzine PR , Vatanabe IP , Peron R , Grigoli MM , Pedroso RV , Nascimento CMC , Cominetti MR ((2020) ) Blood-based biomarkers of Alzheimer’s disease: The long and winding road.Curr Pharm Des 26: , 1300–1315. |
[45] | Lu WH , Giudici KV , Morley JE , Guyonnet S , Parini A , Aggarwal G , Nguyen AD , Li Y , Bateman RJ , Vellas B , de Souto Barreto P , Group MD ((2022) ) Investigating the combination of plasma amyloid-beta and geroscience biomarkers on the incidence of clinically meaningful cognitive decline in older adults.Geroscience 44: , 1489–1503. |
[46] | Fowler CJ , Stoops E , Rainey-Smith SR , Vanmechelen E , Vanbrabant J , Dewit N , Mauroo K , Maruff P , Rowe CC , Fripp J , Li QX , Bourgeat P , Collins SJ , Martins RN , Masters CL , Doecke JD ((2022) ) Plasma p-tau181/Aβ1-42 ratio predicts Aβ-PET status and correlates with CSF-p-tau181/Aβ1-42 and future cognitive decline. Alzheimers Dement (Amst) 14: , e12375. |
[47] | Milà-Alomà M , Ashton NJ , Shekari M , Salvadó G , Ortiz-Romero P , Montoliu-Gaya L , Benedet AL , Karikari TK , Lantero-Rodriguez J , Vanmechelen E , Day TA , González-EscalanteA , Sánchez-Benavides G , Minguillon C , Fauria K , Molinuevo JL , Dage JL , Zetterberg H , Gispert JD , Suárez-Calvet M , Blennow K ((2022) ) Plasma p-tau231 and p-tau217 as state markers ofamyloid-β pathology in preclinical Alzheimer’s disease.Nat Med 28: , 1797–1801. |


