
Can T1-Weighted Magnetic Resonance Imaging Significantly Improve Mini-Mental State Examination-Based Distinguishing Between Mild Cognitive Impairment and Early-Stage Alzheimer’s Disease?
Abstract
Background:
Detecting early-stage Alzheimer’s disease (AD) is still problematic in clinical practice. This work aimed to find T1-weighted MRI-based markers for AD and mild cognitive impairment (MCI) to improve the screening process.
Objective:
Our assumption was to build a screening model that would be accessible and easy to use for physicians in their daily clinical routine.
Methods:
The multinomial logistic regression was used to detect status: AD, MCI, and normal control (NC) combined with the Bayesian information criterion for model selection. Several T1-weighted MRI-based radiomic features were considered explanatory variables in the prediction model.
Results:
The best radiomic predictor was the relative brain volume. The proposed method confirmed its quality by achieving a balanced accuracy of 95.18%, AUC of 93.25%, NPV of 97.93%, and PPV of 90.48% for classifying AD versus NC for the European DTI Study on Dementia (EDSD). The comparison of the two models: with the MMSE score only as an independent variable and corrected for the relative brain value and age, shows that the addition of the T1-weighted MRI-based biomarker improves the quality of MCI detection (AUC: 67.04% versus 71.08%) while maintaining quality for AD (AUC: 93.35% versus 93.25%). Additionally, among MCI patients predicted as AD inconsistently with the original diagnosis, 60% from ADNI and 76.47% from EDSD were re-diagnosed as AD within a 48-month follow-up. It shows that our model can detect AD patients a few years earlier than a standard medical diagnosis.
Conclusion:
The created method is non-invasive, inexpensive, clinically accessible, and efficiently supports AD/MCI screening.
INTRODUCTION
Alzheimer’s disease (AD) is a progressive, neurodegenerative brain disease that causes memory loss, changes in behavior, and problems with everyday tasks. AD is the most common form of dementia and is responsible for 60% to 80% of dementia cases [1, 2]. The intermediate stage from normal cognition to dementia is mild cognitive impairment (MCI). People suffering from MCI have a high rate of progression to dementia over a relatively short period, but not everyone will develop AD [3]. Within a 3-year follow-up period, about 35% of patients with MCI status progress to AD or dementia [4]. A yearly conversion rate equals 5% –10% [4].
2pt
Early detection of AD and MCI is crucial because a patient can start treatment to alleviate the symptoms of the disease, teach how to live with this disease or take part in medical trials.
This work aims to find easily accessible biomarkers for AD and MCI to improve the screening process. The screening should be fast, not expensive, available in daily medical practice and easy to use by physicians. An additional challenge is to predict the diagnosis of AD while a patient is still mildly cognitively impaired.
Many different methods to predict the diagnosis have been proposed in recent years. These methods are based on machine learning algorithms [5–13], regression models [4, 14–18], and other methods [19–24]. Many different biomarkers are used to classify AD and MCI. The first group of biomarkers is based on structural brain atrophy obtained from magnetic resonance imaging (MRI) [7–9, 13]. The second group of biomarkers uses the evaluation of brain metabolic changes, measured by fluorodeoxyglucose positron emission tomography (FDG-PET) imaging [25, 26]. Fluid biomarkers are the third group, and this is connected with amyloid and tau obtained from cerebrospinal fluid (CSF) [6, 10, 27]. Moreover, diffusion tensor imaging (DTI) and functional MRI (fMRI) are also applied for the detection of AD and MCI [5, 6, 28, 29]. Most studies use multiple biomarkers in the early diagnosis of AD and MCI and are based on a combination of two or more following biomarkers: MRI-based biomarkers, fluid biomarkers or PET-based markers [5, 6, 10, 24, 30]. The availability of all three biomarkers (PET and CSF and MRI or DTI or fMRI) is limited due to the cost, time, and invasiveness of the methods (PET and CSF) [24, 31].
This article presents a method that improves an MCI and AD screening process based on easily accessible clinical biomarkers like age and Mini-Mental State Examination score (MMSE) [32], available in medical history for almost every patient with suspicion of dementia. Our approach strength is the lack of use of additional biomarkers based on blood, CSF, PET, or other advanced imaging techniques. We suggest using the T1-weighted MRI-based disease progression radiological biomarkers in addition to those clinical predictors to support the screening process. In patients suffering from AD, the brain shrinks, and the space filled with CSF increases [33, 34]. Moreover, this brain shrinkage causes the brain to be more wrinkled. It means that sulci are noticeably widened, and gyri are narrowed. Considering the cross-section of a brain, we can notice that the shrinking causes the contour of the brain tissue becomes longer. Because of that, we consider the relative brain volume and global measure of brain wrinkling (shrinkage factor, which is defined below) as imaging biomarkers. First, the cross-section of the brain with CSF and brain tissue already segmented were considered. Because of the properties of MRI, where the cubical voxel represents the volume unit, the brain surface can be quantified and approximated by the area of chosen voxel faces. Then, using the gradient method applied to the segmented brain tissue, we can identify the contour of brain tissue for a particular cross-section and calculate the area of the brain surface related to the particular cross-section by multiplying the length of the brain outline by the voxel face area.
T1-weighted MRI is standard medical imaging, not as expensive as PET or FDG-PET, not invasive, and it is easily available, so this MRI-based biomarker is perfect for supporting the screening process.
MATERIALS AND METHODS
Data used in the study were obtained from the Alzheimer’s Disease Neuroimaging Initiative (ADNI) database (http://adni.loni.usc.edu) and The European DTI Study on Dementia (EDSD). The ADNI was launched in 2003 as a public-private partnership led by Principal Investigator Michael W. Weiner, MD. The primary goal of ADNI has been to test whether serial MRI, PET, other biological markers, and clinical and neuropsychological assessment can be combined to measure the progression of MCI and early AD. For up-to-date information, see http://www.adni-info.org. The EDSD is a multicenter framework created to study the diagnostic accuracy and inter-site variability of DTI-derived markers in patients with manifest and prodromal AD [35].
The standard analysis dataset of the ADNI-1 project was used (collection name: ADNI1: Complete 1Yr 1.5T; subjects who have both 6- and 12-month scans available) to build a statistical model for predicting AD or MCI status [36]. This dataset was randomly split into five subsets to conduct internal testing and 5-Fold Cross-Validation [37]. In the second stage, the final statistical model was built on the whole dataset, and that model was tested on the independent dataset from the EDSD database. The dataset of the ADNI-1 project includes MPRAGE T1-weighted 3D scans (1.5 T) and several clinical and neuropsychological measures acquired from healthy controls (NC), MCI subjects, and AD.
The second dataset used in the analysis comes from the EDSD database [35]. The EDSD was started in 2010. The coordinator of this database is the German Center for Neurodegenerative Diseases (DZNE) in Rostock, Germany. Since 2013, the EDSD has also collected the data of subjects with MCI. The dataset used in the preparation of this article includes data from subjects who were marked as “not dropout".
Our analysis was based on a T1-weighted MRI. ADNI and EDSD subjects were scanned on General Electric (GE) scanners, Siemens scanners and Philips scanners. Supplementary Tables 1 and 2 show details of scanners used in ADNI and EDSD, respectively [35, 38].
ADNI dataset (dataset 1) is a reference dataset, and the EDSD dataset (dataset 2) is an independent validation dataset. Its experimental design and patient clinical characteristics are similar to the ADNI’s and are available on the project website. Additionally, the EDSD dataset was divided into two subsets related to MRI scanning options: 1.5T and 3T.
For the ADNI study, general inclusion/exclusion criteria are as follows:
1. Normal subjects: MMSE scores between 24–30 (inclusive), a CDR of 0, non-depressed, non-MCI, and non-demented.
2. MCI subjects: MMSE scores between 24–30 (inclusive), a memory complaint, objective memory loss measured by education-adjusted scores on Wechsler Memory Scale 7 Logical Memory II, a CDR of 0.5, absence of significant levels of impairment in other cognitive domains, essentially preserved activities of daily living and an absence of dementia.
3. AD subjects: MMSE scores between 20–26 (inclusive), CDR of 0.5 or 1.0, and meeting NINCDS/ADRDA criteria for probable AD [39].
ADNI provided intensity normalized and gradient un-warped T1 image volumes [36]. The EDSD native data were used, and N4 bias field correction in the N4ITK framework was applied [40]. For both datasets: ADNI and EDSD, skull stripping was achieved in the SPM 12 software package (https://www.fil.ion.ucl.ac.uk/spm/) [41].
The clinical characteristics of subjects from the ADNI and EDSD datasets were summarized by the diagnostic group (NC, MCI, AD) and presented in Table 1. The following variables were considered at baseline: age, sex, MMSE, and years of education. For quantitative measures, values of mean and SD were calculated, and for categorical variables, the percentage was presented. The comparisons between groups were conducted using the nonparametric Kruskal-Wallis test for quantitative measures (the Conover test was used in the post-hoc analysis), and the χ2 test to compare proportions and p-value is presented in Table 1. Additionally, Table 1 contains effect size η2 (eta-squared) with 95% confidence interval [42, 43].
Table 1
Clinical characteristics of the ANDI and EDSD dataset
| Characteristic | NC | MCI | AD | Unadjusted p value | Effect size η2 [95% CI] |
| ADNI, n | 194 | 311 | 133 | – | – |
| Age, mean (SD) [y] | 75.9 (5.08) | 74.9 (7.06) | 74.7 (7.59) | 0.4643* | 0.0053 [0; 0.0199] |
| Education, mean (SD) [y] | 16.0 (2.79) | 15.7 (3.00) | 14.7 (3.11) | 0.0003* 0.0004† <0.0001‡ | 0.0253 [0.0057; 0.0523] |
| MMSE score, mean (SD) | 29.1 (1.03) | 27.0 (1.78) | 23.5 (1.91) | <0.0001* <0.0001†‡§ | 0.6023 [0.5581; 0.6387] |
| Female [% ] | 47.9 | 35.4 | 48.1 | 0.0053 | – |
| EDSD, n | 194 | 152 | 136 | – | – |
| Age, mean (SD), [y] | 68.7 (5.90) | 71.2 (6.76) | 72.4 (8.28) | <0.0001* 0.0001‡ <0.0001§ | 0.0497 [0.0170; 0.0900] |
| Education, mean (SD), [y] | 13.1 (3.67) n = 173 | 12.4 (3.35) n = 132 | 10.3 (3.33) n = 134 | <0.0001* <0.0001†‡ | 0.1036 [0.0538; 0.1572] |
| MMSE score, mean (SD) | 27.4 (6.49) | 26.3 (3.14) | 20.8 (5.36) | <0.0001* <0.0001†‡§ | 0.2198 [0.1569; 0.2793] |
| Female [% ] | 51.0 | 43.4 | 56.6 | 0.07854 | – |
*Kruskal-Wallis rank sum test; †Conover test: AD versus MCI; ‡Conover test: AD versus NC; §Conover test: MCI versus NC.
Segmentation of CSF was conducted for each subject separately using the adjusted MiMSeg algorithm [44]. This procedure was based on the Gaussian mixture model and allowed us to separate CSF from the brain by finding the threshold on the greyscale.
Two additional descriptors were defined based on T1-weighted MRI scans to numerically represent the changes in the brain structure. The first variable (called ‘relative brain volume’ (RBV) and shown as a percentage) was defined as the volume of the brain without CSF (V - CSF) divided by the volume of the whole brain (V) multiplied by 100% :
(1)
The second variable is the shrinkage factor (SF). The shrinkage factor was defined as the number of voxels on the surface of the brain without CSF multiplied by the face area of the voxel (S - CSF) with reference to the volume of the brain without CSF (V - CSF) and multiplied by 100% :
(2)
The additional descriptor is the volume of lateral ventricles. The Automatic Lateral Ventricle delineatioN (ALVIN) algorithm was used to obtain the volume of lateral ventricles. ALVIN is a fully automated algorithm to segment the lateral ventricles from MRI images (ALVIN works within SPM8) [45].
Multinomial logistic regression was used to predict disease status. The following independent variables were considered: age, sex, years of education, MMSE score, relative brain volume, shrinkage factor, and volume of lateral ventricles. The dependent variable was disease status: AD, MCI, and NC (reference status). Models with two-way interaction terms were also analyzed. A 5-fold cross-validation was executed. The Bayesian information criterion (BIC) was used to select the best model [46]. The comparison between two nested models was conducted using ANOVA. Additionally, the Bayes factor (exp(ΔBIC)) was calculated for two compared models. A maximum likelihood estimation procedure estimated the parameters of a multinomial logistic regression (polytomous) model. For coefficient values, the adjusted odds ratio was calculated with its 95% confidence interval according to the method proposed by Woolf [47]. The receiver operating characteristic curve (ROC), together with the area under the curve (AUC) for the classification problem, were estimated for both datasets [48].
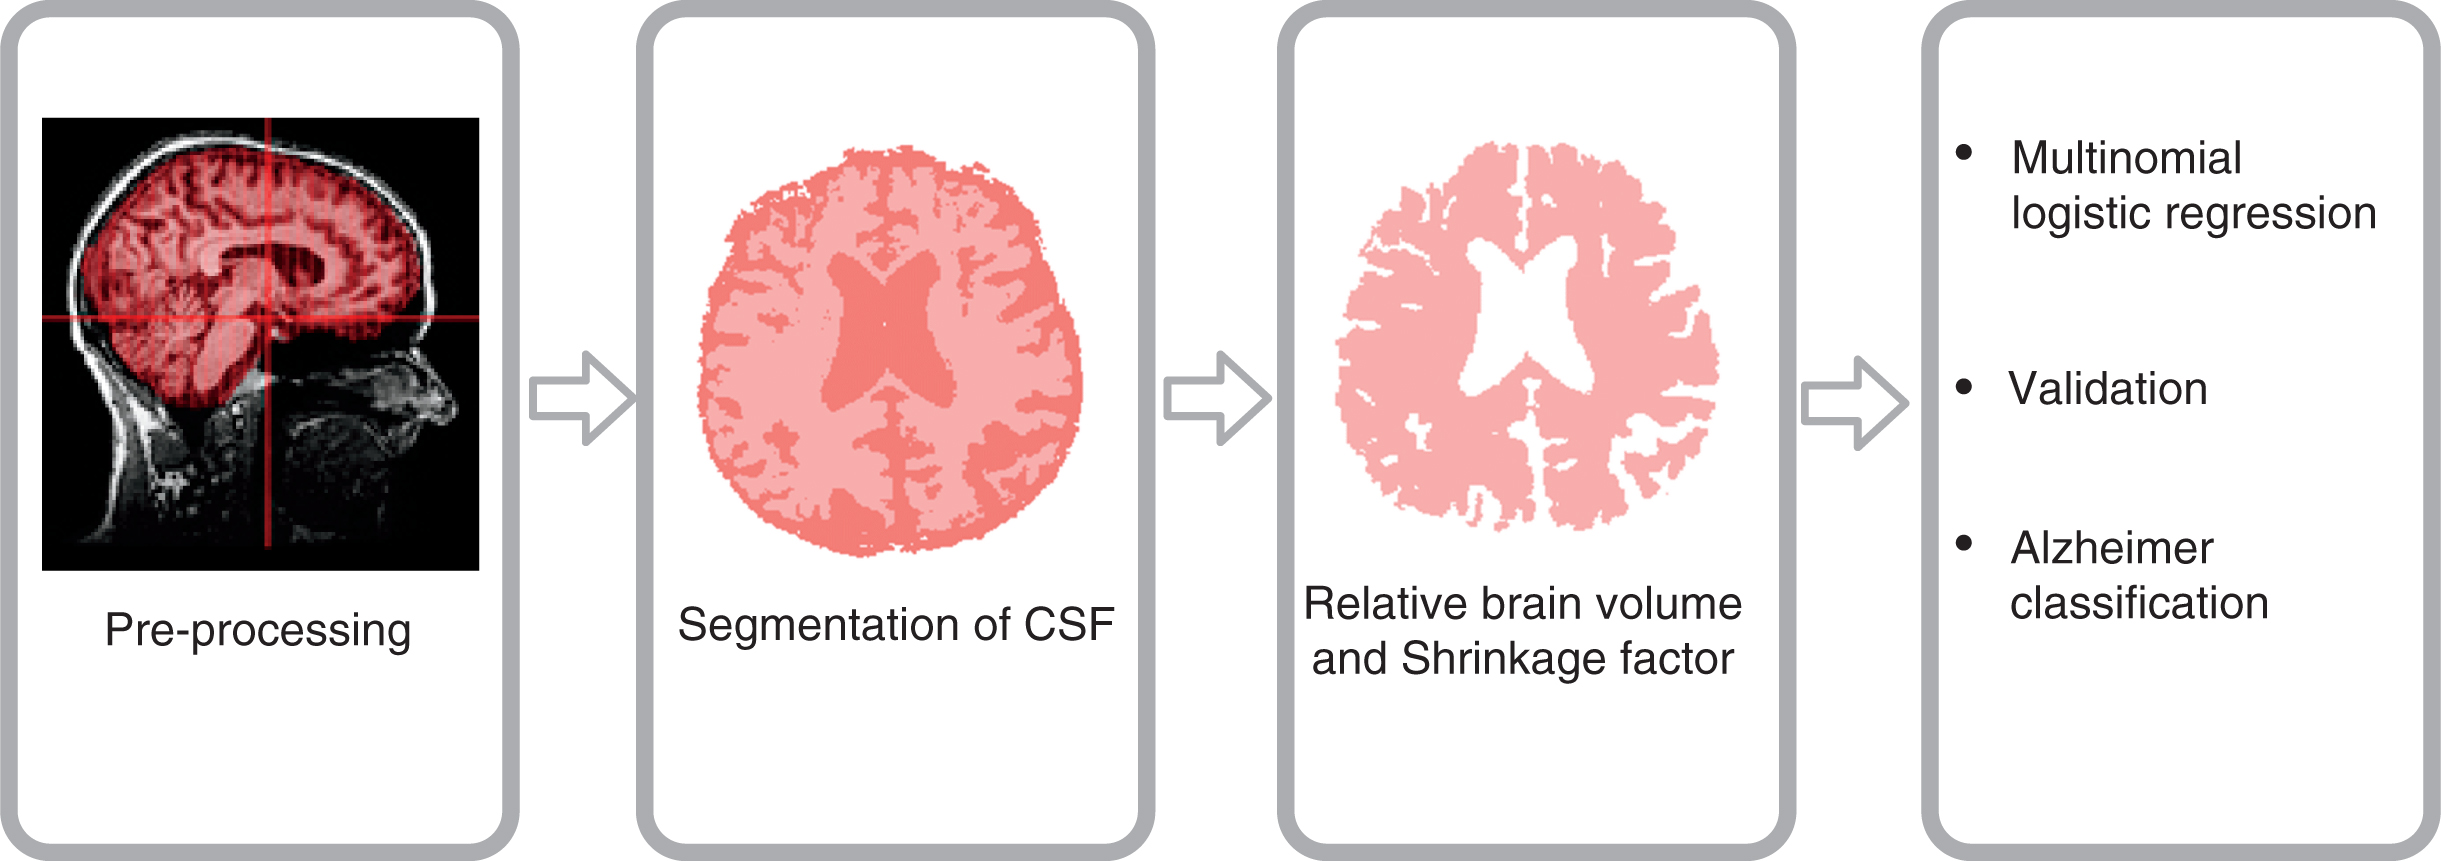
The scheme of key steps conducted during data analysis is presented in Fig. 1 (Supplementary Figure 1 shows detailed information).
Fig. 1
The scheme of key steps of data preprocessing and data analysis.
3RESULTS
The tests on ADNI clinical characteristics indicate that the differences between at least two medians are statistically significant for the following variables: years of education and MMSE score. For the independent EDSD dataset, the differences between at least two medians are statistically significant for all variables: age, years of education, and MMSE score. The effect size of age is very small for both datasets, ADNI and EDSD. The effect size of education is small for ADNI and medium for EDSD, and the effect size of the MMSE score is large for ADNI and very large for EDSD. Results of the χ2 test inform that the null hypothesis, stating that the proportion of females is the same in NC, MCI, and AD, should be rejected for ANDI but not for the independent EDSD dataset.
For all cross-validation analyses, the final model has the same structure. Disease status was best predicted by the synergy of relative brain volume, MMSE score, and age, where age has a corrective function. A comparison between the model without relative brain volume and age as predictors (only MMSE was taken into account) and the model with the relative brain volume and age added showed the statistical significance of the differences (p < 0.00001; BIC = 785.54 for the model with versus BIC = 809.68 for the model without relative brain volume and age). The value of the Bayes factor for compared models is 132646731.7, which indicates very strong evidence for the model. No interaction increases the model performance quality.
Supplementary Table 3 presents average values of coefficients (with a 95% confidence interval) obtained in 5-fold cross-validation. NC is a reference group.
For each predictor, the adjusted odds ratio was calculated (see Supplementary Table 4). For each one percentage point decrease in relative brain volume, the odds of AD increase by a factor of 1.35 (95% CI [1.27; 1.44]) and the odds of MCI disease increase by a factor of 1.19 (95% CI [1.15; 1.24]) in reference to healthy controls. Among subjects with MCI, for each one percentage point decrease in relative brain volume, the odds of AD increase by a factor of 1.13 (95% CI [1.10; 1.16]). The decrease of 1 point in MMSE score multiplies the odds of AD by 8.15 (95% [7.53; 8.81]) in reference to healthy controls. The odds of MCI disease are predicted to grow about 2.65 times larger (95% CI [2.52; 2.79]) for each reduction of a point in the MMSE score among healthy controls. For each 1-point decrease in MMSE, the odds of AD increase by 3.07 (95% CI [2.99; 3.16]) for subjects with MCI.
Table 2 contains average values of statistics of prediction (with a 95% confidence interval) obtained in a 5-fold cross-validation for ADNI.
Table 2
Quality performance indices of prediction system (with 95% confidence interval)
| Statistics | AD versus others | NC versus others | AD versus NC | MCI versus NC | AD versus MCI |
| ADNI (Expanded model: Status of disease ∼ Relative brain value + MMSE + Age) | |||||
| Sensitivity [% ] | 63.99 | 70.08 | 100 | 80.67 | 63.99 |
| [48.61; 79.37] | [61.92; 78.24] | [75.63; 85.72] | [48.61; 79.37] | ||
| Specificity [% ] | 94.06 | 87.84 | 100 | 70.08 | 88.22 |
| [90.93; 97.19] | [85.17; 90.51] | [61.92; 78.24] | [81.53; 94.9] | ||
| Positive Predictive Value [% ] | 74.41 | 71.66 | 100 | 79.84 | 74.41 |
| [65.56; 83.26] | [67.12; 76.20] | [76.71; 82.96] | [65.56; 83.26] | ||
| Negative Predictive Value [% ] | 90.91 | 87.13 | 100 | 71.66 | 82.71 |
| [87.34; 94.47] | [84.19; 90.07] | [67.12; 76.20] | [76.16; 89.26] | ||
| Prevalence [% ] | 20.84 | 30.41 | 38.51 | 59.13 | 34.11 |
| [20.42; 21.26] | [30.05; 30.77] | [34.3; 42.73] | [57.50; 60.76] | [32.94; 35.29] | |
| Balanced Accuracy [% ] | 79.02 | 78.96 | 100 | 75.38 | 76.1 |
| [71.65; 86.4] | [75.23; 82.69] | [72.10; 78.65] | [68.52; 83.69] | ||
| AUC [% ] | 94.18 | 90.01 | 99.65 | 79.30 | 90.78 |
| [92.09; 96.28] | [87.03; 92.99] | [99.18;100.00] | [74.35; 84.24] | [87.45; 94.11] | |
| Cutoff point | 0.16 | 0.30 | 8.38 | 47.24 | 30.13 |
| [0.05; 0.26] | [0.20; 0.40] | [3.88; 12.87] | [35.28; 59.21] | [10.32; 49.95] | |
| EDSD (Expanded model: Status of disease ∼ Relative brain value + MMSE + Age) | |||||
| Sensitivity [% ] | 69.85 | 73.20 | 96.94 | 75.78 | 71.43 |
| [62.14; 77.57] | [66.96; 79.43] | ||||
| Specificity [% ] | 90.17 | 88.19 | 93.42 | 77.17 | 80.17 |
| [87.04; 93.31] | [84.47; 91.92] | ||||
| Positive Predictive Value [% ] | 73.64 | 80.68 | 90.48 | 69.78 | 79.83 |
| [66.04; 81.25] | [74.85; 86.51] | ||||
| Negative Predictive Value [% ] | 88.39 | 83.01 | 97.93 | 82.08 | 71.85 |
| [85.04; 91.73] | [78.80; 87.21] | ||||
| Prevalence [% ] | 28.22 | 40.25 | 39.20 | 41.03 | 52.36 |
| Balanced Accuracy [% ] | 80.01 | 80.70 | 95.18 | 76.48 | 75.80 |
| AUC [% ] | 89.95 | 85.36 | 93.25 | 71.08 | 85.74 |
| EDSD (Basic model: Status of disease ∼ MMSE) | |||||
| Sensitivity [% ] | 71.32 | 69.59 | 97.98 | 77.78 | 72.39 |
| [63.72; 78.92] | [63.11; 76.06] | ||||
| Specificity [% ] | 89.6 | 89.58 | 93.10 | 73.37 | 79.03 |
| [86.38; 92.81] | [86.06; 93.11] | ||||
| Positive Predictive Value [% ] | 72.93 | 81.82 | 90.65 | 66.67 | 78.86 |
| [65.38; 80.48] | [75.93; 87.70] | ||||
| Negative Predictive Value [% ] | 88.83 | 81.39 | 98.54 | 82.82 | 72.59 |
| [85.52; 92.13] | [77.10; 85.67] | ||||
| Prevalence [% ] | 28.22 | 40.25 | 40.57 | 40.65 | 51.94 |
| Balanced Accuracy [% ] | 80.46 | 79.59 | 95.54 | 75.57 | 75.71 |
| AUC [% ] | 90.19 | 85.87 | 93.35 | 67.04 | 86.14 |
AUC, the area under the ROC curve.
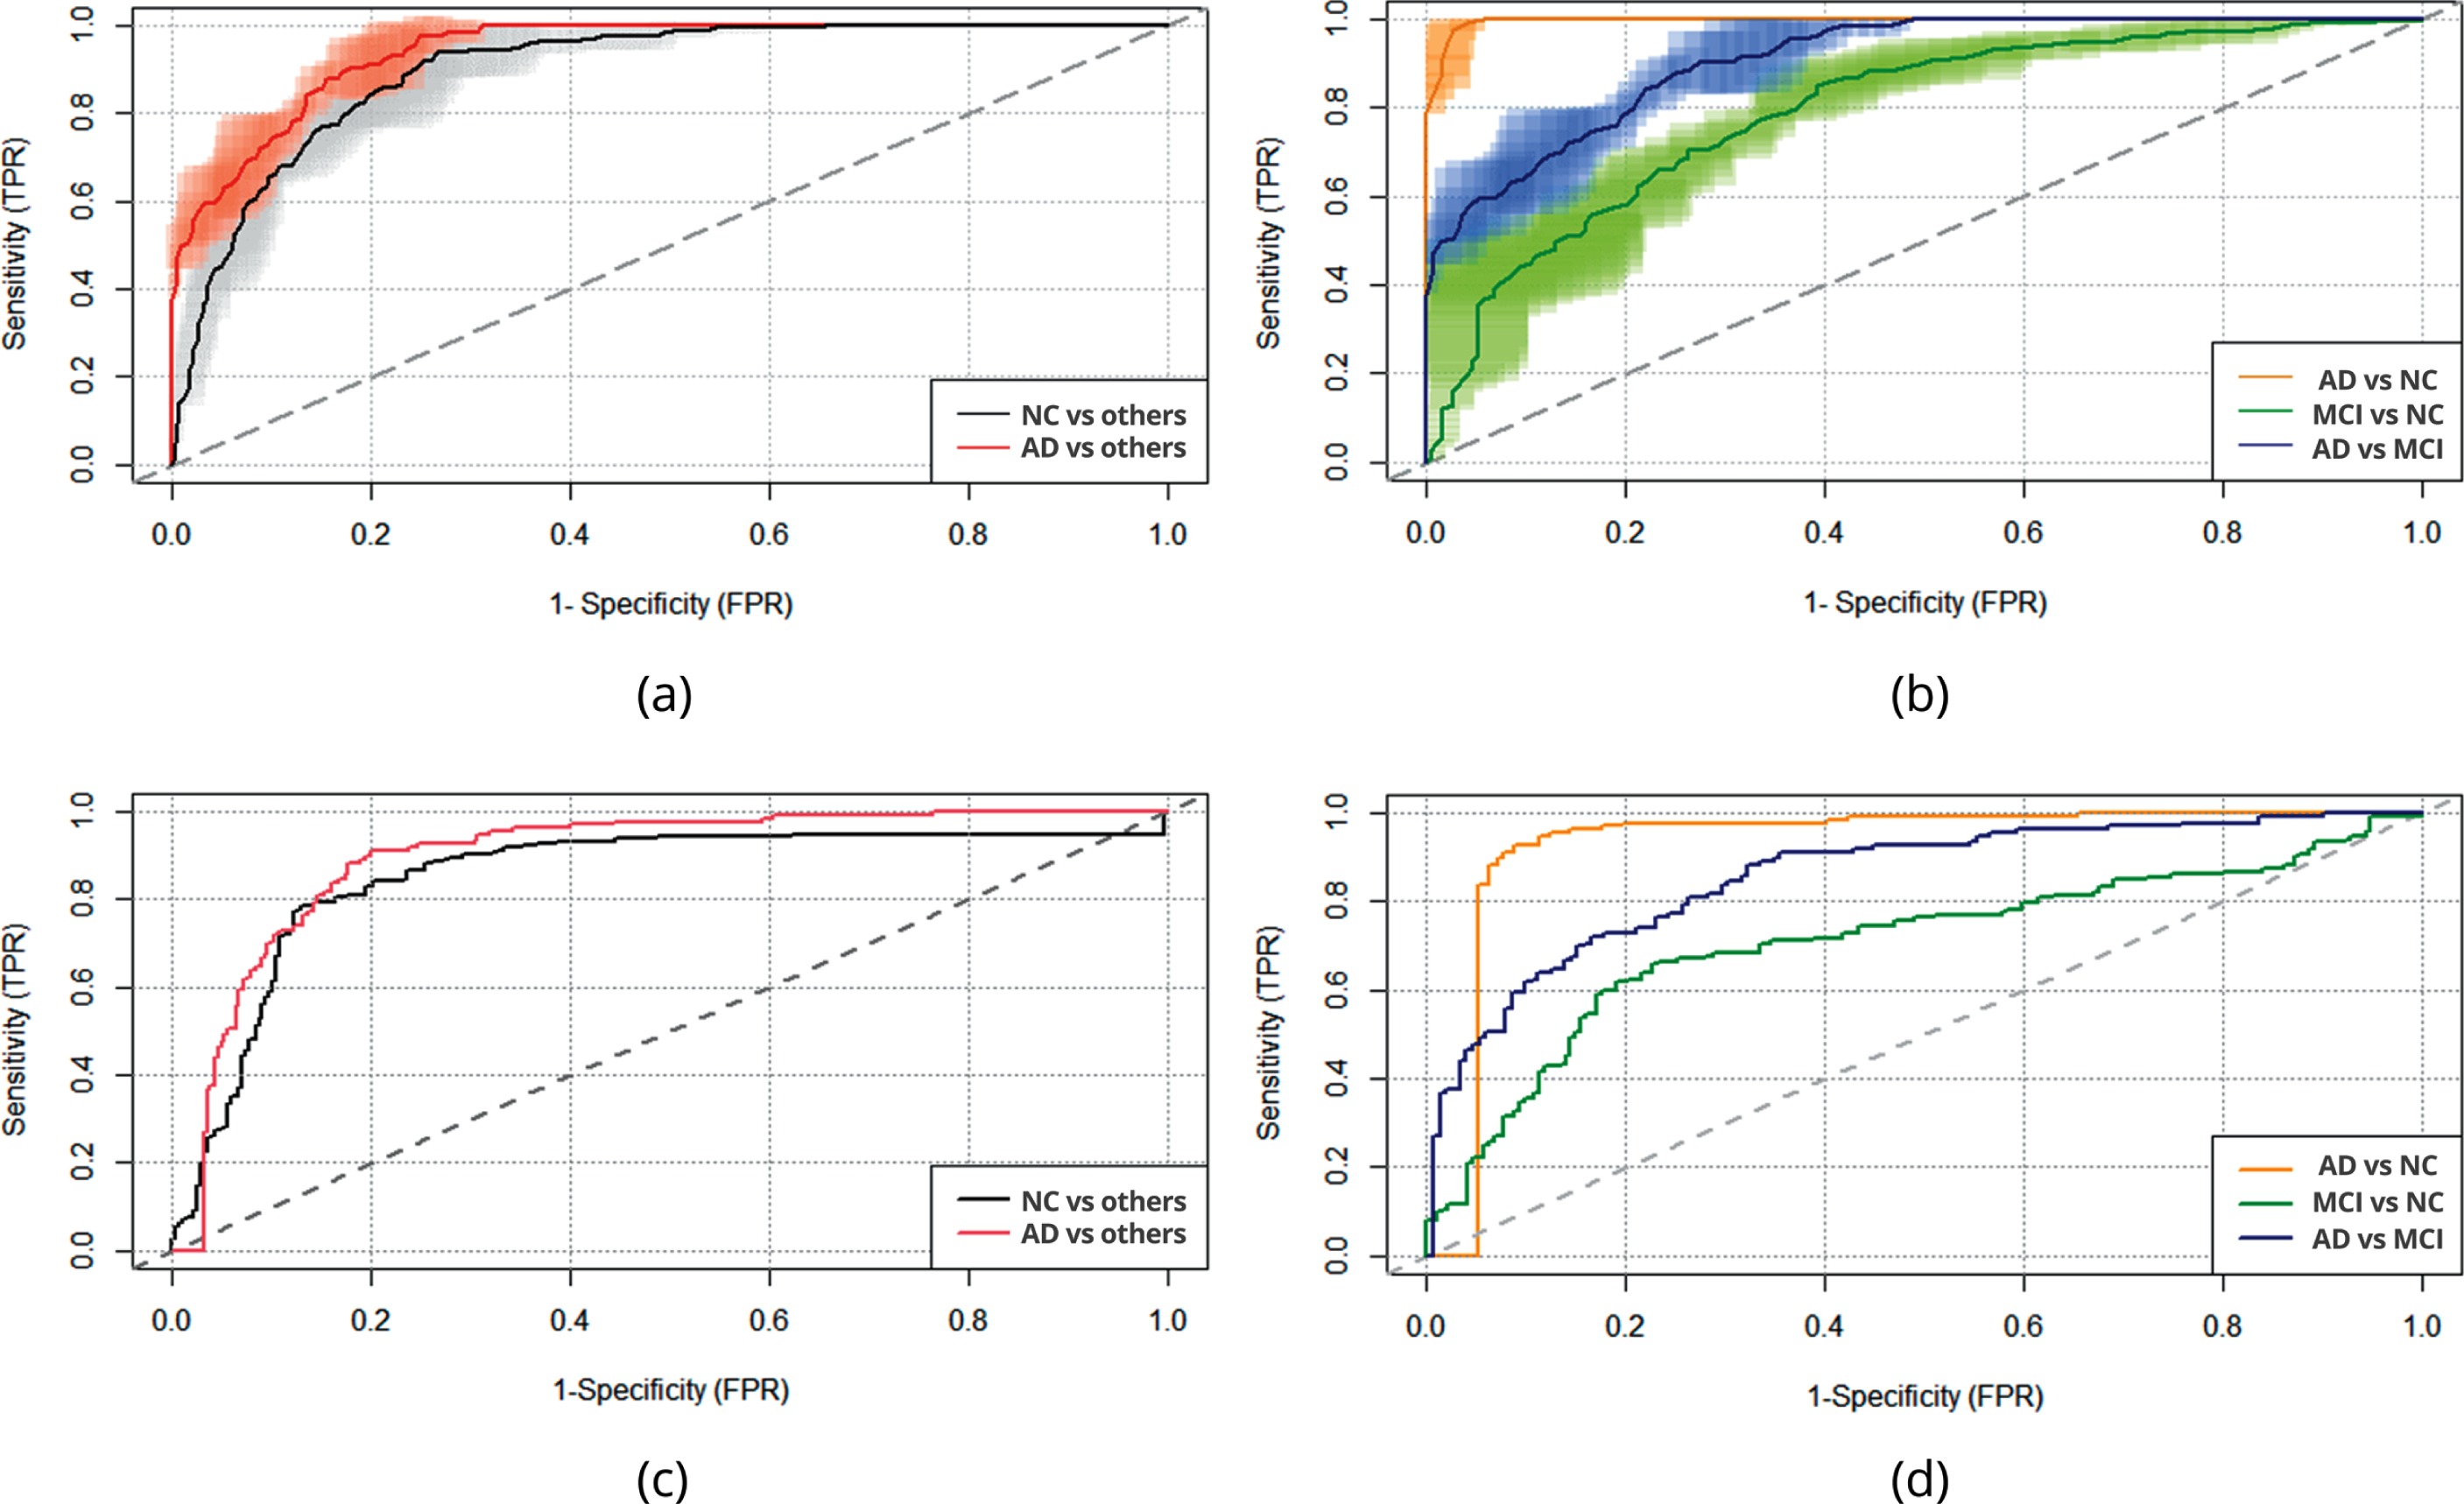
Values of areas under the ROC curve (AUC) were very high for classes AD versus others and NC versus others, and 5-fold cross-validation for ADNI resulted in 94.18% and 90.01%, respectively. The value of three classes (AD versus others, NC versus others, MCI versus others) of balanced accuracy is 76.10%. A specificity of 94.06% was gained for AD versus others, and it is the highest value; the sensitivity for this class is 63.99%. The value of Negative Predictive Value [% ] (NPV) is 90.91% for AD versus others, while the value of Positive Predictive Value [% ] (PPV) is 74.41%. The specificity, sensitivity, NPV and PPV values for NC versus others are 87.84%, 70.08%, 87.13%, and 71.66%, respectively. The pairwise analysis gave a very large value of AUC for the classification of AD versus NC (99.65%). The specificity, sensitivity, NPV and PPV value for AD versus NC is 100%.
The chosen multinomial logistic regression model was also trained on the whole ADNI dataset and tested on the independent EDSD dataset. Values of model coefficients are presented in Supplementary Table 5.
As before, for each predictor, the adjusted odds ratio was calculated (see Supplementary Table 6). One can notice that for each one percentage point decrease in relative brain volume, the odds of AD increase by 1.35 (95% CI [1.25; 1.46]) in reference to healthy controls and the odds of MCI disease increase by a factor of 1.19 (95% CI [1.13; 1.26]) which is very similar to the estimates obtained in the first stage. Among subjects with mild cognitive impairment, for each one percentage point decrease in relative brain volume, the odds of AD increase by a factor of 1.13 (95% CI [1.10; 1.16]). For each reduction of a point in MMSE score, the odds are predicted to grow about 8.06 times larger (95% CI [6.48; 10.04]) for AD and 2.64 (95% [2.27; 3.08]) for MCI in reference to healthy controls. The decrease of 1 point in MMSE score multiplies the odds of AD by 3.05 (95% [2.85; 2.36]) among subjects with MCI status.
The obtained model was tested on the independent validation EDSD dataset, and Table 2 presents the results. Additionally, Supplementary Table 7 contains results for two subsets of EDSD: 1.5T and 3T.
The validation results for the independent dataset (EDSD) have shown that values of areas under the ROC curve (AUC) for classes: AD versus others and NC versus others are 89.95% and 85.36%, respectively. The value of three classes (AD versus others, NC versus others, MCI versus others) of balanced accuracy is 76.83%. Specificity of 90.17%, the sensitivity of 69.85%, NPV of 88.39%, and PPV of 73.64% were gained for AD versus others. The specificity, sensitivity, NPV and PPV for NC versus others are 88.19%, 73.20%, 83.01%, and 80.68%, respectively. The pairwise analysis confirmed the very large value of AUC for the classification of AD versus NC (93.25%). A specificity of 93.42% was gained for AD versus NC, and it is the highest value; the sensitivity for this class is 96.94%. The value of NPV is 97.93% for AD versus NC, while the value of PPV is 90.48%. Additionally, Table 2 contains the validation results for the independent EDSD dataset for the model built on the whole ADNI dataset with the single independent variable MMSE score. Results confirm that adding the relative brain volume and age as a corrective function for natural brain ageing improves the model. The value of AUC for MCI versus NC increases from 67.04% (for the model with MMSE score only) to 71.08% (for the model with the relative brain volume and age added).
The ROC curve was used to summarize the prediction of the model for ADNI and ESDS datasets (Fig. 2).
Fig. 2
The ROC curve for classification between AD, MCI, and NC: (a) The ROC curve for classification with average values of 5-fold cross-validation (ADNI data): AD versus others, NC versus others; (b) The ROC curve for classification with average values of 5-fold cross-validation (ADNI data): AD versus NC, MCI versus NC, AD versus MCI; (c) The ROC curve for classification using ADNI data as training data and EDSD data (whole dataset) as test data: AD versus others, NC versus others; (d) The ROC curve for classification using ADNI data as training data and EDSD data (whole dataset) as test data: AD versus NC, MCI versus NC, AD versus MCI.
Additionally, the logistic regression model was built on the complete ADNI dataset to check which predictors describe the change of disease status from MCI to AD. The change from the baseline disease status MCI to AD (which was the latest available disease status during 48 months follow-up) was a dependent variable (change from MCI to AD –1, stable disease status MCI –0, the reference level). The following independent variables were considered: age, sex, years of education, MMSE score, relative brain volume, shrinkage factor, and volume of lateral ventricles. The progression of disease status from MCI to AD was best predicted by the following variables: relative brain volume, MMSE score, and age, where age has a corrective function. A comparison between the model without relative brain volume and age as predictors (only MMSE was taken into account) and the model with the relative brain volume and age added showed the statistical significance of the differences (p = 0.00004; BIC = 402.93 for the model with versus BIC = 411.80 for the model without relative brain volume and age). The adjusted odds ratio was also calculated. For each one percentage point decrease in relative brain volume, the odds of the progression from MCI to AD increase by 1.19 (95% CI [1.10; 1.29]) and for each reduction of point in MMSE score, the odds increases by 1.30 (95% CI [1.13; 1.50]).
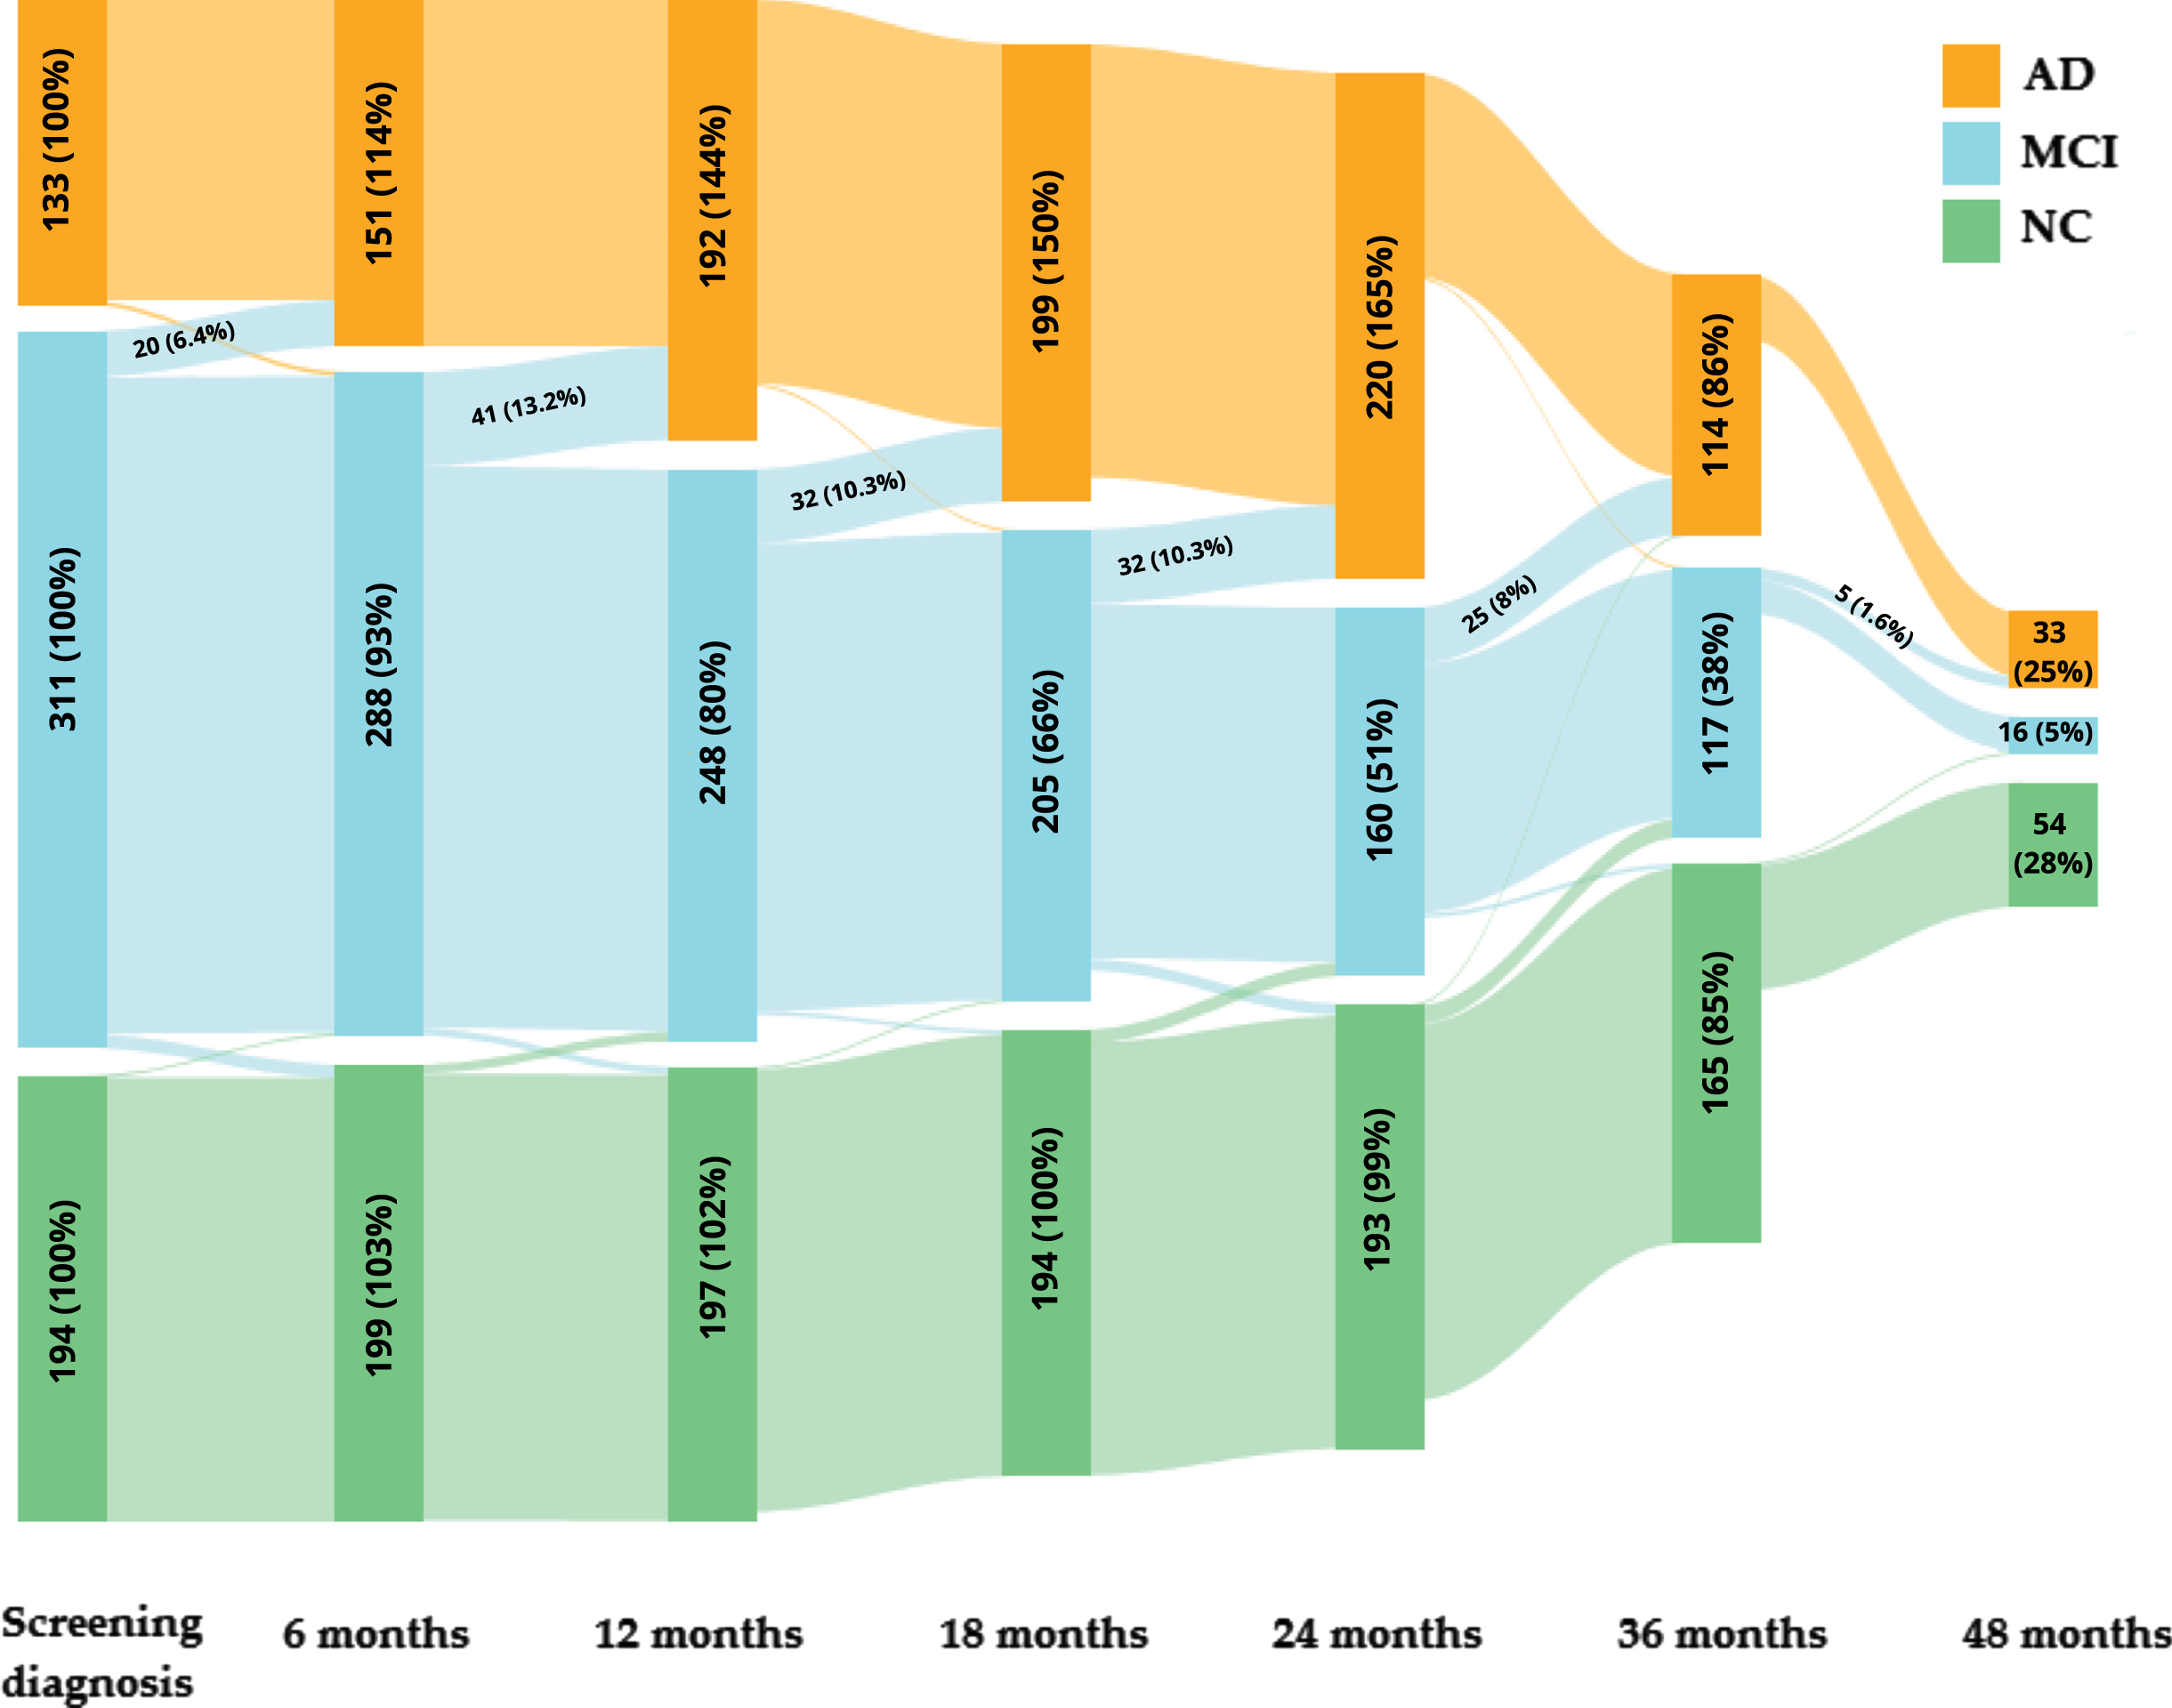
During the follow-up, some subjects have converted from MCI status to AD. Table 3 contains the number and percentage of subjects with changes in diagnosis during 6, 12, 18, 24, and 36 months of the follow-up in association with the prediction (ADNI datasets) and between 6 and 48 months of follow-up (ADNI and the independent EDSD datasets) for the models with (the expanded model) and without the relative brain volume and age (the basic model). The prediction of the expanded multinomial logistic regression model in 5-fold cross-validation of the ADNI dataset indicates that 30 subjects with MCI screening diagnosis are predicted as AD status. Among these subjects, predictions are in line with 12 months of the follow-up diagnosis in 11 subjects (36.67%). A similar calculation was conducted for 6, 18, 24, 36, and up to 48 months of follow-up (Table 3). The prediction (the expanded model) was consistent within 48 months of the follow-up diagnosis (we take into account the latest available diagnosis status between 6 and 48 months follow-up) for 18 subjects (60.00%) among 30 subjects with MCI screening diagnosis and model prediction of AD. One subject changed the diagnosis from AD to MCI during follow-up, and this diagnosis is compliant with the prediction. Fourteen subjects developed MCI among NC subjects; the diagnosis is compliant with the prediction for five subjects.
Table 3
Compliance of the prediction with the change in diagnosis from MCI to AD
| Change from MCI to AD | Compliance of AD prediction with the follow-up diagnosis | AD prediction among subjects with MCI screen diagnosis (only patients with follow-up data) | Compliance of AD prediction with the follow-up diagnosis | AD prediction among subjects with MCI screen diagnosis (only patients with follow-up data) | |
| Follow-up time | Number of subjects (%) | Number of subjects (%) | |||
| Expanded model | Basic model | ||||
| ADNI | 6 months | 5 (16.67%) | 30 (100%) | 4 (14.29%) | 28 (100%) |
| 12 months | 11 (36.67%) | 30 (100%) | 9 (32.14%) | 28 (100%) | |
| 18 months | 13 (56.52%) | 23 (100%) | 12 (52.17%) | 23 (100%) | |
| 24 months | 11 (55.00%) | 20 (100%) | 11 (55.00%) | 20 (100%) | |
| 36 months | 11 (61.11%) | 18 (100%) | 10 (58.82%) | 17 (100%) | |
| EDSD | Up to 48 months* | 18 (60.00%) | 30 (100%) | 17 (60.71%) | 28 (100%) |
| Up to 48 months* | 13 (76.47%) | 17 (100%) | 12 (66.67%) | 18 (100%) | |
*48 months –we considered the latest available diagnosis status between 6 and 48 months follow-up.
Prediction of the multinomial logistic regression model on the independent EDSD dataset shows similar results. Table 3 contains the number and percentage of subjects with changes in diagnosis from MCI to AD during four years of follow-up in association with the prediction (EDSD dataset). The multinomial logistic regression model (the expanded model) on the independent EDSD dataset predicts AD in 24 subjects with MCI screening diagnosis. Among these 24 subjects, we have follow-up data for 17 patients, 13 (76.47%) patients transited from MCI to AD status, and they confirmed the expanded model prediction. The percentage may even be improved as some patients have not follow-up on their diagnosis. Additionally, results of the expanded model with the relative brain volume and age added show that percentages of correctly predicted diagnosis status are higher for 6, 12, 18, and 36 months compared to the basic model without the relative brain volume and age. A similar result we have for the EDSD dataset within 48 months of follow-up. Results confirm that adding the relative brain volume and age (as a corrective function for natural brain aging) improves the model. The change in disease status within 6, 12, 18, 24, 36, and 48 months is presented as a Sankey diagram in Fig. 3. For missing data, if data for one of the later months is available, we take data from the latest, previous available month; if not, we do not fill in missing data.
Fig. 3
The Sankey diagram for ADNI database: the change in disease status within 6, 12, 18, 24, 36, and 48 months. The figure includes the number and percentage of subjects for disease status and time points; additionally, the number and percentage of subjects with changes in diagnosis from MCI to AD is presented.
DISCUSSION
Our aim was to improve the classical screening process based on the MMSE score. We focused on finding the commonly available biomarker which improves screening. We obtained that the multinomial logistic regression model was of the same structure for all cross-validation analyses and based on the complete ADNI dataset. Disease status was best predicted by the relative brain volume, MMSE score, and age. The comparison with the MMSE score only (the basic model) and the relative brain volume and age added (the expanded model) shows that adding the relative brain volume (and age as an adjustive factor for natural brain aging) improves the model. The value of the Bayes factor indicates strong evidence, and we can notice that the quality of MCI detection increases (AUC: 67.04% versus 71.08%) while maintaining the quality for AD (AUC: 93.35% versus 93.25%). The average values of coefficients of the multinomial logistic regression models for 5-fold cross-validation and results for the whole ADNI dataset are very similar, which confirms the homogeneity of the training dataset and consistency of the screening process. Average values of statistics of prediction obtained in 5-fold cross-validation for ADNI show that we have outstanding results of classification AD versus NC and AD versus others, with AUC equaling 99.65% and 94.18%, respectively. Additionally, the values of AUC for AD versus MCI and for NC versus others are also very high (90.78% and 90.01%, respectively). The moderate value of AUC we have for MCI versus NC (79.30%) is still a very good result if we take into account that the MCI group is heterogeneous and some patients from this group develop AD, and some patients have stable MCI status. The average value of balanced accuracy for three classes (AD versus others, NC versus others, and MCI versus others) is 76.10% for 5-fold cross-validation. As we aim to develop a supporting screening process, detecting patients with the disease is the most important, so PPV and NPV are the most important. The value of NPV and PPV for AD versus NC is 100%.
We have compared our classification results with results reported in the literature based on the ADNI dataset expect one study (13 studies used the ADNI dataset as a training dataset, one study used the internal locally dataset as a training dataset and ADNI dataset as an independent validation dataset, and two studies used locally datasets as training dataset; 6 studies among 16 used additionally independent validation dataset) (Table 4).
Table 4
Overview of previous studies based on the ADNI dataset
| Studies | Sample size | Method | Input | Validation | Groups | Parameters | Results |
| Agostinho et al. 2022 [6] | The internal locally dataset (n = 41): AD (n = 20), NC (n = 21). | SVM | MRI, PiB-PET and DTI | Internal locally dataset and external dataset (ADNI (n = 330): AD (n = 166), NC (n = 164)) | AD, NC | AUC, ACC, SEN, SPEC, BACC | Dependent validation: AD versus NC: MRI: AUC = 96%, ACC = 92.05%, SEN = 86.78%, SPEC = 86.78%, BACC = 92.05%; PiB PET: AUC = 93%, ACC = 90.53%, SEN = 92%, SPEC = 89.43, BACC = 90.53%; DTI: AUC = 86%, ACC = 76.84%, SEN = 76.17%, SPEC = 82.09%, BACC = 79.84%; MRI multimodal: AUC = 99%, ACC = 95.04%, SEN = 90.04%, SPEC = 99.04%, BACC = 95.04% Independent validation: AD versus NC: MRI: AUC = 81%, ACC = 78.02%, SEN = 74.12%, SPEC = 82.29, BACC = 78.20%; PiB PET: AUC = 81%, ACC = 76.87%, SEN = 87.9%, SPEC = 68.33%, BACC = 78.12%; DTI: AUC = 69%, ACC = 62.79%, SEN = 54.31%, SPEC = 71.98%, BACC = 63.15%. |
| Gao et al. 2022 [7] | 1134 subjects: AD (n = 454), NC (n = 680). | 3DMgNet (multigrid and convolutional neural network) | MRI | 10-fold cross-validation and external in-house dataset (AD (n = 75), NC (n = 59)) | AD, NC | AUC, ACC, SEN, SPEC | Dependent validation: ACC = 92.13%, AUC = 94.43%, SEN = 88.42%, SPEC = 95%. Independent validation: ACC = 87.91%, AUC = 95.74%, SEN = 79.73%, SPEC = 98.31%. |
| Goenka et al. 2022 [8] | 769 subjects: AD (n = 70), MCI (n = 224), NC (475) | CNN | MRI | 633 scans from ADNI dataset | AD, MCI, NC | AUC, ACC | Dependent validation: AD versus NC: ACC = 97.83%, AD versus MCI: ACC = 98.68%, NC versus MCI: ACC = 99.10%, NC versus MCI versus AD: ACC = 98.26%. AD versus NC: AUC = 94%, AD versus MCI: AUC = 97%, NC versus MCI: AUC = 99%, NC versus MCI versus AD: AUC = 98%. |
| Tang et al. 2021 [9] | 560 subjects: AD (n = 80), EMCI (n = 230), LMCI (n = 110), NC (n = 140) | SVM, RF, DT | MRI | 10-fold cross-validation | AD, EMCI, LMCI, NC | AUC, ACC, SEN, SPEC | RF: NC versus AD: ACC = 96.14%, SEN = 88.14, SPE = 92.81%, AUC = 92%. NC versus EMCI: ACC = 77.45%, SEN = 79.51%, SPE = 33.54%, AUC = 59%. NC versus LMCI: ACC = 87.56%, SEN = 64.71%, SPE = 83.94%, AUC = 81%. EMCI versus AD: ACC = 90.15%, SEN = 93.51%, SPE = 92.43%, AUC = 85%. LMCI versus AD: ACC = 84.54%, SEN = 67.91, SPE = 72.46%, AUC = 89%. |
| Dyrba et al. 2021 [10] | 633 subjects: AD (n = 189), MCI (n = 220), NC (n = 254) | CNN | MRI and PET | 1-fold cross-validation and three independent datasets: ADNI-3 (n = 575), AIBL (n = 606), DELCODE (n = 474). | AD, MCI, NC | AUC, ACC, SEN, SPEC, BACC, PPV, NPV | Dependent validation: AD versus NC: BACC = 88.9%, SEN = 94.2%, SPE = 83.6%, PPV = 81.5%, NPV = 95.2% AUC = 94.9%. MCI versus NC: BACC = 74.5%, SEN = 65.5%, SPE = 83.6%, PPV = 78.1%, NPV = 74.1%, AUC = 78.5%. amyloid-positive AD versus amyloid-negative NC: BACC = 94.9%, SEN = 95.6%, SPE = 94.3%, PPV = 92.7%, NPV = 96.6%, AUC = 98.5%. amyloid-positive MCI versus amyloid-negative NC: BACC = 86.7%, SEN = 79%, SPE = 94.3%, PPV = 91.6%, NPV = 96.6%, AUC = 92.5%. Independent validation DELCODE: AD versus NC: BACC = 85.5%, SEN = 94.2%, SPE = 76.7%, PPV = 66.2%, NPV = 96.5% AUC = 95.3%. MCI versus NC: BACC = 71%, SEN = 65.2%, SPE = 76.7%, PPV = 66.9%, NPV = 75.3%, AUC = 77.5%. amyloid-positive AD versus amyloid-negative NC: BACC = 83.3%, SEN = 95.9%, SPE = 70.7%, PPV = 73.4%, NPV = 95.3%, AUC = 96.8%. amyloid-positive MCI versus amyloid-negative NC: BACC = 72.2%, SEN = 73.7%, SPE = 70.7%, PPV = 71.2%, NPV = 73.2%, AUC = 84%. |
| Marzban et al. 2020 [5] | 406 subjects: NC (n = 185), MCI (n = 106), AD (n = 115) | CNN | MRI and DTI | 10-fold cross-validation | AD, NC, MCI | AUC, ACC, SEN, SPEC | AD versus NC: AUC = 94%, ACC = 93.5%, SEN = 92.5%, SPEC = 93.9. MCI versus NC: AUC = 84%, ACC = 79.6%, SEN = 62.7%, SPEC = 89% |
| Li et al. 2020 [11] | 404 subjects: NC (n = 268), AD (n = 136) | SVM | MRI | 10-fold cross-validation and independent validation dataset (AD (n = 41), NC (n = 25)) | AD, NC | ACC, SEN, SPEC | Dependent validation dataset: AD versus NC: ACC = 97.03%, SEN = 94.12%, SPEC = 98.51. Independent validation dataset: AD versus NC: ACC = 84.85%, SEN = 85.36%, SPEC = 84% |
| Bae et al. 2020 [12] | 390 subjects: AD (n = 195), NC (n = 195) | CNN | MRI | 5-fold cross-validation and independent validation dataset (AD (n = 195), NC (n = 195)) | AD, NC | AUC, ACC, SEN, SPEC | Dependent validation dataset: AD versus NC: AUC = 94%, ACC = 89%, SEN = 88%, SPEC = 91%. Independent validation dataset: AD versus NC: AUC = 88%, ACC = 83%, SEN = 76%, SPEC = 89% |
| Liu et al. 2020 [13] | 449 subjects: AD (n = 97), MCI (n = 233), NC (n = 119) | CNN | MRI | 5-fold cross-validation and independent dataset (AD (n = 45), MCI (n = 46), and NC subjects (n = 44)). | AD, MCI, NC | AUC, ACC, SEN, SPEC | Dependent validation: AD versus NC: ACC = 88.9%, SEN = 86.6%, SPE = 90.8%, AUC = 92.5%. MCI versus NC: ACC = 76.2%, SEN = 79.5%, SPE = 69.8%, AUC = 77.5%. Independent validation: AD versus NC: AUC = 89.8% MCI versus NC: AUC = 72.2% |
| Studies | Sample size | Method | Input | Validation | Groups | Parameters | Results |
| Zhang et al. 2019 [23] | 857 subjects: NC (n = 322), MCI (n = 322), AD (n = 213) | Graph Analysis | MRI | Data are randomly partitioned into 80% and 20% for training and testing. | AD, MCI, NC | AUC | AD versus MCI + NC: AUC = 73%, NC versus AD + MCI: AUC = 72%, MCI versus AD + NC: AUC = 69%. |
| Westman et al. 2012 [24] | 369 subjects: AD (n = 96), MCI (n = 162) and NC (n = 111). | Orthogonal Partial Least-Squares (OPLS) | MRI, PET, CSF | 7-fold cross-validation | AD, MCI, NC | AUC, ACC, SEN, SPEC, PPV, NPV | AD versus NC: MRI with CSF: ACC = 91.8%, SEN = 88.5%, SPEC = 94.6%, PPV = 93.4%, NPV = 90.5% and AUC = 95.8%. MRI only: ACC = 87%, SEN = 83.3%, SPEC = 90.1%, PPV = 87.9%, NPV = 86.2% and AUC = 93%. CSF only: ACC = 81.6%, SEN = 84.4%, SPEC = 79.3%, PPV = 77.9%, NPV = 85.4% and AUC = 86.1%. MCI versus NC: MRI with CSF: ACC = 77.6%, SEN = 72.8%, SPEC = 84.7%, PPV = 87.4%, NPV = 68.1% and AUC = 87.6%. MRI only: ACC = 71.8%, SEN = 66.7%, SPEC = 79.3%, PPV = 82.4%, NPV = 62.0% and AUC = 81.5%. CSF only: ACC = 70.3%, SEN = 66.7%, SPEC = 75.7%, PPV = 80.0%, NPV = 60.9% and AUC = 74.9%. |
| Eskildsen et al. 2012 [49] | 808 subjects: AD (n = 194), NC (n = 226), pMCI (n = 161), sMCI (n = 227) | LDA | MRI (cortical thickness and age) | leave-one-out (LOO) validation | AD, NC, pMCI, sMCI | AUC, ACC, SEN, SPEC | Independent feature sets: AD versus NC: ACC = 85.5%, SEN = 80.4%, SPEC = 89.8%, AUC = 92%. pMCI versus sMCI: ACC = 67.8%, SEN = 64.6%, SPEC = 70%, AUC = 68.2%. Dependent feature sets: AD versus NC: ACC = 87.4%, SEN = 82.5%, SPEC = 91.6%, AUC = 93.1%. pMCI versus sMCI: ACC = 68.3%, SEN = 67.7%, SPEC = 68.7%, AUC = 74.7%. |
| Estévez-Santé et al. 2020 [50] | 148 subjects: AD (n = 34), amnestic MCI (n = 66), NC (n = 48) | Logistic regression | MRI | 10-fold cross-validation | AD, amnestic MCI, NC | AUC, SEN, SPEC | NC versus AD: HV/TIV (the best AUC): SEN = 79.4%, SPEC = 83.3%, AUC = 89.3% 95% CI [82.6%; 96.0%]; The best SEN: SEN = 85.3%, SPEC = 79.2%, AUC = 88%; The best SPEC: SEN = 79.4%, SPEC = 83.3%, AUC = 89.3%. NC versus amnestic MCI: HV/TIV (the best AUC): SEN = 72.7%, SPEC = 77.1%, AUC = 79.7% 95% CI [71.6%; 87.8%]; The best SEN: SEN = 77.3%, SPEC = 62.5%, AUC = 75.5%; The best SPEC: SEN = 60.6%, SPEC = 83.3%, AUC = 76.3%. |
| Martínez-Torteya et al. 2015 [51] | The feature selection set: AD (n = 48), MCI (n = 98), NC (n = 48). The calibration set: AD (n = 71), MCI (n = 124) and NC (n = 74), The test set: AD (n = 25), MCI (n = 86) and NC (n = 25). | Logistic regression | MRI, PET | Calibration set: 1,000 bootstrap samples; test set: Subjects previously excluded from the study due to lack of data (ADNI) | AD, MCI, NC | AUC, ACC, SEN, SPEC | Calibration set: NC versus AD: ACC = 87.7% 95% CI [79.2%; 94.8%], SEN = 84.9% 95% CI [69.6%; 96.4%], SPEC = 90.5% 95% CI [75%; 100%], AUC = 94.5% 95% CI [88.9%; 98.7%]. NC versus MCI: ACC = 80.2% 95% CI [71.8%; 87.7%], SEN = 86.2% 95% CI [75%; 95.7%], SPEC = 70.4% 95% CI [53.1%; 87.5% ], AUC = 86.4% 95% CI [78.9%; 93.4%]. MCI versus AD: ACC = 83.8% 95% CI [78.1%; 89.2%], SEN = 47.6% 95% CI [28.1%; 68% ], SPEC = 94.1% 95% CI [88%; 98.9%], AUC = 83.8% 95% CI [76%; 91.1%]. Test set: NC versus AD: ACC = 85.4%, SEN = 91.3%, SPEC = 80%, AUC = 92.2%. NC versus MCI: ACC = 78.5%, SEN = 80.5%, SPEC = 75%, AUC = 84.1%. MCI versus AD: ACC = 80%, SEN = 33.3%, SPEC = 93%, AUC = 81.5%. |
| Tokumitsu et al. 2021 [52] | 240 subjects (Towada City Hospital): Early AD (n = 128), MCI (n = 112) | Logistic regression | MRI, SPECT | - | Early AD, MCI | AUC | MCI versus early AD: MMSE scores alone: AUC = 83.5% 95% CI [78.4%; 88.6%]. Stepwise selection model: AUC = 87% 95% CI [82.4%; 91.6%] |
| Sheelakumari et al. 2018 [53] | 68 subjects (Memory and Neurobehavioral Disorders Clinic, Kerala): AD (n = 15), amnestic MCI (n = 33), NC (n = 20) | Logistic regression | MRI, DTI, 1H MRS | - | Early AD, amnestic MCI, NC | AUC, SEN, SPEC | MCI versus NC: T1 weighted MRI: AUC = 77.5%, SEN = 78.8%, SPEC = 70%. DTI: AUC = 79.8%, SEN = 90.9%, SPEC = 50%. 1H MRS: AUC = 78.7%, SEN = 87.9%, SPEC = 60.1%. Multimodal (MRI, DTI, MRS): AUC = 89%, SEN = 93.9%, SPEC = 70%. MCI versus AD: T1 weighted MRI: AUC = 82.9%, SEN = 90.9%, SPEC = 60.6%. DTI: AUC = 85.4%, SEN = 72.7%, SPEC = 87.9%. 1H MRS: AUC = 83.6%, SEN = 81.8%, SPEC = 75.8%. Multimodal (MRI, DTI, MRS): AUC = 92.6%, SEN = 93%, SPEC = 85.6%. |
AIBL, Australian Imaging, Biomarker & Lifestyle Flagship Study of Ageing; DELCODE, DZNE multicenter observational study on Longitudinal Cognitive Impairment and Dementia; EMCI, early mild cognitive impairment; LMCI, late mild cognitive impairment; pMCI, progressive MCI; sMCI, stable MCI; CNN, convolutional neural network; LDA, linear discriminant analysis; SVM, support vector machine; RF, random forest; DT, decision tree; AUC, the area under the receiver-operating-characteristic curve; ACC, accuracy; SEN, sensitivity; SPEC, specificity; BAAC, balanced accuracy; PPV, positive predictive value; NPV, negative predictive value; HV, hippocampal volume; TIV, total intracranial volume; PET, positron emission tomography; SPECT, a single photon emission computed tomography; 1H MRS, Proton magnetic resonance spectroscopy.
Results obtained for the independent validation dataset (EDSD) confirm results of cross-validation analysis for ADNI. Our results for the independent validation dataset are not worse and, in many cases, even better than the results from previously published studies. Our model achieved the best balanced accuracy of 95.18% (balanced ACC) for the independent validation dataset when the highest value of balanced accuracy for AD versus NC from reported studies is 85.5% [10]. Although the highest reported value of AUC is 96.8, in this study, the decision is supported by the concentration of amyloid in CSF [10]. The second top-reported AUC value is 95.74%, but this study focuses on only two categories: AD and NC, while we consider MCI as a third one [7]. The third value of AUC is 95.3%. This value is slightly bigger than ours, but other performance indicators like balanced accuracy, sensitivity, specificity, PPV, and NPV for AD versus NC are better in our approach [10]. The lowest value of AUC for AD versus NC among publications presented in Table 4 is 69% [6]. The highest sensitivity value for AD versus NC is 95.6% for analysis based on the concentration of amyloid in CSF and 94.2% for analysis without amyloid data, while our estimated sensitivity is better and equal to 96.94% [10]. For the prediction specificity, the highest value observed is 98.31%, but this study focuses only on two categories: AD and NC, which means that it is easier to achieve better results than for three categories [7]. The second highest reported value of specificity is 89.8%, which is lower than ours (93.42%) [49]. The lowest value of specificity among publications is 68.33% [6]. Only one study from Table 4 contains the results of NPV and PPV for AD versus NC, values of these indicators are 95.3% and 73.4% for analysis based additionally on amyloid data, and 96.5% and 66.2% for analysis without amyloid data, respectively [10]. Our results are again better; the value of NPV is 97.93% for AD versus NC, while PPV is 90.48%.
The comparison of results for 5-fold cross-validation shows that our model achieves better results than all reported studies for the classification task of AD versus NC for the dependent validation (Table 4) [5, 6–13, 23, 24, 49–53]. The prediction results of AD versus NC from reported studies show that the highest AUC is 99% [6], when our result is 99.65%, the highest accuracy for AD versus NC is 97.83% [8], when our result is 100% (we have the balanced ACC). The highest sensitivity and specificity values are 95.6% [10] and 99.04 [6], respectively, when our model achieved 100% for both parameters. Only two studies from Table 4 contain the results of NPV and PPV for AD versus NC; the highest value of NPV is 96.6% [10] for analysis based additionally on amyloid data, and the highest value of PPV is 93.4% [24] when our model achieved 100% for both parameters.
Most studies used SVM and CNN methods, while our method is based on multinomial logistic regression. Four of the studies used binomial logistic regression as a classification method. The highest value of AUC for AD versus NC of these studies (only two of these studies compare AD versus NC) is 94.5% with 95% CI [88.9%; 98.7%] when our result is better, and the value of AUC is 99.65% with 95% CI [99.18%; 100.00%] [51]. Moreover, the highest value of AUC for AD versus MCI comparison is 92.6% for the multimodal classification method (MRI, DTI, 1H MRS), but for the individual modality, T1 weighted MRI provides the value of AUC: 82.9% while our result is 90.78 with 95% CI [87.45%; 94.11%] [53]. For MCI versus NC, the highest AUC result reported equals 89% for the multimodal classification method (MRI, DTI, 1H MRS), but for the individual modality, T1 weighted MRI, the value of AUC is 77.5%, while our model achieves 79.30% (95% CI [74.35%; 84.24%]) [53]. For another study, based on MRI, the value of AUC for MCI versus NC is 79.7%, but this value is within our confidence interval [50]. To summarize, our multiclass model is significantly better for NC or MCI versus AD comparison, and it is not worse for MCI versus NC.
Among these four studies mentioned above, the highest sensitivity value for AD versus NC is 90.5% for analysis based on the MRI and PET and 85.3% for analysis based on the MRI and cognitive tests only [50, 51]. The highest value observed for prediction specificity is 91.3% [51]. Both these results are lower than ours. For MCI versus NC comparison, the highest sensitivity value is 93.3% for analysis based on the multimodal classification method (MRI, DTI, MRS) and 78.8% for the individual modality, T1 weighted MRI, while our estimated sensitivity is 80.67% with 95% CI [75.63%; 85.72%] [53]. For another study, based on MRI, the value of sensitivity for MCI versus NC is 83.3%, but this value is within our confidence interval [50]. However, the value of the F1-score for this analysis is 70.16%, while our estimated value is better and equal to 75.55%. The highest specificity value is 86.2% for analysis based on MRI and PET and 77.3% for analysis based on MRI, while our model achieves 70.08% with 95% CI [61.92%; 78.24%] [50]. The value of the F1-score for this analysis is 69.12%, while our estimated value is better and equal to 75%. For the AD versus MCI comparison, the highest value of sensitivity is 94.1% for analysis based on MRI and PET and 60.6% for analysis based on MRI, while our value of sensitivity is 63.99% with 95% CI [48.61%; 79.37% ] [51, 53]. For the prediction specificity, the highest observed value is 93% for analysis based on MRI, DTI and 1H MRS, and 90.9% for analysis based on MRI, while our estimated specificity is 88.22% with 95% CI [81.53%; 94.9%] [53]. However, the value of the F1-score for this analysis is 72.72%, while our estimated value is better and equal to 75.55%. To summarize, our model is better for the AD versus NC comparison, and it is not worse for MCI versus NC and AD versus MCI.
In our work, we compared the predictive model, in which MMSE is the independent variable, with the predictive model with an additional MRI-based variable and age (where age has a corrective function). The third of these publications shows results for a similar situation: the predictive model with a combination of MMSE, parameters calculated based on MRI data and additional parameters obtained from SPECT (a single photon emission computed tomography) data in comparison to the model with MMSE alone [52]. Their result for MCI versus AD comparison is lower than our 95% confidence interval for AUC, which means that our result is better while our model is simpler and does not require, e.g., SPECT as an additional biomarker.
Additionally, among MCI patients predicted as AD inconsistently with the original diagnosis, 60% from ADNI and 76.47% from EDSD were re-diagnosed as AD within a 48-month follow-up.
Conclusions
Our work shows that the proposed T1-weighted MRI-based biomarker, combined with MMSE score and adjusted for age, gives excellent early-stage AD status predictions. Moreover, our method, as based on MRI, does not require invasive and expensive laboratory tests and, as a classical statistical learning model, does not require large calculation power.
Most papers focus on the diagnosis process rather than screening, and only one study contains the results of NPV and PPV when almost all have sensitivity and specificity results. Our model achieved better results for NPV and PPV for AD versus NC and MCI versus NC. Many advanced methods (e.g., CNN) with excellent results are published, but these methods are not easily applicable in daily medical practice. Moreover, these methods are sensitive to measurement protocols and preprocessing and have a problem with replicable, so much time is needed to use these methods by physicians in their daily clinical routine. Our model is based on easily available parameters (T1-weighted MRI is standard) and can be calculated in a simple way, so our method is ready to use in medical practice.
In this paper, we proved that incorporating the T1-weighted MRI-based biomarker into the standard clinical AD predictors leads to a handy model for daily clinical routine and improves the screening process. Additionally, we demonstrated that our model detects some patients transitioning from MCI to AD as AD patients a few years earlier before regular medical diagnosis, it means that T1-weighted MRI is utility in screening for MCI at risk of progression.
ACKNOWLEDGMENTS
Data collection and sharing for this project was funded by the Alzheimer’s Disease Neuroimaging Initiative (ADNI) (National Institutes of Health Grant U01 AG024904) and DOD ADNI (Department of Defense award number W81XWH-12-2-0012). ADNI is funded by the National Institute on Aging, the National Institute of Biomedical Imaging and Bioengineering, and through generous contributions from the following: AbbVie, Alzheimer’s Association; Alzheimer’s Drug Discovery Foundation; Araclon Biotech; BioClinica, Inc.; Biogen; Bristol-Myers Squibb Company; CereSpir, Inc.; Cogstate; Eisai Inc.; Elan Pharmaceuticals, Inc.; Eli Lilly and Company; EuroImmun; F. Hoffmann-La Roche Ltd and its affiliated company Genentech, Inc.; Fujirebio; GE Healthcare; IXICO Ltd.; Janssen Alzheimer Immunotherapy Research & Development, LLC.; Johnson & Johnson Pharmaceutical Research & Development LLC.; Lumosity; Lundbeck; Merck & Co., Inc.; Meso Scale Diagnostics, LLC.; NeuroRx Research; Neurotrack Technologies; Novartis Pharmaceuticals Corporation; Pfizer Inc.; Piramal Imaging; Servier; Takeda Pharmaceutical Company; and Transition Therapeutics. The Canadian Institutes of Health Research is providing funds to support ADNI clinical sites in Canada. Private sector contributions are facilitated by the Foundation for the National Institutes of Health (http://www.fnih.org). The grantee organization is the Northern California Institute for Research and Education, and the study is coordinated by the Alzheimer’s Therapeutic Research Institute at the University of Southern California. ADNI data are disseminated by the Laboratory for Neuro Imaging at the University of Southern California.
FUNDING
This research was partially funded by the Silesian University of Technology, grant number 02/070/BK_22/0033.
CONFLICT OF INTEREST
The authors have no conflict of interest to report.
DATA AVAILABILITY
Data used in the analysis were obtained from the Alzheimer’s Disease Neuroimaging Initiative (ADNI) database (https://adni.loni.usc.edu/) and The European DTI Study on Dementia (EDSD) (https://www.neugrid2.eu/ and https://neugrid4you.eu/).
SUPPLEMENTARY MATERIAL
[1] The supplementary material is available in the electronic version of this article: https://dx.doi.org/10.3233/JAD-220806.
REFERENCES
[1] | Oboudiyat C , Glazer H , Seifan A , Greer C , Isaacson RS ((2013) ) Alzheimer’s disease. Semin Neurol 33: , 313–329. |
[2] | Alz.org. Available online: https://www.alz.org/media/Documents/alzheimers-dementia-about-alzheimers-disease-ts.pdf Last updated June 2021, Accessed on October 24, 2021. |
[3] | Roberts R , Knopman DS ((2013) ) Classification and epidemiology of MCI. Clin Geriatr Med 29: , 753–772. |
[4] | Moody JN , Valerio KE , Hasselbach AN , Prieto S , Logue MW , Hayes SM , Hayes JP Alzheimer’s Disease Neuroimaging Initiative (ADNI) ((2021) ) Body mass index and polygenic risk for Alzheimer’s disease predict conversion to Alzheimer’s disease. J Gerontol A Biol Sci Med Sci 76: , 1415–1422. |
[5] | Marzban EN , Eldeib AM , Yassine IA , Kadah YM; Alzheimer’s Disease Neurodegenerative Initiative ((2020) ) Alzheimer’s disease diagnosis from diffusion tensor images using convolutional neural networks. PLoS One 15: , e0230409. |
[6] | Agostinho D , Caramelo F , Moreira AP , Santana I , Abrunhosa A , Castelo-Branco M ((2022) ) Combined structural MR and diffusion tensor imaging classify the presence of Alzheimer’s disease with the same performance as MR combined with amyloid positron emission tomography: A data integration approach. Front Neurosci 15: , 638175. |
[7] | Gao Y , Huang H , Zhang L ((2022) ) Predicting Alzheimer’s disease using 3DMgNet. arXiv; arXiv2201.04370v1 [eess.IV]. 10.48550/arXiv.2201.04370 |
[8] | Goenka N , Tiwari S ((2022) ) AlzVNet: A volumetric convolutional neural network for multiclass classification of Alzheimer’s disease through multiple neuroimaging computational approaches. Biomed Signal Process Control 74: , 103500. |
[9] | Tang X , Liu J ((2021) ) Comparing different algorithms for the course of Alzheimer’s disease using machine learning. Ann Palliat Med 10: , 9715–9724. |
[10] | Dyrba M , Hanzig M , Altenstein S , Bader S , Ballarini T , Brosseron F , Buerger K , Cantré D , Dechent P , Dobisch L , Düzel E , Ewers M , Fliessbach K , Glanz W , Haynes JD , Heneka MT , Janowitz D , Keles DB , Kilimann I , Laske C , Maier F , Metzger CD , Munk MH , Perneczky R , Peters O , Preis L , Priller J , Rauchmann B , Roy N , Scheffler K , Schneider A , Schott BH , Spottke A , Spruth EJ , Weber MA , Ertl-Wagner B , Wagner M , Wiltfang J , Jessen F , Teipel SJ ,ADNI, AIBL, DELCODE study groups((2021) ) Improving 3D convolutional neural network comprehensibility via interactive visualization of relevance maps: Evaluation in Alzheimer’s disease. Alzheimers Res Ther 13: , 191. |
[11] | Li B , Zhang M , Riphagen J , Morrison Yochim K , Li B , Liu J , Salat DH Alzheimer’s Disease Neuroimaging Initiative ((2020) ) Prediction of clinical and biomarker conformed Alzheimer’s disease and mild cognitive impairment from multi-feature brain structural MRI using age-correction from a large independent lifespan sample. Neuroimage Clin 28: , 102387. |
[12] | Bae JB , Lee S , Jung W , Park S , Kim W , Oh H , Han JW , Kim GE , Kim JS , Kim JH , Kim KW ((2020) ) Identification of Alzheimer’s disease using a convolutional neural network model based on T1-weighted magnetic resonance imaging. Sci Rep 10: , 22252. |
[13] | Liu M , Li F , Yan H , Wang K , Ma Y , Shen L , Xu M Alzheimer’s Disease Neuroimaging Initiative ((2020) ) A multi-model deep convolutional neural network for automatic hippocampus segmentation and classification in Alzheimer’s disease. Neuroimage 208: , 116459. |
[14] | Di Stefano F , Epelbaum S , Coley N , Cantet C , Ousset PJ , Hampel H , Bakardjian H , Lista S , Vellas B , Dubois B , Andrieu S GuidAge study group ((2015) ) Prediction of Alzheimer’s disease dementia: Data from the GuidAge Prevention Trial. J Alzheimers Dis 48: , 793–804. |
[15] | Buckley RF , Maruff P , Ames D , Bourgeat P , Martins RN , Masters CL , Rainey-Smith S , Lautenschlager N , Rowe CC , Savage G , Villemagne VL , Ellis KA AIBL study ((2016) ) Subjective memory decline predicts greater rates of clinical progression in preclinical Alzheimer’s disease. Alzheimers Dement 12: , 796–804. |
[16] | Ampuero I , Ros R , Royuela A , Abraira V , del Ser T , García-Ribas G , García de Yébenes J ((2008) ) Risk factors for dementia of Alzheimer type and aging-associated cognitive decline in a Spanish population based sample, and in brains with pathology confirmed Alzheimer’s disease. J Alzheimers Dis 14: , 179–191. |
[17] | Buratti L , Balestrini S , Altamura C , Viticchi G , Falsetti L , Luzzi S , Provinciali L , Vernieri F , Silvestrini M ((2015) ) Markers for the risk of progression from mild cognitive impairment to Alzheimer’s disease. J Alzheimers Dis 45: , 883–890. |
[18] | Haris M , Yadav SK , Rizwan A , Singh A , Cai K , Kaura D , Wang E , Davatzikos C , Trojanowski JQ , Melhem ER , Marincola FM , Borthakur A ((2015) ) T1rho MRI and CSF biomarkers in diagnosis of Alzheimer’s disease. Neuroimage Clin 7: , 598–604. |
[19] | Seixas FL , Zadrozny B , Laks J , Conci A , Muchaluat Saade DC ((2014) ) A Bayesian network decision model for supporting the diagnosis of dementia, Alzheimer’s disease and mild cognitive impairment. Comput Biol Med 51: , 140–58. |
[20] | Iddi S , Li D , Aisen PS , Rafii MS , Thompson WK , Donohue MC Alzheimer’s Disease Neuroimaging Initiative ((2019) ) Predicting the course of Alzheimer’s progression. Brain Inform 6: , 6. |
[21] | Beheshti I , Demirel H , Matsuda H; Alzheimer’s Disease Neuroimaging Initiative ((2017) ) Classification of Alzheimer’s disease and prediction of mild cognitive impairment-to-Alzheimer’s conversion from structural magnetic resource imaging using feature ranking and a genetic algorithm. Comput Biol Med 83,: , 109–119. |
[22] | Zheng C , Xia Y , Pan Y , Chen J ((2016) ) Automated identification of dementia using medical imaging: A survey from a pattern classification perspective. Brain Inform 3: , 17–27. |
[23] | Zhang R , Giancardo L , Pena D , Kim Y , Tong H , Jiang X Alzheimer’s Disease Neuroimaging Initiative (2019) From brain imaging to graph analysis: A study on ADNI’s patient cohort. arXiv; arXiv1905.05861v1. |
[24] | Westman E , Muehlboeck JS , Simmons A ((2012) ) Combining MRI and CSF measures for classification of Alzheimer’s disease and prediction of mild cognitive impairment conversion. Neuroimage 62: , 229–38. |
[25] | Nozadi SH , Kadoury S The Alzheimer’s Disease Neu-roimaging Initiative (2018) Classification of Alzheimer’s and MCI patients from semantically parcelled PET images: A comparison between AV45 and FDG-PET. Int J Biomed Imaging 2018, 1247430. |
[26] | Rice L , Bisdas S ((2017) ) The diagnostic value of FDG and amyloid PET in Alzheimer’s disease-A systematic review. Eur J Radiol 94: , 16–24. |
[27] | Lee JC , Kim SJ , Hong S , Kim Y ((2019) ) Diagnosis of Alzheimer’s disease utilizing amyloid and tau as fluid biomarkers. Exp Mol Med 51: , 1–10. |
[28] | Becerra-Laparra I , Cortez-Conradis D , Garcia-Lazaro HG , Martinez-Lopez M , Roldan-Valadez E ((2020) ) Radial diffusivity is the best global biomarker able to discriminate healthy elders, mild cognitive impairment, and Alzheimer’s disease: A diagnostic study of DTI-derived data. Neurol India 68: , 427–434. |
[29] | Chandra A , Dervenoulas G , Politis M Alzheimer’s Disease Neuroimaging Initiative ((2019) ) Magnetic resonance imaging in Alzheimer’s disease and mild cognitive impairment. . J Neurol 266: , 1293–1302. |
[30] | Hansson O , Seibyl J , Stomrud E , Zetterberg H , Trojanowski JQ , Bittner T , Lifke V , Corradini V , Eichenlaub U , Batrla R , Buck K , Zink K , Rabe C , Blennow K , Shaw LM Swedish BioFINDER study group; Alzheimer’s Disease Neuroimaging Initiative ((2018) ) CSF biomarkers of Alzheimer’s disease concord with amyloid-β PET and predict clinical progression: A study of fully automated immunoassays in BioFINDER and ADNI cohorts. Alzheimers Dement 14: , 1470–1481. |
[31] | Wolz R , Julkunen V , Koikkalainen J , Niskanen E , Zhang DP , Rueckert D , Soininen H , Lötjönen J Alzheimer’s Disease Neuroimaging Initiative ((2011) ) Multi-method analysis of MRI images in early diagnostics of Alzheimer’s disease. PLoS One 6: , e25446. |
[32] | Folstein MF , Folstein SE , McHugh PR ((1975) ) “Mini-mental state”. A practical method for grading the cognitive state of patients for the clinician. J Psychiatr Res 12: , 189–198. |
[33] | Frisoni GB , Fox NC , Jack CR Jr , Scheltens P , Thompson PM ((2010) ) The clinical use of structural MRI in Alzheimer disease. Nat Rev Neurol 6: , 67–77. |
[34] | Zetterberg H , Bendlin BB ((2021) ) Biomarkers for Alzheimer’s disease-preparing for a new era of disease-modifying therapies. Mol Psychiatry 26: , 296–308. |
[35] | Brueggen K , Grothe MJ , Dyrba M , Fellgiebel A , Fischer F , Filippi M , Agosta F , Nestor P , Meisenzahl E , Blautzik J , Frölich L , Hausner L , Bokde ALW , Frisoni G , Pievani M , Klöppel S , Prvulovic D , Barkhof F , Pouwels PJW , Schröder J , Hampel H , Hauenstein K , Teipel S ((2017) ) The European DTI Study on Dementia - A multicenter DTI and MRI study on Alzheimer’s disease and mild cognitive impairment. Neuroimage 144: , 305–308. |
[36] | Wyman BT , Harvey DJ , Crawford K , Bernstein MA , Carmichael O , Cole PE , Crane PK , DeCarli C , Fox NC , Gunter JL , Hill D , Killiany RJ , Pachai C , Schwarz AJ , Schuff N , Senjem ML , Suhy J , Thompson PM , Weiner M , Jack CR Jr Alzheimer’s Disease Neuroimaging Initiative ((2013) ) Standardization of analysis sets for reporting results from ADNI MRI data. Alzheimers Dement 9: , 332–337. |
[37] | Stone M ((1974) ) Cross-validatory choice and assessment of statistical predictions. J R Stat Soc Series B Methodol 36: , 111–147. |
[38] | ADNI documents. Available online https://adni.loni.usc.edu/methods/documents/mri-protocols/ Accessed on October 30 2022. |
[39] | ADNI documents. Available online: https://adni.loni.usc.edu/wp-content/themes/freshnews-dev-v2/documents/clinical/ADNI-1Protocol.pdf/ Accessed on January 14, 2023. |
[40] | Tustison NJ , Avants BB , Cook PA , Zheng Y , Egan A , Yushkevich PA , Gee JC ((2010) ) N4ITK: Improved N3 bias correction. IEEE Trans Med Imaging 29: , 1310–1320. |
[41] | Penny WD , Ashburner J , Kiebel S , Henson R , Glaser DE , Phillips C , Friston K (2001) Statistical parametric mapping: An annotated bibliography. Wellcome Department of Cognitive Neurology, University College London.https://www.fil.ion.ucl.ac.uk/spm/doc/spmbib.pdf |
[42] | Cohen J ((1973) ) Eta-squared and partial eta-squared in fixed factor Anova designs. Educ Psychol Meas 33: , 107–112. |
[43] | Ellis PD ((2010) ) The Essential Guide to Effect Sizes: Sta- 928 tistical Power, Meta-Analysis, and the Interpretation of Research Results. Cambridge University Press. |
[44] | Binczyk F , Stjelties B , Weber C , Goetz M , Maier-Hein K , Meinzer HP , Bobek-Billewicz B , Tarnawski R , Polanska J ((2017) ) MiMSeg - an algorithm for automated detection of tumor tissue on NMR apparent diffusion coefficient maps. Inform Sci 384: , 235–248. |
[45] | Kempton MJ , Underwood TS , Brunton S , Stylios F , Schmechtig A , Ettinger U , Smith MS , Lovestone S , Crum WR , Frangou S , Williams SC , Simmons A ((2011) ) A comprehensive testing protocol for MRI neuroanatomical segmentation techniques: Evaluation of a novel lateral ventricle segmentation method. Neuroimage 58: , 1051–1059. |
[46] | Wit E , Heuvel E , Romeyn JW ((2012) ) ‘All models are wrong…’: An introduction to model uncertainty. Stat Neerl 66: , 217–236. |
[47] | Agresti A ((1999) ) On logit confidence intervals for the odds ratio with small samples. Biometrics 55: , 597–602. |
[48] | García Barrado L , Coart E , Burzykowski T Alzheimer’s Disease Neuroimaging Initiative ((2016) ) Development of a diagnostic test based on multiple continuous biomarkers with an imperfect reference test. Stat Med 35: , 595–608. |
[49] | Eskildsen SF , Coupé P , García-Lorenzo D , Fonov V , Pruessner JC , Collins DL Alzheimer’s Disease Neuroimaging Initiative ((2013) ) Prediction of Alzheimer’s disease in subjects with mild cognitive impairment from the ADNI cohort using patterns of cortical thinning. Neuroimage 65: , 511–21. |
[50] | Estévez-Santé S , Jiménez-Huete A ADNI group ((2020) ) Comparative analysis of methods of volume adjustment in hippocampal volumetry for the diagnosis of Alzheimer disease. J Neuroradiol 47: , 161–165. |
[51] | Martínez-Torteya A , Treviño V , Tamez-Peña JG ((2015) ) Improved diagnostic multimodal biomarkers for Alzheimer’s disease and mild cognitive impairment. Biomed Res Int 2015: , 961314. |
[52] | Tokumitsu K , Yasui-Furukori N , Takeuchi J , Yachimori K , Sugawara N , Terayama Y , Tanaka N , Naraoka T , Shimoda K ((2021) ) The combination of MMSE with VSRAD and eZIS has greater accuracy for discriminating mild cognitive impairment from early Alzheimer’s disease than MMSE alone. PLoS One 16: , e0247427. |
[53] | Sheelakumari R , Sarma SP , Kesavadas C , Thomas B , Sasi D , Sarath LV , Justus S , Mathew M , Menon RN ((2018) ) Multimodality neuroimaging in mild cognitive impairment: A cross-sectional comparison study. Ann Indian Acad Neurol 21: , 133–139. |


