
Efficacy of Glucose Metabolism-Related Indexes on the Risk and Severity of Alzheimer’s Disease: A Meta-Analysis
Abstract
Background:
Considering the strong correlation made between Alzheimer’s disease (AD) and the pathology of glucose metabolism disorder, we sought to analyze the effects of fasting blood glucose (FBG) level, fasting plasma insulin (FINS) level, and insulin resistance index (HOMA-IR) on the risk and severity of AD.
Objective:
Reveal the pathological relationship between AD and insulin resistance.
Methods:
We searched 5 databases from inception through April 4, 2022. Meta-regression was conducted to identify if there were significant differences between groups. Shapiro-Wilk test and the Q-Q diagram were applied to evaluate the normality of variables. A multiple logistic regression model was employed to explore the association between FBG, FINS, HOMA-IR, and Mini-Mental State Examination scale score (MMSE).
Results:
47 qualified articles including 2,981 patients were enrolled in our study. FBG (p < 0.001), FINS (p < 0.001), and HOMA-IR (p < 0.001) were higher in AD patients than in controls. HOMA-IR was negatively correlated with MMSE (p = 0.001) and positively related to the sex ratio (male versus female) (p < 0.05). HOMA-IR obeyed lognormal distribution (p > 0.05), and the 95% bilateral boundary values were 0.73 and 10.67. FBG (p = 0.479) was positively correlated to MMSE, while FINS (p = 0.1657) was negatively correlated with MMSE.
Conclusion:
The increase in the levels of FBG, FINS, and HOMA-IR served as precise indicators of the risk of AD. HOMA-IR was found to be correlated to the increasing severity of AD, especially in male AD patients.
INTRODUCTION
Alzheimer’s disease (AD) is a neurodegenerative disease that mostly affects the elderly. The pathogenesis of AD is complex and unclear. Its pathological features include extraneuronal toxic amyloid-β protein (Aβ) accumulation and the formation of senile plaques, hyperphosphorylation of tau protein that forms tangles in the nerve fibers, a decline in the regional specific-brain glucose metabolism, synaptic dysfunction, and mitochondrial dysfunction of the brain neurons [1]. In recent years, a close correlation has been reported between blood glucose levels and AD. There are several common pathological mechanisms between diabetes and AD. Therefore, AD is also known as “type-3 diabetes” [2]. However, it is unclear as to how the blood glucose levels mediate the pathology of AD. Some studies suggest that the HOMA-IR level of AD patients is relatively higher than that of healthy people [3], while others assert no significant difference in the insulin level between AD patients and healthy people [4]. Moreover, some studies reported no correlation between the blood glucose level and the Braak stage [5]. Braak stages I to VI mark the progression of tau-based neurofibrillary tangle pathology from least to greatest within the medial temporal lobe memory circuit in AD [6]. Rather, they considered that the plasma insulin index and the insulin resistance index were positively correlated with the severity of AD [7]. This present study collected and arranged the reported literature on the related indexes of glucose metabolism and the incidence and severity of AD across the world to analyze the fasting blood glucose level (FBG), plasma insulin level (FINS), insulin resistance index (HOMA-IR, HOMA-IR = FBG×FINS/22.5), and the prevalence and severity of AD through a meta-analysis to explore whether the blood glucose level-related indicators can act as a biological marker of the risk and severity of AD, which is conducive to timely clinical diagnosis and treatment of AD.
METHODS
Adoption principle and exclusion criteria
We adopted the (patient/intervention/comparison/results/study design) PICOS framework as our qualification criteria, and hence only considered case-control studies that met the following requirements: 1) Participants: the case group included patients diagnosed with AD but did not suffer from sugar metabolism diseases, such as diabetes. The control group was composed of healthy individuals. The participants were not limited by nationality, race, age, gender, and disease duration; 2) Intervention and comparison: neither the patient group nor the control group received treatment to regulate blood glucose level or insulin resistance; 3) Results: the main outcomes of this systematic analysis were the relationship between the changes in the FBG, FINS, and HOMA-IR levels and the risk and severity of AD. In addition, the normality test of continuous variables was the secondary outcome of this analysis. 4) Study design: only case-control studies were considered in the current survey study.
The following criteria were considered as the exclusion criteria for the case-control trials: 1) the patient group and the control group received treatment to regulate their blood glucose level or insulin resistance during the trial; 2) publications were reproduced; 3) difficulty in extracting any of the four indicator data; 4) no relevant outcomes; 5) the patients had serious complications, such as glucose metabolism diseases like diabetes.
Retrieval strategy
We searched PubMed, Embase, the Web of Science, Wan-Fang database (WF), and China National Knowledge Infrastructure (CNKI) for the search. The included studies were published from the base of each database until April 4, 2022. The topic search employed combined medical topic title terminology with free-text terminology. The search terms included the following: “blood glucose”, “insulin”, “insulin sensitivity”, “insulin resistance”, “memory”, “dementia”, and “Alzheimer’s disease”. Table 1 shows the specific search process adopted for PubMed. In addition, we manually searched for references from the literature.
Table 1
The specific retrieval process of PubMed
| Serial number | Strategy |
| #1 | (((dementia[MeSH Major Topic]) OR (Alzheimer’s disease[MeSH Major Topic])) OR (memory[MeSH Major Topic])) AND ((blood sugar[MeSH Major Topic]) OR (blood glucose[MeSH Major Topic])) |
| #2 | ((dementia[MeSH Major Topic]) OR (Alzheimer’s disease[MeSH Major Topic])) AND (((insulin sensitivity[MeSH Major Topic]) OR (insulin[MeSH Major Topic])) OR (insulin resistance[MeSH Major Topic])) |
| #3 | #1 AND #2 |
| #4 | Animals(MeSH Terms) |
| #5 | Humans(MeSH Terms) |
| #6 | #4 NOT #5 |
| #7 | #3 NOT #6 |
*#4 NOT #5 means that the documents retrieved in strategy #5 were excluded from the documents retrieved in strategy #4. #3 NOT #6 means only human studies were collected.
Document collection and data extraction
Two researchers completed the literature collection independently, and the Endnote20.0 software was used to create the obtained article library. First, the repetitive articles were eliminated. Then, the researchers read the titles and the abstracts of the article based on the inclusion and exclusion criteria in advance for preliminary screening. The next step was to re-screen the articles by reading the full text with reference to the inclusion and exclusion criteria. If the results were controversial at any stage, the third researcher participated in additional discussions on the inclusion of the disputed literature. Furthermore, relevant data were fetched, including the publication date, the name of the first author, title, specific characteristics of the participants (such as the sample size, age, and gender), biochemical parameters, and the scale scores (such as FBG, FINS, HOMA-IR, and Mini-Mental State Examination (MMSE) scores), results (such as the primary and secondary outcomes), and the elements used to assess the risk of bias. Because the sample size of each existing relevant study on the correlation was small, it was our expectation to expand the sample size and collect more FBG, FINS, HOMA-IR, and MMSE data of patients and control group to obtain scientific conclusions. Relevant data in each literature meeting the inclusion criteria were collected and recorded in the form of mean±SD. These data constituted a large sample size, which was systematically analyzed to draw conclusions.
Deviation risk assessment
Based on the Newcastle-Ottawa Scale (NOS) [8], the quality assessment of all accepted case-control trials was independently conducted by two researchers. According to the three dimensions of the NOS scale, there were 8 items in total: 4 items were selected by the research object (1 item of inter-group comparability and 3 items of result measurement). In addition to the highest 2 points for the comparability between groups, the highest 1 point could be obtained for other items, ranging from 0 to 9 points. The higher the total score, the greater the research quality. In case of an inconsistency between two researchers, the final result was resolved by reaching an agreement with the third researcher.
Subject information
The control group was composed of age- and gender-matched elderly with normal cognition. The control group had no signs of AD, past or present mental disorder, alcoholism, head trauma, hypoxia or nervous system disease, kidney or liver disease, diabetes, chronic obstructive pulmonary disease, hypertension, previous myocardial infarction, congestive heart failure, or arrhythmia. In the literature, according to the specific questionnaire evaluation, the control group had a negative history of local neurological signs and symptoms. In the research of Kilander et al. [9], two people in the control group suffered from mild hypertension and three people suffered from coronary heart disease. No one received medication that affected glucose metabolism, all of them did physical activity.
In order to exclude the impact of insulin resistance in diabetes, the included AD group were AD patients without diabetes, severe diabetes, or family history of diabetes. Only in the research of Kilander et al. [9], there were two patients with diet controlled mild diabetes, and the fasting blood glucose level was about 7 mmol /L. The patient did not take any antidiabetic drugs and other drugs that affect glucose metabolism. Except for the study of Kilander et al. [9] with 13 patients had a family history of AD positive, other research did not clarify whether patients had a family history of AD. In the research of Kilander et al. [9], 3 patients had a history of mild hypertension and 1 patient had mild angina. The remaining included research excluded dementia patients with previous stroke or transient ischemic attack, ischemic heart disease history, previous myocardial infarction, congestive heart failure or arrhythmia, alcoholism, head trauma, hypoxia or neurological diseases other than AD, kidney or liver diseases, diabetes, chronic obstructive pulmonary disease, hypertension.
Statistical processing and analysis
For binary variables, the results were presented as odds ratios (OR) and 95% confidence intervals (95% CIs). The OR value is (number of people exposed in the case group /number of people not exposed) /(number of people exposed in the control group /number of people not exposed). For continuous variables, the results were expressed as standardized mean difference (SMD) as well as 95% CIs. In addition, the results were considered to indicate a statistically significant difference when the 95% CIs of the SMD did not contain 0 or the 95% CIs of OR did not contain 1. Moreover, for experiments with at least two studies for each result, a paired meta-analysis was performed using the random-effect model. The normality of variables was evaluated by Shapiro–Wilk test, assisted by the Q-Q diagram. If necessary, the logarithm of variables was derived to test the normality. If the variable conformed to the normal distribution or lognormal distribution, the 95% bilateral boundary value of the variable was calculated. In addition, after controlling the potential and potential confounding variables (such as age and gender) that could affect the results, linear regression analysis was conducted for each biochemical parameter as an independent variable and the MMSE score as a dependent variable to evaluate the relationship between AD severity and relevant biochemical parameters. The t-test was used whenever necessary.
In a standard paired meta-analysis, statistical heterogeneity was tested by calculating the I2 statistics. If I2 ≤50%, the heterogeneity was not deemed obvious. When the number of studies was sufficient, a funnel chart was prepared to determine any publication bias. Finally, a sensitivity analysis was conducted: we adopted the method of elimination one-by-one to conduct a meta-analysis in order to determine the independent effect of each research on the aggregated estimates. Stata16.0 software was used to obtain the statistical results and the relevant statistical charts of the data collected in this systematical analysis.
RESULTS
Literature collection
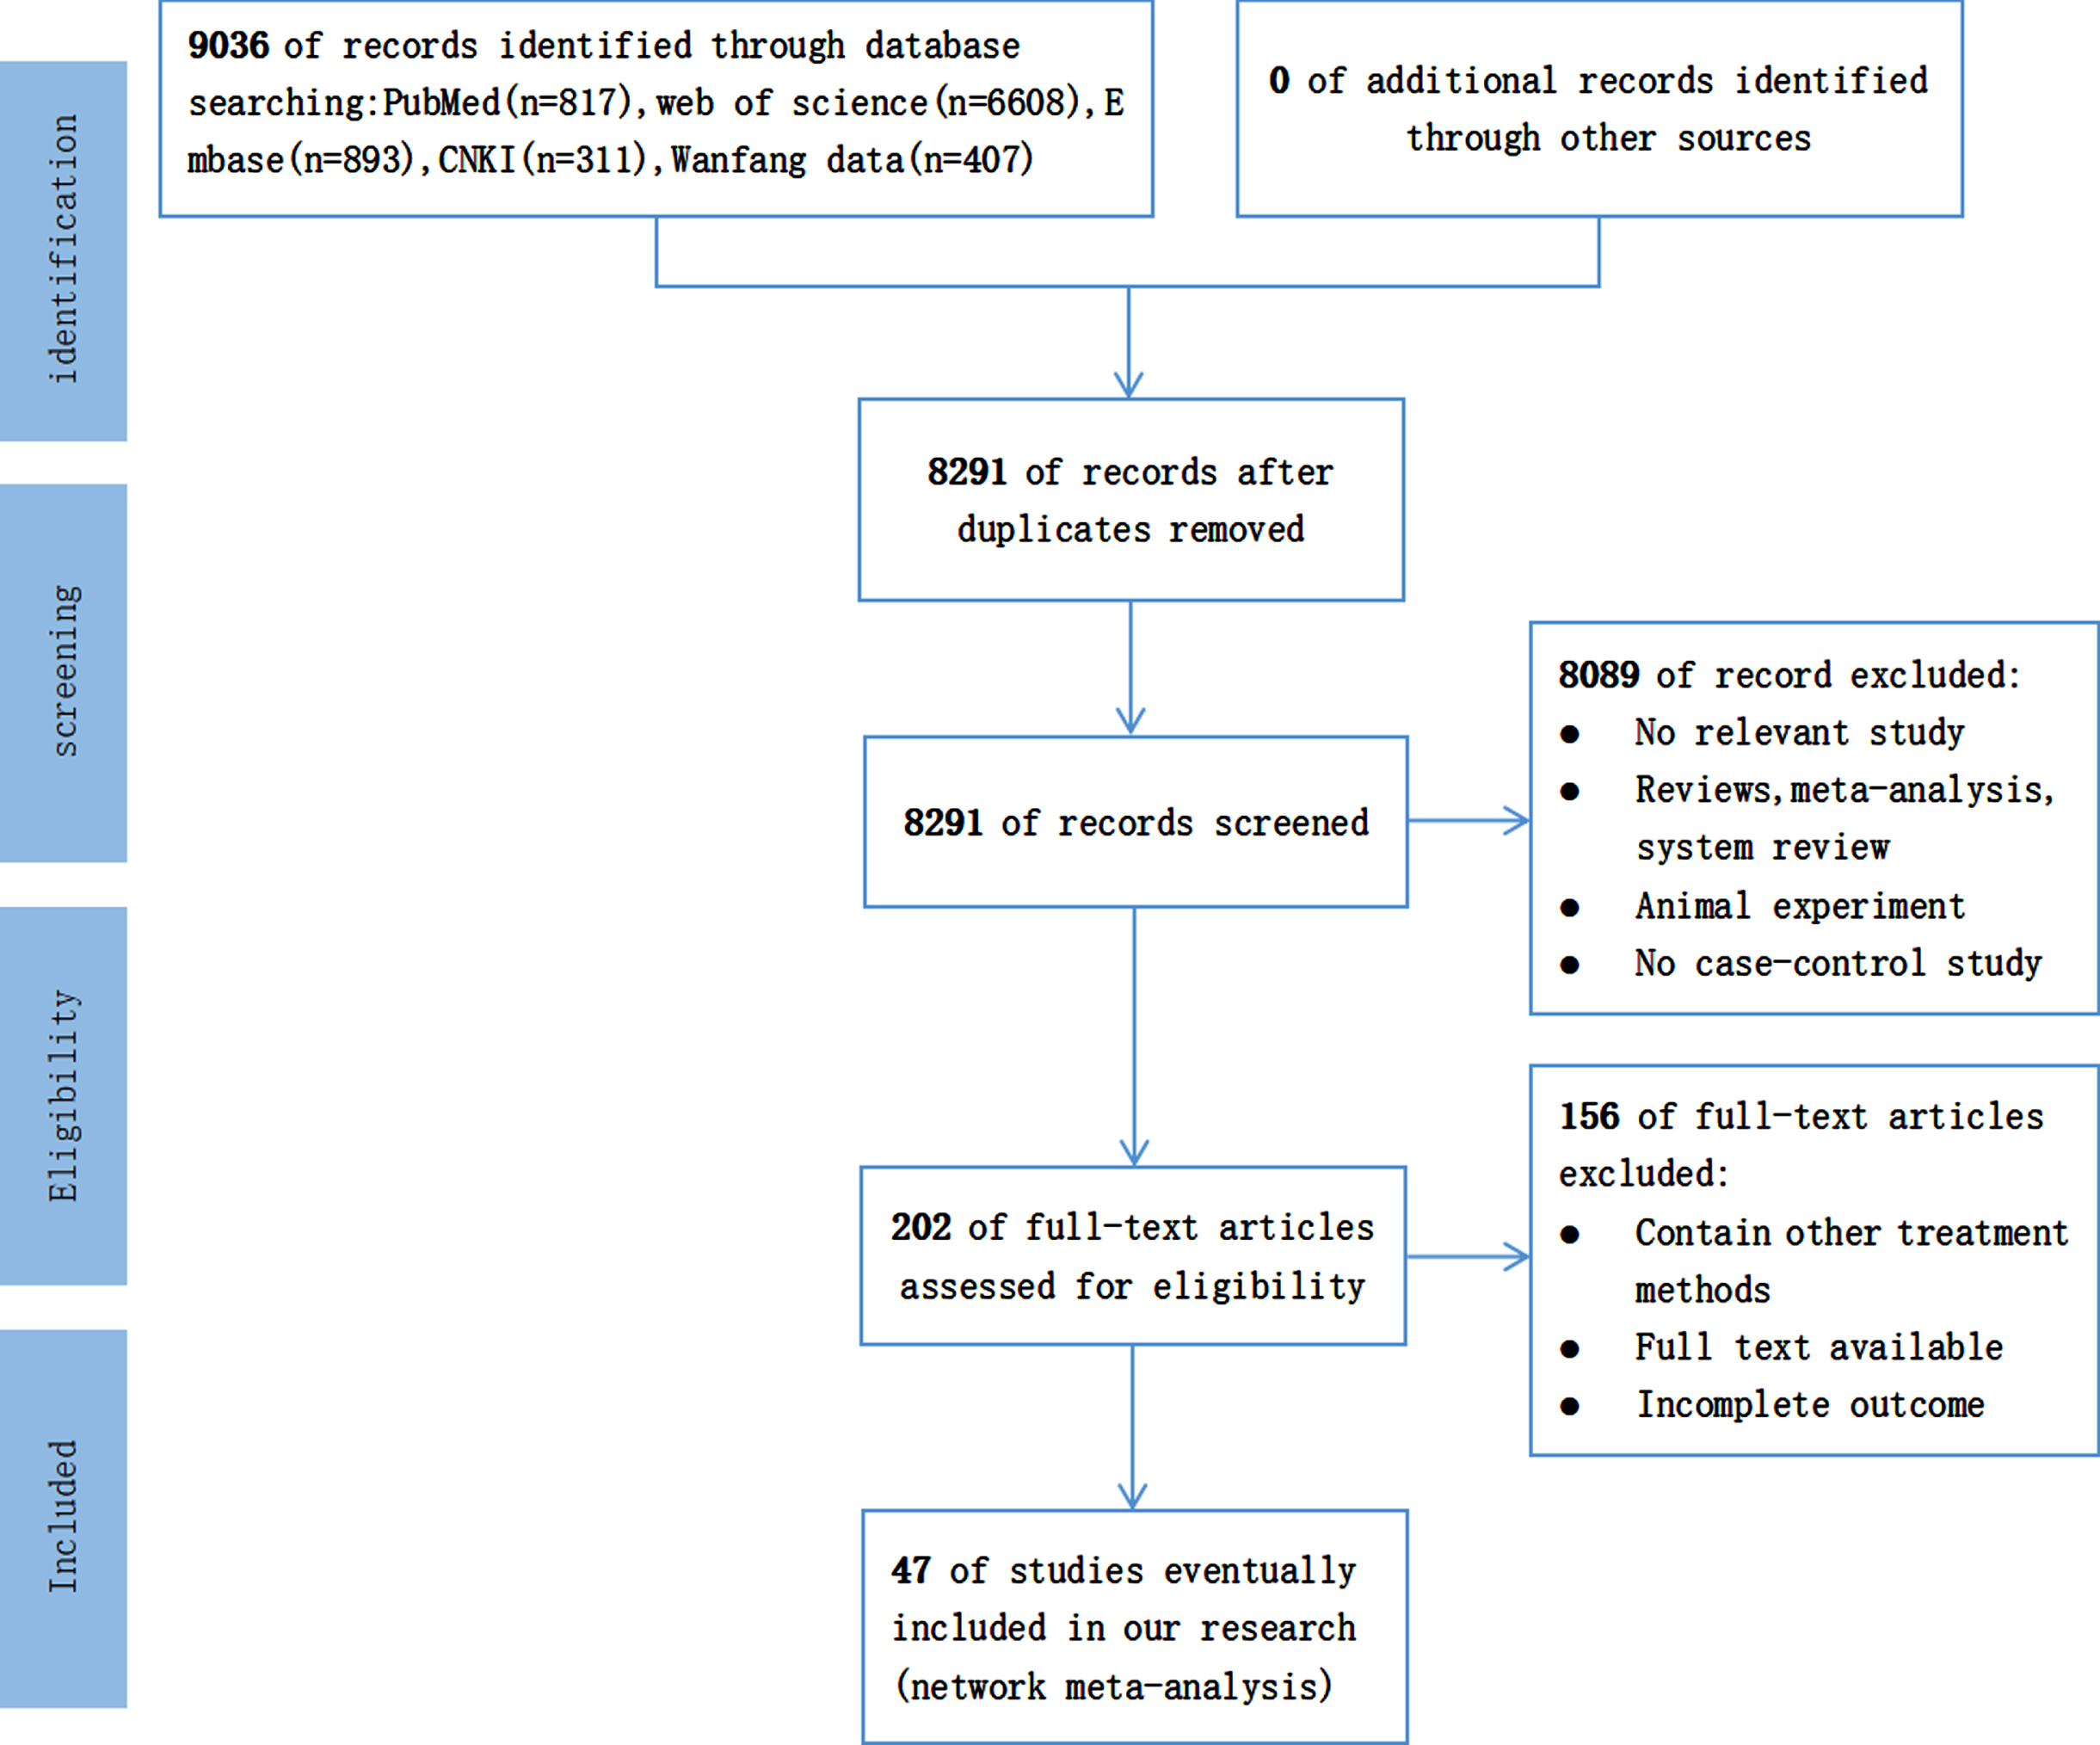
Initially, 9,036 articles were retrieved, including 311 articles from CNKI, 407 articles from the Wan-fang data, 6,608 articles from the Web of Science, 893 articles from Embase, and 817 articles from PubMed. After eliminating the duplicate articles, 8,291 articles were considered. We eliminated research unrelated to our systematic analysis based on the title and abstract of each publication. Furthermore, we carefully read all the contents of the remaining 202 articles to retrieve articles agreeing with the PICOS principles. Finally, a total of 47 articles were considered for further assessment. In conclusion, only case-control studies were selected for the comparison of relevant biochemical parameters between the AD patients and control groups. In addition, the patient’s condition was required to meet our prerequisites. Moreover, the results in the literature were required to have the main result. The PRISMA diagram depicted in Fig. 1 shows in detail the literature screening process.
Fig. 1
Literature screening flow chart (CNKI, China National Knowledge Infrastructure; n, number of articles).
Study characteristics
Overall, a total of 58 case-control trials (Table 2) involving 2,981 AD patients were assessed. Among them, in the studies of Zhang et al. [10], Liu et al. [11], Yue et al. [12], Xia et al. [13], and Fu et al. [14], the researchers divided AD patients into different subgroups according to MMSE scores. In our systematic analysis, these different subgroups had been carried out case-control trails one by one with the corresponding control groups. Therefore, there are 58 sets of case-control trials included in the analysis. Patients included in the study were mostly middle-aged or elderly and none suffered from sugar metabolism diseases such as diabetes. All articles included the comparison of relevant biochemical parameters between AD patients and healthy individuals. The following three groups of comparison formed part of our systematic analysis: FBG in control group versus AD patient group (n = 47), FINS in control group versus AD patient group (n = 39), and HOMA-IR in control group versus AD patient group (n = 36). Moreover, some articles involved the correlation between biochemical parameters and AD severity in AD patients. The following three groups of correlation formed part of our systematic analysis: FBG and MMSE scores in the patient groups, FINS and MMSE scores in the patient groups, and HOMA-IR and MMSE scores in the patient groups. As previously listed, the researchers divided the sub-component types of AD patients according to MMSE scores, we adopted the various data of sub-component types of patients to compare with the corresponding data in control group.
Table 2
Characteristic of the articles included in this systematical analysis
| AD group | Control group | |||||||||||||||
| Study ID | First author’s name | year | Sample size | Sex (M/F) | Age (y) | FBG | FINS | HOMA-IR | MMSE | Sample size | Sex (M/F) | Age (y) | FBG | FINS | HOMA-IR | MMSE |
| 1 | Bucht et al. [52] | 1983 | 45 | 22/23 | 70.1±7.8 | 4.31±0.62 | – | – | – | 31 | 16/15 | 67.6±3.5 | 4.53±0.54 | – | – | – |
| 2 | Kilander et al. [9] | 1993 | 24 | 10/14 | 72.5±7.2 | 5.1±0.7 | 7.1±4.3 | – | – | 24 | 11/13 | 71.5±4.3 | 5.1±0.5 | 6.0±3.8 | – | – |
| 3 | Craft et al. [53] | 1998 | 25 | – | 72.4±5.6 | 92.3±15.3 | – | – | – | 14 | – | 71.2±5.9 | 90.9±8.0 | – | – | – |
| 4 | Craft et al. [54] | 1999 | 32 | 22/10 | 72.0±9.0 | 104.8±11.0 | – | – | – | 23 | 14/11 | 70.6±7 | 100.5±6.9 | – | – | – |
| 5 | Carantoni et al. [45] | 2000 | 24 | 6/14 | 83±7 | 102±3 | 9±2 | – | – | 66 | 32/34 | 85±2 | 90±2 | 6±0.3μU/ml | – | – |
| 6 | Yue et al. [55] | 2008 | 73 | 38/35 | 71.54±11.64 | – | – | 2.51±1.46 | – | 60 | 34/26 | 70.96±9.97 | – | – | 1.76±1.61 | – |
| 7 | Sun et al. [56] | 2010 | 45 | 16/29 | – | 5.07±0.93 | 12.36±8.627 | 2.938±2.440 | – | 44 | 14/30 | – | 5.16±2.44 | 6.541±9.120 | 4.446±3.287 | – |
| 8 | García-Lara et al. [57] | 2010 | 90 | 27/63 | 81.0±6.8 | 126.9±50.2 | – | – | – | 180 | 54/126 | 80.8±6.7 | 108.9±35.6 | – | – | – |
| 9 | Ramdane et al. [58] | 2011 | 150 | 84/66 | 75.3±7.7 | 88.9±13.2 | – | – | – | 320 | 160/160 | 74.3±11.6 | 90.2±12.4 | – | – | – |
| 10 | Chen [17] | 2012 | 32 | 22/11 | 76±9 | 5.23±0.62 | 7.91±6.56 | 1.80±1.41 | – | 30 | 20/10 | 77±7 | 4.98±0.47 | 9.28±5.40 | 2.07±1.23 | – |
| 11 | Li [18] | 2013 | 55 | 25/30 | 72.69±4.13 | 5.78±0.50 | 97.18±10.31 | 3.21±0.12 | – | 30 | 14/16 | 72.67±5.44 | 5.61±0.50 | 67.93±14.75 | 2.83±0.24 | – |
| 12 | Li et al. [6] | 2013 | 55 | 20/35 | 73.25±9.85 | 5.04±0.53 | 5.75±4.23 | 1.31±1.01 | – | 70 | 36/34 | 73.56±8.19 | 5.16±0.39 | 3.71±1.87 | 0.86±0.43 | – |
| 13 | Huang et al. [59] | 2013 | 51 | 20/31 | 77.09±5.36 | 5.77±1.30 | – | – | – | 30 | 15/15 | 78.26±4.78 | 4.95±0.51 | – | – | – |
| 14 | Morris et al. [60] | 2014 | 20 | 12/8 | 72.4±5.1 | 102.4±14.5 | 16.25±5.9 | 2.15±0.81 | – | 21 | 14/7 | 71.7±6.2 | 93.4±4.6 | 10.95±4.3 | 1.45±0.54 | – |
| 15 | Wang et al. [19] | 2014 | 30 | 17/13 | 67.3±7.6 | 5.50±0.61 | 7.94±5.51 | 1.77±1.53 | – | 20 | 12/8 | 64.7±12.4 | 4.96±0.43 | 9.25±5.51 | 2.09±1.26 | – |
| 16 | Wang et al. [20] | 2014 | 68 | 43/25 | 74.1±5.8 | 5.38±0.32 | 7.82±6.46 | 2.73±1.51 | – | 36 | 26/10 | 76.3±2.9 | 4.79±0.55 | 8.37±5.31 | 1.21±1.36 | – |
| 17 | Monacelli et al. [29] | 2015 | 84 | 36/48 | 73.37±1.05 | 92.40±1.31 | 9.14±0.50 | 1.19±0.07 | – | 62 | 31/31 | 73.74±0.81 | 89.07±1.43 | 8.63±0.43 | 1.57±0.16 | – |
| 18 | Li et al. [21] | 2015 | 80 | 42/38 | 72.9±1.9 | 5.51±0.05 | 7.94±0.83 | 1.77±1.52 | – | 70 | 38/32 | 72.8±3.1 | 4.28±0.52 | 8.23±1.04 | 2.01±1.05 | – |
| 19 | Li et al. [22] | 2015 | 126 | 66/60 | 76.96±7.58 | 7.39±1.23 | 11.78±6.6 | 2.77±1.78 | – | 120 | 60/60 | 75.14±12.98 | 5.31±1.04 | 6.28±3.36 | 1.52±1.02 | – |
| 20 | Zhang et al. [10] | 2015 | 61 | – | 69.7±5.5 | 5.7±0.9 | 17.87±2.25 | 4.65±1.61 | – | 60 | 25/35 | 69.1±5.6 | 4.1±1.5 | 11.15±1.60 | 2.05±1.02 | – |
| 21 | Zhang et al. [10] | 2015 | 46 | – | 67.9±6.1 | 5.6±1.2 | 27.69±1.91 | 6.65±1.67 | – | 60 | 25/35 | 69.1±5.6 | 4.1±1.5 | 11.15±1.60 | 2.05±1.02 | – |
| 22 | Zhang et al. [10] | 2015 | 29 | – | 68.3±5.0 | 4.8±1.0 | 35.30±1.70 | 8.53±1.65 | – | 60 | 25/35 | 69.1±5.6 | 4.1±1.5 | 11.15±1.60 | 2.05±1.02 | – |
| 23 | Morris et al. [61] | 2016 | 14 | 9/5 | 71.2±4.0 | 102.8±9.1 | 8.73±7.8 | 2.01±2.3 | – | 37 | 13/24 | 72.4±6.6 | 102.6±17.5 | 4.19±3.8 | 1.09±1.1 | – |
| 24 | Pan et al. [4] | 2016 | 45 | 26/19 | 68.9±3.4 | 5.5±0.5 | 7.7±4.5 | 2.7±1.4 | – | 45 | 24/21 | 68.7±2.9 | 4.7±0.6 | 9.4±4.9 | 1.2±0.9 | – |
| 25 | Zhang et al. [23] | 2016 | 43 | 22/21 | 76.54±7.59 | 7.38±1.22 | 11.79±6.62 | 2.79±1.76 | – | 43 | 25/18 | 75.16±12.95 | 5.30±1.02 | 6.25±3.34 | 1.50±1.04 | – |
| 26 | Macesic et al. [62] | 2017 | 62 | 18/44 | 73.1±5.8 | 5.6±1.0 | 18.6±8.2 | 4.6±2.2 | – | 40 | 20/20 | 68.4±5.5 | 5.1±0.4 | 7.2±4.3 | 1.5±1.0 | – |
| 27 | Liu et al. [24] | 2017 | 46 | 25/21 | 72.78±1.96 | 5.96±0.13 | 7.98±0.73 | 2.13±1.02 | – | 46 | 24/22 | 72.65±1.78 | 5.31±0.16 | 8.36±0.98 | 1.47±0.62 | – |
| 28 | Mu et al. [63] | 2017 | 78 | 36/42 | 77.05± | 5.28±1.33 | 8.73±5.81 | 2.05±1.40 | – | 33 | 19/14 | 75.06± | 4.84±0.46 | 6.67±2.16 | 1.46±0.62 | – |
| 29 | Li et al. [15] | 2018 | 87 | – | – | 5.21±0.66 | 7.76±1.62 | 1.79±0.48 | – | 40 | – | All > 55 | 4.95±0.48 | 9.25±2.43 | 2.08±0.41 | – |
| 30 | Yu et al. [64] | 2019 | 100 | 69/31 | 72.8±5.7 | 10.34±1.19 | 1.05±0.23 | 1.05±0.23 | – | 100 | 61/39 | 71.5±5.6 | 4.38±2.06 | – | 0.66±0.14 | – |
| 31 | Xu et al. [65] | 2019 | 60 | 29/31 | 72.8±5.7 | 10.34±1.19 | – | 1.05±0.23 | – | 60 | 31/29 | 71.5±5.6 | 4.38±2.06 | – | 0.66±0.14 | – |
| 32 | Li et al. [25] | 2020 | 75 | – | 69.6± | – | – | – | – | 40 | 13/27 | 69.4±5.8 | 5.99±1.22 | 6.17± | 1.59± | – |
| 33 | Huang et al. [66] | 2020 | 32 | 14/18 | 64.22±2.87 | 5.62±0.44 | 7.74±3.76 | 1.93±0.36 | 17.12±4.93 | 30 | 13/17 | 63.16±2.92 | 4.86±0.28 | 9.20±4.25 | 1.98±0.31 | – |
| 34 | Liu et al. [11] | 2007 | 55 | 30/25 | 72.3±5.3 | – | – | – | – | 70 | 36/34 | 71.1±5.8 | 5.26±0.18 | 6.82±2.48 | – | 29.4±0.5 |
| 35 | Liu et al. [11] | 2007 | 31 | – | – | 5.15±0.42 | 7.91±1.95 | – | 22.3±3.2 | 70 | 36/34 | 71.1±5.8 | 5.26±0.18 | 6.82±2.48 | – | 29.4±0.5 |
| 36 | Liu et al. [11] | 2007 | 24 | – | – | 5.18±0.25 | 7.98±2.37 | – | 12.3±5.1 | 70 | 36/34 | 71.1±5.8 | 5.26±0.18 | 6.82±2.48 | – | 29.4±0.5 |
| 37 | Burns et al. [67] | 2007 | 31 | 16/15 | 75.8±6.3 | 101.9±15.9 | 7.8±5.6 | – | 25.2±3.9 | 31 | 19/12 | 76.1±6.1 | 95.0±11.2 | 7.4±5.3 | – | 29.5±0.7 |
| 38 | Isik et al. [68] | 2007 | 70 | 51/19 | – | 5.82±1.73 | – | 2.81±3.06 | 16.4±4.5 | 126 | 75/51 | – | 5.82±1.76 | – | 2.79±3.56 | 26.5±2.4 |
| 39 | Domínguez et al. [69] | 2008 | 29 | 6/23 | 73.3±5.4 | 95.72±14.31 | 8.18±3.78 | – | 21.19±2.10 | 19 | 12/7 | 73.9±8.9 | 96.47±10.34 | 7.59±2.55 | – | 28.76±2.42 |
| 40 | Mu et al. [26] | 2010 | 34 | 10/24 | 81.03±6.22 | 7.79±7.14 | 18.25±33.93 | 2.5± | 8.97±6.93 | 32 | 12/20 | 68.19±7.13 | 8.16±8.06 | 20.75±21.51 | 3.38± | 26.22±3.24 |
| 41 | Khemka et al. [30] | 2014 | 60 | 33/27 | 66.97±6.36 | 82.62±15.34 | 16.66±8.44 | – | 10.27±3.77 | 60 | 34/26 | 64.75±4.40 | 80.32±9.17 | 9.15±2.79 | – | 29.10±0.72 |
| 42 | Yue et al. [12] | 2014 | 81 | 49/32 | 69.1±9.0 | 5.8±0.9 | 17.90±5.60 | 4.64±1.62 | 21.02±2.68 | 76 | 42/34 | 71.3±5.7 | 4.2±2.1 | 11.15±1.60 | 2.01±1.06 | 26.12±2.12 |
| 43 | Yue et al. [12] | 2014 | 72 | 42/30 | 75.1±6.0 | 5.5±1.6 | 27.08±1.60 | 6.64±1.66 | 15.09±3.69 | 76 | 42/34 | 71.3±5.7 | 4.2±2.1 | 11.15±1.60 | 2.01±1.06 | 26.12±2.12 |
| 44 | Yue et al. [12] | 2014 | 34 | 22/12 | 79.1±6.0 | 4.6±1.6 | 34.10±1.61 | 8.55±1.61 | 8.01±3.26 | 76 | 42/34 | 71.3±5.7 | 4.2±2.1 | 11.15±1.60 | 2.01±1.06 | 26.12±2.12 |
| 45 | Willette et al. [70] | 2015 | 60 | 22/38 | 75.25±7.26 | 100.59±20.88 | 2.41±1.46 | 0.60±0.40 | 23.90±1.92 | 26 | 11/15 | 75.69±5.68 | 104.68±30.17 | 2.98±3.10 | 0.87±1.10 | 28.73±1.43 |
| 46 | Chen et al. [16] | 2015 | 95 | 51/44 | 78.41±6.58 | 5.76±1.62 | 97.58±7.42 | 3.21±0.54 | 13.76±4.62 | 80 | 43/37 | 77.32±5.92 | 5.83±1.28 | 63.84±5.89 | 2.73±0.57 | 27.93±2.45 |
| 47 | Xia et al. [13] | 2015 | 60 | 18/42 | 69.8±5.2 | – | 36.49±21.10 | – | 18.1±3.3 | 30 | 9/21 | 69.6±5.0 | 5.10±0.50 | 20.15±20.50 | – | 29.0±3.1 |
| 48 | Xia et al. [13] | 2015 | 34 | 10/24 | 70.2±5.3 | 5.13±0.51 | 30.29±20.00 | – | 21.3±3.2 | 30 | 9/21 | 69.6±5.0 | 5.10±0.50 | 20.15±20.50 | – | 29.0±3.1 |
| 49 | Xia et al. [13] | 2015 | 26 | 8/18 | 69.1±5.1 | 5.20±0.52 | 49.29±21.10 | – | 12.1±3.0 | 30 | 9/21 | 69.6±5.0 | 5.10±0.50 | 20.15±20.50 | – | 29.0±3.1 |
| 50 | Song et al. [71] | 2018 | 94 | 50/44 | 78.36±6.57 | 5.77±1.61 | 97.59±7.44 | 3.22±0.53 | 13.74±4.61 | 94 | 48/46 | 77.39±6.62 | 5.84±1.26 | 63.82±5.86 | 2.72±0.54 | 27.92±2.43 |
| 51 | Li et al. [27] | 2018 | 92 | 52/40 | 73.50±5.74 | 5.68±0.68 | 9.06±1.15 | 2.28±0.41 | 20.59±2.28 | 84 | 46/38 | 72.72±6.7 | 5.61±0.69 | 7.75±1.71 | 1.95±0.57 | 28.98±1.23 |
| 52 | Wu et al. [28] | 2018 | 33 | 20/13 | 71.56±4.32 | 5.04±0.57 | 8.45±6.76 | 1.92±1.39 | 22.12±3.21 | 31 | 19/12 | 70.12±4.26 | 4.88±0.43 | 9.65±5.53 | 2.05±1.27 | 28.32±1.04 |
| 53 | Fu et al. [14] | 2019 | 126 | 69/57 | – | – | 21.47±1.73 | 21.47±1.73 | – | 100 | 54/46 | 66.24±3.19 | – | 10.85±1.45 | 10.85±1.45 | 27.35±2.48 |
| 54 | Fu et al. [14] | 2019 | 59 | 32/27 | 65.98±2.97 | – | 18.84±1.57 | 4.67±0.85 | 20.42±2.34 | 100 | 54/46 | 66.24±3.19 | – | 10.85±1.45 | 10.85±1.45 | 27.35±2.48 |
| 55 | Fu et al. [14] | 2019 | 44 | 24/20 | 67.05±3.81 | – | 28.69±2.01 | 6.15±1.03 | 14.39±2.18 | 100 | 54/46 | 66.24±3.19 | – | 10.85±1.45 | 10.85±1.45 | 27.35±2.48 |
| 56 | Fu et al. [14] | 2019 | 23 | 13/10 | 65.21±3.47 | – | 37.76±2.28 | 9.01±1.27 | 8.25±1.93 | 100 | 54/46 | 66.24±3.19 | – | 10.85±1.45 | 10.85±1.45 | 27.35±2.48 |
| 57 | Sharifipour et al. [31] | 2020 | 34 | – | 71.9±9.4 | 147.4±43.7 | 15.4±13.0 | 5.2±4.2 | 11.6±6.7 | 26 | – | 70.2±7.1 | 102.9±15.5 | 11.3±8.8 | 2.9±2.8 | 29±0.9 |
| 58 | Hejazi et al. [3] | 2020 | 34 | 16/18 | 71.40±11 | 146.50±44.50 | 15.20±13.10 | 5.10±4.30 | 11.60±6.70 | 26 | 18/8 | 70.50±7.20 | 103.00±15.50 | 11.30±8.80 | 2.90±2.85 | 29.04±1.00 |
Index detection
Blood samples were obtained in the morning after at least 8-h overnight fasting. Fasting plasma glucose was measured by standard enzymatic methods and fasting plasma insulin was measured by radioimmunoassay. Among them, Xia et al. [13], Li et al. [15], and Chen et al. [16] applied hexokinase method to measure fasting plasma glucose level. Pan et al. [4], Fu et al. [14], Li et al. [15], Chen [17], Li [18], Wang et al. [19, 20], Li et al. [21], Li et al. [22], Zhang et al. [23], Liu et al. [24], Li et al. [25], Mu et al. [26], Li et al. [27], and Wu et al. [28] utilized ChemiLuminescence to detect fasting plasma insulin level. Liu et al. [11], Monacelli et al. [29], Khemka et al. [30], and Sharifipour et al. [31] adopted enzyme-linked immunosorbent assay (ELISA) assessment to detect fasting plasma insulin level. Hejazi et al. [3] and Sharifipour et al. [31] utilized ELISA assessment to determine fasting plasma glucose level and fasting plasma insulin level respectively. Chen et al. [16] adopted metrology to detect fasting plasma insulin level.
The MMSE [32] includes 30 items, including time orientation, place orientation, immediate memory, attention and computational power, delayed memory, language, and visual space. The correct answer is 1 point, the error is 0 point, and the maximum total score is 30 points. The higher the MMSE score, the better the mental state of the subjects. Mild cognitive impairment (MCI) is generally considered as the transitional stage between normal cognition and dementia. MCI is a stage of cognitive dysfunction, and the MMSE score is between 23 and 27 [33]. In another study [1], AD subtypes were divided into groups according to MMSE scores. MMSE scores of 16∼27 were included in the mild group, and MMSE scores of <16 were included in the moderate and severe group.
Risk of bias assessment
After our evaluation, in the selection of research objects, the definition and diagnosis of cases in all articles were appropriate, the cases were well-representative, the definition of control was clear, and no disease history required studying. However, in the control selection, 4 articles adopted hospital control and 43 articles adopted community control or the source of control was not described in the article. As for comparability, all articles were selected and analyzed according to the most important factors, and 34 articles were adjusted for important confounding factors (such as age, body mass index, and gender). In addition, in terms of exposure, all articles exhibited reliable records in the investigation and evaluation methods of exposure, and the investigation methods of case and control were the same. Among these, the response rate of the case group was different from that of the control group in 1 article. Table 3 depicts the summary of deviation risk, wherein 35 articles scored as high as 8–9 points, 8 articles scored 7 points, and 4 articles scored 6 points.
Table 3
Results of quality assessment using Newcastle-Ottawa Scale for case-control studies
| Study | Selection | Comparability | Exposure | Scores | |||||
| Adequate definition of case | Representativeness of the cases | Selection of controls | Definition of controls | Control for important factor | Ascertainment of exposure | Same method of ascertainment for cases and controls | None-Response rate | ||
| Bucht et al. [52] | ☆ | ☆ | – | ☆ | ☆☆ | ☆ | ☆ | ☆ | 8 |
| Kilander et al. [9] | ☆ | ☆ | ☆ | ☆ | ☆☆ | ☆ | ☆ | ☆ | 9 |
| Craft et al. [53] | ☆ | ☆ | – | ☆ | ☆☆ | ☆ | ☆ | ☆ | 8 |
| Craft et al. [54] | ☆ | ☆ | – | ☆ | ☆☆ | ☆ | ☆ | ☆ | 8 |
| Carantoni et al. [45] | ☆ | ☆ | – | ☆ | ☆ | ☆ | ☆ | – | 6 |
| Yue et al. [55] | ☆ | ☆ | – | ☆ | ☆ | ☆ | ☆ | ☆ | 7 |
| Sun et al. [56] | ☆ | ☆ | – | ☆ | ☆ | ☆ | ☆ | ☆ | 7 |
| García-Lara et al. [57] | ☆ | ☆ | – | ☆ | ☆☆ | ☆ | ☆ | ☆ | 8 |
| Ramdane et al. [58] | ☆ | ☆ | ☆ | ☆ | ☆☆ | ☆ | ☆ | ☆ | 9 |
| Chen et al. [17] | ☆ | ☆ | – | ☆ | ☆☆ | ☆ | ☆ | ☆ | 8 |
| Li [18] | ☆ | ☆ | – | ☆ | ☆ | ☆ | ☆ | ☆ | 7 |
| Li et al. [6] | ☆ | ☆ | – | ☆ | ☆ | ☆ | ☆ | ☆ | 7 |
| Huang et al. [59] | ☆ | ☆ | – | ☆ | ☆☆ | ☆ | ☆ | ☆ | 8 |
| Morris et al. [60] | ☆ | ☆ | – | ☆ | ☆☆ | ☆ | ☆ | ☆ | 8 |
| Wang et al. [19] | ☆ | ☆ | – | ☆ | ☆☆ | ☆ | ☆ | ☆ | 8 |
| Wang et al. [20] | ☆ | ☆ | – | ☆ | ☆☆ | ☆ | ☆ | ☆ | 8 |
| Monacelli et al. [29] | ☆ | ☆ | – | ☆ | ☆ | ☆ | ☆ | ☆ | 7 |
| Li et al. [21] | ☆ | ☆ | – | ☆ | ☆☆ | ☆ | ☆ | ☆ | 8 |
| Li et al. [22] | ☆ | ☆ | – | ☆ | ☆☆ | ☆ | ☆ | ☆ | 8 |
| Zhang et al. [10] | ☆ | ☆ | – | ☆ | ☆☆ | ☆ | ☆ | ☆ | 8 |
| Morris et al. [61] | ☆ | ☆ | – | ☆ | ☆☆ | ☆ | ☆ | ☆ | 8 |
| Pan et al. [4] | ☆ | ☆ | – | ☆ | ☆☆ | ☆ | ☆ | ☆ | 8 |
| Zhang et al. [23] | ☆ | ☆ | – | ☆ | ☆☆ | ☆ | ☆ | ☆ | 8 |
| Macesic et al. [62] | ☆ | ☆ | – | ☆ | ☆ | ☆ | ☆ | ☆ | 7 |
| Liu et al. [24] | ☆ | ☆ | – | ☆ | ☆ | ☆ | ☆ | ☆ | 7 |
| Mu et al. [63] | ☆ | ☆ | – | ☆ | – | ☆ | ☆ | ☆ | 6 |
| Li et al. [15] | ☆ | ☆ | – | ☆ | ☆☆ | ☆ | ☆ | ☆ | 8 |
| Yu et al. [64] | ☆ | ☆ | ☆ | ☆ | ☆ | ☆ | ☆ | ☆ | 8 |
| Xu et al. [65] | ☆ | ☆ | – | ☆ | – | ☆ | ☆ | ☆ | 6 |
| Li et al. [25] | ☆ | ☆ | – | ☆ | ☆☆ | ☆ | ☆ | ☆ | 8 |
| Huang et al. [66] | ☆ | ☆ | – | ☆ | ☆☆ | ☆ | ☆ | ☆ | 8 |
| Liu et al. [11] | ☆ | ☆ | – | ☆ | ☆☆ | ☆ | ☆ | ☆ | 8 |
| Burns et al. [67] | ☆ | ☆ | – | ☆ | ☆☆ | ☆ | ☆ | ☆ | 8 |
| Isik et al. [68] | ☆ | ☆ | – | ☆ | ☆ | ☆ | ☆ | ☆ | 7 |
| Domínguez et al. [69] | ☆ | ☆ | – | ☆ | ☆☆ | ☆ | ☆ | ☆ | 8 |
| Mu et al. [26] | ☆ | ☆ | – | ☆ | – | ☆ | ☆ | ☆ | 6 |
| Khemka et al. [30] | ☆ | ☆ | ☆ | ☆ | ☆☆ | ☆ | ☆ | ☆ | 9 |
| Yue et al. [12] | ☆ | ☆ | – | ☆ | ☆☆ | ☆ | ☆ | ☆ | 8 |
| Willette et al. [70] | ☆ | ☆ | – | ☆ | ☆☆ | ☆ | ☆ | ☆ | 8 |
| Chen et al. [16] | ☆ | ☆ | – | ☆ | ☆☆ | ☆ | ☆ | ☆ | 8 |
| Xia et al. [13] | ☆ | ☆ | – | ☆ | ☆☆ | ☆ | ☆ | ☆ | 8 |
| Song et al. [71] | ☆ | ☆ | – | ☆ | ☆☆ | ☆ | ☆ | ☆ | 8 |
| Li et al. [27] | ☆ | ☆ | – | ☆ | ☆☆ | ☆ | ☆ | ☆ | 8 |
| Wu et al. [28] | ☆ | ☆ | – | ☆ | ☆☆ | ☆ | ☆ | ☆ | 8 |
| Fu et al. [14] | ☆ | ☆ | – | ☆ | ☆☆ | ☆ | ☆ | ☆ | 8 |
| Sharifipour et al. [31] | ☆ | ☆ | – | ☆ | ☆☆ | ☆ | ☆ | ☆ | 8 |
| Hejazi et al. [3] | ☆ | ☆ | – | ☆ | ☆☆ | ☆ | ☆ | ☆ | 8 |
Table 4
The correlation variables and significance in patients with Alzheimer’s disease
| Age | Gender | MMSE | ||
| FBG | Correlation Coefficient | –0.217 | –3.707 | 0.020 (0.007) |
| p | 0.466 | 0.731 | 0.479 (0.745) | |
| FINS | Correlation Coefficient | –0.055 | –4.869 | –0.090 (–0.093) |
| p | 0.835 | 0.659 | 0.157 (0.113) | |
| HOMA-IR | Correlation Coefficient | –0.315 | 34.623 | –1.986 (–1.064) |
| p | 0.109 | 0.013* | 0.001* (0.037*) |
Age means the physiological age of the subject at the time of data collection in the study. Gender means the ratio of the number of males to the number of females in the subject. MMSE means the Mini-Mental State Examination scale score of the subject. The correlation coefficient and p-value between metabolic parameters and MMSE when age and gender variables are not controlled are in parentheses.
Outcomes
Age
Among the 47 selected articles, 43 introduced the correlation between age and the risk of AD. Among these, the age data of AD patients such as Caixia et al., Zhihua et al., and Hongmei et al. were incomplete, and the age data of Central Asian ethnic typing in the article were used. Finally, there were 49 case-control studies. The analysis revealed significant differences in age between the two groups (p < 0.001, 95% CIs (0.03, 0.22)), which, however, may be attributed to the lack of sufficient data for assessment.
Gender
There were 43 articles involving 47 case-control trials. There was no striking difference in gender between the two groups (p > 0.05, OR = 1.02).
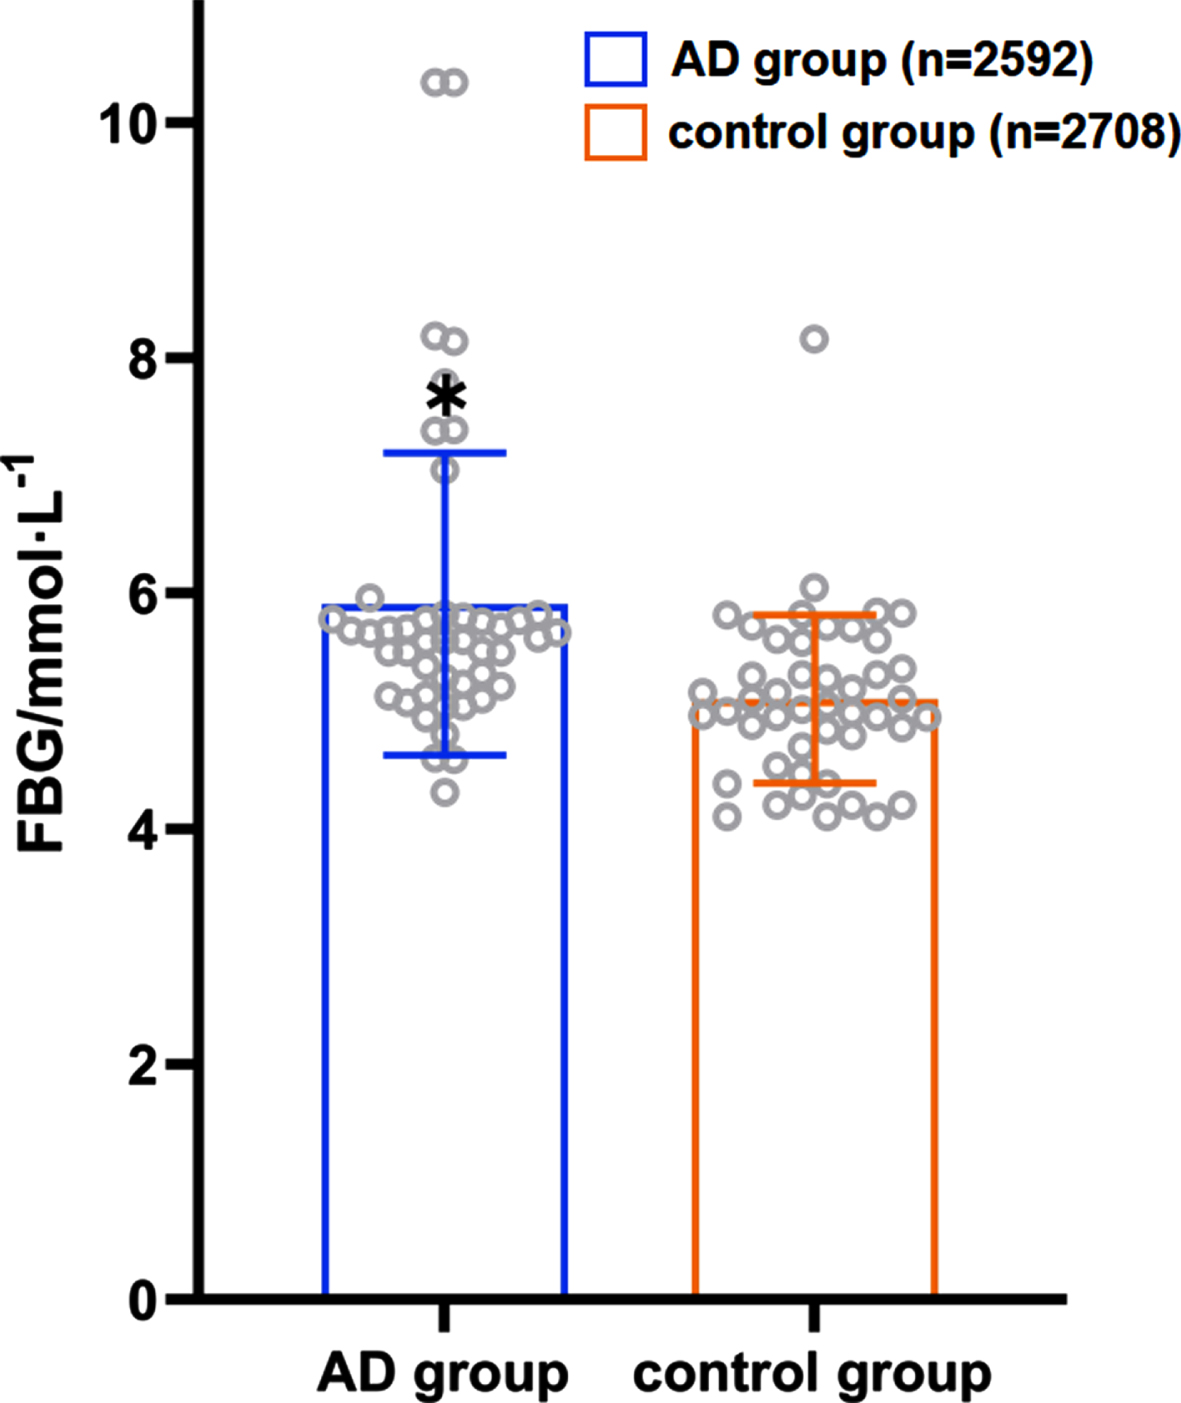
FBG
A total of 43 articles introduced the correlation between FBG and morbidity risk in patients with AD, which involved 47 case-control trials. The difference in FBG between the AD (n = 2,592) and control (n = 2,708) groups was found to be statistically significant (p < 0.001, 95% CIs (0.65, 1.23)), while the average FBG level in the patient group was higher than that in the control group as Fig. 2 showed (5.78 mmol/L versus 5.10 mmol/L).
Fig. 2
Distribution of the average FBG in the AD patient group and the control group
A total of 22 case-control trials involved both the FBG and MMSE scores. After controlling the role of age and gender, multiple logistic regression analysis revealed a positive correlation between the FBG level and MMSE score in AD patients (the correlation coefficient was 0.020), albeit there was no statistical significance (t = 0.73, p > 0.05).
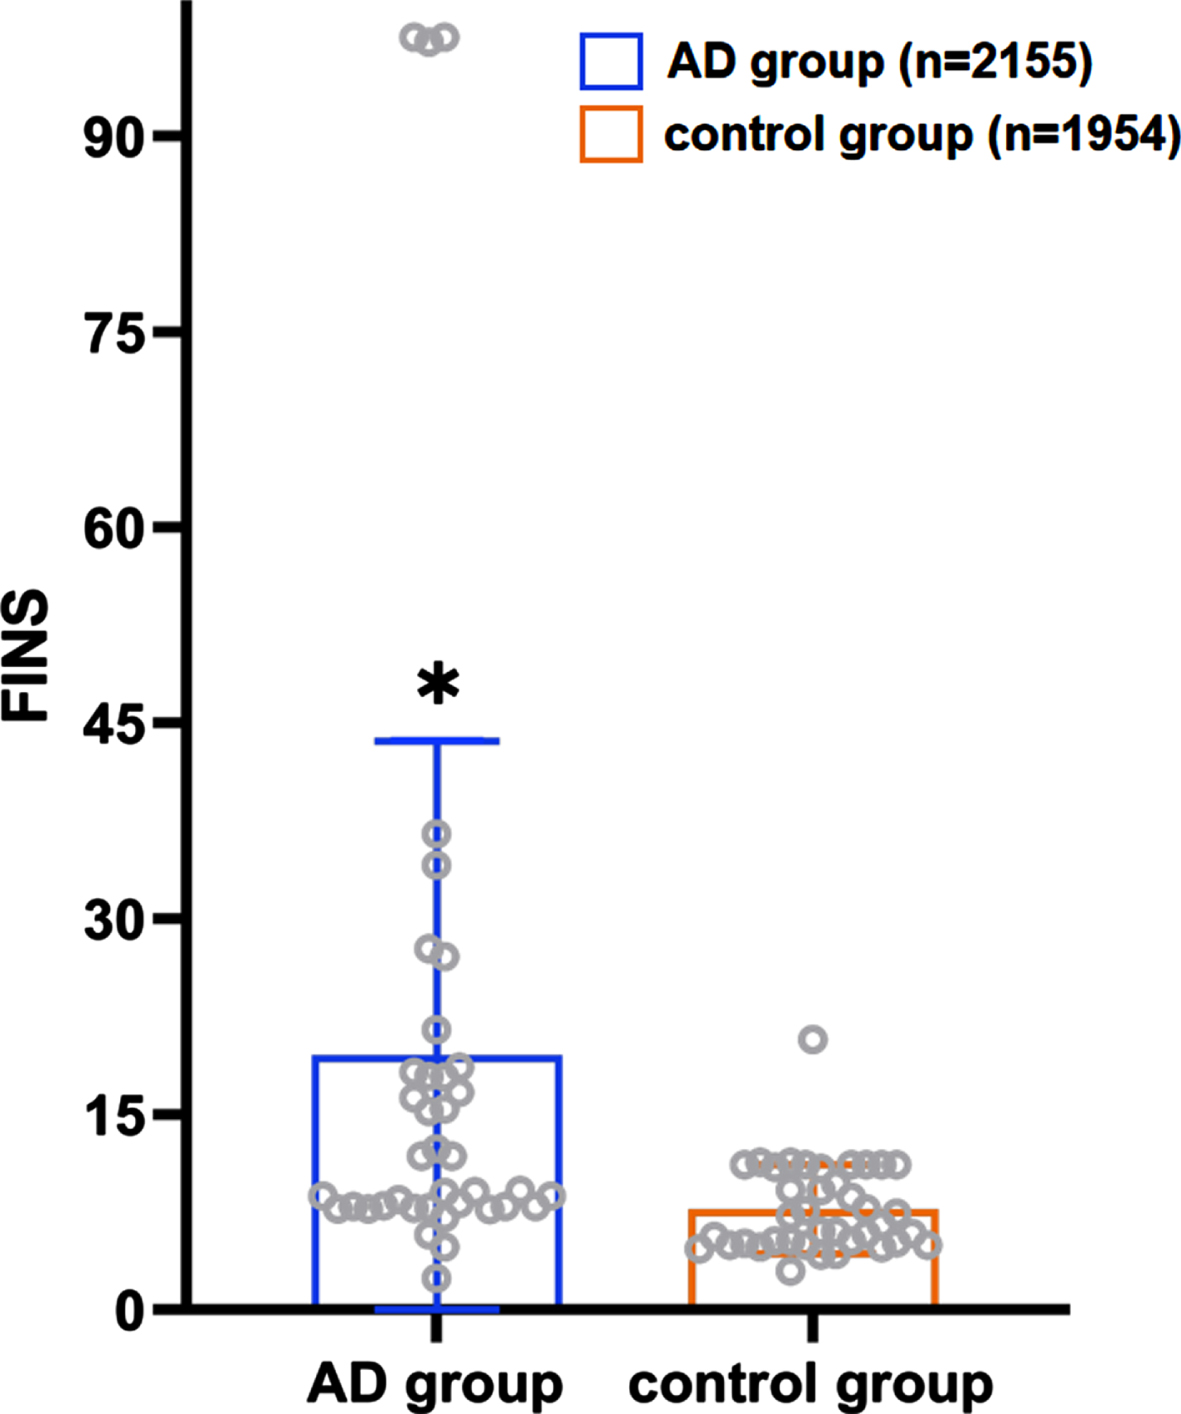
FINS
A total of 39 case-control trials involved the correlation between FINS level and the risk of AD. An apparent difference was noted in the FINS level between the patient (n = 2,155) and control (n = 1,954) groups, with a statistical significance (p < 0.001, 95% CIs (2.13, 3.40)); the average level of FINS in the patient group was higher than that in the control group as Fig. 3 showed (19.57 versus 7.73).
Fig. 3
Distribution of the average FINS level in the AD patient group and the control group. *When collecting FINS data, we found that each study had different methods of detecting FINS and different units. Although the units among the studies are not unified here, the units between the control group and the AD group in each study are the same. Therefore, we only show the significance of the data differences between FINS in the studies.
A total of 20 case-control trials involving FINS and the MMSE scores were noted. After controlling for gender and age, multiple logistic regression analyses revealed that the level of FINS in the AD patients was negatively correlated with the MMSE score (the correlation coefficient was –0.090), albeit there was no statistically significant difference (t = –1.49, p > 0.05).
HOMA-IR
There were 36 case-control trials involving the HOMA-IR level and the risk of AD. The analysis revealed a statistically significant difference in the HOMA-IR between the patient (n = 2,196) and control (n = 2,038) groups (p < 0.001, 95% CIs (0.70, 1.57)), and the average HOMA-IR level in the patient group was higher than that in the control group as Fig. 4 presented (3.71 versus 2.15). As shown in Fig. 5, HOMA-IR in AD group presented a lognormal distribution (p > 0.05) while HOMA-IR in the control group did not conform (Fig. 6). The 95% bilateral boundary values of HOMA-IR in AD group were 0.73 and 10.67 as per the Shapiro–Wilk test and the Q-Q diagram.
Fig. 4
Distribution of the average HOMA-IR in the AD patient group and the control group.
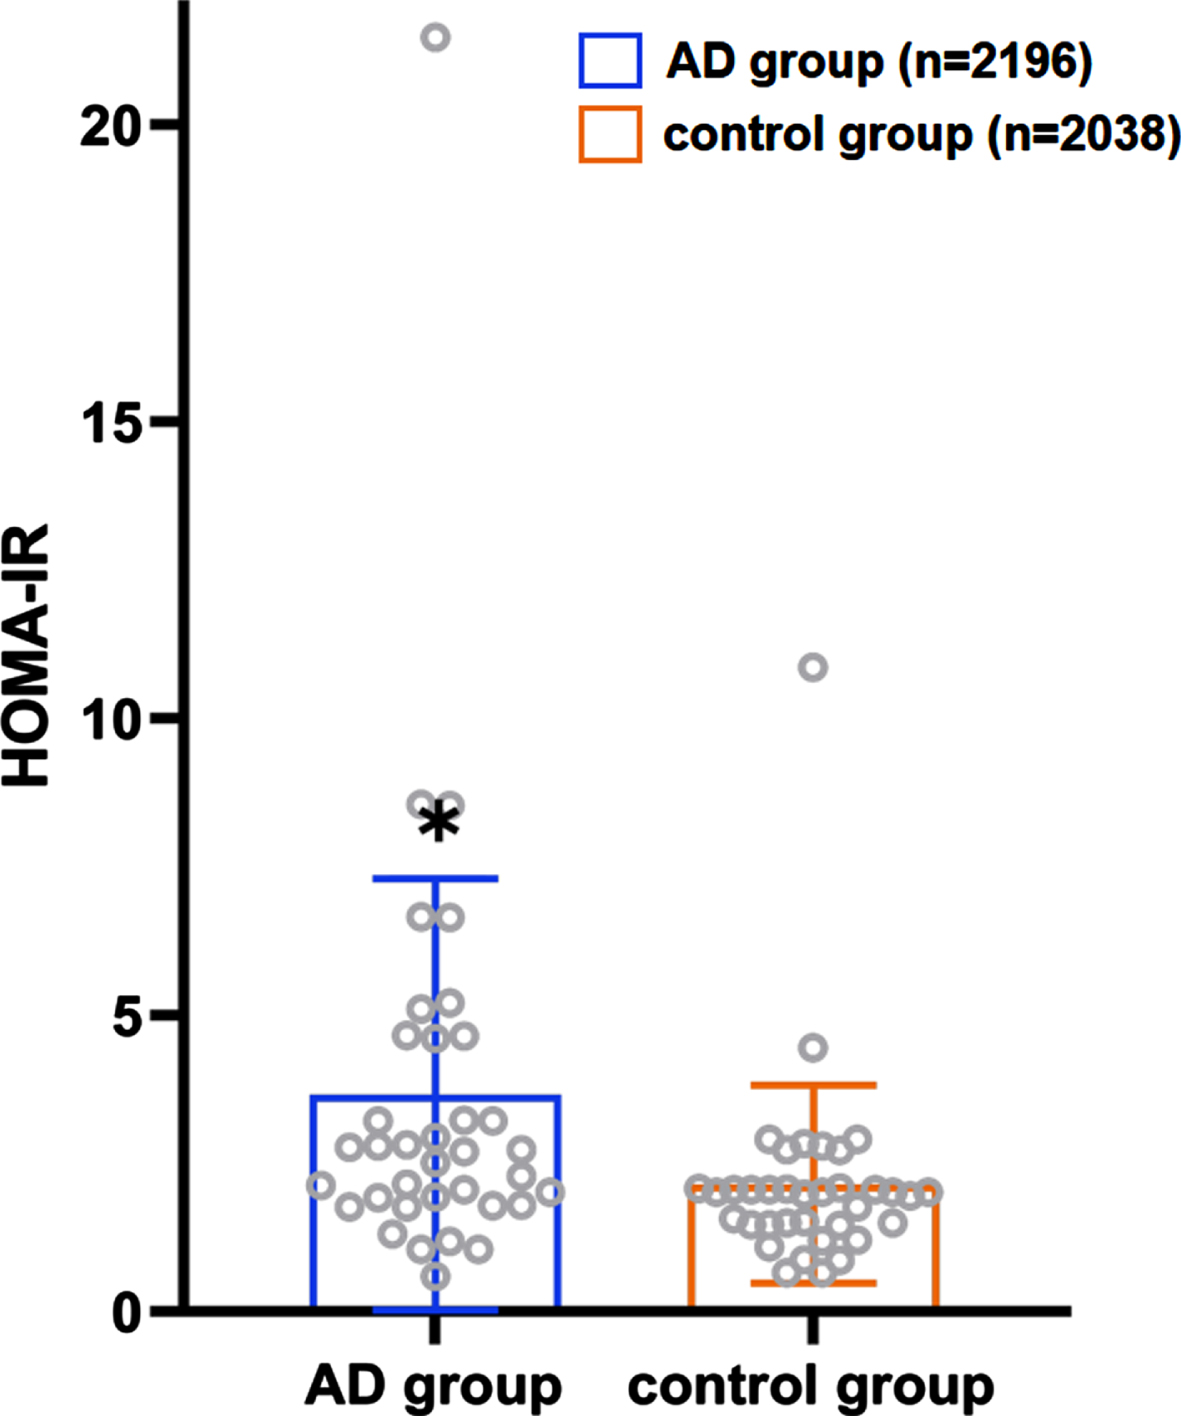
Fig. 5
HOMA-IR in AD group presents the lognormal distribution (n = 2,196).
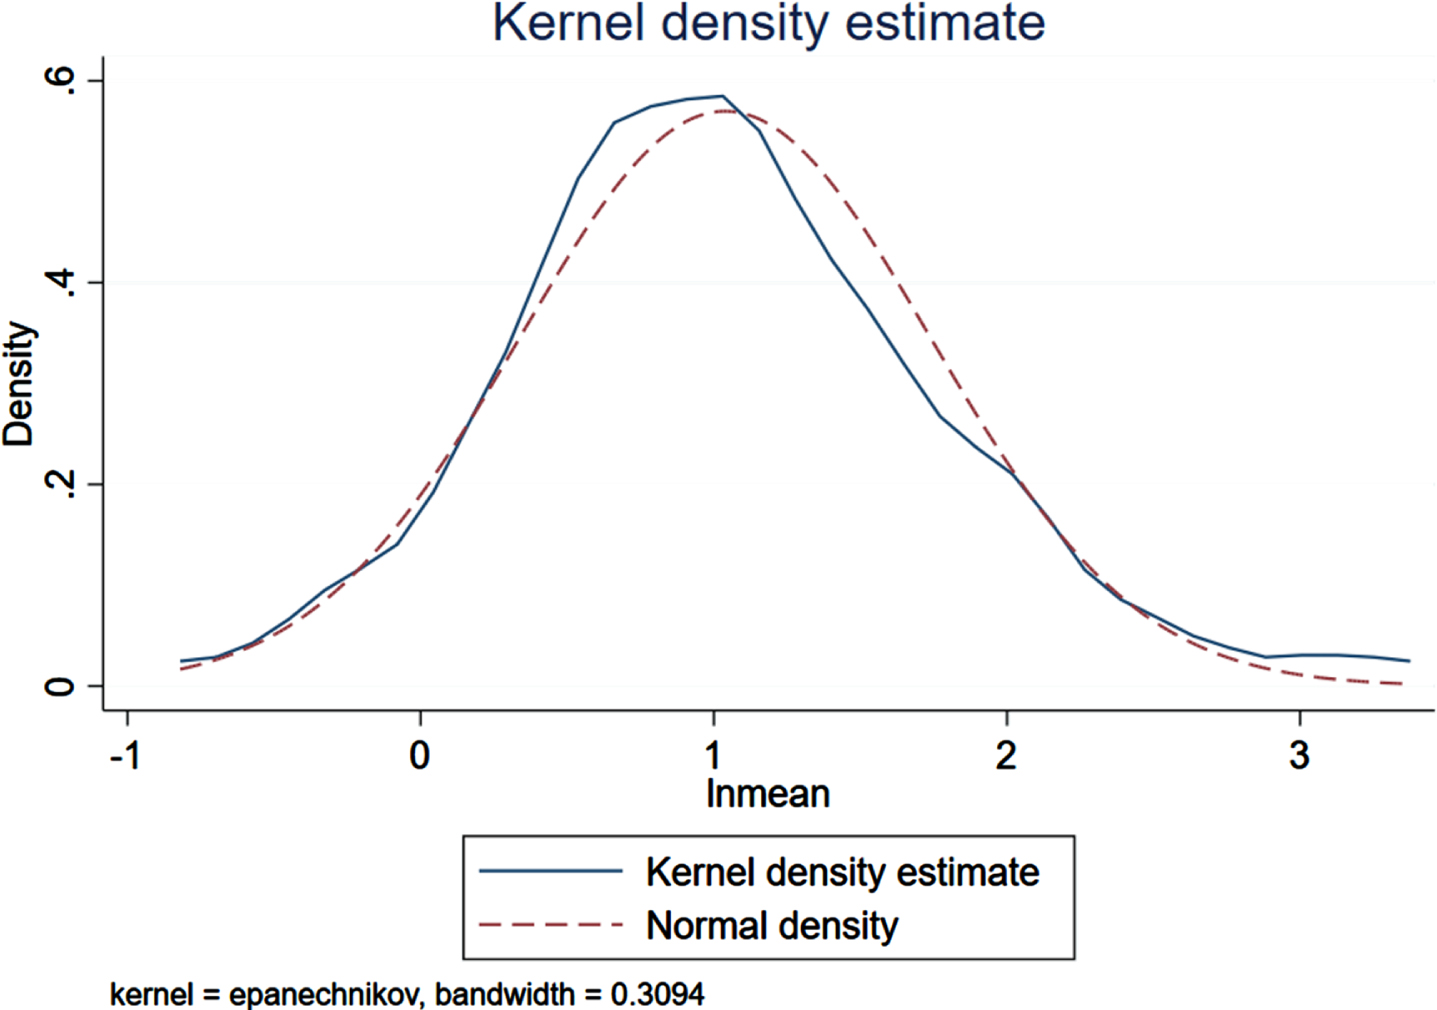
Fig. 6
HOMA-IR in control group does not present the lognormal distribution (n = 2,038).
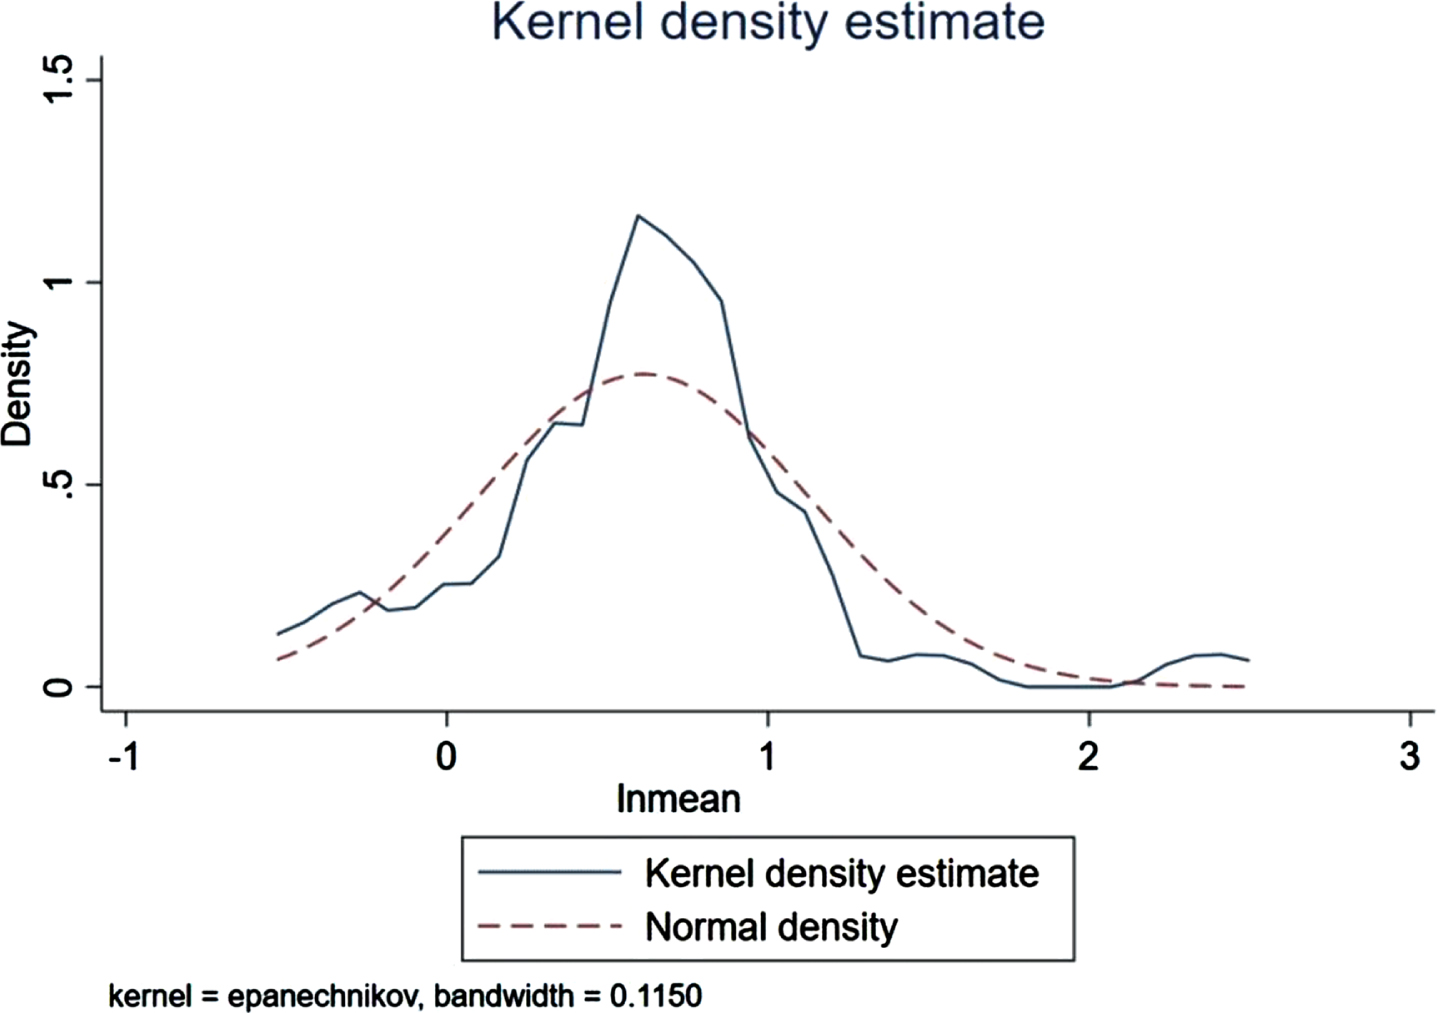
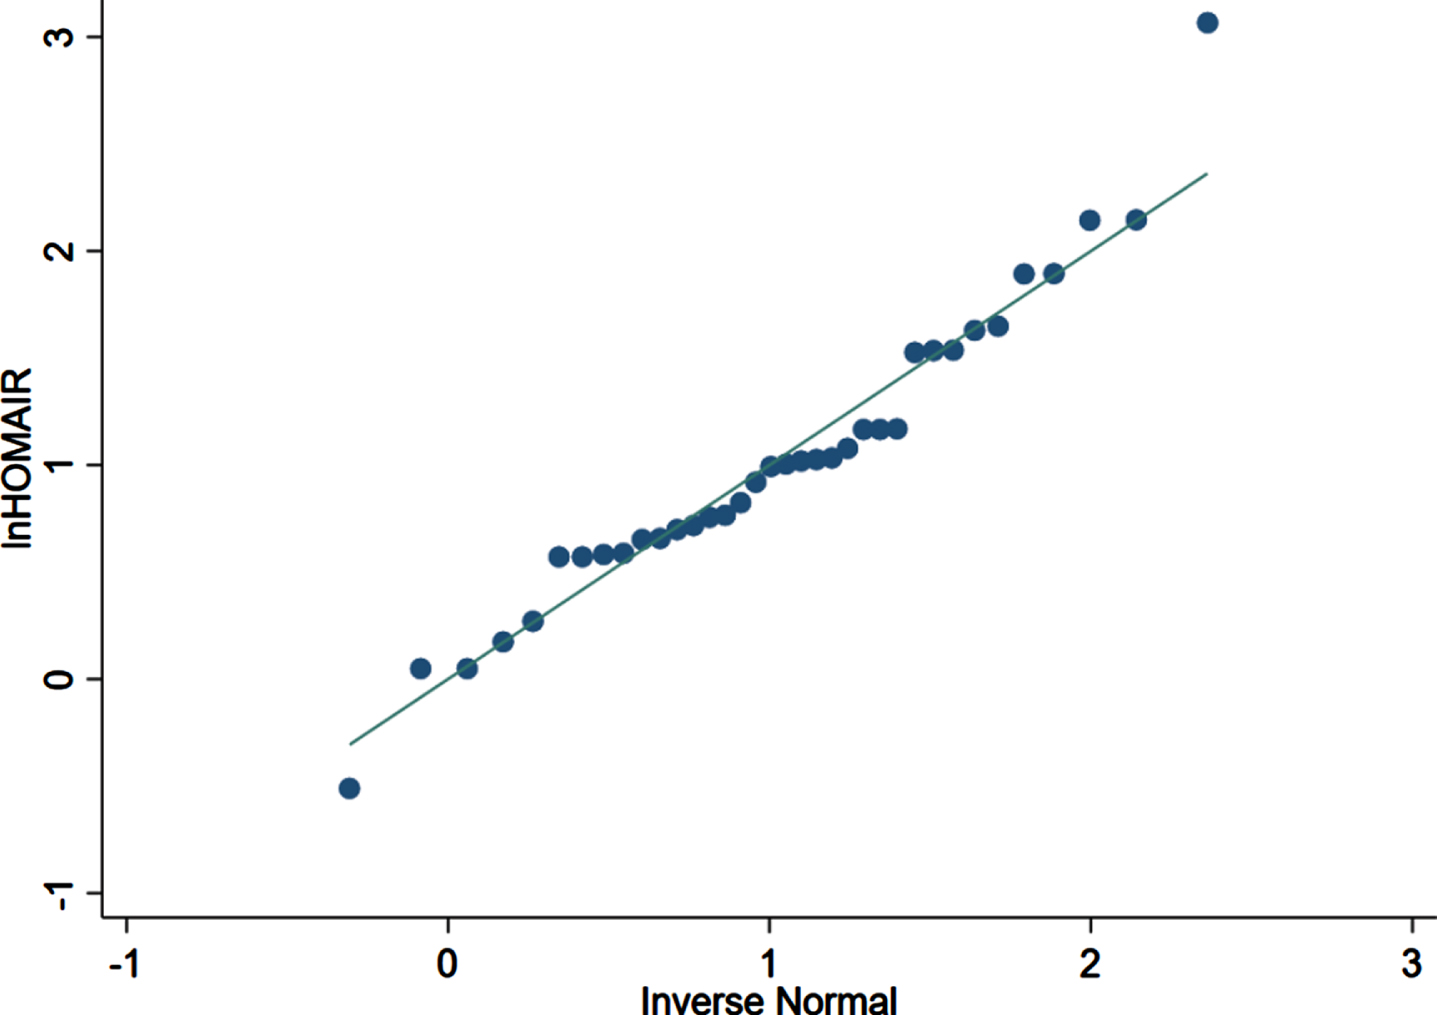
Fig. 7
lnHOMA-IR Q-Q graphing (n = 36). Each scatter point in the figure is the logarithm of HOMA-IR of each patient included in the analysis. The results show that the data distribution of lnHOMA-IR is mostly along a straight line, which conforms to the normal distribution.
A total of 17 case-control trials involving HOMA-IR and the MMSE scores were detected. Multiple logistic regression analysis revealed that the HOMA-IR level in AD patients was significantly inversely related to the MMSE score (t = –4.27, p = 0.001), considering age and gender (the correlation coefficient was –1.986). In addition, the sex ratio (male versus female) of AD patients was positively correlated with the HOMA-IR level (t = 4.34, p = 0.013) (the correlation coefficient was 34.623).
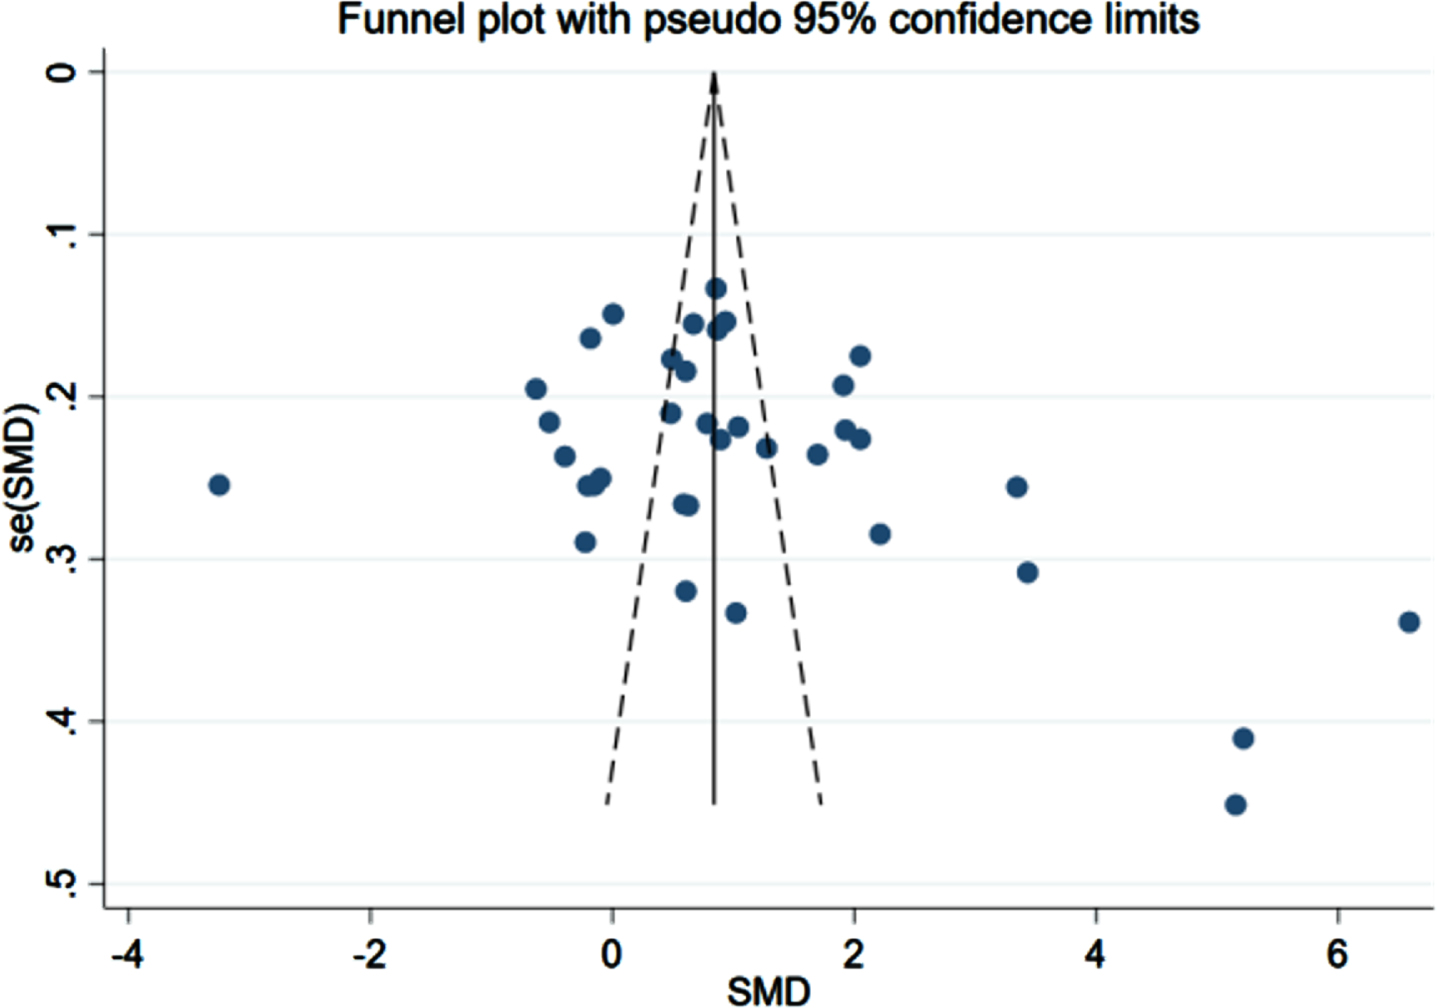
Publication bias
The comparison-adjusted funnel plots for recurrent stroke were plotted in order to test for publication bias. As listed in Figs. 8–10, we found that most of the scatters of the research parameters FBG, FINS, and HOMA-IR were basically symmetrical on both sides of the centerline. Some scatters were separately distributed on the right. The results indicated a publication bias, suggesting a possible small-sample effect.
Fig. 8
Funnel plot for FBG (n = 43).
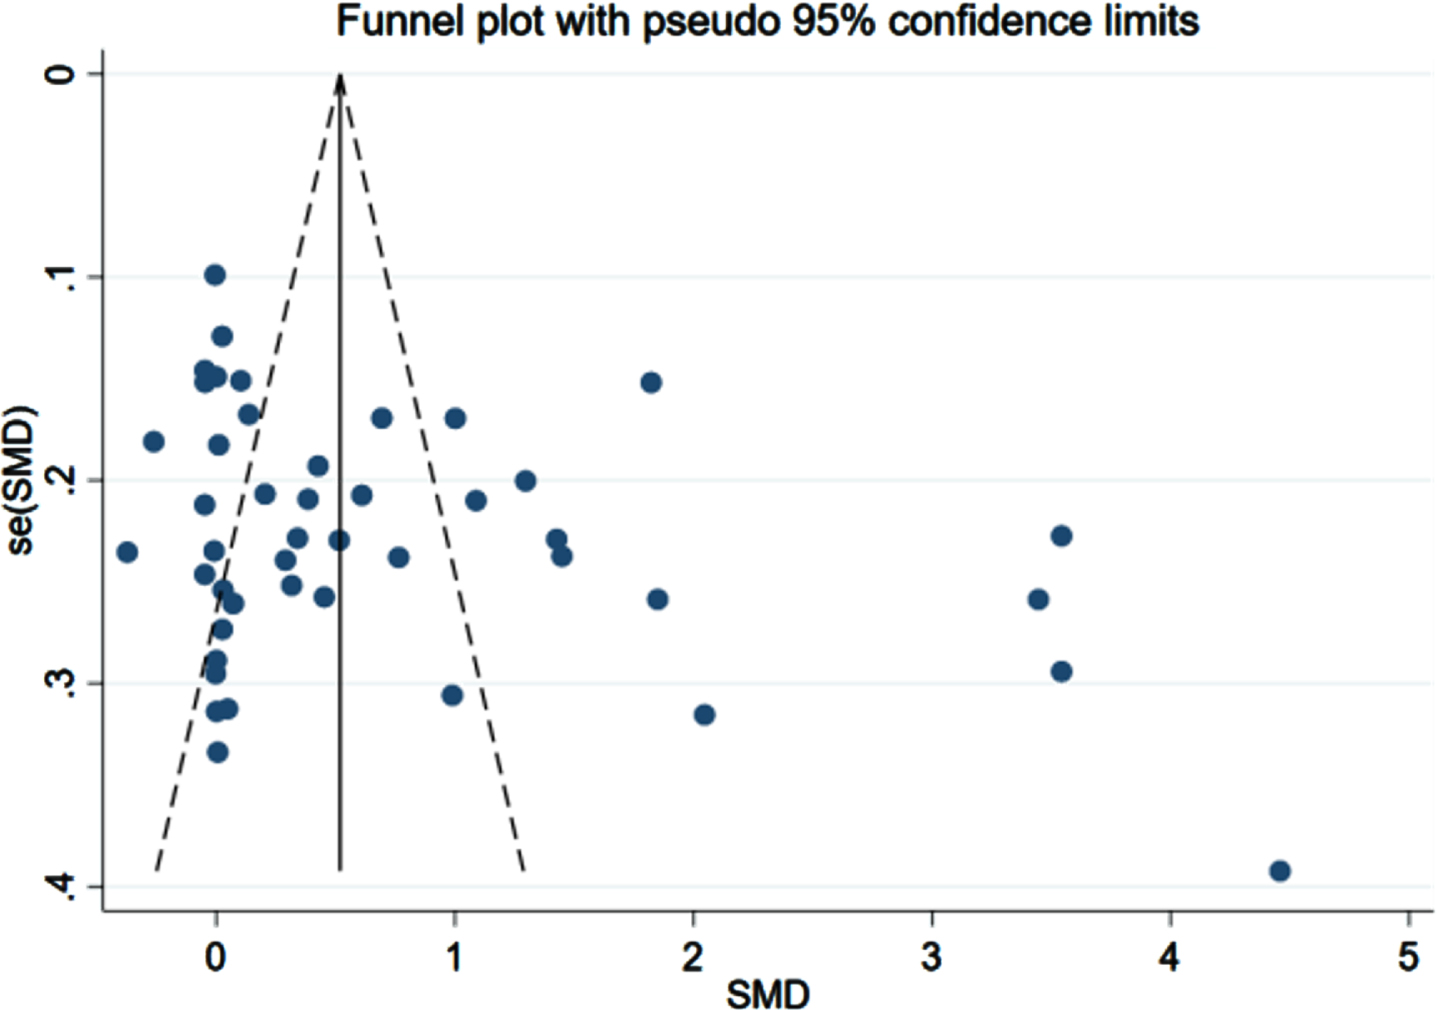
Fig. 9
Funnel plot for FINS (n = 39).
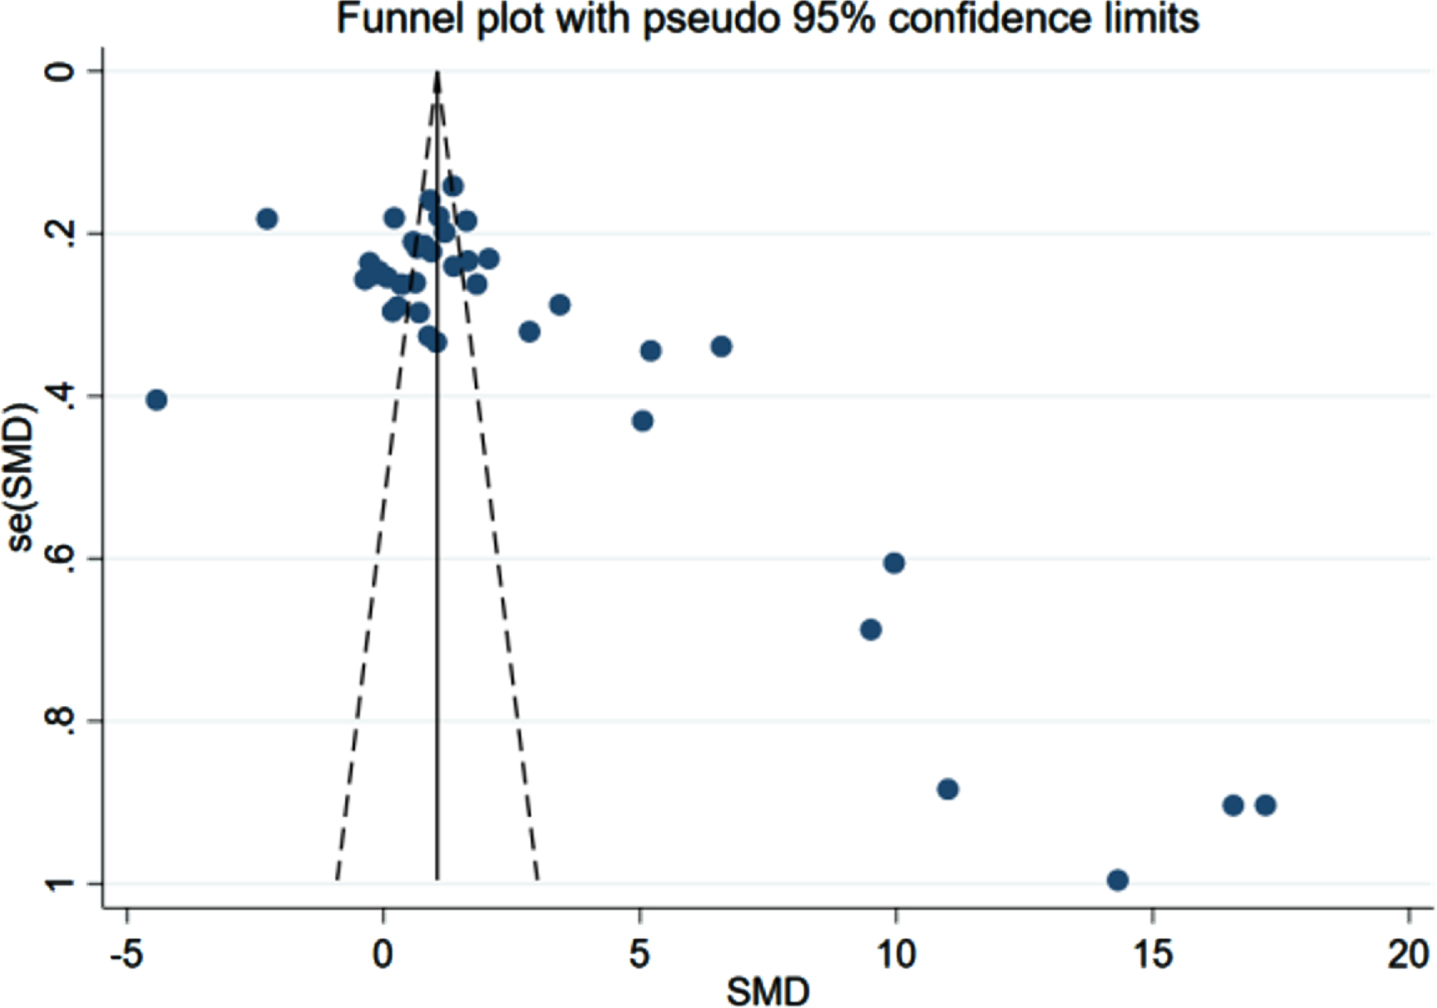
Fig. 10
Funnel plot for HOMA-IR (n = 36).
Sensitivity analysis
If the number of studies was at least 5, the statistical heterogeneity was tested by calculating I2 in the standard pairwise meta-analysis. I2 ≥50% indicated a high heterogeneity. In addition, we adopted the elimination method to assess the independent impact of each research on the results. After evaluation, the outcomes suggested no need to exclude any studies, which could have added a slight deviation to the results of each study.
DISCUSSION
Presently, the occurrence and severity of AD can mostly be identified accurately by post-mortem analysis of Aβ protein [31]. Based on the case-control research data of researchers on the correlation between the level of glucose metabolism index and the occurrence of AD in recent years, we systematically sorted and analyzed the relevant existing literature and summarized the correlation among FBG, FINS, and HOMA-IR, which reflect the function of glucose metabolism and the risk and severity of AD.
This paper statistically analyzed the data from the various research literature. We found that the levels of FBG, FINS, and HOMA-IR in the AD group were higher than those in the control groups and that the average HOMA-IR of AD patients was 3.71 (>2.69). This observation indicates that AD patients have impaired glucose metabolism regulation and insulin resistance. The association between diabetes and AD is extremely complex, with the involvement of some common cellular and molecular mechanisms. A study found that higher than average blood glucose levels may increase the risk of dementia in non-diabetic patients [34]. A high blood glucose level can be a result of impaired glucose metabolism, reduced sensitivity of the insulin receptor, and the development of insulin resistance. In the brain, insulin receptors are mainly distributed in the hippocampus and a portion of the cerebral cortex that bears the functions of learning and memory [35]. Therefore, when blood glucose level increases and the insulin receptor sensitivity decreases, learning and memory processing ability gets affected, cognitive function declines, the risk of AD and the acceleration of AD progression increases. In addition, a study reported that insulin receptors in AD patients get reduced or locally dysregulated and insulin receptor which is located out of the membrane surface or in the brain has a decreased affinity towards insulin [36]. Impaired glucose metabolism causes insulin resistance, which in turn leads to mitochondrial dysfunction of the nerve cells and inflammatory response [37, 38], microtubule-associated protein tau (tau) and Aβ elevated levels [39], ultimately causing AD. Insulin resistance may also be related to the damage of the neuronal structure and the establishment of synaptic plasticity [37], which leads to memory impairment and abnormal behavioral outcomes. One study reported that, in asymptomatic APOE ɛ4 carriers, insulin resistance is connected with the hyperphosphorylation of tau leading to its release from the microtubules and aggregation inside the cell [40]. Insulin reduces the phosphorylation level of tau protein in the neurons by inhibiting the activity of glycogen synthase kinase-3 [41]. The decrease in the plasma insulin level, enhancement of the glycogen synthase kinase-3 activity, and the hyperphosphorylation of tau protein leads to neuronal fiber tangle, which is one of the basic pathological characteristics of AD [42]. Meanwhile, elevated blood glucose levels can increase the activity of glycogen synthase kinase-3β, promote tau protein phosphorylation, and induce nerve cell damage [43]. Hyperglycemia caused by reduced insulin secretion or impaired insulin receptor of the islet cells can also lead to the accumulation of advanced glycation endproducts, which in turn promotes the aggregation of amyloid oligomers and have direct toxic effects on nerve cells; as a result, the nerve cells wither or get damaged [44].
Past studies have demonstrated that the expression of insulin-like growth factor receptors (IGF-I and IGF-II receptors) decreases gradually with the progress of the Braak phase and that the insulin function deteriorates with the progression of AD [45]. This finding is consistent with our conclusion of a significant negative correlation between the HOMA-IR level and MMSE score. The efficiency of insulin in promoting glucose uptake and utilization decreases with the severity of AD. The latest research suggests that the comparative phosphorylation proteomics of nerve-2a cells under insulin resistance may be a new molecular feature of AD [46], providing a possible link between insulin resistance and AD. In a study on the transformation between early amnestic MCI and AD, it can be considered that insulin resistance and glucose oxidation serve as early biomarker clusters [47]. Recent studies on rats conclude that peripheral insulin resistance may be a potential biomarker of pre-symptoms of AD [48].
As early as 2007, some studies identified that acupuncture and moxibustion with traditional Chinese medicine can have beneficial effects on the brain by increasing the brain glucose metabolism in patients with vascular dementia [49]. This finding suggests that traditional Chinese medicine can improve the brain glucose metabolism of AD patients and achieve the curative effect of treating cognitive impairment.
In order to analyze the correlation between HOMA-IR level and MMSE scores, two variables, age and sex ratio, were controlled. But we found that when HOMA-IR was the dependent variable, MMSS scores was the independent variable, and age and sex ratio were the control variables, the sex ratio (male versus female) was proportional to HOMA-IR, and MMSE scores were inversely proportional to HOMA-IR. The result might reveal the gender difference of insulin resistance on the incidence of AD, which was more common in men, indicating that the combined effect of estrogen deficiency and insulin resistance may aggravate the disease of AD. It is believed that moderate or severe reduction of serum estrogen level will increase the prevalence of insulin resistance in men and women [50]. A review evaluated the protective effect of estrogen on insulin resistance related pathways in cardiac metabolism [51]. Their interaction in the occurrence and development of human AD may provide new strategies for primary prevention and treatment of AD. However, this requires more targeted research to illustrate this conclusion.
Innovations and limitations of the research
This is the first systematic evaluation of the correlation between various biochemical parameters (FBG, FINS, HOMA-IR) and the risk and severity of AD. In addition, this is a pioneering study in its field. According to the lognormal distribution characteristics of HOMA-IR, 95% bilateral boundary values were obtained, providing a high-quality basis for clinical diagnosis. As the included case-control trials were sourced from across the world, the regional applicability of the conclusion was reduced. Strict inclusion and exclusion criteria were formulated to conduct a comprehensive search of the article.
Nevertheless, the risk of bias in most accepted articles is unclear, contributing to some extent of analysis error. The number of participants in all case-control trials was less, creating a lack of evidence. Hence, further case-control trials are warranted to determine the universal applicability of the conclusions in the future. In addition, owing to the diversity of diet and regional environment of the internal and external patients, clinical heterogeneity may have occurred. Despite these shortcomings, this is the first study to systematically explore the risk and severity of AD from blood glucose-related indicators and to provide some valuable evidence supporting clinical practice.
Conclusions
In summary, our systematic analysis revealed that an increase in the FBG, FINS, and HOMA-IR levels act as a good indication of the risk of AD, especially an increase in HOMA-IR signifies an increasing severity of AD. In addition, HOMA-IR exhibited a lognormal distribution, and the 95% bilateral boundary values were 0.73 and 10.67. However, owing to some limitations in the present study, double-blinded multicenter case-control controlled trials of higher quality and larger sample sizes are warranted to verify our conclusions in the future.
ACKNOWLEDGMENTS
This work was jointly supported by grants from Zhejiang Provincial Natural Science Foundation of China (No. LY21H270012).
Authors’ disclosures available online (https://www.j-alz.com/manuscript-disclosures/22-0751r2).
REFERENCES
[1] | Oboudiyat C , Glazer H , Seifan A , Greer C , Isaacson RS ((2013) ) Alzheimer’s disease. Semin Neurol 33: , 313–329. |
[2] | de la Monte SM ((2014) ) Type 3 diabetes is sporadic Alzheimer’s disease: Mini-review. Eur Neuropsychopharmacol 24: , 1954–1960. |
[3] | Hejazi SA , Rohampour K , Sharifipour E , Sharifimoghadam S , Paybast S , Ghoreishi A , Hassanzadeh N , Vahedian M ((2020) ) The correlation of serum adiponectin and insulin resistance with the presence and severity of dementia in non-obese Alzheimer’s patients. Clin Nutr ESPEN 40: , 376–382. |
[4] | Hongshan P , Cuiying M , Wanmin C ((2016) ) Relationship between metabolic disorder of blood glucose and lipid with incidence of Alzheimer. Qingdao Med J 48: , 409–410. |
[5] | Crane PK , Walker RL , Sonnen J , Gibbons LE , Melrose R , Hassenstab J , Keene CD , Postupna N , Montine TJ , Larson EB ((2016) ) Glucose levels during life and neuropathologic findings at autopsy among people never treated for diabetes. Neurobiol Aging 48: , 72–82. |
[6] | Braak H , Braak E ((1991) ) Neuropathological stageing of Alzheimer-related changes. Neuropathol 82: , 239–259. |
[7] | Hongli L , Huishi Z , Min L , Yueyue J , Yan Z , Lin Z , Rui W ((2013) ) Effect of insulin resistance on cognitive function in patients with Alzheimer’s disease. Chin J Gerontol 33: , 3018–3020. |
[8] | WellsGA, SheaB, O’ConnellD, PetersonJ, WelchV, LososM, TugwellP. The Newcastle-Ottawa Scale (NOS) for assessing the quality of nonrandomised studies in meta-analyses. http://www.ohri.ca/programs/clinical_epidemiology/oxford.htm, Accessed on April 4, 2022. |
[9] | Kilander L , Boberg M , Lithell H ((1993) ) Peripheral glucose metabolism and insulin sensitivity in Alzheimer’s disease. Neurol Scand 87: , 294–298. |
[10] | Zhihua Z , Xiaofeng G ((2015) ) Correlation between atherosclerosis and insulin resistance in patients with Alzheimer’s disease. Mod Pract Med 27: , 35–36. |
[11] | Weigang L , Yaqing F , Ronghui L , Dawei Z , Ruizhen T , Guifang L , Zhiyuan H ((2007) ) Relationship between blood glucose, true insulin, C-peptide and apolipoprotein E gene in patients with Alzheimer’s disease. Chin J Gerontol 16: , 1585–1586. |
[12] | Hongmei Y , Pingxia S , Sulan Z , Xunjun Z , Yang X , Wei H , Feng T ((2014) ) Collection between Alzheimer’s disease and insulin resistance and atherosclerosis. Pract J Cardiac Cereb Pneumal Vasc Dis 22: , 39–41. |
[13] | Qingchun X , Gaohua W , Xiaoyun C , Jianhong Y , Haizhi C , Ke C , Wanqiu N ((2015) ) Study on glucose in patients with Alzheimer disease. J Clin Psychiatry 25: , 182–184. |
[14] | Caixia F , Tianming S , Baoshan M ((2019) ) Correlation analysis on inflammatory factors, oxidative stress and insulin resistance in patients with Alzheimer’s disease. Lab Med Clin 16: , 939–942. |
[15] | Xilin L , Wenchao L , Qiudong Z ((2018) ) A case-control study on the relationship between impaired regulation of glucose metabolism and Alzheimer’s disease. Mod Instrum Med Treat 24: , 71–72+81. |
[16] | Guiqing C , Shilin W , Shudan C , Xiangyan Q ((2015) ) Relationship between Alzheimer’s disease with insulin and insulin resistance index. Guangxi Med J 37: , 1779–1781. |
[17] | Min C ((2012) ) Relationship of metabolism-related factors and Alzheimer’s disease. Shandong University (Master’s Thesis). |
[18] | Jingeng L ((2013) ) Research on correlation between late-onset Alzheimer’s disease and blood glucose, insulin and insulin resistance. Cardio-Cerebrovasc Dis Prev Treat 13: , 275–278. |
[19] | Zhijuan W , Lili X , Shimei L , Wei S ((2014) ) Correlation and risk factors between Alzheimer’s disease and vascular dementia and blood glucose index level. Chin J Clin Rational Drug Use 7: , 83–84. |
[20] | Zhijuan W , Lili X , Shimei L ((2014) ) Correlation analysis between blood glucose index level and Alzheimer’s disease. Chin J Clin Rational Drug Use 7: , 129–130. |
[21] | Liangmi L , Fang F , Wenying C , Cheng L , Yuxing F ((2015) ) Relationship between Alzheimer’s disease, vascular dementia and glucose metabolism and their risk factors. Prog Mod Biomed 15: , 2932–2934. |
[22] | Qinyun L , Zheng C , Shouzi Z , Yuetao S , Nan C , Jia Y ((2015) ) Study of blood lipid metabolism and insulin resistance in 126 cases of patients with Alzheimer’s disease. Chin J Gen Pract 13: , 15–17+99. |
[23] | Junshi Z , Weiya H ((2016) ) Clinical observation of blood lipid metabolism and insulin resistance in patients with Alzheimer’s disease. J Clin Med 3: , 498–499. |
[24] | Mei L , Yongheng C ((2017) ) Parallel comparative analysis of blood glucose, blood lipid levels and coronary heart disease in patients with Alzheimer’s disease. Chin J Gerontol 37: , 2686–2687. |
[25] | Dan L , Peng L , Weifeng L , Shuzi C , Peng L , Xunjia C ((2020) ) Correlation between glycolipid metabolism and lipopolysaccharide in patients with Alzheimer’s disease. Lab Med 35: , 1126–1129. |
[26] | Nan M , Shichao X , Qing C , Jianping C , Xunjun L , Cui M ((2010) ) A clinical study of insulin resistence serum lipid and cortisol in patients with sporadic Alzheimer’s disease. Guangzhou Med J 41: , 1–3. |
[27] | Xiaojia L , Lili Y , Jun X , Xia H , Rong W , Fang Y ((2018) ) The role of insulin and insulin resistance in mild to moderate Alzheimer’s disease of different APOE genotypes. J Chengdu Med Coll 13: , 715–719. |
[28] | Qiong W , Rong Y ((2018) ) Levels of leptin, fasting plasma glucose, insulin and inflammatory factors in patients with Alzheimer’s disease. Pract Geriatr 32: , 527–530. |
[29] | Monacelli F , Borghi R , Cammarata S , Nencioni A , Piccini A , Tabaton M , Odetti P ((2015) ) Amnestic mild cognitive impairment and conversion to Alzheimer’s disease: Insulin resistance and glycoxidation as early biomarker clusters. J Alzheimers Dis 45: , 89–95. |
[30] | Khemka VK , Bagchi D , Bandyopadhyay K , Bir A , Chattopadhyay M , Biswas A , Basu D , Chakrabarti S ((2014) ) Altered serum levels of adipokines and insulin in probable Alzheimer’s disease. J Alzheimers Dis 41: , 525–533. |
[31] | Sharifipour E , Sharifimoghadam S , Hassanzadeh N , Ghasemian Mojarad N , Ghoreishi A , Hejazi SA , Rohampour K ((2020) ) Altered plasma visfatin levels and insulin resistance in patients with Alzheimer’s disease. Acta Neurol Belg 120: , 901–906. |
[32] | Folstein MF , Folstein SE , McHugh PR ((1975) ) “Mini-mental state". A practical method for grading the cognitive state of patients for the clinician. J Psychiatr Res 12: , 189–198. |
[33] | Li W , Huang E ((2016) ) An update on type 2 diabetes mellitus as a risk factor for dementia. J Alzheimers Dis 53: , 393–402. |
[34] | Hane FT , Robinson M , Lee BY , Bai O , Leonenko Z , Albert MS ((2017) ) Recent progress in Alzheimer’s disease research, part 3: Diagnosis and treatment. J Alzheimers Dis 57: , 645–665. |
[35] | White C ((2013) ) Above average glucose level may boost dementia risk in people without diabetes. BMJ 347: , f4995. |
[36] | Cole AR , Astell A , Green C , Sutherland C ((2007) ) Molecular connexions between dementia and diabetes. Neurosci Biobehav Rev 31: , 1046–1063. |
[37] | Steen E , Terry BM , Rivera EJ , Cannon JL , Neely TR , Tavares R , Xu XJ , Wands JR , de la Monte SM ((2005) ) Impaired insulin and insulin-like growth factor expression and signaling mechanisms in Alzheimer’s disease–is this type 3 diabetes? J Alzheimers Dis 7: , 63–80. |
[38] | Dar TA , Sheikh IA , Ganie SA , Ali R , Singh LR , Gan SH , Kamal MA , Zargar MA ((2014) ) Molecular linkages between diabetes and Alzheimer’s disease: Current scenario and future prospects. CNS Neurol Disord Drug Targets 13: , 290–298. |
[39] | Watson GS , Craft S ((2003) ) The role of insulin resistance in the pathogenesis of Alzheimer’s disease: Implications for treatment. CNS Drugs 17: , 27–45. |
[40] | Kandimalla R , Thirumala V , Reddy PH ((2017) ) Is Alzheimer’s disease a type 3 diabetes? A critical appraisal. Biochim Biophys Acta Mol Basis Dis 1863: , 1078–1089. |
[41] | Starks EJ , Patrick O’Grady J , Hoscheidt SM , Racine AM , Carlsson CM , Zetterberg H , Blennow K , Okonkwo OC , Puglielli L , Asthana S , Dowling NM , Gleason CE , Anderson RM , Davenport-Sis NJ , DeRungs LM , Sager MA , Johnson SC , Bendlin BB ((2015) ) Insulin resistance is associated with higher cerebrospinal fluid tau levels in asymptomatic APOEɛ4 carriers. J Alzheimers Dis 46: , 525–533. |
[42] | Korol SV , Jin Z , Babateen O , Birnir B ((2015) ) GLP-1 and exendin-4 transiently enhance GABAA receptor-mediated synaptic and tonic currents in rat hippocampal CA3 pyramidal neurons. Diabetes 64: , 79–89. |
[43] | Wang X , Wang W , Li L , Perry G , Lee HG , Zhu X ((2014) ) Oxidative stress and mitochondrial dysfunction in Alzheimer’s disease. Biochim Biophys Acta 1842: , 1240–1247. |
[44] | Ying L , Yunen L ((2018) ) Research Progress on the relationship between hyperglycemia and Alzheimer’s disease. Pract Geriatr 32: , 805–806+812. |
[45] | Carantoni M , Zuliani G , Munari MR , D’Elia K , Palmieri E , Fellin R ((2000) ) Alzheimer disease and vascular dementia: Relationships with fasting glucose and insulin levels. Dement Geriatr Cogn Disord 11: , 176–180. |
[46] | Woltjer RL , Maezawa I , Ou JJ , Montine KS , Montine TJ ((2003) ) Advanced glycation endproduct precursor alters intracellular amyloid-beta/A beta PP carboxy-terminal fragment aggregation and cytotoxicity. J Alzheimers Dis 5: , 467–476. |
[47] | Kim D , Jo YS , Jo HS , Bae S , Kwon YW , Oh YS , Yoon JH ((2022) ) Comparative phosphoproteomics of neuro-2a cells under insulin resistance reveals new molecular signatures of Alzheimer’s disease. Int J Mol Sci 23: , 1006. |
[48] | Monacelli F , Borghi R , Cammarata S , Nencioni A , Piccini A , Tabaton M , Odetti P ((2015) ) Amnestic mild cognitive impairment and conversion to Alzheimer’s disease: Insulin resistance and glycoxidation as early biomarker clusters. J Alzheimers Dis 45: , 89–95. |
[49] | Hendrickx JO , De Moudt S , Calus E , Martinet W , Guns P , Roth L , De Deyn PP , Van Dam D , De Meyer G ((2021) ) Serum corticosterone and insulin resistance as early biomarkers in the hAPP23 overexpressing mouse model of Alzheimer’s disease. Int J Mol Sci 22: , 6656. |
[50] | Huang Y , Chen J , Htut WM , Lai X , Wik G ((2007) ) Acupuncture increases cerebral glucose metabolism in human vascular dementia. Int J Neurosci 117: , 1029–1037. |
[51] | Suba Z ((2012) ) Interplay between insulin resistance and estrogen deficiency as co-activators in carcinogenesis. Pathol Oncol Res 18: , 123–133. |
[52] | Bucht G , Adolfsson R , Lithner F , Winblad B ((1983) ) Changes in blood glucose and insulin secretion in patients with senile dementia of Alzheimer type. Acta Med Scand 213: , 387–392. |
[53] | Craft S , Peskind E , Schwartz MW , Schellenberg GD , Raskind M , Porte D Jr ((1998) ) Cerebrospinal fluid and plasma insulin levels in Alzheimer’s disease: Relationship to severity of dementia and apolipoprotein E genotype. Neurology 50: , 164–168. |
[54] | Craft S , Asthana S , Schellenberg G , Cherrier M , Baker LD , Newcomer J , Plymate S , Latendresse S , Petrova A , Raskind M , Peskind E , Lofgreen C , Grimwood K ((1999) ) Insulin metabolism in Alzheimer’s disease differs according to apolipoprotein E genotype and gender. Neuroendocrinology 70: , 146–152. |
[55] | Mei Y , Liantao L , Yujun L , Jing L ((2008) ) Relationship between metabolic syndrome and Alzheimer’s disease. Shandong Med J 7: , 100–101. |
[56] | Xiaohong S , Haihua S , Danmei Y , Decai W ((2010) ) [Analysis of correlation between insulin resistance, blood lipids and Alzheimer’s disease]. Wei Sheng Yan Jiu 39: , 573–575. |
[57] | García-Lara JM , Aguilar-Navarro S , Gutiérrez-Robledo LM , Avila-Funes JA ((2010) ) The metabolic syndrome, diabetes, and Alzheimer’s disease. Rev Invest Clin 62: , 343–349. |
[58] | Ramdane S , Daoudi-Gueddah D ((2011) ) Mild hypercholesterolemia, normal plasma triglycerides, and normal glucose levels across dementia staging in Alzheimer’s disease: A clinical setting-based retrospective study. Am J Alzheimers Dis Other Demen 26: , 399–405. |
[59] | Dehong H , Mengyuan L ((2013) ) Changes of blood glucose and blood lipid in patients with Alzheimer’s disease. Guangdong Med J 34: , 587–589. |
[60] | Morris JK , Vidoni ED , Perea RD , Rada R , Johnson DK , Lyons K , Pahwa R , Burns JM , Honea RA ((2014) ) Insulin resistance and gray matter volume in neurodegenerative disease. Neuroscience 270: , 139–147. |
[61] | Morris JK , Vidoni ED , Mahnken JD , Montgomery RN , Johnson DK , Thyfault JP , Burns JM ((2016) ) Cognitively impaired elderly exhibit insulin resistance and no memory improvement with infused insulin. Neurobiol Aging 39: , 19–24. |
[62] | Macesic M , Lalic NM , Kostic VS , Jotic A , Lalic K , Stefanova E , Milicic T , Lukic L , Gajovic JS , Krako N ((2017) ) Impaired insulin sensitivity and secretion in patients with Alzheimer’s disease: The relationship with other atherosclerosis risk factors. Curr Vasc Pharmacol 15: , 158–166. |
[63] | Hiayan M , Jihui L , Mo L , Zhihui H , Wenjie L ((2017) ) Relationship between Alzheimer’s disease and insulin resistance in patients with type 2 diabetes. Chin J Gerontol 37: , 4270–4271. |
[64] | Yan Y ((2019) ) Correlation between early cognitive impairment and abnormal blood glucose, blood lipid and inflammatory factors in Alzheimer’s disease. J Shenyang Med Coll 21: , 204–206+210. |
[65] | Shanshan X , Xuihong J , Shenglong L , Yongwei W , Weiwei Z ((2019) ) Correlation between cognitive impairment, metabolic indexes and inflammatory factors in the early stage of Alzheimer’s disease. Neural Inj Funct Reconstr 14: , 647–649. |
[66] | Zhong H , Guoxun G , Yi Z , Xi W , Ge Z , Sha Z ((2020) ) The expression and clinical significance of lipid and glucose metabolic indexes, the level of serum CRP, IL-6 and TNF-α in patients with senile dementia. Prog Mod Biomed 20: , 2740–2744. |
[67] | Burns JM , Donnelly JE , Anderson HS , Mayo MS , Spencer-Gardner L , Thomas G , Cronk BB , Haddad Z , Klima D , Hansen D , Brooks WM ((2007) ) Peripheral insulin and brain structure in early Alzheimer disease. Neurology 69: , 1094–1104. |
[68] | Isik AT , Cankurtaran M , Bozoglu E , Comert B , Doruk H , Mas MR ((2007) ) Is there any relation between insulin resistance and cognitive function in the elderly? Int Psychogeriatr 19: , 745–756. |
[69] | Domínguez RO , Marschoff ER , Guareschi EM , Repetto MG , Famulari AL , Pagano MA , Serra JA , Collaborative Group for the Study of the Oxidative Stress and Related Abnormalities ((2008) ) Insulin, glucose and glycated hemoglobin in Alzheimer’s and vascular dementia with and without superimposed Type II diabetes mellitus condition. J Neural Transm (Vienna) 115: , 77–84. |
[70] | Willette AA , Modanlo N , Kapogiannis D , Alzheimer’s Disease Neuroimaging Initiative ((2015) ) Insulin resistance predicts medial temporal hypermetabolism in mild cognitive impairment conversion to Alzheimer disease. Diabetes 64: , 1933–1940. |
[71] | Zhe S , Yi H ((2018) ) Study on the relationship between Alzheimer’s disease and insulin and insulin resistance. China Foreign Med Treat 37: , 33–35. |


