
Identification of Early Onset Dementia in Population-Based Health Administrative Data: A Validation Study Using Primary Care Electronic Medical Records
Abstract
Background:
Early onset dementia (EOD) occurs when symptoms of dementia begin between 45 to 64 years of age.
Objective:
We developed and validated health administrative data algorithms for EOD and compared demographic characteristics and presence of comorbid conditions amongst adults with EOD, late onset dementia (LOD) and adults with no dementia in Ontario, Canada.
Methods:
Patients aged 45 to 64 years identified as having EOD in their primary care electronic medical records had their records linked to provincial health administrative data. We compared several combinations of physician’s claims, hospitalizations, emergency department visits and prescriptions. Age-standardized incidence and prevalence rates of EOD were estimated from 1996 to 2016.
Results:
The prevalence of EOD for adults aged 45 to 64 years in our primary care reference cohort was 0.12%. An algorithm of ≥1 hospitalization or ≥3 physician claims at least 30 days apart in a two-year period or ≥1 dementia medication had a sensitivity of 72.9% (64.5–81.3), specificity of 99.7% (99.7–99.8), positive predictive value (PPV) of 23.7% (19.1–28.3), and negative predictive value of 100.0%. Multivariate logistic regression found adults with EOD had increased odds ratios for several health conditions compared to LOD and no dementia populations. From 1996 to 2016, the age-adjusted incidence rate increased slightly (0.055 to 0.061 per 100 population) and the age-adjusted prevalence rate increased three-fold (0.11 to 0.32 per 100 population).
Conclusion:
While we developed a health administrative data algorithm for EOD with a reasonable sensitivity, its low PPV limits its ability to be used for population surveillance.
INTRODUCTION
Dementia is a neurodegenerative condition that results in progressive cognitive impairment. Individuals are negatively impacted in the domains of speech, memory, behavior and activities of daily living [1]. Early onset dementia (EOD) is defined when the symptoms of dementia occur between the ages of 45 to 64 years and young dementia often refers to dementia which occurs when the symptoms present themselves before the age of 45 years [2, 3]. The prevalence of EOD has been estimated to be about 0.1% [4], and accounts for between 2 to 20% of all dementia cases [5].
Unlike individuals who get dementia after age 65, individuals with EOD are more likely to be employed and have dependents living at home. Consequently, EOD can result in a large reduction in quality adjusted life years [6]. Also, people with EOD have a different mix of root causes and comorbid conditions than those with late onset dementia (LOD), with more dementia due to traumatic brain injuries, alcoholism, human immunodeficiency virus (HIV), and frontotemporal lobular degeneration and less Alzheimer’s disease (AD) [7].
Health administrative data are frequently used in the surveillance of dementia at the population level [8]. Most validation studies using health administrative data for dementia case ascertainment have focused on individuals over 65 years of age [9–11]. A Canadian study which validated administrative data against primary care electronic medical records for LOD showed that “one hospitalization OR at least three physician claims spaced a minimum of 30 days apart in a two-year period or a prescription filled for an AD and related dementias (AD-RD) specific medication”, had a sensitivity (Sn) of 79%, specificity (Sp) of 99%, positive predictive value (PPV) of 80%, and negative predictive value (NPV) of 99% in individuals over 65 [12]. Very little validation work has been done on algorithms to assess dementia in individuals under age 65. A British study among women found rates of 0.12 per 1000 for EOD in women aged 55 to 59, and 0.37 per 1000 in women aged 60–64 using primary care data with good agreement in hospital data when a 1.6-year interval between symptom onset and hospitalization was presumed [13]. Another Canadian study found that data collected through the resident assessment instrument identified more cases of EOD in home care, long-term care and complex continuing care patients than in administrative data from inpatient hospitalization discharges [14].
Canadian family physicians are the main physician providers of primary care in Canada and currently over 85% of family physicians (FPs) use electronic medical records (EMRs) for their clinical care [15]. Since FP EMR data contains much clinical information and details about a patient’s health care, FP EMRs are being increasingly used for research and quality improvement [16, 17]. Algorithms to identify LOD patients seen in primary care have been developed using FP EMRs alone [18]. While health administrative data is collected and available across Canada for population surveillance of chronic diseases, using data from FP EMR alone is limited in that only a small sample of FPs provide their EMR data for disease surveillance.
Given the significant impact of EOD on quality adjusted life years, as well as the different clinical conditions associated with EOD and LOD, our objectives were: to develop and validate a health administrative data algorithm leveraging routinely collected data such as hospitalizations, emergency department (ED) visits, physician billings, and dispensed medications; compare the demographic characteristics and presence of comorbid conditions amongst adults with EOD, LOD, and no dementia; and to describe the incidence and prevalence of EOD in Ontario, Canada over time.
METHODS
Study design
We conducted a validation study using health administrative data against a reference standard of patients identified as having EOD in primary care electronic medical records. We then conducted a cohort study comparing the demographics and comorbidities among adults with EOD, LOD, and no dementia in Ontario, Canada in 2016. Finally, we used our health administrative algorithms to describe time trends in the incidence and prevalence rates of EOD.
Reference standard of early-onset dementia
We used a database which includes FP EMR data linked to health administrative data called EMRPC [19, 20]. This database contains all EMR data from 376 FPs distributed across 46 geographically distinct clinics in Ontario and currently contains data on just over 350,000 patients enrolled with their FP. EMRPC is a convenience sample of FPs who volunteer to have their EMR data linked to health administrative data for research and quality improvement. A higher proportion of EMRPC FPs are female, under the age of 44 years, Canadian trained, and work in rural practices compared to non-EMRPC FPs in Ontario. The EMR data includes all clinically relevant information from FPs including the cumulative patient profile (CPP), FP progress notes, referrals, consultant notes, laboratory and radiological tests, and hospitalization notes. ICES is an independent, non-profit research institute funded by an annual grant from the Ontario Ministry of Health (MOH) and the Ministry of Long-Term Care (MLTC). As a prescribed entity under Ontario’s privacy legislation, ICES is authorized to collect and use health care data for the purposes of health system analysis, evaluation, and decision support. Secure access to these data is governed by policies and procedures that are approved by the Information and Privacy Commissioner of Ontario [21]. These datasets were linked using unique encoded identifiers and analyzed at ICES. The EMRPC data have been used to create primary care reference standards for several validation studies [12, 22–26].
Our study population included EMRPC patients 45 to 64 years of age as of March 31, 2016, who had a valid health insurance number and date of birth and were rostered to (enrolled in) the FP’s practice.
We used a previously validated within EMR LOD algorithm tested against a reference group of patients 65 years and older as of December 31, 2012 to identify EOD cases for our reference standard [18, 27] (Supplementary Table 1). This algorithm consisted of FP billing claims which had dementia as the diagnosis for the FP encounter used at least three times over a three-year time-period or a prescription for a dementia medication or any free text of clinical diagnostic terms (and their abbreviations and misspellings) found in the CPP. The free text terms included dementia, Alzheimer, CJD, JCD, Lewy body, senile dementia, presenile/pre-senile dementia, FTD, DLB, and LBD. Mild cognitive impairment was not included. This within EMR LOD algorithm had a 72.4% sensitivity, 99.4% specificity, 84.3% positive predictive value (PPV), and 98.7% negative predictive value (NPV). Each EOD case identified and a random sample of 200 non-cases were manually reviewed by a FP (LJ) to confirm the EOD diagnosis for cases and no EOD diagnosis for non-cases. EMRPC patients not identified as EOD cases were classified as non-cases.
Health administrative data sources
Health administrative data were obtained for the EOD reference standard for the period April 1, 1991 to March 31, 2016. The Ontario Health Insurance Plan (OHIP) database identified physician claims diagnosis codes. These diagnoses are coded according to a modification of the 8th revision of the International Classification of Diseases (ICD) [28]. Hospital admissions were extracted from the Canadian Institute for Health Information Discharge Abstract Database, which contains detailed information regarding all hospital admissions and the National Ambulatory Care Reporting System, which records all same day surgery (SDS) and ED visits. Hospital data prior to 2002 have diagnoses coded in ICD-9, while hospitalizations and ED encounters after 2002 are coded using ICD-10-CA. Prescription drug reimbursement records were extracted from the Ontario Drug Benefit database which covers all people over 65 years of age and people on social assistance. Information on physician specialty for the billing claims was found in the ICES Physician Database. The Registered Persons Database contained demographic information on all persons eligible for universal health care coverage in Ontario. Prescription drug reimbursement records were examined for reference to the cholinesterase inhibitor subclass including donepezil, galantamine, rivastigmine, tacrine, and memantine. Physician billing claims included OHIP diagnosis codes of 290 and 331. Supplementary Table 2 provides a list of the EOD ICD-9 and ICD-10-CA codes used.
EOD algorithm development and testing
Building from our previous work developing chronic disease algorithms, we developed a SAS program which produces over 300 algorithms derived from combinations of physician billing claims diagnoses, hospital discharge diagnoses, SDS or ED visit diagnoses, and prescription drug reimbursement records for dementia-related drugs. We examined the inclusion of EOD specialist physicians claims from neurology, psychiatry, or geriatrics. We tested the potential misclassification of delirium as being dementia by including a minimum of 30 days between physician claims. These algorithms also varied the time period in which diagnosis codes appeared.
Chronic disease cohorts
Several chronic disease cohorts were used to compare the comorbidities among EOD, LOD, and the population over the age of 45 years in Ontario in 2016. We used validated chronic disease algorithms using health administrative data to identify patients having cardiovascular conditions including congestive heart failure (CHF) [29], post-myocardial infarction (Post MI) [30, 31], hypertension [32], and diabetes [24, 33], respiratory conditions including chronic obstructive pulmonary disease (COPD) [22] and asthma [23], neurological diseases such as Parkinsonism [25], epilepsy [34], and multiple sclerosis [26], mental health conditions [35] and schizophrenia [36], and HIV [37].
Patient characteristics
Patient characteristics included patient age, sex, rurality, socioeconomic status, and comorbidity. As a proxy measure for socioeconomic status, a Statistics Canada postal code conversion file and census data were used to calculate neighborhood income quintiles [38, 39]. The Statistics Canada postal code conversion file was also used to determine location of residence (rural or urban) as defined by the Rurality Index of Ontario [40]. The Johns Hopkins Adjusted Clinical Group (ACG®) system was used to measure patient comorbidity burden from all health care encounters recorded in health administrative data. The number of Aggregated Diagnosis Groups (ADGs) for each patient was summed and used to categorize patients into acuity levels [41].
Statistical analysis
Descriptive statistics were used to characterize the study population. The selection of the “best” performing EOD algorithms were assessed by selecting those with the highest Sn, Sp, PPV, and NPV and Youden’s index. Another criteria used in selecting algorithms included those algorithms which produced an EOD prevalence close to the prevalence of the EOD reference cohort. For the best performing EOD algorithms, the false positive and false negative cases were manually reviewed to inform reasons of misclassification (by LJ).
We applied selected EOD algorithms to the entire population of Ontario from 1996 to 2016 and calculated the age-standardized incidence and prevalence rates for adults aged 45 to 64 years old. These rates were standardized to the 2006 Canadian Census population.
After examining the performance measures (Sn, Sp, PPV, NPV, Youden’s index, and algorithm prevalence) for each algorithm, we identified the cohort of patients with EOD by selecting one EOD algorithm and applying it to the Ontario population aged 45 to 64 years in 2016. To identify the cohort of patients with LOD, we used the previously validated LOD algorithm for the Ontario population over 65 years of age in 2016 [12]. People aged over 45 years of age not identified using the EOD and LOD algorithms were deemed to be non-dementia cases. Bivariate analyses compared the characteristic of EOD, LOD, and non-dementia cases in the Ontario population. Multivariable logistic regression models were run to examine the magnitude of the association between EOD to LOD, EOD to no dementia, and LOD to no dementia for comorbid conditions. The models were adjusted for age, sex, rurality, and neighborhood income quintiles. Adjusted odds ratios (ORs) and 95% CIs are reported. All analyses were performed on de-identified data using SAS version 9.2 [42].
RESULTS
Our reference standard included 89,305 EMRPC patients aged 45 to 64 years of age, 107 were identified using the previously validated within EMR algorithm as having EOD, giving an overall prevalence rate in our reference standard of 0.12%. The EOD prevalence rates in the reference standard stratified for ages 45 to 49 years and 50 to 64 years were 0.03% and 0.15%, respectively. When we stratified for ages 45 to 54 years and 55 to 64 years, the EOD prevalence rates were 0.05% and 0.19%, respectively. The EOD prevalence in the reference standard was 0.13% for men and 0.11% for women.
Table 1 presents Sn, Sp, PPV, NPV, and Youden index of selected health administrative data algorithms; these were selected because of highest values for Sn, PPV, and Youden indices. While some algorithms had good Sns (over 80%), their corresponding PPVs were poor (less than 10%). Algorithms with better PPVs, had corresponding Sns which were low (less than 60%). The overall “best” EOD algorithm was ≥1 hospitalization or ≥3 physician claims spaced a minimum of 30 days apart in a two-year period or ≥1 prescription for a dementia medication. It has a reasonable sensitivity of 72.9%, the highest PPV at 23.7% of all selected algorithms and it was the same algorithm that was used for LOD.
Table 1
Validity measures (95% confidence intervals) for selected early onset dementia administrative data algorithms
| Algorithm | Sensitivity (%) | Specificity (%) | Positive Predictive Value (%) | Negative Predictive Value (%) | Youden Index |
| ≥1 h or ≥1 p or ≥1 d ever | 87.9 (81.7–94.0) | 98.0 (97.9–98.1) | 5.0 (4.0–5.9) | 100.0 (100.0–100.0) | 0.86 |
| ≥1 h or ≥1 e or ≥1 p ever | 86.0 (79.4–92.6) | 98.0 (97.9–98.1) | 4.8 (3.9–5.8) | 100.0 (100.0–100.0) | 0.84 |
| ≥1 p or ≥1 d ever | 86.0 (79.4–92.6) | 98.0 (97.9–98.1) | 4.9 (3.9–5.9) | 100.0 (100.0–100.0) | 0.84 |
| ≥1 h or ≥3 p spaced a minimum of 30 days apart in a 2-y period or ≥1 d | 72.9 (64.5–81.3) | 99.7 (99.7–99.8) | 23.7 (19.1–28.3) | 100.0 (100.0–100.0) | 0.73 |
| ≥2 p in 3 y | 77.6 (69.7–85.5) | 99.3 (99.2–99.3) | 11.3 (9.0–13.6) | 100.0 (100.0–100.0) | 0.77 |
| ≥1 h ever or (≥5 p in 2 y) | 57.0 (47.6–66.4) | 99.8 (99.7–99.8) | 22.7 (17.7–27.7) | 99.9 (99.9–100.0) | 0.57 |
h, hospitalization claim; p, physician claim; d, drug benefit claim; e, emergency department visit; y, years.
Among these selected algorithms, there were a maximum of 45 false positive cases (found in the health administrative data but not according to the reference standard classification). Of these 45 false positives, 48.8% had a hospital admission with no subsequent evidence of dementia in the FP’s EMR (of these 77.3% had a hospital admission prior to the EMR start date), “cognitive impairment” was documented in the EMR CPP or FP’s notes without a notation of dementia and some had a billing for dementia without dementia being noted anywhere in the EMR notes (17.8%). The chart review also noted significant comorbidity found with the false positive cases with HIV and/or Hepatitis B and C (28.9%), organic or acquired brain injury (22.2%), depression and/or schizophrenia or bipolar disorder (33.3%) and epilepsy or multiple sclerosis or Parkinsonism or Huntington’s disease (26.7%). Among the selected algorithms there were a maximum of 110 false negative cases (not found in the administrative data but found in the EMR data). Documentation was clearly noted in the CPP and/or FP’s progress notes (47.5%), found in a neurological-focused specialist note (47.5%), the patient was taking a dementia-specific medication (55%), or there was a mention of dementia in another specialist or hospital note (less than 10%). Less than 10% of the false negative cases had comorbidities such as Parkinson’s disease, acquired brain injury, Down’s syndrome, schizophrenia, and HIV.
Table 2 compares patient characteristics and comorbidities among the EOD, LOD, and no dementia populations in Ontario, Canada in 2016. A higher percentage of men and people living in the lowest neighborhood income quintile had EOD compared to the LOD and no dementia populations. The EOD population had a higher percentage of people with MS, epilepsy, any mental health condition, schizophrenia, and HIV. The LOD population had a higher percentage with CHF, hypertension, and post-MI. Both EOD and LOD had a higher percentage of people with diabetes, asthma, COPD, and Parkinsonism than the no dementia population.
Table 2
Demographic and comorbid condition characteristics of early onset dementia (EOD), late onset dementia (LOD), and no dementia cases in Ontario, Canada in 2016
| Characteristic | EOD | LOD | No Dementia |
| (N = 25,238) | (N = 162,851) | (N = 6,373,245) | |
| Age (Mean±SD) | 63.96±7.66 | 84.33±7.09* | 60.65±11.55 |
| Age Group (y) | |||
| 44 to 49 | 912 (3.6%) | N/A | 1,193,225 (18.7%) |
| 50 to 54 | 2,136 (8.5%) | N/A | 1,099,728 (17.3%) |
| 55 to 59 | 3,717 (14.7%) | N/A | 1,032,629 (16.2%) |
| 60 to 64 | 5,934 (23.5%) | N/A | 879,604 (13.8%) |
| 65 to 69 | 6,947 (27.5%) | 3,096 (1.9%) | 752,798 (11.8%) |
| 70 to 74 | 3,683 (14.6%) | 13,130 (8.1%) | 542,439 (8.5%) |
| 75 to 79 | 1,382 (5.5%) | 25,141 (15.4%) | 381,196 (6.0%) |
| 80 to 84 | 421 (1.7%) | 42,623 (26.2%) | 259,738 (4.1%) |
| 85+ | 106 (0.4%) | 40,611 (24.9%) | 231,888 (3.7%) |
| Male (%) | 49.2% * | 36.4% | 48.2% |
| Rurality | |||
| Urban | 22,632 (89.3%) | 145,201 (89.2%) | 5,625,673 (88.3%) |
| Rural | 2,621 (10.4%) | 17,190 (10.6%) | 738,643 (11.6%) |
| Neighborhood Income Quintiles | |||
| 1 –Low | 6,975 (27.6%) | 40,875 (25.1%) | 1,206,161 (18.9%) |
| 2 | 6,429 (21.5%) | 35,939 (22.1%) | 1,266,528 (19.9%) |
| 3 | 4,645 (18.4%) | 30,756 (18.9%) | 1,273,581 (20.0%) |
| 4 | 4,106 (16.3%) | 27,860 (17.1%) | 1,260,658 (19.8%) |
| 5 –High | 3,998 (15.8%) | 26,959 (16.6%) | 1,357,267 (21.3%) |
| John’s Hopkins Comorbidity Index | |||
| 0 to 4 ADGs (low comorbidity) | 6,890 (27.3%)* | 39,659 (24.3%) | 2,941,266 (46.1%) |
| 5 to 9 ADGs | 10,295 (40.8%) | 61,886 (38.0%) | 2,552,123 (40.1%) |
| 10+ ADGs (higher comorbidity) | 7,933 (31.3%) | 60,107 (36.9%) | 729,944 (11.5%) |
| History of Acute Myocardial Infarction | 1,018 (4.0%) | 11,221 (6.9%)* | 150,366 (2.4%) |
| Congestive Heart Failure | 2,009 (8.0%) | 26,970 (16.6%)* | 178,432 (2.8%) |
| Hypertension | 13,699 (54.3%) | 131,661 (80.8%)* | 2,490,280 (39.1%) |
| Diabetes | 8,108 (32.1%) | 55,737 (34.2%)* | 1,118,883 (17.6%) |
| Asthma | 4,129 (16.4%)* | 23,025 (14.1%) | 734,050 (11.5%) |
| Chronic Obstructive Pulmonary Disease | 5,950 (23.6%) | 43,984 (27.0%)* | 732,146 (11.5%) |
| Parkinsonism | 1,329 (5.3%) | 9,433 (5.8%) | 27,609 (0.4%) |
| Epilepsy | 2,873 (11.4%)* | 4,881 (3.0%) | 68,847 (1.1%) |
| Multiple Sclerosis | 809 (3.2%)* | 649 (0.4%) | 22,553 (0.4%) |
| Schizophrenia | 5,014 (19.9%)* | 5,499 (3.4%) | 81,964 (1.2%) |
| Any Mental Health | 11,523 (45.7%)* | 50,633 (31.1%) | 1,323,200 (20.8%) |
| HIV | 179 (0.7%)* | 54 (<0.01%) | 12,291 (0.2%) |
*p < 0.001. ADG, adjusted diagnostic group; SD, standard deviation.
Table 3 presents the adjusted ORs for chronic diseases among EOD and LOD populations. While there were statistically significant odds ratios of having CHF, post-MI, hypertension, diabetes, asthma, COPD, and any mental health condition among people with EOD compared to LOD and the no dementia population, the ORs with the highest estimates were among individuals with EOD and HIV, epilepsy, MS, schizophrenia, and Parkinsonism. Statistically significant odds of having schizophrenia, Parkinsonism, epilepsy, and any mental health condition were found among LOD compared to the no dementia population.
Table 3
Adjusted odds ratios and 95% confidence intervals (95% CIs) for chronic conditions among early onset dementia, late onset dementia, and no dementia*
| Chronic Condition | EOD versus LOD | EOD versus no dementia | LOD versus no dementia |
| History of Acute Myocardial Infarction | 1.64 (1.54–1.76) | 1.58 (1.49–1.69) | 0.96 (0.94–0.98) |
| Congestive Heart Failure | 2.39 (2.28–2.51) | 3.10 (2.95–3.24) | 1.30 (1.28–1.32) |
| Hypertension | 1.44 (1.40–1.48) | 1.42 (1.39–1.46) | 0.99 (0.98–1.00) |
| Diabetes | 2.16 (2.09–2.22) | 1.92 (1.87–1.98) | 0.89 (0.88–0.90) |
| Asthma | 1.32 (1.27–1.37) | 1.45 (1.40–1.50) | 1.10 (1.08–1.11) |
| Chronic Obstructive Pulmonary Disease | 1.96 (1.89–2.02) | 2.09 (2.03–2.15) | 1.07 (1.06–1.08) |
| Parkinsonism | 3.14 (2.95–3.34) | 12.53 (11.84–13.27) | 3.99 (3.88–4.10) |
| Epilepsy | 3.81 (3.62–4.00) | 11.35 (10.91–11.81) | 2.98 (2.89–3.09) |
| Multiple Sclerosis | 5.83 (5.23–6.49) | 10.27 (9.55–11.03) | 1.76 (1.62–1.92) |
| Schizophrenia | 3.47 (3.28–3.66) | 16.71 (16.03–17.41) | 4.82 (4.63–5.02) |
| Any Mental Health | 1.56 (1.52–1.60) | 3.26 (3.18–3.34) | 2.09 (2.07–2.12) |
| HIV | 6.26 (4.9–8.51) | 4.20 (3.61–4.87) | 0.67 (0.51–0.88) |
*Adjusted for age, sex, rurality, and neighborhood income quintiles.
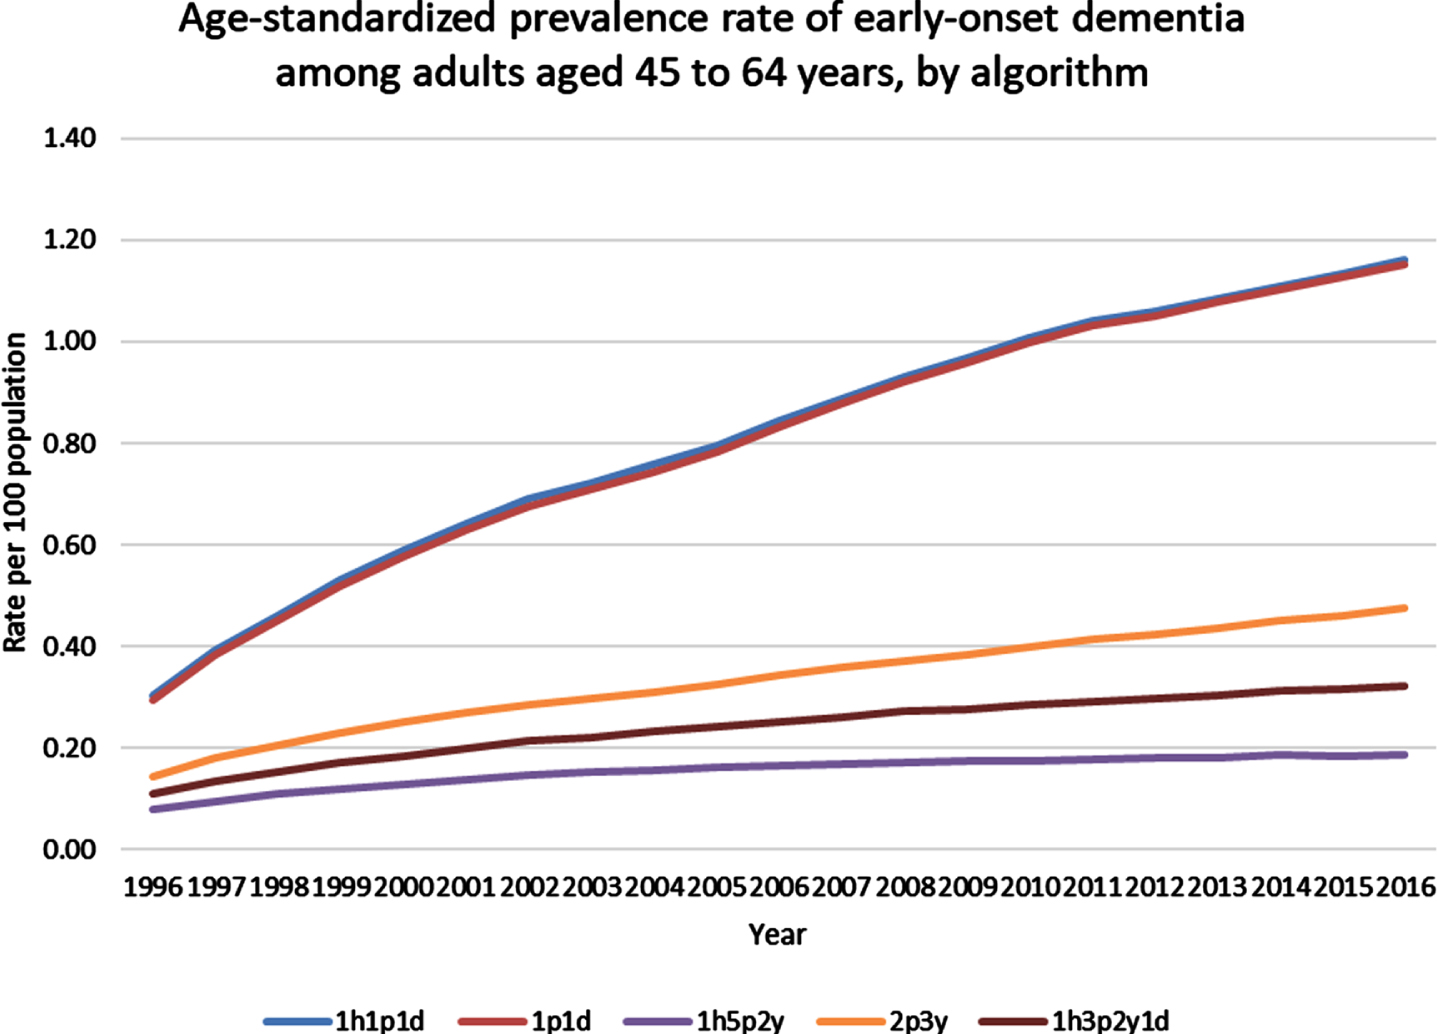
Age-adjusted incidence rates for selected EOD algorithms are presented in Fig. 1 and age-adjusted prevalence rates for the same algorithms are presented in Fig. 2. The algorithms having one physician claim or combinations of one hospital, physician, or drug claim had similar and higher age-adjusted EOD incidence and prevalence rates than algorithms having a higher number of claim combinations (of either physician or hospitalization claims). Using the same EOD algorithm used for the cohort comparisons in Tables 2 and 3 , the age-adjusted incidence rate increased slightly from 0.055 per 100 population in 1996 to 0.061 per 100 population in 2016. The age-adjusted prevalence rate increased three-fold form 0.11 per 100 population in 1996 to 0.32 per 100 population in 2016.
Fig. 1
Age-standardized incidence rate of early-onset dementia among adults aged 45 to 64 years, by algorithm. h, hospitalization claim; p, physician claim; d, drug benefit claim; y, year.
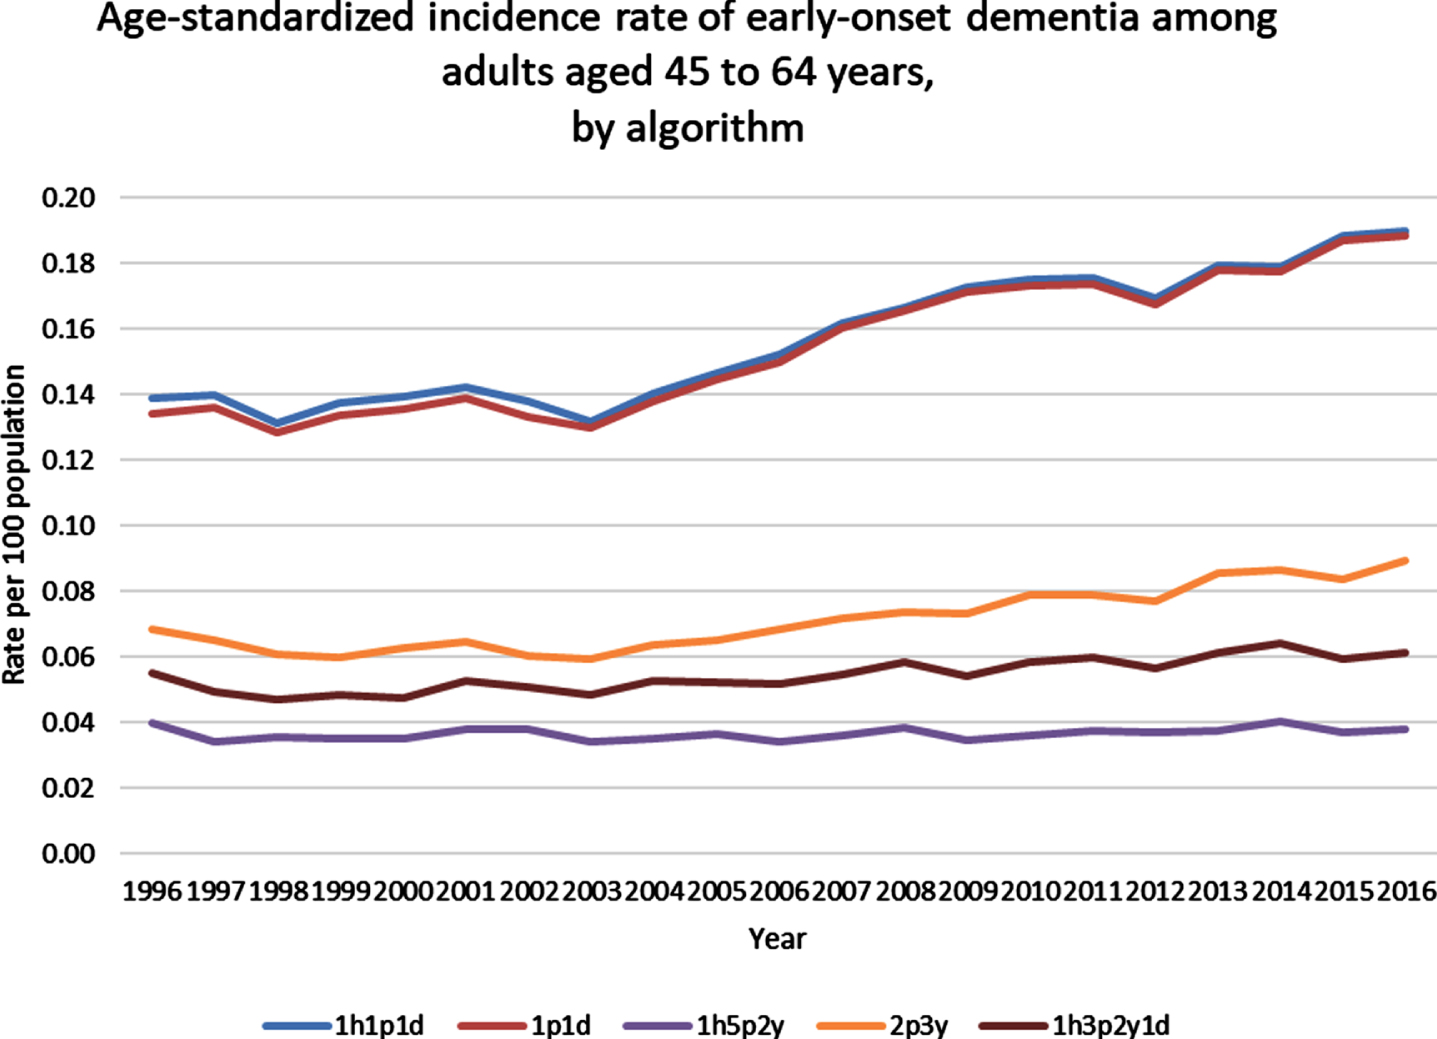
Fig. 2
Age-standardized prevalence rate of early-onset dementia among adults aged 45 to 64 years, by algorithm. h, hospitalization claim; p, physician claim; d, drug benefit claim; y, year.
DISCUSSION
The prevalence of EOD for adults 45 to 64 years of age in our primary care population was 0.12%. It is important to carefully assess the algorithm performance parameters such as Sn, Sp, PPV, and NPV, before implementing them for population surveillance purposes because health administrative data algorithms are prone to misclassification [43]. Moreover, developing a health administrative data algorithm for a condition with a low prevalence such as EOD was challenging because any algorithm with reasonable sensitivity (i.e., over 70%), had a poor PPV. The PPV is sensitive to the underlying prevalence of the condition. If the purpose of a study is to use an algorithm with a reasonable Sn (true positive rate) to identify a study cohort at one point in time, then it low PPV may be acceptable. For the purposes of comparing EOD to LOD and no dementia cohorts at a population level, we decided to focus on algorithms having a reasonable Sn.
We wanted to develop health administrative data algorithms which best represented the prevalence and incidence of EOD at the population level. Our reference standard identified EOD patients from primary care records. Using a primary care reference standard, as opposed to a specialist clinic reference standard, is more likely to approximate the prevalence of EOD in the community. In Canada, health administrative data sources and population demographics vary across jurisdictions. In Ontario, as with all provinces in Canada, health administrative data covers the entire population eligible for health care benefits. Ontario has complete population coverage for physician claims, hospitalizations, SDS and ED visits. However, Ontario only has prescription claims data for people over 65 years of age with limited data on people under 65 years of age (those receiving social assistance). For jurisdictions that have prescription coverage for all ages, they may choose an algorithm that includes prescription claims. Similarly, our province has data for SDS and ED visits, while other jurisdictions do not.
Our EOD prevalence rates are slightly higher than those found in other studies, though we limited our age group from 45 to 64 years [13]. A systematic review found EOD prevalence estimates between 38 to 260 per 100,000 population [44]. We similarly found the prevalence increased when we focused on age groups closer to 65 years. Even though EOD has a low prevalence compared to other chronic diseases, it has an overwhelming impact on an adult’s quality of life, including job losses [45, 46].
For our EOD time trend description, we chose the same health administrative data algorithm as recommended for LOD [12]. Our EOD health administrative data algorithm had a Sn of 72.9%, Sp of 99.7%, PPV of 23.7%, and NPV of 100%. Using this algorithm, we found the age-adjusted incidence rate increased slightly, whereas the age-adjusted prevalence rate increased three-fold from 1996 to 2016. The increasing prevalence and incidence rates may be related to improved medical care and more clinical experience and knowledge amongst the comorbidities associated with EOD including HIV, neurological conditions, and cardiovascular diseases, thereby leading to the diagnosis of dementia among people having these conditions.
Similarly found in other studies, the EOD population had a higher proportion of men than the LOD population [7, 44]. We also found a higher proportion of neurological, psychiatric, and HIV comorbidity among the EOD population compared with the LOD population. While the exact causes and etiology for both EOD and LOD is still the subject of much research, EOD is more likely to be a single gene defect with having a family history of EOD being a significant risk factor [3]. Environmental factors, including comorbidities, which contribute to the development of LOD (such as cardiovascular disease) are likely to be different for EOD. Our study does demonstrate different comorbidities between EOD and LOD populations. Given the increasing prevalence of EOD, it is important for clinicians to be on alert and recognize the symptoms of EOD early amongst persons having neurological, psychiatric, and HIV conditions so that appropriate therapeutic and social supports are provided.
There are limitations in our study. Our primary care reference standard included more rural, younger, female, and Canadian trained FPs [19, 20]. However, we did not find any differences in rurality between EOD and LOD populations. Most adults in Ontario between 45 to 64 years do not have their prescription medications covered under the current provincial drug benefit plan. This limits the use of medications in algorithms to identify adults with EOD. Currently the Canadian government is developing a Pharmacare plan to cover drug costs for Canadians of all ages and having prescription data for all ages will likely improve the performance of our EOD algorithm [47]. Also, an awareness of dementia and the use of cognitive assessments for dementia have likely increased over the 20-year time frame of our trends analysis and this may contribute to the increasing incidence of EOD. Finally, our incidence rates are based on health administrative data, and they do not equate to the diagnosis date for EOD. The symptoms of dementia are likely to appear prior to their documentation in health administrative data. Future EOD algorithms may include additional information such as free text notes from primary care providers and/or data from cognitive assessments (i.e., MOCA) contained in primary care EMRs to augment administrative data algorithms.
Conclusions
We developed a health administrative data algorithm for EOD with a reasonable Sn, though low PPV and this limits its use for population surveillance. Persons with EOD have significantly higher comorbidities compared to LOD patients and the adult population over 45 years of age. The age-standardized incidence rate for EOD from 1996 to 2016 has slightly increased, whereas the age-standardized prevalence rate has increased three-fold.
ACKNOWLEDGMENTS
Funding for this publication was provided by the Public Health Agency of Canada. The opinions expressed in this publication are those of the authors/researchers and do not necessarily reflect the official views of the Public Health Agency of Canada.
This study was supported by ICES, which is funded by an annual grant from the Ontario Ministry of Health (MOH) and the Ministry of Long-Term Care (MLTC). Parts of this material are based on data and information compiled and provided by: MOH and the Canadian Institute of Health Information (CIHI). The analyses, conclusions, opinions and statements expressed herein are solely those of the authors and do not reflect those of the funding or data sources; no endorsement is intended or should be inferred. Parts of this material are based on data and/or information compiled and provided by CIHI. However, the analyses, conclusions, opinions and statements expressed in the material are those of the author(s), and not necessarily those of CIHI. We thank IQVIA Solutions Canada Inc. for use of their Drug Information File.
Authors’ disclosures available online (https://www.j-alz.com/manuscript-disclosures/22-0384r1).
SUPPLEMENTARY MATERIAL
[1] The supplementary material is available in the electronic version of this article: https://dx.doi.org/10.3233/JAD-220384.
REFERENCES
[1] | World Health Organization (2008) The global burden of disease: 2004 update. World Health Organization. https://apps.who.int/iris/handle/10665/43942. |
[2] | Alzheimer Society Canada (2022) Young Onset Dementia. https://alzheimer.ca/en/Home/About-dementia/Dementias/young-onset-dementia, Accessed on August 3, 2022. |
[3] | Masellis M , Sherborn K , Neto P , Sadovnick DA , Hsiung GY , Black SE , Prasad S , Williams M , Gauthier S ((2013) ) Early-onset dementias: Diagnostic and etiological considerations. Alzheimers Res Ther 5: (Suppl 1), S7. |
[4] | Harvey R , Skelton-Robinson M , Rossor M ((2003) ) The prevalence and causes of dementia in people under the age of 65 years. J Neurol Neurosurg Psychiatry 74: , 1206–1209. |
[5] | Novek S , Shooshtari S , Menec V ((2016) ) Comparing the overall health, stress, and characteristics of Canadians with early-onset and late-onset dementia. J Aging Health 28: , 1016–1037. |
[6] | Ducharme S , Dickerson BC ((2015) ) The neuropsychiatric examination of the young-onset dementias. Psychiatr Clin North Am 38: , 249–264. |
[7] | McMurtray A , Clark DG , Christine D , Mendez MF ((2006) ) Early-onset dementia: Frequency and causes compared to late-onset dementia. Dement Geriatr Cogn Disord 21: , 59–56. |
[8] | Public Health Agency of Canada, The Canadian Chronic Disease Surveillance System (CCDSS) https://www.canada.ca/en/public-health/services/publications/canadian-chronic-disease-surveillance-system-factsheet.html. |
[9] | Herrmann N , Gill SS , Bell CM , Anderson GM , Bronskill SE , Shulman KI , Fischer HD , Sykora K , Shi HS , Rochon PA ((2007) ) A population-based study of cholinesterase inhibitor use for AD. J Am Geriatr Soc 55: , 1517–1523. |
[10] | Bharmal MF , Weiner M , Sands LP , Xu H , Craig BA , Thomas J 3rd ((2007) ) Impact of patient selection criteria on prevalence estimates and prevalence of diagnosed dementia in a Medicaid population. Alzheimer Dis Assoc Disord 21: , 92–100. |
[11] | Greco A , Cascavilla L , Paris F , Errico M , Orsitto G , D’Alessandro V , Placentino G , Franceschi M , Seripa D , Vendemiale GL , Pilotto A ((2005) ) An undercoding of Alzheimer’s disease and related ADs in hospitalized elderly patients in Italy. J Alzheimers Dis Other Demen 20: , 167–170. |
[12] | Jaakkimainen RL , Tierney M , Herrmann N , Green D , Young J , Ivers N , Butt D , Widdifield J , Tu K ((2016) ) Identification of physician-diagnosed Alzheimer’s disease and related dementias in population-based administrative data: A validation study using family physicians’ electronic medical records. J Alzheimers Dis 54: , 337–349. |
[13] | Brown A , Kirichek O , Balkwill A , Reeves G , Beral V , Sudlow C , Gallacher J , Green J ((2016) ) Comparison of dementia recorded in routinely collected hospital admission data in England with dementia recorded in primary care. Emerg Themes Epidemiol 13: , 11. |
[14] | Kosteniuk JG , Morgan DG , O’Connell ME , Kirk A , Crossley M , Teare GF , Stewart NJ , Dal Bello-Haas V , Forbes DA , Innes A , Quail JM ((2015) ) Incidence and prevalence of dementia in linked administrative health data in Saskatchewan, Canada: A retrospective cohort study. BMC Geriatr 15: , 73. |
[15] | Canadian Institute for Health Information (2020) How Canada Compares: Results from the Commonwealth Fun’s 2019 International Health Policy Survey of Primary Care Physicians –Accessible Report. Ottawa, Ontario. |
[16] | Zhang H , Candido E , Wilton AS , Duchen R , Jaakkimainen L , Wodchis W , Morris Q ((2020) ) Identifying transitional high cost users from unstructured patient profile written by primary care physicians. Pac Symp Biocomput 25: , 127–138. |
[17] | Jaakkimainen RL , Glazier R , Barnsley J , Salkeld E , Lu H , Tu K ((2014) ) Waiting to see the specialist. Patient and provider characteristics of wait times from Primary to Specialty Care. BMC Family Pract 15: , 16. |
[18] | Williamson T , Green ME , Birtwhistle R , Khan S , Garies S , Wong ST , Natarajan N , Manca D , Drummond N ((2014) ) Validating the 8 CPCSSN case definitions for chronic disease surveillance in a primary care database of electronic health records. Ann Fam Med 12: , 367–372. |
[19] | Tu K , Mitiku TF , Ivers NM , Guo H , Lu H , Jaakkimainen L , Kavanagh DG , Lee DS , Tu JV ((2014) ) Evaluation of Electronic Medical Record Administrative data Linked Database (EMRALD). Am J Manag Care 20: , e15–e21. |
[20] | Tu K , Widdifield J , Young J , Oud W , Ivers N , Butt D , Leaver C , Jaakkimainen L ((2015) ) Are family physicians comprehensively using electronic medical records such that the data can be used for secondary purposes? A Canadian perspective. BMC Med Inform Decis Mak 15: , 67. |
[21] | ICES. Privacy at ICES. https://www.ices.on.ca/Data-and-Privacy/Privacy-at-ICES. Accessed April 20, 2020. |
[22] | Gershon AS , Wang C , Guan J , Vasilevska-Ristovska J , Cicutto L , To T ((2009) ) Identifying individuals with physician diagnosed COPD in health administrative databases. COPD 6: , 388–394. |
[23] | Gershon AS , Wang C , Guan J , Vasilevska-Ristovska J , Cicutto L , To T ((2009) ) Identifying patients with physician-diagnosed asthma in health administrative databases. Can Respir J 16: , 183–188. |
[24] | Lipscombe LL , Hwee J , Webster L , Shah BR , Booth GL , Tu K ((2018) ) Identifying diabetes cases from administrative data: A population-based validation study. BMC Health Serv Res 18: , 316. |
[25] | Butt DA , Tu K , Young J , Green D , Wang M , Ivers N , Jaakkimainen L , Lam R , Guttman M ((2014) ) A validation study of administrative data algorithms to identify patients with Parkinsonism with prevalence and incidence trends. Neuroepidemiology 43: , 28–37. |
[26] | Widdifield J , Ivers NM , Young J , Green D , Jaakkimainen L , Butt DA , O’Connor P , Hollands S , Tu K ((2015) ) Development and validation of an administrative data algorithm to estimate the disease burden and epidemiology of multiple sclerosis in Ontario, Canada. Mult Scler 21: , 1045–1054. |
[27] | Tu K , Jaakkimainen L , Butt D , Ivers N , Jette N , Guttman M , O’Connor P , Herrmann N , Tierney M , Lam R , Wang M , Young J , Green D , Turner R (2013) Validation of administrative data algorithms to determine population prevalence and incidence of Alzheimer’s disease, dementia, multiple sclerosis, epilepsy and Parkinson’s disease., Toronto, Canada. A Report to the Public Health Agency of Canada. |
[28] | World Health Organization (1988) International Classification of Diseases, Ninth Revision Clinical Modification. World Health Organization, Geneva. |
[29] | Schultz SE , Rothwell DM , Chen Z , Tu K ((2013) ) Identifying cases of congestive heart failure from administrative data: A validation study using primary care patient records. Chronic Dis Inj Can 33: , 160–166. |
[30] | Austin PC , Daly PA , Tu JV ((2002) ) A multicenter study of the coding accuracy of hospital discharge administrative data for patients admitted to cardiac care units in Ontario. Am Heart J 144: , 290–296. |
[31] | Tu K , Guo H , Lee D S , Tu J ((2010) ) Myocardial infarction and the validation of physician billing and hospitalization data using electronic medical records. Chronic Dis Canada 30: , 141–146. |
[32] | Tu K , Lipscombe LL , Chen ZL , for the CHEP Outcomes Research Taskforce ((2008) ) Prevalence and incidence of hypertension from 1995 to 2005: A population-based study. CMAJ 178: , 1429–1435. |
[33] | Hux JE , Ivis F , Flintoft V , Bica A ((2002) ) Diabetes in Ontario: Determination of prevalence and incidence using a validated administrative data algorithm. Diabetes Care 25: , 512–516. |
[34] | Tu K , Wang M , Jaakkimainen RL , Butt D , Ivers NM , Young J , Green D , Jette N ((2014) ) Assessing the validity of using administrative data to identify patients with epilepsy. Epilepsia 55: , 335–343. |
[35] | Steele LS , Glazier RH , Lin E , Evans M ((2004) ) Using administrative data to measure ambulatory mental health service provision in primary care. Med Care 42: , 960–965. |
[36] | Kurdyak P , Lin E , Green D , Vigod S ((2015) ) Validation of a population-based algorithm to detect chronic psychotic illness. Can J Psychiatry 60: , 362–368. |
[37] | Antoniou T , Zagorski B , Loutfy MR , Strike C , Glazier RH ((2011) ) Validation of case-finding algorithms derived from administrative data for identifying adults living with human immunodeficiency virus infection. Plos One 6: , e21748. |
[38] | Statistics Canada (2017) Postal Code OM Conversion File Plus (PCCF+) Version 7A, Reference Guide. https://www150.statcan.gc.ca/n1/en/catalogue/82F0086X, Updated March 6, 2017, Accessed August 4, 2022. |
[39] | Statistics Canada (2017) Postal Code OM Conversion File (PCCF), Reference Guide. Catalogue no. 92-154- G. https://www150.statcan.gc.ca/n1/pub/92-154-g/92-154-g2017001-eng.htm, Updated December 13, 2017, Accessed August 4, 2022. |
[40] | Kralj B ((2000) ) Measuring “rurality” for purposes of health-care planning: An empirical measure for Ontario. Ont Med Rev 67: , 33–52. |
[41] | The Johns Hopkins ACG® System Version 9. https://www.hopkinsacg.org/ Accessed January 12, 2022. |
[42] | SAS Institute. SAS Enterprise Guide version 7.1 Cary, North Carolina, USA. |
[43] | Benchimol EI , Manuel DG , To T , Griffiths AM , Rabeneck L , Guttmann A ((2011) ) Development and use of reporting guidelines for assessing the quality of validation studies of health administrative data. J Clin Epidemiol 64: , 821–829. |
[44] | Lambert MA , Bickel H , Prince M , Fratiglioni L , Von Strauss E , Frydecka D , Kiejna A , Georges J , Reynish EL ((2014) ) Estimating the burden of early onset dementia; systematic review of disease prevalence. Eur J Neurol 21: , 563–569. |
[45] | Sakata N , Okumura Y ((2017) ) Job loss after diagnosis of early-onset dementia: A matched cohort study. J Alzheimers Dis 60: , 1231–1235. |
[46] | Strand BH , Knapskog AB , Persson K , Holt Edwin T , Bjertness E , Engedal K , Selbaek G ((2019) ) The loss in expectation of life due to early-onset mild cognitive impairment and early-onset dementia in Norway. Dement Geriatr Cogn Disord 47: , 355–365. |
[47] | Health Canada (2019) A prescription for Canada: Achieving Pharmacare for All. Final Report of the Advisory Council on the Implementation of National Pharmacare. Cat: H22-4/18-2019E PDF ISBN: 9 78-0-660-30975-0.https://www.canada.ca/en/health-canada/corporate/about-health-canada/public-engagement/external-advisory-bodies/implementation-national-pharmacare/final-report.html, Accessed March 30, 2022. |


