
Brain Tissue-Derived Extracellular Vesicles in Alzheimer’s Disease Display Altered Key Protein Levels Including Cell Type-Specific Markers
Abstract
Background:
Brain tissue-derived extracellular vesicles (bdEVs) play neurodegenerative and protective roles, including in Alzheimer’s disease (AD). Extracellular vesicles (EVs) may also leave the brain to betray the state of the CNS in the periphery. Only a few studies have profiled the proteome of bdEVs and source brain tissue. Additionally, studies focusing on bdEV cell type-specific surface markers are rare.
Objective:
We aimed to reveal the pathological mechanisms inside the brain by profiling the tissue and bdEV proteomes in AD patients. In addition, to indicate targets for capturing and molecular profiling of bdEVs in the periphery, CNS cell-specific markers were profiled on the intact bdEV surface.
Methods:
bdEVs were separated and followed by EV counting and sizing. Brain tissue and bdEVs from age-matched AD patients and controls were then proteomically profiled. Total tau (t-tau), phosphorylated tau (p-tau), and antioxidant peroxiredoxins (PRDX) 1 and 6 were measured by immunoassay in an independent bdEV separation. Neuron, microglia, astrocyte, and endothelia markers were detected on intact EVs by multiplexed ELISA.
Results:
Overall, concentration of recovered bdEVs was not affected by AD. Proteome differences between AD and control were more pronounced for bdEVs than for brain tissue. Levels of t-tau, p-tau, PRDX1, and PRDX6 were significantly elevated in AD bdEVs compared with controls. Release of certain cell-specific bdEV markers was increased in AD.
Conclusion:
Several bdEV proteins are involved in AD mechanisms and may be used for disease monitoring. The identified CNS cell markers may be useful tools for peripheral bdEV capture.
INTRODUCTION
Alzheimer’s disease (AD) [1] is a public health crisis [2, 3] that grows as the population ages, demanding new insights into pathophysiology. Hallmarks of this neurodegenerative disease include extracellular deposition of amyloid-β (Aβ—fragments of the amyloid-β protein precursor, AβPP) in the form of neuritic plaques and intracellular aggregation of hyperphosphorylated tau as neurofibrillary tangles (NFTs) [4–6]. Wide distribution and high density of neuritic plaques and NFTs correspond with greater cognitive impairment [6]. AD diagnosis is made mostly using mental status and neuropsychiatric tests, sometimes supplemented by neuroimaging. To monitor AD status in real-time and thus provide opportunities to improve the patient’s quality of life, reliable and easily accessed biomarkers are needed that reflect the state of CNS cells and tissue [7, 8].
Extracellular vesicles (EVs) comprise a diversity of lipid bilayer membrane-delimited particles that dispose of cellular toxins and mediate intercellular communication [9, 10]. EVs are thought to participate in neurodegeneration in diseases such as AD, Parkinson’s disease, and prion diseases in part by spreading misfolded proteins [11, 12]. In AD, Aβ and tau have been found in or on EVs in AD models and patients [12–16]. However, some EVs may also contribute to amyloid clearance by glia [17, 18], suggesting that EVs from healthy cells block AD pathology. Context matters, though: in certain models, reducing EV release may diminish pathology overall [19, 20].
The reported ability of EVs to participate in cell communication [21] and to cross the blood-brain barrier [22] make them seemingly promising biomarkers for AD. Various studies have found changes in protein and RNA cargo of plasma EVs during AD and mild cognitive impairment [23–26], but it is not well understood to what extent these changes in plasma EVs correspond to EVs present in brain tissues. For example, L1 cell adhesion molecule (L1CAM) has been used frequently for neuronal EV capture from biofluids samples [14, 23, 24], but we and others have noted that L1CAM is not exclusive to neurons and is also found on peripheral lymphocytes and cancer cells [27, 28]. One recent study even suggested that most circulating L1CAM is present as a proteolytic cleavage product [29]. Furthermore, EV markers of glia cells, especially of microglia, the main resident immune cell type in the brain that regulates neuroinflammation [30], have not been well developed to date. Thus, robust markers to evaluate EV cell of origin may be needed.
Brain tissue-derived EVs (bdEVs) can also be harvested from the brain tissue interstitial space [12, 16, 31–34] in a rigorous manner [10, 35–37] to allow evaluation of both EV content and cell of origin. Exploring overall bdEV contents may shed light on physiological and pathological mechanisms inside the brain and also indicate targets for biomarker development outside the brain. Furthermore, investigating cell-specific surface markers that are released on EVs in the brain can provide new “molecular handles” for capture and molecular profiling of bdEVs in the periphery, opening a window into healthy and neuropathological processes in the brain. We therefore obtained brain tissue of AD cases as well as controls. Used our modification of a rigorous method [31, 32], we separated different EV subtypes, including purified bdEVs and an intermediate bdEV separation fraction (10,000× g pellet), to assess possible protein composition changes related to AD in the brain. We (1) profiled and compared the proteomes of brain tissue, 10,000× g pellet, and bdEVs from AD patients and controls to identify AD related proteome changes; (2) verified AD pathology-related bdEV proteins by immunoassay in materials from a second, independent separation; and (3) profiled surface markers on intact bdEVs to reveal possible shifts in release of protein markers of cell of origin.
METHODS
Tissue collection, processing, and approvals
Human brain tissues were obtained from the Johns Hopkins Alzheimer’s Disease Research Center. A total of 24 AD patients and 10 non-AD controls (Table 1, Supplementary Table 1) were included in this study. AD patients were diagnosed according to Braak and CERAD criteria [6]. The clinical pathological information and possible death causes for patients were included in Supplementary Table 1 based on patients’ medical records. Following external examination and weighing of the autopsy brain, the right cerebral hemisphere was cut into coronal slabs, frozen on prechilled metal plates, and stored at –80°C. For each patient, two pieces of mixed tissue from Brodmann areas 42, 21, and 40 were obtained. EV separation was done from two pieces of mixed tissues independently: one piece was used for a first proteomics profile, while the second piece was used for proteomics data verification and EV surface marker profiling (see samples included in Supplementary Table 1).
Table 1
The human cortex tissues used in this study
| AD (n = 24) | Control (n = 10) | p | |
| Age, mean | 78.14±12.51 | 78.3±11.96 | 0.9734 |
| Sex (male, female) | 9M, 14F | 7M, 3F | |
| Postmortem interval, mean | 11.0±5.35 | 8.2±4.96 | 0.3819 |
| Brain tissue weight (/100 mg) | 3.66±1.09 | 3.65±0.73 | 0.9951 |
Separation of extracellular vesicles from brain tissue
EVs were separated from brain tissues using our published protocol [31]. Before extraction, a small (∼50 mg) piece of tissue was stored at –80°C for later protein extraction from brain homogenate (BH). After enzymatic digestion, differential centrifugation, and initial filtering (through a 0.22μm filter) of the remaining tissue, 10,000× g ultracentrifuged pellets were collected and termed “10K” as an intermediate product of EV separation. The 10K supernatant was then separated by size exclusion chromatography (SEC) and concentrated into a purer EV preparation. See our published protocol [31] for detailed methods.
Transmission electron microscopy
EV preparations (10μL) were adsorbed to glow-discharged 400 mesh ultra-thin carbon-coated grids (EMS CF400-CU-UL) for 2 min, followed by 3 quick rinses in TBS and staining in 1% uranyl acetate (UAT) with 0.05 % tylose. After being aspirated and dried, grids were immediately observed with a Philips CM120 instrument set at 80 kV, and images were captured with an AMT XR80 CCD (8 megapixel).
Nanoflow cytometry (NFCM)
Concentration and size profile of 10K and EV preparations were measured over one minute of data collection by side scatter using NFCM (Flow NanoAnalyzer, NanoFCM, Inc.). The instrument was pre-calibrated for concentration and size measurements with 200 nm polystyrene beads and a silica nanosphere cocktail (diameters of 68, 91, 113, and 151 nm), respectively. Both calibration materials were from the manufacturer, NanoFCM. Particle numbers and sizes were calculated based on the calibration curve, flow rate, and side scatter intensity.
Brain homogenate protein preparation
BHs were prepared by grinding tissue in cold PBS containing PI/PS with a handheld homogenizer (Kontes Pellet Pestle Motor) for 10 s. RIPA lysis buffer (Cell Signaling Technology 9806) was added, and the mixture was sonicated using an ultrasonic ice bath at 20 kHz for 4×20 s, with a 10-s interval between each sonication. Homogenate was rotated at 4°C for 2 h and spun 15 min at 14,000× g at 4°C. Supernatant was transferred to tubes and stored at –80°C.
Mass spectrometry
Samples were resuspended in 1 X RIPA buffer (20 mM Tris-HCl pH7.5, 150 mM NaCl, 1 mM Na2EDTA, 1 mM EGTA, 1% NP-40, 1% SDS, 2.5 mM sodium pyrophosphate) with protease and phosphatase inhibitors (1 mM β-glycerophosphate, 1 mM Na3VO4, 1μg/ml leupeptin) and incubated on ice for 5 min. The samples were sonicated for 15 min in an ice water bath before centrifugation at 14,000× g at 4°C for 10 min. The supernatant was collected and assessed for protein concentration using the micro BCA assay (Thermo Fisher Scientific 23235). 3μg of brain homogenate and 1.5μg of 10K pellet and EV samples were buffer-exchanged prior to mass spectrometry to remove detergent. Proteins were resuspended in 8M Urea, 50 mM Tris pH = 8.3. 1μL of TCEP (tris [2-carboxyethyl] phosphine hydrochloride, 200 mM solution in water) was then added to the samples and incubated for 4 h at 21°C in a ThermoMixer (Eppendorf AG). 4μL of 1M IAA (iodoacetamide in water) was then added and samples were incubated in the dark at 21°C. 800μL of 50 mM Tris (pH 8.3) and 1μg trypsin were then added to samples prior to overnight incubation at 37°C. 10μL of 10% trifluoroacetic acid (TFA) was added to each sample to acidify. Samples were cleaned using stage-tips preparations using 3 plugs of Empore polystyrenedivinylbenzene (SBD-XC) copolymer disks (Sigma Aldrich, MO, USA) for solid phase extraction. Peptides were reconstituted in 0.1% formic acid and 2% acetonitrile and loaded onto a trap column (C18 PepMap 100μm i.d.×2 cm trapping column, Thermo Fisher Scientific) at 5μL/min for 6 min using a Thermo Scientific UltiMate 3000 RSLCnano system and washed for 6 min before switching the precolumn in line with the analytical column (BEH C18, 1.7μm, 130 Å and 75μm ID×25 cm, Waters). Separation of peptides was performed at 45°C, 250 nL/min using a linear ACN gradient of buffer A (water with 0.1% formic acid, 2% ACN) and buffer B (water with 0.1% formic acid, 80% ACN), starting from 2% buffer B to 13% B in 6 min and then to 33% B over 70 min followed by 50% B at 80 min. The gradient was then increased from 50% B to 95% B for 5 min and maintained at 95% B for 1 min. The column was then equilibrated for 4 min in water with 0.1% formic acid, 2% ACN. Data were collected on a Q Exactive HF (Thermo Fisher Scientific) in Data Dependent Acquisition mode using m/z 350–1500 as MS scan range at 60,000 resolution. HCD MS/MS spectra were collected for the 7 most intense ions per MS scan at 60,000 resolution with a normalized collision energy of 28% and an isolation window of 1.4 m/z. Dynamic exclusion parameters were set as follows: exclude isotope on, duration 30 s, and peptide match preferred. Other instrument parameters for the Orbitrap were MS maximum injection time 30 ms with AGC target 3×10⁶, MSMS for a maximum injection time of 110 ms with AGT target of 1×10⁵.
Proteomics data analysis
Human protein sequences (last modified date: 16 May 2019) were downloaded from the Uniprot database and used as the database for the search engine. Common Repository of Adventitious Proteins (CRAP) was used as the potential lab contaminant database. Protein identification was performed using the proteomics search engine Andromeda built in to Maxquant V 1.16.0. Trypsin with a maximum of two missed cleavages was used as the cleavage enzyme. Carbamidomethyl of cysteine was set as fixed modification and oxidation of methionine was set as variable modification. The false discovery rate (FDR) was set to 1%. The Label Free quantification was done with match between runs using a match window of 0.7 min. Large label free quantification (LFQ) ratios were stabilized to reduce the sensitivity for outliers. For human datasets, data scaling was done using the cyclic loess method, and scaled data were visualized with a principal component analysis (PCA) plot. For differential abundance analysis, nested factorial design was set up for the analysis, where each subtype of the disease was nested within the main disease category and contrasts for the main categories were computed by averaging the subtypes.
For human datasets, data scaling was done using the cyclic loess method, and scaled data were visualized with a PCA plot. For differential abundance analysis, nested factorial design was set up for the analysis, where each subtype of the disease was nested within the main disease category and contrasts for the main categories were computed by averaging the subtypes. The protein interaction, cluster protein function prediction, and cellular component annotations was done by Protein-Protein Interaction Networks Functional Enrichment Analysis (STRING) [38]. Kyoto Encyclopedia of Genes and Genomes (KEGG) [39] was used to enrich pathway involvement of identified proteins. Statistical significance of enrichment was determined by the tools mentioned above. Only nominally significant categories (false discovery rate (FDR)<0.05) were included for analysis.
Electrochemiluminescence-linked (ECL) immunoassay
Total tau (t-tau), tau phosphorylated at threonine 231 (p-tau T231), peroxiredoxin 1 (PRDX 1), and PRDX6 were measured in BH, 10K, and EVs using an ECL-immunoassay (Meso Scale Discovery K15121D, K15231N-2) according to the manufacturer’s instructions. In brief, 10K and EV samples were diluted 1:10 while BH was diluted 1:100 in 2% blocking buffer containing 0.5% triton X-100. Samples were incubated for 1 h on the plate. After washing the plate, the SULFO-TAG anti-t-Tau, p-tau T231, PRDX1, and PRDX6 antibodies were added and incubated with the plate for 1 h, separately. After washing, MSD Read Buffer was added, and the plate was read immediately with a Quick plus SQ 120 MM instrument. Data analysis was done on MSD DISCOVERY WORKBENCH software version 2.0.
EV surface marker profiling
EV surface markers were assayed using prototype S-PLEX® ultrasensitive assays on intact EVs. Each U-PLEX® 96-well plates were coated with nine capture antibodies and one isotype IgG1 control antibody. Four different multiplexed assay panels (as listed in Supplementary Table 4) were used in this study. EV samples were diluted 20-fold and added to the plates incubated at RT with continuous shaking. EVs captured by each antibody spot were detected using MSD’s S-PLEX® ultrasensitive assay methods with a cocktail of detection antibodies targeting CD63, CD81, and CD9. Assay plates were then read with MSD GOLD™ Read buffer B on an MSD® SECTOR instrument. The ECL signal from DPBS and IgG1 isotype control were subtracted from signals on each detection antibody capture spot before further analysis.
Statistical analysis
Statistical significance of particle count, particle:protein ratio, size distribution, and protein level differences between AD and control groups were determined by two-tailed Welch’s t-test. Receiver operating characteristic (ROC) analyses were conducted in GraphPad Prism 8.1 using the method of Wilson and Brown. The correlation analysis was evaluated by Pearson’s correlation coefficient (r).
Standard protocol approvals, registrations, and patient consents
The institutional review boards of Johns Hopkins University approved the study, and informed consent was obtained from all participants or authorized representatives.
RESULTS
Following the protocol illustrated in Fig. 1A, bdEVs were separated from brain tissue of individuals with AD and controls (sample information in Table 1, Supplementary Table 1). After basic EV characterization, 10K and EV fractions were subjected to proteomics profiling, verification, and surface marker profiling.
Fig. 1
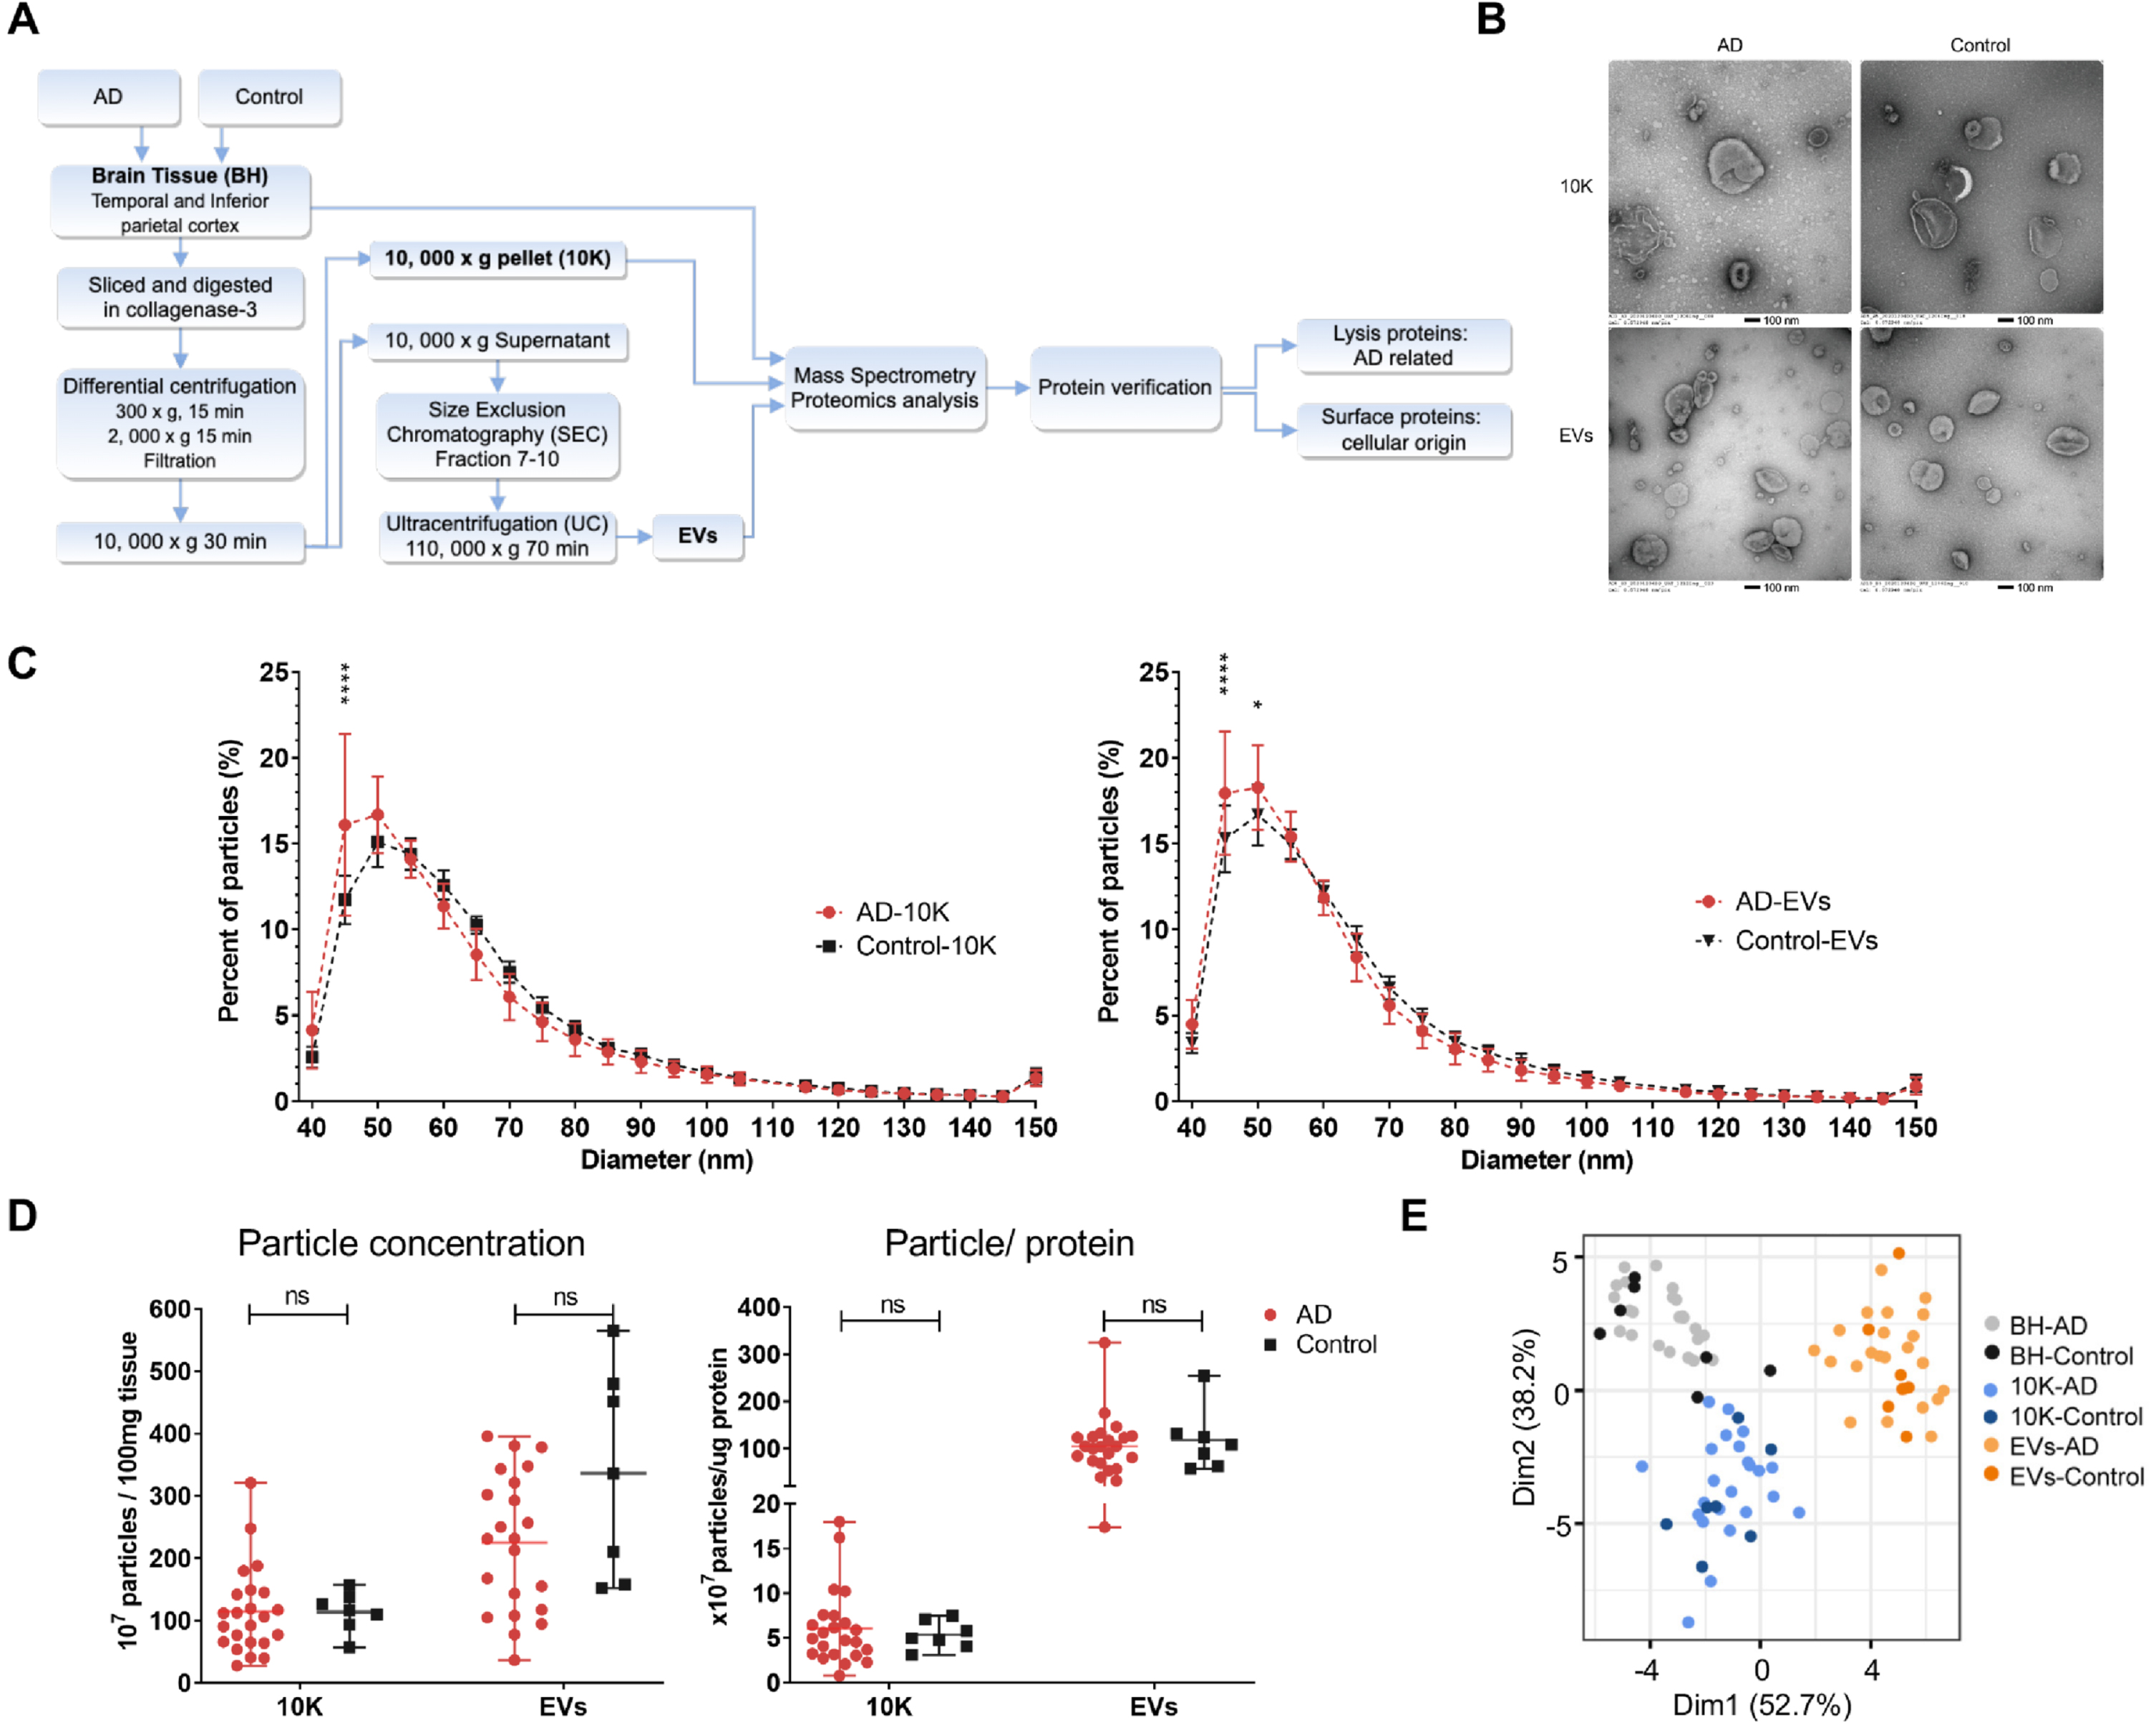
Alzheimer’s disease (AD) and control brain tissue-derived EV (bdEV) enrichment and characterization. A) Workflow for 10K and bdEV enrichment (see supporting information for detailed methods), proteomics analysis, and protein verification. Proteins from BH, 10K, and EVs were then isolated and subjected to mass spectrometry and protein verification. Intact EVs were subjected to surface protein profiling. B) 10K and bdEVs from AD and control brain tissue were visualized by negative staining transmission electron microscopy (scale bar = 100 nm). TEM is representative of ten images taken of each fraction from five independent human tissue samples. C) Size distributions of 10K and EV fractions (AD and control) were measured by NFCM and calculated as particles in a specific size bin versus total detected particles in each sample (percentage). D) Left: Particle concentrations of 10K and EV fractions of AD and control samples were measured by NFCM. Particle concentration for each group was normalized by tissue mass (per 100 mg). Right: Ratio of particles to protein (particles/μg). Protein concentrations of 10K and EV fractions were measured by BCA protein assay. E) Principal component analysis (PCA) based on EV marker expression per proteomics analysis. EV markers used for PCA: CD81, CD9, FLOT1, FLOT2, RAB1A, RAB7A, TUBA1B, TUBB4B, ANXA2, ANXA5, ANXA6, ACTN1, GAPDH. (D)-(E) data are presented as mean±SD. ns (no significant difference, p > 0.05), *p≤0.05, ****p≤0.0001, between AD and control by two-tailed Welch’s t-test.
bdEV recovery was not affected in late-stage AD
Transmission electron microscopy (TEM) revealed oval and round particles in brain-derived 10K and EV fractions from AD and CTRL patients that were consistent with EV morphology (Fig. 1B). Particle size distribution and particle concentration per 100 mg tissue input were determined by NFCM. The overall EV particle diameter detected by NFCM tended to be smaller than that detected by TEM. Consistent with TEM, fractions from AD and control groups had similar size distributions (Fig. 1C, Supplementary Figure 1A). However, a larger percentage of small particles in the approximately 45–50 nm diameter range were observed in AD samples compared with controls (Fig. 1C). No significant particle yield (Fig. 1D left) or protein yield differences (Supplementary Figure 1B) were detected between AD and control brain-derived 10K and EV fractions. Particle:protein ratio (particle number per microgram of protein) was also calculated to evaluate EV purity [42]. This ratio was similar between the AD and control groups (Fig. 1D right). However, the EV fraction had a higher particle:protein ratio compared with 10K, consistent with greater protein contamination of the 10K pellet (Fig. 1D right, Supplementary Figure 1B). EV membrane proteins CD9 and CD81 were enriched in EVs compared with BH and 10K, while intracellular markers TOM70 and histone H2A were largely not detected (n.d.) in both EV and 10K (Supplementary Figure 1C). GO ontology analyses by STRING were used to determine the cellular component enrichment of proteins recovered from 10K and EV fractions (Supplementary Figure 1D). More than 60% of proteins identified in both 10K and EVs were enriched for EV-related terms like extracellular vesicle, extracellular exosome, vesicle, extracellular region, and extracellular space. We then examined the expression levels of 13 proteins that are commonly reported to be associated with EVs [10] (CD81, CD9, FLOT1, FLOT2, RAB1A, RAB7A, TUBA1B, TUBB4B, ANXA2, ANXA5, ANXA6, ACTN1, GAPDH). These proteins were found not to be significantly differentially abundant between AD and controls (Supplementary Figure 1E). PCA also showed different EV marker expression patterns between BH, 10K, and bdEV fractions, but not between AD and controls for this group of proteins (Fig. 1E).
AD pathogenesis regulatory pathway proteins in bdEVs as revealed by proteomics
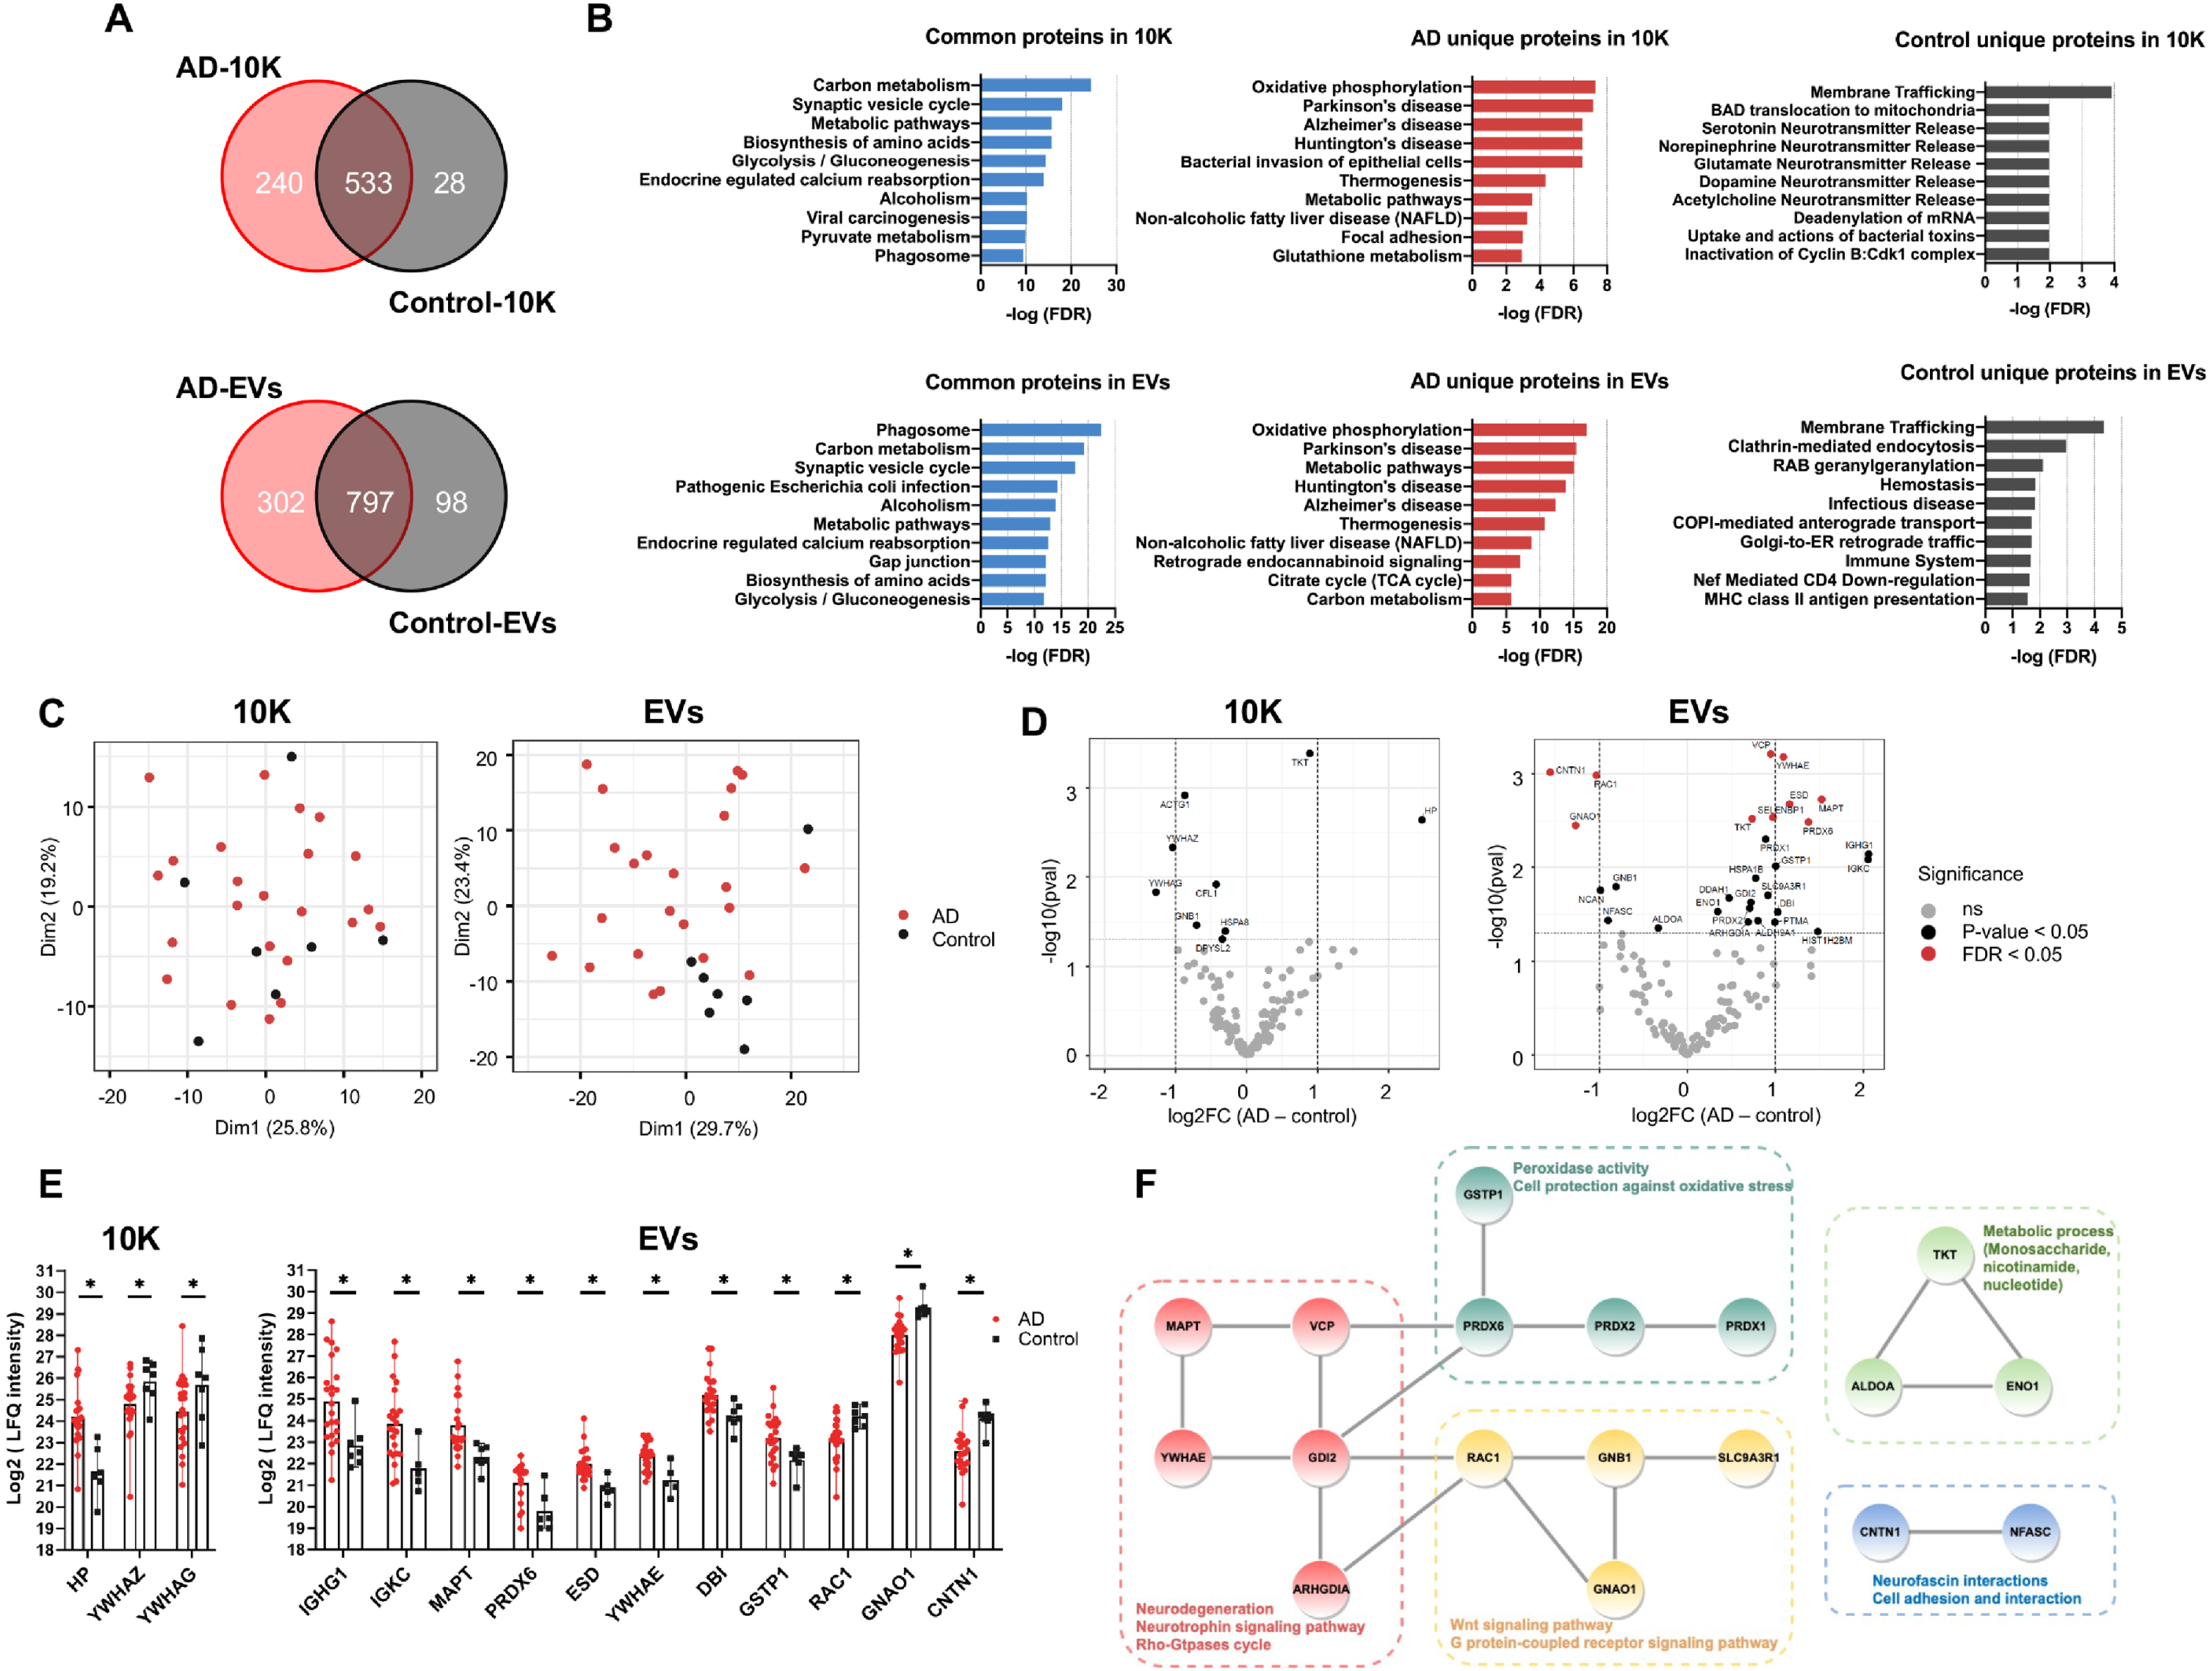
By label-free mass spectrometry, the number of proteins identified in BH, 10K, and EVs are shown in Supplementary Table 2. Most proteins were detected in both AD and control BH (73.6%), 10K (66.5%), and EVs (66.6%) (Fig. 2A, Supplementary Figure 2A). We performed an enrichment analysis of common proteins, proteins that were uniquely detected in AD, and proteins that were uniquely detected in control samples using the Kyoto Encyclopedia of Genes and Genomes (KEGG) database (Fig. 2B, Supplementary Figure 2B). We observed enrichment of pathways directly or indirectly related to neurodegenerative diseases, among which were metabolic pathways (e.g., carbon metabolism, glycolysis, and oxidative phosphorylation). Furthermore, proteins with known involvement in AD, Parkinson’s disease, and Huntington’s disease were enriched in AD-unique proteins in 10K and EVs (Fig. 2B) and common proteins in BH (Supplementary Figure 2B). PCA of the EV proteome showed a separation of AD and control groups (Fig. 2C right). In contrast, no such separation was observed for 10K (Fig. 2C left) or BH (Supplementary Figure 2C). This indicated that AD pathology most prominently affects the proteome of purified EVs in brain tissue.
Fig. 2
bdEV protein content reflects differences between AD and control brain tissues. A) Venn diagrams of all proteins identified by proteomics in 10K and EVs from AD and control patients. B) Top 10 pathways ranked by FDR-corrected p value of 10K and EV proteins according to the Kyoto Encyclopedia of Genes and Genomes (KEGG). C) Principal component analysis (PCA) based on proteome content of 10K (left) and EVs (right). D) Volcano plots showing 10K (left) and EV (right) protein log2 fold changes (Log2FC) and p values (pval) for AD versus control. Thresholds for two-fold change and p value <0.05 are indicated by dashed lines. Significant changes are indicated with different colors. Grey: non-significant (ns), black: p-value<0.05, and red: FDR <0.05. E) Expression level of proteins differentially expressed between AD and control with fold change >2 (p-value <0.05) in 10K (left) and EVs (right). Data are presented as mean log2 (LFQ intensity)±SD. F) STRING protein interaction network analysis indicated that 18 proteins (out of 31 proteins showing differential expression (p-value<0.05) between AD and control in EVs) were enriched with known high confidence (0.7 on a scale of 0-1) protein-protein interactions. Protein clusters are indicated with different colors based on predicted functions.
Differentially abundant proteins in bdEVs and BH: AD versus control
Label-free quantitation (LFQ) was used to identify up- and downregulated proteins in AD (Fig. 2D, Supplementary Figure 2D, Supplementary Table 3). More proteins were up- or downregulated in AD in the EV fraction (Fig. 2D right) than in 10K (Fig. 2D left) or BH (Supplementary Figure 2D), in line with our PCA analysis of the whole proteome. This suggested that EVs have increased potential to indicate the difference between AD and controls as compared with 10K and BH. Three proteins (10K) and 11 proteins (EVs) differed by more than two-fold (Log2 fold change >1) between AD and control (Fig. 2E). Examining proteins that were differentially abundant in EVs by Protein-Protein Interaction Networks Functional Enrichment Analysis (STRING), 18 out of 31 had high protein-to-protein interaction confidence scores (0.7 on a scale of 0-1), participating in AD-related processes such as neurodegeneration, oxidative regulation, neurotrophic signaling, and metabolic regulation (Fig. 2F).
bdEV-associated tau proteins increase in AD patients compared with controls
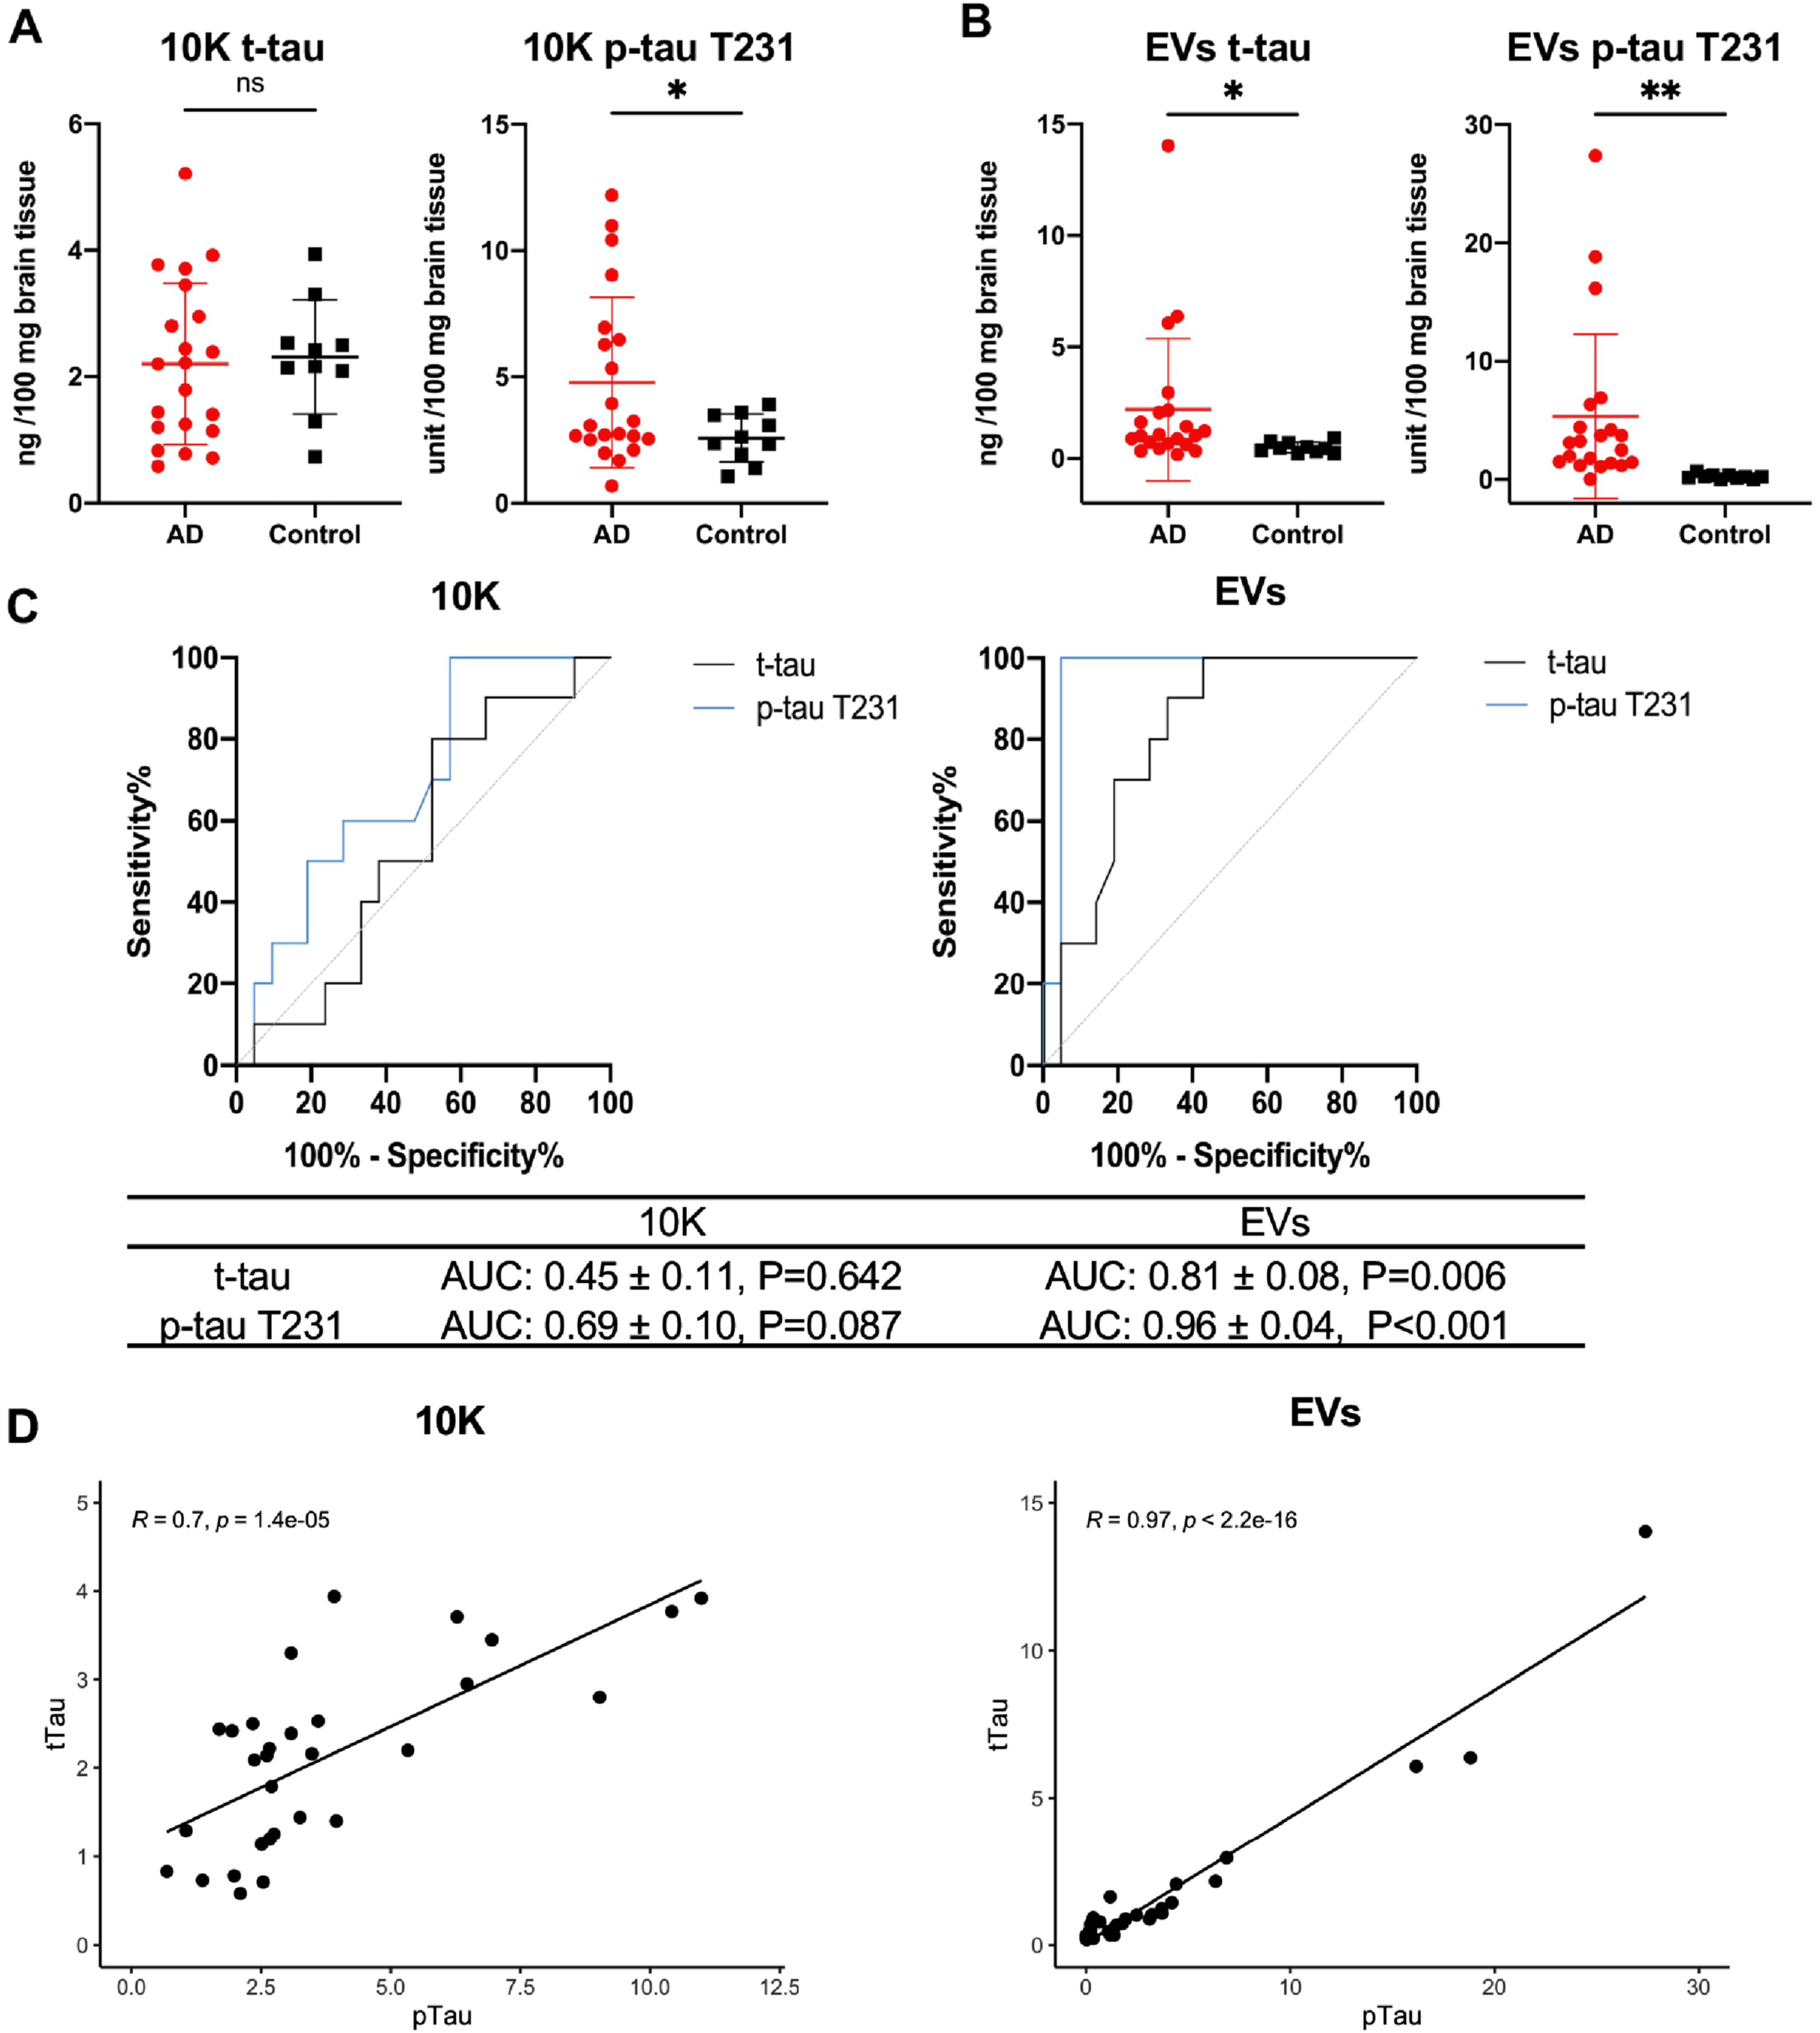
We further measured the concentration of total tau (t-tau) and tau with phosphorylated threonine 231 (p-tau T231) in independently separated BH, 10K, and EVs (patients included are shown in Supplementary Table 1). Normalized to 100 mg brain tissue input for 10K and EVs, and 100μg protein for BH, only p-tau T231 was significantly increased in AD versus controls in 10K (Fig. 3A) and BH (Supplementary Figure 3A), while both t-tau and p-tau T231 were significantly increased in bdEVs (Fig. 3B). To test the predictive power of t-tau and p-tau T231 in 10K and EVs, receiver operating characteristic (ROC) curves were generated by logistic regression (Fig. 3C). T-tau and p-tau T231 in EVs distinguished AD from control, with an area-under-curve (AUC) of 0.81±0.08 and 0.96±0.04, respectively. In contrast, neither t-tau nor p-tau T231 in 10K distinguished AD from control significantly. Next, we assessed the correlation of t-tau and p-tau T231 in 10K and EVs by Pearson’s correlation analysis (Fig. 3D). Significant correlation of t-tau and p-tau T231 levels was shown in both 10K and EVs. To assess whether changes of t-tau and p-tau T231in 10K or EVs reflected those in BH, we determined their correlations. No strong correlation was observed for t-tau levels (BH versus 10K or EVs), while p-tau T231 levels in BH and EVs were significantly correlated (Supplementary Figure 3B). This indicates that the changes of tau level in 10K and EVs were only partly determined by the levels in brain tissues.
Fig. 3
Higher total tau and phosphorylated tau at threonine 231 levels in bdEVs from AD patients compared with controls. Levels of total tau (t-tau) and phosphorylated tau at threonine 231 (p-tau T231) protein (per 100 mg brain tissue input) in 10K (A) and EVs (B) from the second batch of bdEV separation (patient information in Supplementary Table 1) measured by ECL immunoassay. Data are presented as mean±SD. ns: no significant difference (p > 0.05), *p≤0.05, **p≤0.01 by two-tailed Welch’ s t-test. C) Receiver operating characteristic (ROC) curves are presented for t-tau and p-tau T231 in 10K (left) and EVs (right) from all patients. The area under the curve (AUC) with 95% CI and p value are shown. D) Correlations of t-tau and p-tau T231 protein levels in 10K (left) and EVs (right). Linear regression lines are shown in black. Pearson correlation coefficient (R) and significance (p) are shown based on AD (n = 21) and control (n = 10) samples.
bdEV-associated peroxiredoxins increase in AD patients compared with controls
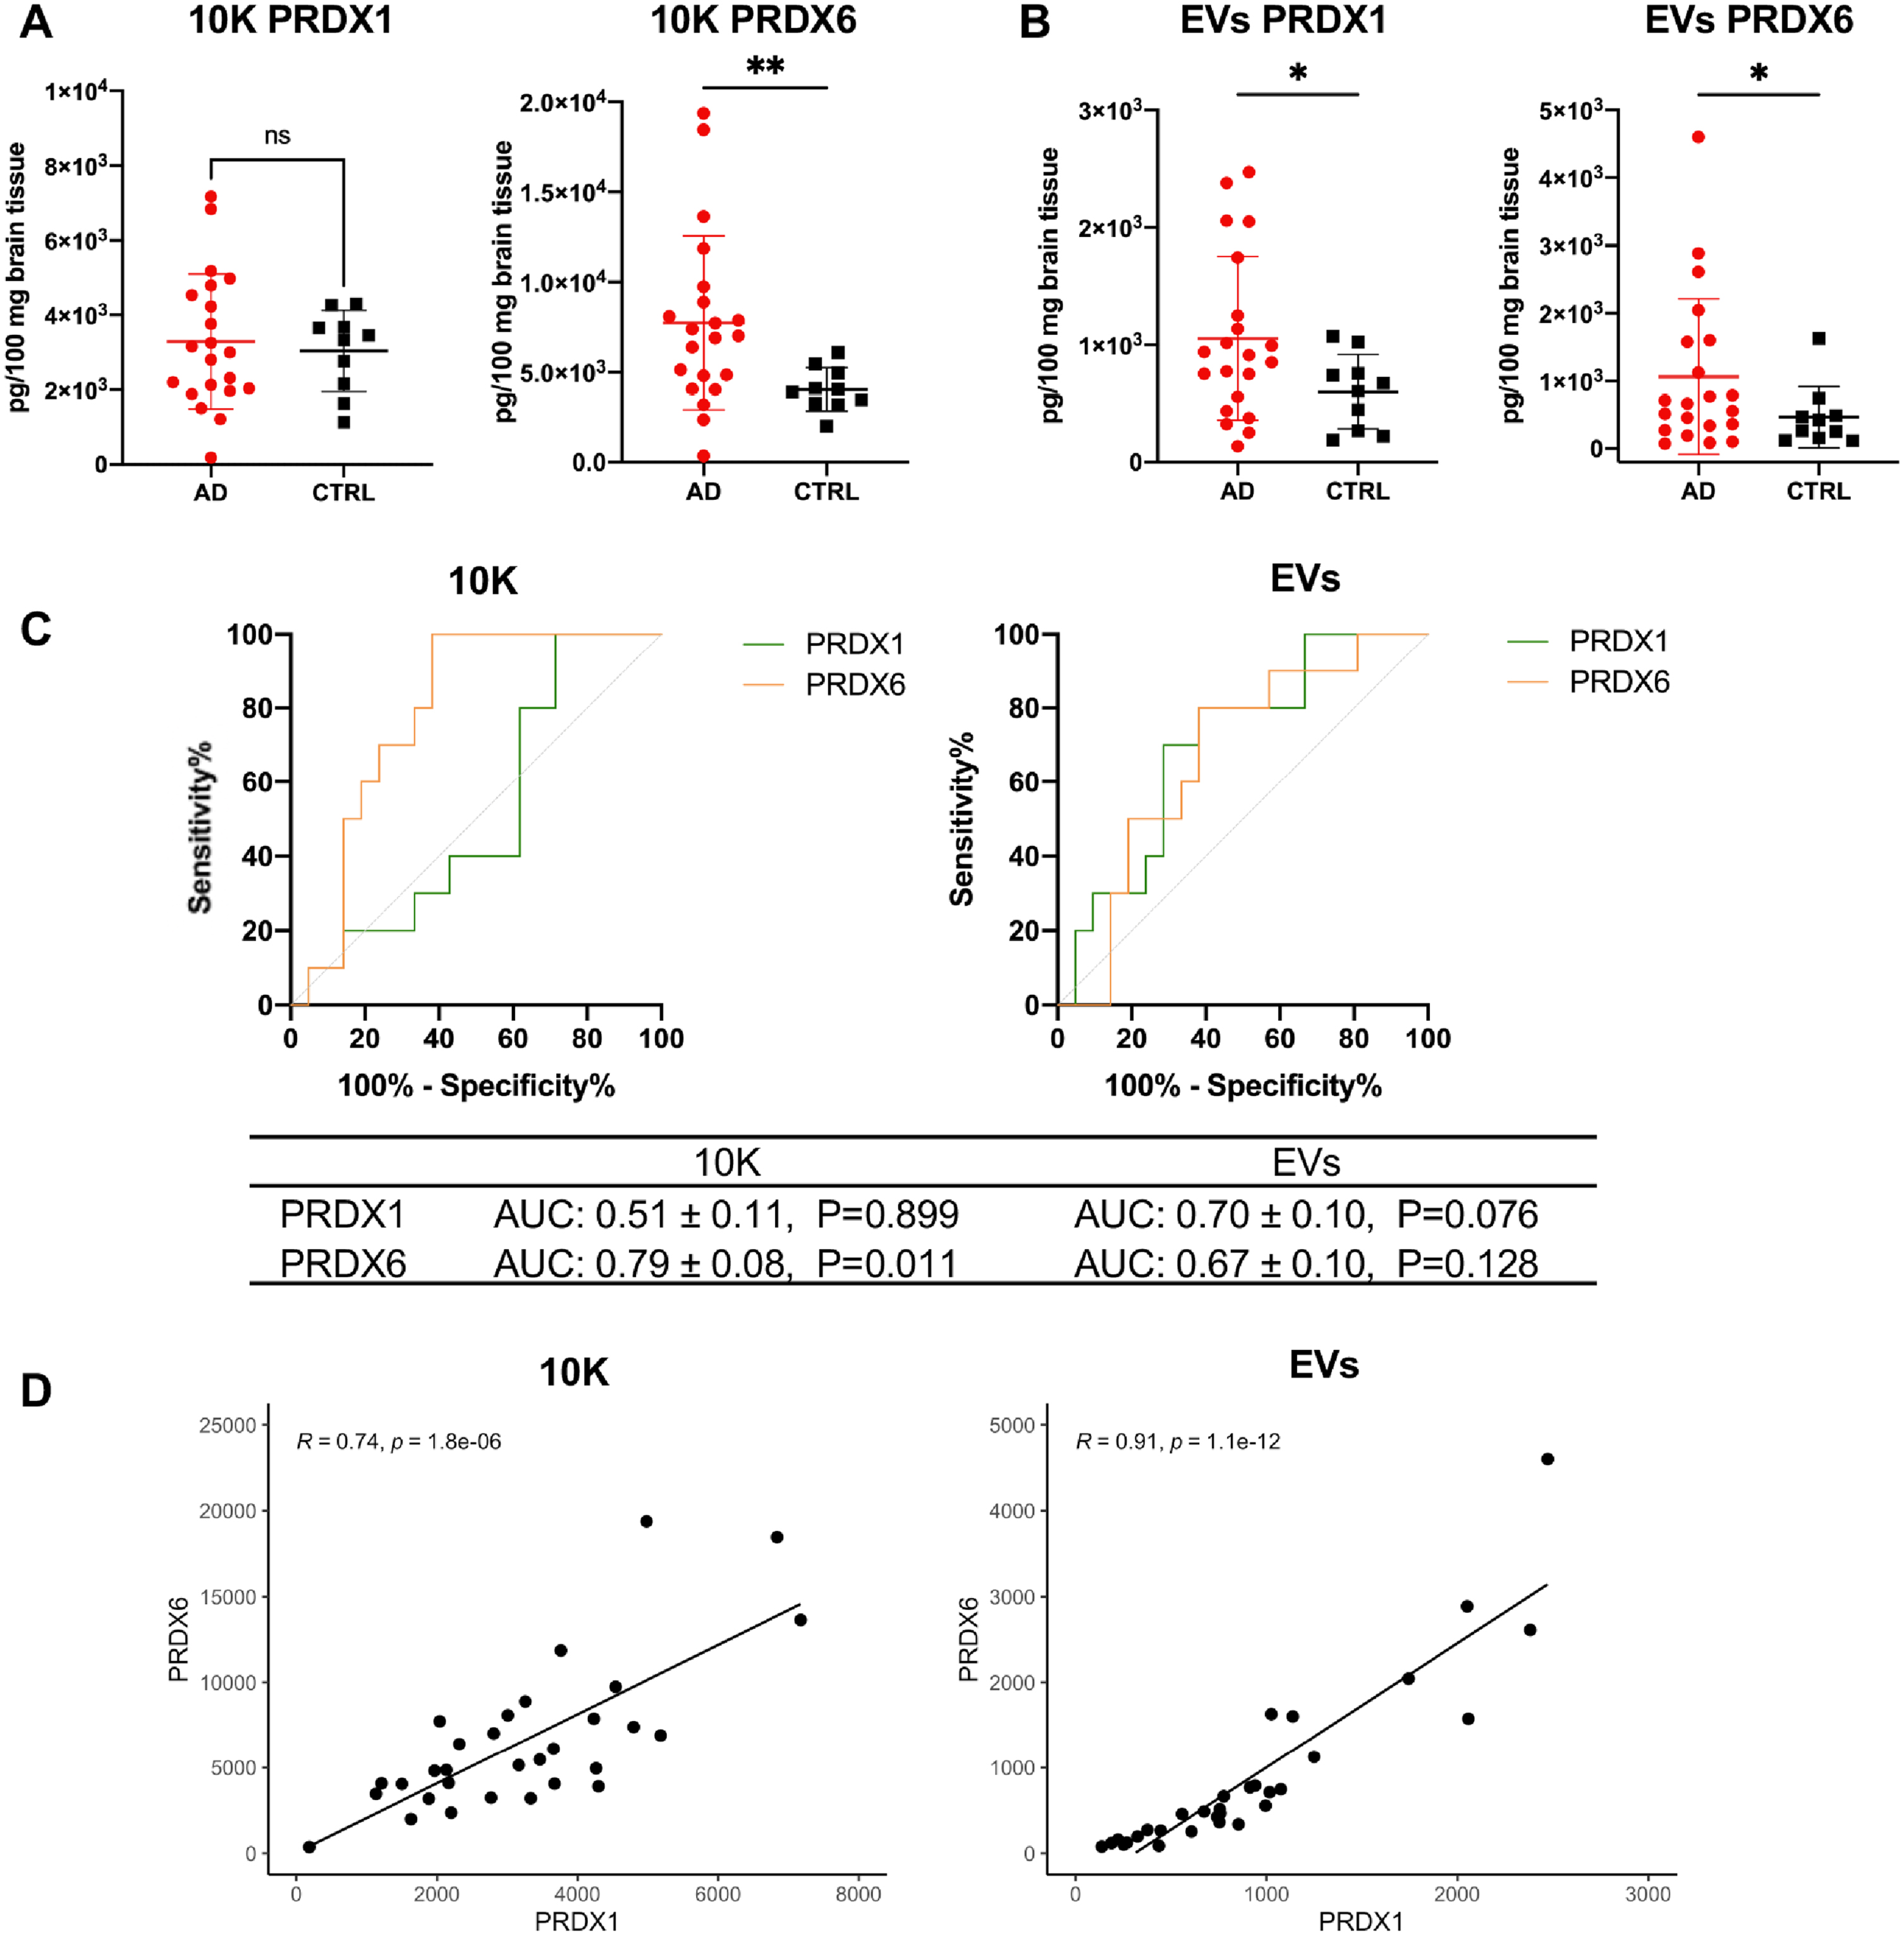
Proteomics analysis identified dysregulation of peroxiredoxins (PRDXs) in bdEVs during AD. These proteins are thought to be involved in AD by regulating peroxidase activity and thus protecting the cell against oxidative stress (Fig. 2F). We thus further measured the level of PRDX 1 and 6 in lysed BH, 10K, and EVs (patients included are shown in Supplementary Table 1). Levels of PRDX 1 and 6 were not significantly different between AD and control in BH (Supplementary Figure 4A), while PRDX6 increased in AD 10K (Fig. 4A). Notably, both PRDX1 and PRDX6 were significantly increased in AD bdEVs (Fig. 4B). However, only PRDX6 in 10K was significant to distinguish AD from control with an area-under-curve (AUC) of 0.79±0.08, while PRDX1 and 6 in EVs were insignificant to distinguish AD from controls (Fig. 4C). Similar to t-tau and p-tau T231, significantly positive correlation of PRDX1 and PRDX6 was shown in both 10K and EVs (Fig. 4D), indicating possible synergistic effects of PRDXs in AD. PRDX levels in 10K or EVs were also only partly reflected by those in BH, as no correlation was observed for PRDX6 in 10K or EVs versus BH. However, PRDX1 levels of EVs and BH were significantly correlated (Supplementary Figure 4B).
Fig. 4
Higher peroxiredoxin (PRDX) 1 and 6 levels in bdEVs from AD patients compared with controls. Levels of PRDX1 and PRDX6 protein (per 100 mg brain tissue input) in 10K (A) and EVs (B) from the second batch of bdEV separation (patient information in Supplementary Table 1) measured by ECL immunoassay. Data are presented as mean±SD. ns: no significant difference (p > 0.05), *p≤0.05, **p≤0.01 by two-tailed Welch’ s t-test. C) Receiver operating characteristic (ROC) curves are presented for PRDX1 and PRDX6 in 10K (left) and EVs (right) from all patients. The area under curve (AUC) with 95% CI and p value are shown. D) Correlations of PRDX1 and PRDX6 protein levels in 10K (left) and EVs (right). Linear regression lines are shown in black. Pearson correlation coefficient (R) and significance (p) are shown based on AD (n = 21) and control (n = 10) samples.
bdEV surface markers suggest cellular origin changes of AD bdEVs
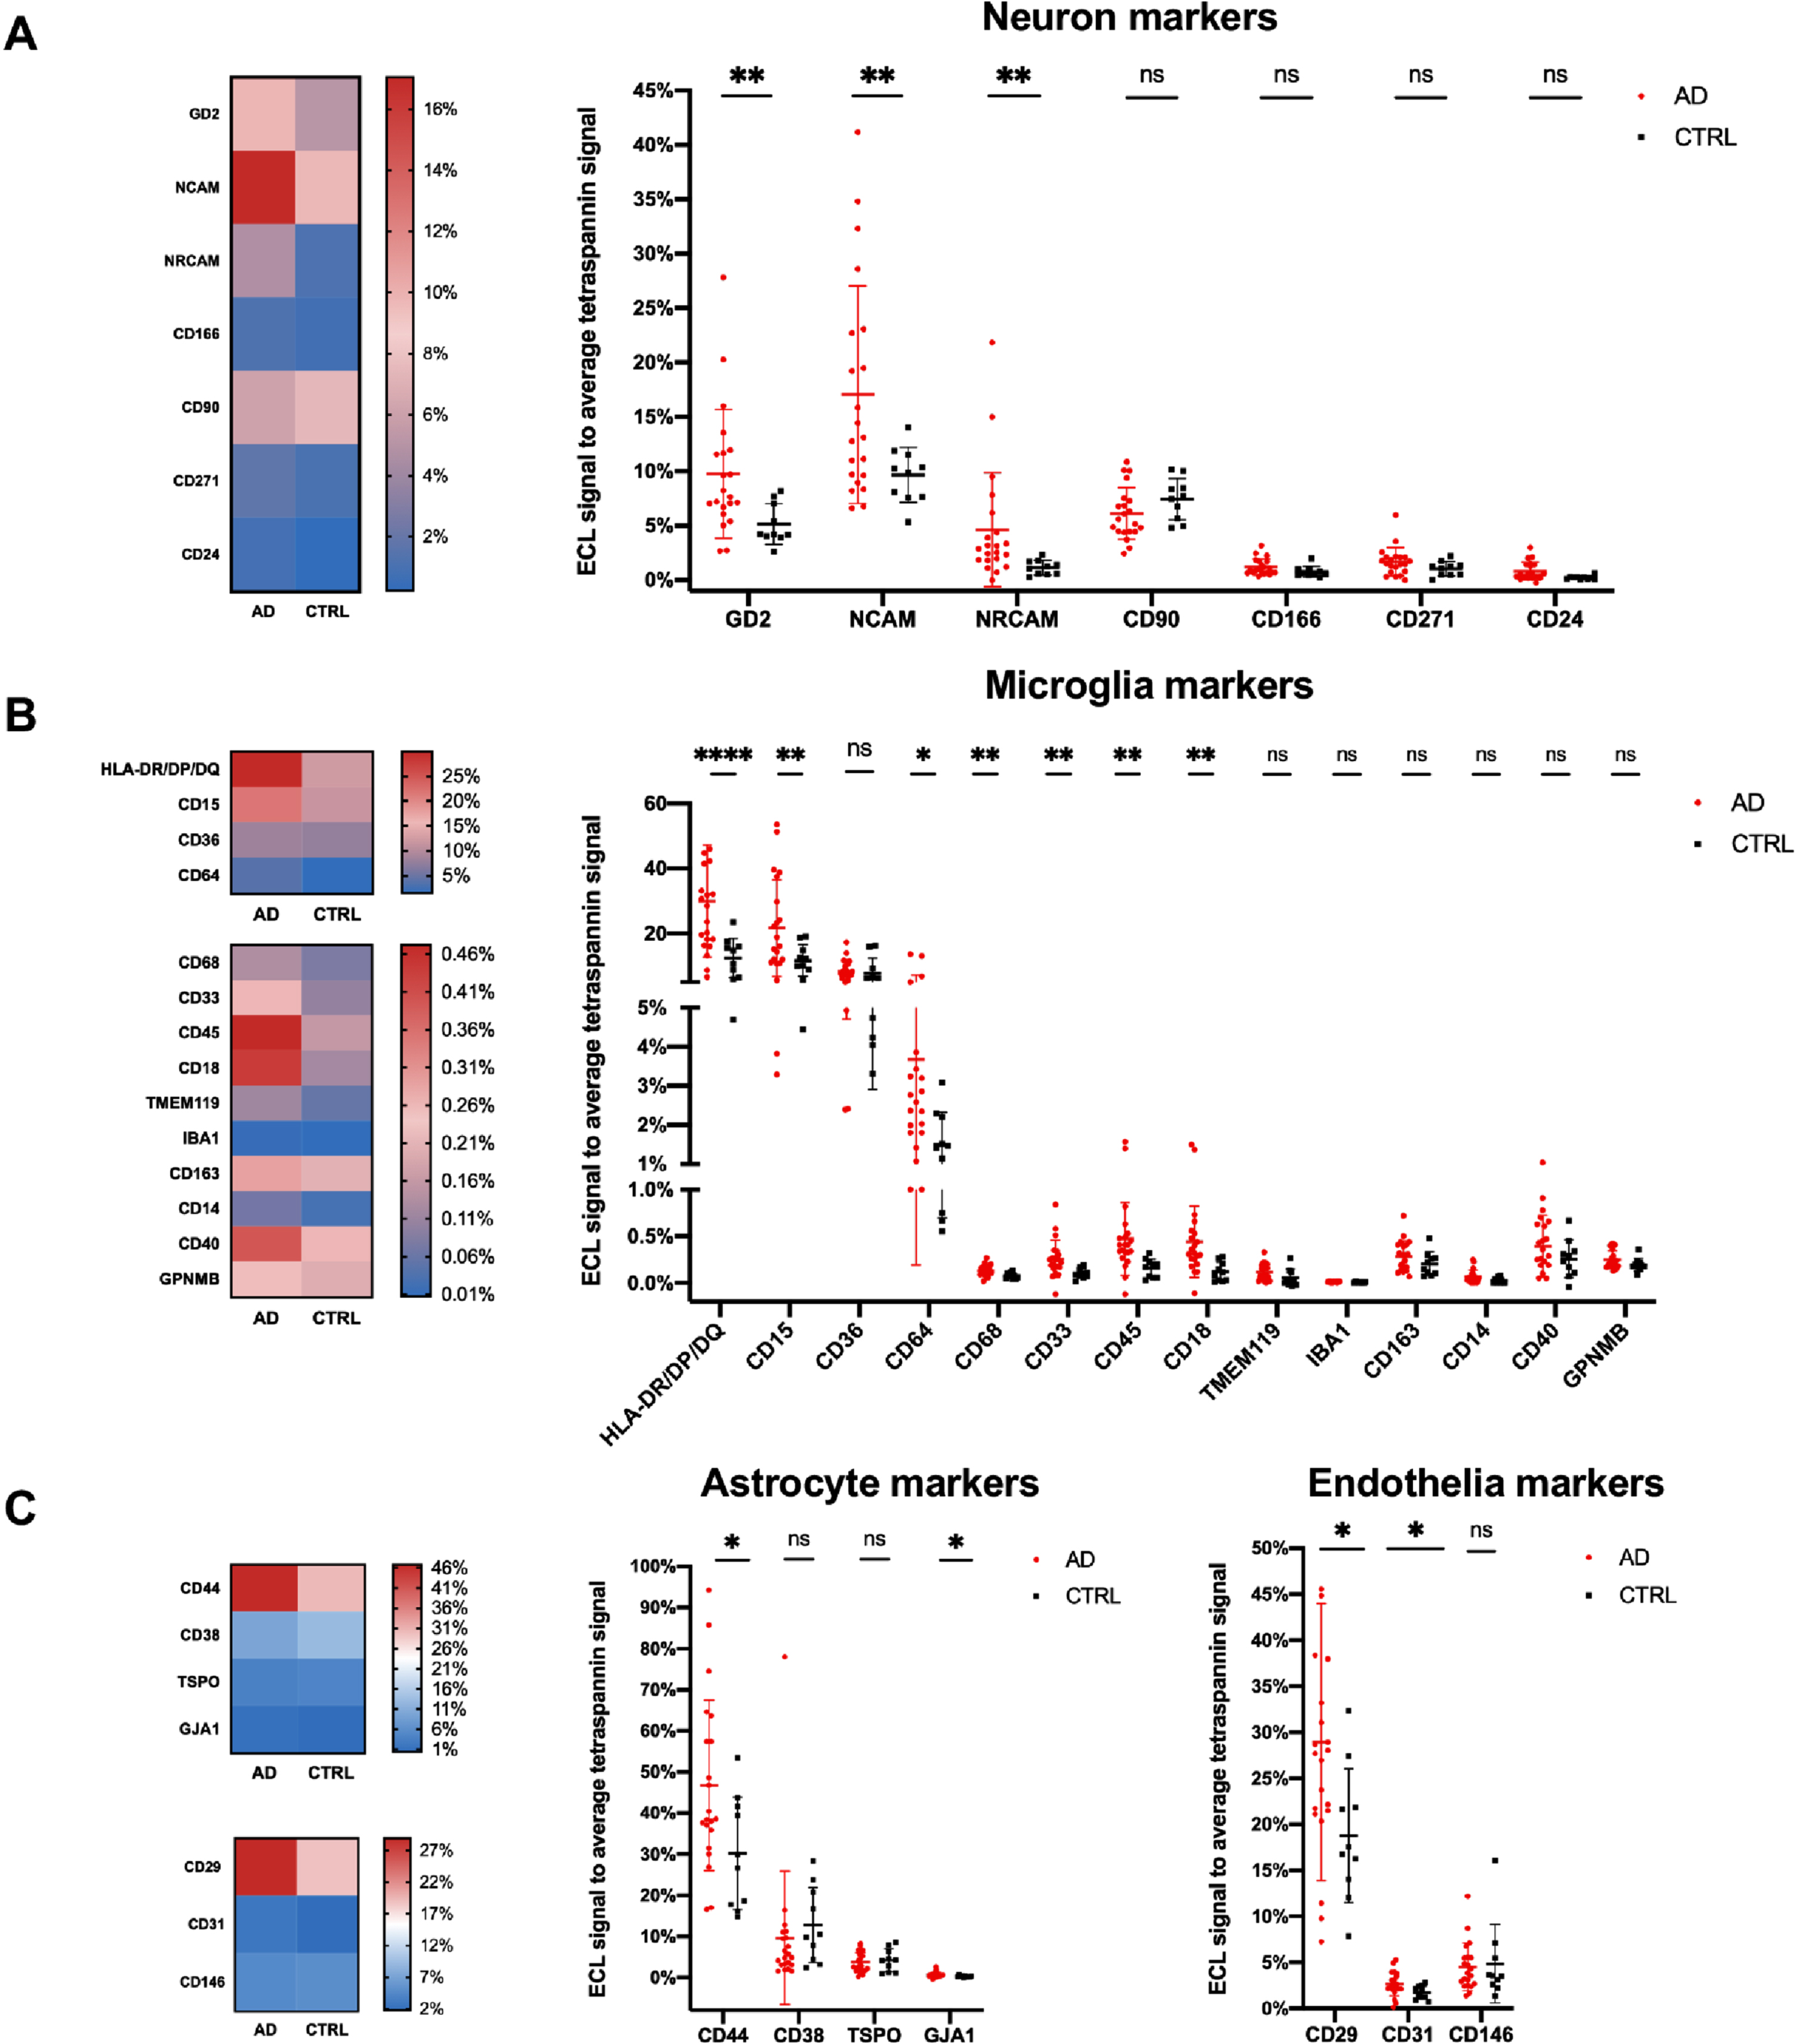
To study the relative contribution of different brain cell populations to bdEVs, enrichment of selected neuron, microglia, astrocyte, and endothelial cell markers were assessed on the intact bdEV surface by ECL immunoassay. Signal of each marker was normalized to the average signal of EV marker CD81, CD63, and CD9. No significant difference of these three EV markers was found between AD and controls (Supplementary Figure 5A). Among the markers we tested, neuron markers L1 cell adhesion molecule (L1CAM) and ganglioside G1a (GD1a), as well as microglia marker CD11a, were classified as undetected, with lower signal than the background of PBS and IgG1 isotype controls (data not shown). The top 10 CNS cell markers with a higher signal indicated bdEVs from different cell types, including astrocytes, endothelia, microglia, and neurons (Supplementary Figure 5B). Several cellular origin surface markers were increased in AD patients (Fig. 5A–C): including neuron markers ganglioside G2 (GD2), neural cell adhesion molecule (NCAM), and neuronal cell adhesion molecule (NRCAM); microglia markers HLA-DR/DP/DQ, CD15, CD64, CD68, CD33, CD45, and CD18; astrocyte markers CD44 and gap junction alpha-1 protein (GJA1); and endothelia cell markers CD29 and CD31.
Fig. 5
Cell of origin marker profile on AD and control bdEV surface. Lineage-specific markers were used as bdEV capture antibodies, while the ECL signal from each antibody spot was detected by the cocktail of tetraspannin CD63, CD81, and CD9 antibodies. The level of lineage-specific neuron (A), microglia (B), astrocyte (C), and endothelia. C) Proteins were then normalized to the average of tetraspannin capture spot signals. The heatmaps (left) showed the relative average ECL signal intensities of each markers as indicated by the colored bars in AD (n = 21) and controls (n = 10). The dot plots (right) illustrate the results from each of the patients and are presented as mean±SD. ns: no significant difference (p > 0.05), *p≤0.05, **p≤0.01, ***p≤0.001, ****p≤0.0001 by two-tailed Welch’ s t-test.
DISCUSSION
The roles of EVs in regulating CNS diseases have been inferred predominantly from studies of in vitro models and biofluid EVs, with growing but still limited studies of tissue EVs. Here, we compared the protein content of brain homogenates with those of a “10K” pelleted extracellular fraction and a purified EV fraction of control and late-stage AD brain. Proteome differences between AD and controls were most pronounced for EVs, suggesting that EV proteins may have stronger biomarker potential than other fractions. By immunoassay verification, we added evidence that both total tau and phosphorylated tau elevated in bdEVs of AD brains, and identified the increase of antioxidant proteins PRDX1 and PRDX6 in AD bdEVs. The dysregulated molecules identified in our study, especially those involved in aging and neurodegeneration pathways, may be involved in CNS disease mechanisms and constitute new biomarkers for disease monitoring after release from brain tissue into the circulation or other peripheral compartments. Furthermore, the profile of bdEV surface markers indicated that certain cells release more EVs or EVs with higher density of cell-specific surface markers. These markers of neurons, microglia, astrocytes, and endothelial cells may also be tested for bdEV capture in the periphery.
Based on our proteomics results, although BH, 10K and EVs all contain neurodegenerative diseases related proteins, EVs could serve as a better potential biomarker to indicate late-stage AD pathology as the distinct proteome between AD and controls was only revealed by EVs. We previously reported 10K as an intermediate vesicle fraction between BH and EVs which contain more intracellular contents [31], again in this study, only a few proteins significantly differed between AD and controls in 10K as well as BH, while highly purified EVs harbor more AD pathology specific information. The reason that bdEVs are more reflective of AD pathology than BH or 10K could be that bdEVs shuttle in interstitial fluid through different brain regions. Therefore, bdEVs may carry information from regions other than the source tissue, as revealed by previous imaging studies [43]. Also, in addition to passive incorporation, AD pathogenesis may also affect selective package of molecules in EVs.
Based on immunoassay verification, the dysregulation of the AD-related tau protein was confirmed in independent bdEV preparations. EVs have been widely reported to propagate misfolded tau in neurodegenerative disease [15, 44]. Consistent with other bdEV studies [15, 16, 45, 46], we found a higher level of total tau (t-tau) and phosphorylated tau (p-tau) in bdEVs of AD compared with controls, adding more support for tau propagation in brain through EVs. The antibody we used targeted the threonine 231 (T231) site of the middle tau protein region. The dysregulation of P-tau T231 we showed in the source brain tissues and bdEVs further supports its biomarker potential, as previously identified in preclinical AD plasma and CSF samples for AD [47]. Although the change of p-tau T231 in bdEVs reflected changes in BH, as shown by correlation analysis, our study detected t-tau differences only in EVs but not in 10K or BH. This observation suggests that release of t-tau and p-tau in EVs is a dynamic process that may depend on different turnover rates of tau isoforms [48] or tau posttranslational modifications [45]. While tau and p-tau in EVs are well characterized, mechanisms of disease propagation are still incompletely understood. Further study is thus needed to determine if EVs act as a protective factor to clear tau from the CNS to the periphery, as a neurotoxic factor by spreading tau between neurons and glia, or perhaps in different ways in some as-yet incompletely understood balance between these two poles.
We also revealed upregulation of bdEV PRDX1 and PRDX6 in AD. PRDXs are antioxidant enzymes implicated in the progression of neurodegenerative diseases by regulating oxidative stress. We and our collaborators previously found that PRDXs were highly abundant in EVs derived from both human induced pluripotent stem cells and mesenchymal stem cells, and that these proteins help to reduce oxidative stress in cells with induced senescence [49]. In AD brain tissues, the change of PRDX levels is inconsistently reported and likely region-dependent [50]: PRDXs were reported elevated in some brain regions of AD patients in one study [51], but were not different in another study [52]. The expression of PRDXs is also cell type-specific in the CNS [50], as previous studies showed that PRDXs were detected mostly in astrocytes. In our study, we observed no significant change of PRDXs in BH samples between AD and controls, whereas loading into bdEVs was apparently different. Considering that bdEVs hail from different cell types, astrocytes may contribute to the elevation of PRDX1 and 6 in the bdEV pool. Although regulatory roles of PRDX family members were shown in AD [53–55], and the association of PRDX with EVs [56, 57] has been reported, we reveal here the differential loading of PRDX into bdEVs. Further exploring the cell source of PRDXs in bdEVs in tissue or in the periphery may allow even stronger conclusions about biomarker potential.
bdEV protein clusters are actively involved in CNS disease regulation pathways, including mitochondrial and metabolic pathways and neurogenesis/differentiation pathways (Fig. 2F). For example, the ATPase enzyme member valosin-containing protein/p97 (VCP) is thought to bring about mitophagy impairment and mitochondrial dysfunction in AD [58, 59] and was upregulated in AD bdEVs. Impairment of pathways involved in neurogenesis/differentiation are thought to be early clinical events in aging and AD development [60, 61]. Our study showed dysregulation of neurogenesis-related protein 14-3-3 isoforms ɛ (YWHAE), ζ (YWHAZ), and γ (YWHAG) in the 10K and EV fractions. 14-3-3 proteins indirectly regulate activation of Rho family GTPases [62]. Interestingly, several proteins in the Rho-GTPase cycle were also dysregulated in AD bdEVs, including Ras-related C3 botulinum toxin substrate 1/3 (RAC1/3), and Rho GDP-dissociation inhibitors 1 and 2 (ARHGDIA, GDI2). We also found that contactin-1 (CNTN1) and neurofascin (NFASC), two proteins involved in axonal guidance and neuron projection development [63, 64], were downregulated in AD bdEVs, which may reflect neurodegeneration.
EVs derived from specific cellular origins in brain may have enhanced potential as biomarkers. However, isolation of pure, highly cell-specific bdEVs from blood is challenging because of interfere of peripherally derived EVs and non-EV components (e.g., lipoproteins). Also, most of previous studies investigated blood-isolated neuron-derived bdEVs [14, 23, 24], while other sources have been less investigated. In the current study, we detected a panel of potential CNS cell markers on intact bdEVs while largely excluding contaminants. We identified multiple cell-specific markers on bdEVs, with astrocyte/glia marker CD44 as the most abundant. Of course, few markers are exclusively specific to a single cell type; CD44, for example, is particularly abundant on astrocytes [65] but can also be found on other glia [66]. Markers with potential cellular overlap are shown in the Supplementary Table 4. Possibly, a panel of antibodies might be used to increase both specificity and sensitivity for biomarker approaches using cell-specific EVs.
As a mixture of EVs from diverse cells, both biogenesis and cargo loading of specific EV subtypes may be affected by AD. As in several previous studies of human cortex bdEVs [67, 68], we did not observe differences in overall EV recovery. However, bdEVs of specific cells may experience different release patterns. For example, while MHC class I bdEVs were reported to be upregulated in preclinical AD patients compared with controls and late-stage AD in previous study [68], here we found increased MHC class II- HLA-DR/DP/DQ on the bdEV surface in AD patients. As a microglial marker [69, 70], the elevation of HLA-DR/DP/DQ on bdEVs may indicate more EVs or EVs with surface changes being released by microglia in response to immune activation and tissue damage in AD. Further study is in need to evaluate the function of bdEVs from specific cell types after separating them based on the surface markers we identified.
In summary, our study examined both the lysed bdEV proteome and selected surface markers on intact bdEVs from AD patients. Our results identified the bdEV protein composition varied with AD pathology. These bdEV-transported molecules may play critical roles in modulating AD progression and thus have potential for exploitation as biomarkers and therapeutic targets. The cell surface markers we identified on bdEVs could be further tested in peripheral samples for brain-origin EV capture.
ACKNOWLEDGMENTS
VM and KWW gratefully acknowledge support from the Richman Family Precision Medicine Center of Excellence in Alzheimer’s Disease including helpful comments and advice from founder and director Constantine Lyketsos. Thanks to: Kenneth Pienta, Johns Hopkins University School of Medicine, for access to the Nanoflow FCM (NFCM) platform; Mitchell Science Writing for manuscript editing and citation formatting; and the La Trobe University Comprehensive Proteomics Platform. We also thank members of the Witwer and Retrovirus Laboratories, Johns Hopkins University School of Medicine, and various members of the International Society for Extracellular Vesicles for valuable discussions and support.
This work was supported in part by grants from the US National Institutes of Health: AI144997 (to KWW, with support for TAPD), MH118164 and AG057430 (to VM and KWW), UG3 and UH3 CA241694 (to KWW), UH2MH118167 (to DAR), supported by the NIH Common Fund, through the Office of Strategic Coordination/Office of the NIH Director, and by the National Health and Medical Research Council of Australia (GNT1132604 to AFH). JHU Alzheimer’s Disease Research Centers NIH P30 AG 066507 and BIOCARD NIH U19AG033655.
Authors’ disclosures available online (https://www.j-alz.com/manuscript-disclosures/22-0322r2).
SUPPLEMENTARY MATERIAL
[1] The supplementary material is available in the electronic version of this article: https://dx.doi.org/10.3233/JAD-220322.
REFERENCES
[1] | ((1987) ) About a peculiar disease of the cerebral cortex. By Alois Alzheimer, 1907 (Translated by L. Jarvik and H. Greenson). Alzheimer Dis Assoc Disord 1: , 3–8. |
[2] | Alzheimer’s Association ((2016) ) 2016 Alzheimer’s disease facts and figures. Alzheimers Dement 12: , 459–509. |
[3] | Reitz C ((2016) ) Toward precision medicine in Alzheimer’s disease. Ann Transl Med 4: , 107–107. |
[4] | Yankner BA ((1996) ) Mechanisms of neuronal degeneration in Alzheimer’s disease. Neuron 16: , 921–932. |
[5] | Cutler RG , Haughey NJ , Tammara A , McArthur JC , Nath A , Reid R , Vargas DL , Pardo CA , Mattson MP ((2004) ) Dysregulation of sphingolipid and sterol metabolism by ApoE4 in HIV dementia. Neurology 63: , 626–630. |
[6] | Murayama S , Saito Y ((2004) ) Neuropathological diagnostic criteria for Alzheimer’s disease. Neuropathology 24: , 254–260. |
[7] | Reitz C ((2016) ) Toward precision medicine in Alzheimer’s disease. Ann Transl Med 4: , 107. |
[8] | Blennow K , Zetterberg H ((2018) ) Biomarkers for Alzheimer’s disease: Current status and prospects for the future. J Intern Med 284: , 643–663. |
[9] | Witwer KW , Théry C ((2019) ) Extracellular vesicles or exosomes? On primacy, precision, and popularity influencing a choice of nomenclature. J Extracell Vesicles 8: , 1648167. |
[10] | Théry C , Witwer KW , Aikawa E , Alcaraz MJ , Anderson JD , Andriantsitohaina R , Antoniou A , Arab T , Archer F , Atkin-Smith GK , et al. ((2018) ) Minimal information for studies of extracellular vesicles 2018 (MISEV2018): A position statement of the International Society for Extracellular Vesicles and update of the MISEV2014 guidelines. J Extracell Vesicles 7: , 1535750. |
[11] | Rajendran L , Bali J , Barr MM , Court FA , Kramer-Albers E-M , Picou F , Raposo G , van der Vos KE , van Niel G , Wang J , Breakefield XO ((2014) ) Emerging roles of extracellular vesicles in the nervous system. J Neurosci 34: , 15482–15489. |
[12] | Perez-Gonzalez R , Gauthier SA , Kumar A , Levy E ((2012) ) The exosome secretory pathway transports amyloid precursor protein carboxyl-terminal fragments from the cell into the brain extracellular space. J Biol Chem 287: , 43108–43115. |
[13] | Rajendran L , Honsho M , Zahn TR , Keller P , Geiger KD , Verkade P , Simons K ((2006) ) Alzheimer’s disease beta-amyloid peptides are released in association with exosomes. Proc Natl Acad Sci U S A 103: , 11172–11177. |
[14] | Fiandaca MS , Kapogiannis D , Mapstone M , Boxer A , Eitan E , Schwartz JB , Abner EL , Petersen RC , Federoff HJ , Miller BL , Goetzl EJ ((2015) ) Identification of preclinicalAlzheimer’s disease by a profile of pathogenic proteins in neurallyderived blood exosomes: A case-control study. Alzheimers Dement 11: , 600–607.e11. |
[15] | Baker S , Polanco JC , Götz JJ ((2016) ) Extracellular vesicles containing P301L mutant tau accelerate pathological tau phosphorylation and oligomer formation but do not seed mature neurofibrillary tangles in ALZ17 mice. J Alzheimers Dis 54: , 1207–1217. |
[16] | Polanco JC , Scicluna BJ , Hill AF , Götz J ((2016) ) Extracellular vesicles isolated from the brains of rTg4510 mice seed tau protein aggregation in a threshold-dependent manner. J Biol Chem 291: , 12445–12466. |
[17] | Yuyama K , Sun H , Mitsutake S , Igarashi Y ((2012) ) Sphingolipid-modulated exosome secretion promotes clearance of amyloid-β by microglia. J Biol Chem 287: , 10977–10989. |
[18] | Shephard F , Greville-Heygate O , Marsh O , Anderson S , Chakrabarti L ((2014) ) A mitochondrial location for haemoglobins-dynamic distribution in ageing and Parkinson’s disease. Mitochondrion 14: , 64–72. |
[19] | Dinkins MB , Dasgupta S , Wang G , Zhu G , Bieberich E ((2014) ) Exosomereduction in vivo is associated with lower amyloid plaque load inthe 5XFAD mouse model of Alzheimer’s disease.. Neurobiol Aging 35: , 1792–1800. |
[20] | Dinkins MB , Enasko J , Hernandez C , Wang G , Kong J , Helwa I , Liu Y , Terry AV , Bieberich E ((2016) ) Neutral sphingomyelinase-2 deficiency ameliorates Alzheimer’s disease pathology and improves cognition in the 5XFAD mouse. J Neurosci 36: , 8653–8667. |
[21] | Tkach M , Théry C ((2016) ) Communication by extracellular vesicles: Where we are and where we need to go. Cell 164: , 1226–1232. |
[22] | Saint-Pol J , Gosselet F , Duban-Deweer S , Pottiez G , Karamanos Y ((2020) ) Targeting and crossing the blood-brain barrier with extracellular vesicles. Cells 9: , 851. |
[23] | Kapogiannis D , Boxer A , Schwartz JB , Abner EL , Biragyn A , Masharani U , Frassetto L , Petersen RC , Miller BL , Goetzl EJ ((2015) ) Dysfunctionally phosphorylated type 1 insulin receptor substrate in neural-derived blood exosomes of preclinical Alzheimer’s disease. FASEB J 29: , 589–596. |
[24] | Goetzl EJ , Boxer A , Schwartz JB , Abner EL , Petersen RC , Miller BL , Kapogiannis D ((2015) ) Altered lysosomal proteins in neural-derived plasma exosomes in preclinical Alzheimer disease. Neurology 85: , 40–47. |
[25] | Gámez-Valero A , Campdelacreu J , Vilas D , Ispierto L , Reñé R , Álvarez R , Armengol MP , Borràs FE , Beyer K ((2019) ) Exploratory study on microRNA profiles from plasma-derived extracellular vesicles in Alzheimer’s disease and dementia with Lewy bodies. Transl Neurodegener 8: , 31. |
[26] | Jia L , Zhu M , Kong C , Pang Y , Zhang H , Qiu Q , Wei C , Tang Y , Wang Q , Li Y , Li T , Li F , Wang Q , Li Y , Wei Y , Jia J ((2021) ) Blood neuro-exosomal synaptic proteins predict Alzheimer’s disease at the asymptomatic stage. Alzheimers Dement 17: , 49–60. |
[27] | Ebeling O , Duczmal A , Aigner S , Geiger C , Schöllhammer S , Kemshead JT , Möller P , Schwartz-Albiez R , Altevogt P ((1996) ) L1 adhesion molecule on human lymphocytes and monocytes: Expression and involvement in binding to αvβ3 integrin. Eur J Immunol 26: , 2508–2516. |
[28] | Samatov TR , Wicklein D , Tonevitsky AG ((2016) ) L1CAM: Cell adhesion and more. Prog Histochem Cytochem 51: , 25–32. |
[29] | Norman M , Ter-Ovanesyan D , Trieu W , Lazarovits R , Kowal EJK , Lee JH , Chen-Plotkin AS , Regev A , Church GM , Walt DR (2020) L1CAM is not associated with extracellular vesicles in human cerebrospinal fluid or plasma. bioRxiv, 2020.08.12.247833. |
[30] | Voet S , Prinz M , van Loo G ((2019) ) Microglia in central nervous system inflammation and multiple sclerosis pathology. Trends Mol Med 25: , 112–123. |
[31] | Huang Y , Cheng L , Turchinovich A , Mahairaki V , Troncoso JC , Pletniková O , Haughey NJ , Vella LJ , Hill AF , Zheng L , Witwer KW ((2020) ) Influence of species and processing parameters on recovery and content of brain tissue-derived extracellular vesicles. J Extracell Vesicles 9: , 1785746. |
[32] | Vella LJ , Scicluna BJ , Cheng L , Bawden EG , Masters CL , Ang C-S , Willamson N , McLean C , Barnham KJ , Hill AF ((2017) ) A rigorous method to enrich for exosomes from brain tissue. J Extracell Vesicles 6: , 1348885. |
[33] | Yelamanchili SV , Lamberty BG , Rennard DA , Morsey BM , Hochfelder CG , Meays BM , Levy E , Fox HS ((2015) ) MiR-21 in extracellular vesicles leads to neurotoxicity via TLR7 signaling in SIV neurological disease. PLoS Pathog 11: , e1005032. |
[34] | Crescitelli R , Lässer C , Lötvall J ((2021) ) Isolation and characterization of extracellular vesicle subpopulations from tissues. Nat Protoc 16: , 1548–1580. |
[35] | Lotvall J , Hill AF , Hochberg F , Buzas EI , Di Vizio D , Gardiner C , Gho YS , Kurochkin I V , Mathivanan S , Quesenberry P , Sahoo S , Tahara H , Wauben MH , Witwer KW , Thery C ((2014) ) Minimal experimental requirements for definition of extracellular vesicles and their functions: A position statement from the International Society for Extracellular Vesicles. J Extracell Vesicles 3: , 26913. |
[36] | Witwer KW , Soekmadji C , Hill AF , Wauben MH , Buzas EI , Di Vizio D , Falcon-Perez JM , Gardiner C , Hochberg F , Kurochkin I V , Lötvall J , Mathivanan S , Nieuwland R , Sahoo S , Tahara H , Torrecilhas AC , Weaver AM , Yin H , Zheng L , Gho YS , Quesenberry P , Théry C ((2017) ) Updating the MISEV minimal requirements for extracellular vesicle studies: Building bridges to reproducibility. J Extracell Vesicles 6: , 1396823. |
[37] | Crescitelli R , Lässer C , Jang SC , Cvjetkovic A , Malmhäll C , Karimi N , Höög JL , Johansson I , Fuchs J , Thorsell A , Gho YS , Olofsson Bagge R , Lötvall J ((2020) ) Subpopulations of extracellular vesicles from human metastatic melanoma tissue identified by quantitative proteomics after optimized isolation. J Extracell Vesicles 9: , 1722433. |
[38] | Szklarczyk D , Gable AL , Lyon D , Junge A , Wyder S , Huerta-Cepas J , Simonovic M , Doncheva NT , Morris JH , Bork P , Jensen LJ , Von Mering C ((2019) ) STRING v11: Protein-protein association networks with increased coverage, supporting functional discovery in genome-wide experimental datasets. , D607-D. Nucleic Acids Res 47: , 613. |
[39] | Kanehisa M , Goto S ((2000) ) KEGG: Kyoto Encyclopedia of Genes and Genomes. Nucleic Acids Res 28: , 27–30. |
[40] | Van Deun J , Mestdagh P , Agostinis P , Akay Ö , Anand S , Anckaert J , Martinez ZA , Baetens T , Beghein E , Bertier L , Berx G , Boere J , Boukouris S , Bremer M , Buschmann D , Byrd JB , Casert C , Cheng L , Cmoch A , Daveloose D , De Smedt E , Demirsoy S , Depoorter V , Dhondt B , Driedonks TAP , Dudek A , Elsharawy A , Floris I , Foers AD , Gärtner K , Garg AD , Geeurickx E , Gettemans J , Ghazavi F , Giebel B , Kormelink TG , Hancock G , Helsmoortel H , Hill AF , Hyenne V , Kalra H , Kim D , Kowal J , Kraemer S , Leidinger P , Leonelli C , Liang Y , Lippens L , Liu S , Lo Cicero A , Martin S , Mathivanan S , Mathiyalagan P , Matusek T , Milani G , Monguió-Tortajada M , Mus LM , Muth DC , Németh A , Nolte-’T Hoen ENM , O’Driscoll L , Palmulli R , Pfaffl MW , Primdal-Bengtson B , Romano E , Rousseau Q , Sahoo S , Sampaio N , Samuel M , Scicluna B , Soen B , Steels A , Swinnen JV , Takatalo M , Thaminy S , Théry C , Tulkens J , Van Audenhove I , Van Der Grein S , Van Goethem A , Van Herwijnen MJ , Van Niel G , Van Roy N , Van Vliet AR , Vandamme N , Vanhauwaert S , Vergauwen G , Verweij F , Wallaert A , Wauben M , Witwer KW , Zonneveld MI , De Wever O , Vandesompele J , Hendrix A ((2017) ) EV-TRACK: Transparent reporting and centralizing knowledge in extracellular vesicle research. Nat Methods 14: , 228–232. |
[41] | Welsh JA , Van Der Pol E , Arkesteijn GJA , Bremer M , Brisson A , Coumans F , Dignat-George F , Duggan E , Ghiran I , Giebel B , Görgens A , Hendrix A , Lacroix R , Lannigan J , Libregts SFWM , Lozano-Andrés E , Morales-Kastresana A , Robert S , De Rond L , Tertel T , Tigges J , De Wever O , Yan X , Nieuwland R , Wauben MHM , Nolan JP , Jones JC ((2020) ) MIFlowCyt-EV: A framework for standardized reporting of extracellular vesicle flow cytometry experiments. J Extracell Vesicles 9: , 1713526. |
[42] | Webber J , Clayton A ((2013) ) How pure are your vesicles? J Extracell Vesicles 2: , 10.3402/jev.v2i0.19861. |
[43] | Verweij FJ , Balaj L , Boulanger CM , Carter DRF , Compeer EB , D’Angelo G , El Andaloussi S , Goetz JG , Gross JC , Hyenne V , Krämer-Albers EM , Lai CP , Loyer X , Marki A , Momma S , Nolte-‘t Hoen ENM , Pegtel DM , Peinado H , Raposo G , Rilla K , Tahara H , Théry C , van Royen ME , Vandenbroucke RE , Wehman AM , Witwer K , Wu Z , Wubbolts R , van Niel G ((2021) ) The power of imaging to understand extracellular vesiclebiology in vivo. Nat Methods 18: , 1013–1026. |
[44] | Brunello CA , Merezhko M , Uronen RL , Huttunen HJ ((2020) ) Mechanisms of secretion and spreading of pathological tau protein.. Cell Mol Life Sci 77: , 1721–1744. |
[45] | Muraoka S , DeLeo AM , Sethi MK , Yukawa-Takamatsu K , Yang Z , Ko J , Hogan JD , Ruan Z , You Y , Wang Y , Medalla M , Ikezu S , Chen M , Xia W , Gorantla S , Gendelman HE , Issadore D , Zaia J , Ikezu T ((2020) ) Proteomic and biological profiling of extracellular vesicles from Alzheimer’s disease human brain tissues. Alzheimers Dement 16: , 896–907. |
[46] | Kapogiannis D , Mustapic M , Shardell MD , Berkowitz ST , Diehl TC , Spangler RD , Tran J , Lazaropoulos MP , Chawla S , Gulyani S , Eitan E , An Y , Huang CW , Oh ES , Lyketsos CG , Resnick SM , Goetzl EJ , Ferrucci L ((2019) ) Association of extracellular vesicle biomarkers with Alzheimer disease in the Baltimore Longitudinal Study of Aging. JAMA Neurol 76: , 1340–1351. |
[47] | Suárez-Calvet M , Karikari TK , Ashton NJ , Lantero Rodríguez J , Milà-Alomà M , Gispert JD , Salvadó G , Minguillon C , Fauria K , Shekari M , Grau-Rivera O , Arenaza-Urquijo EM , Sala-Vila A , Sánchez-Benavides G , González-de-Echávarri JM , Kollmorgen G , Stoops E , Vanmechelen E , Zetterberg H , Blennow K , Molinuevo JL , Beteta A , Cacciaglia R , Cañas A , Deulofeu C , Cumplido I , Dominguez R , Emilio M , Falcon C , Fuentes S , Hernandez L , Huesa G , Huguet J , Marne P , Menchón T , Operto G , Polo A , Pradas S , Soteras A , Vilanova M , Vilor-Tejedor N ((2020) ) Novel taubiomarkers phosphorylated at T181, T217 or T231 rise in the initialstages of the preclinical Alzheimer’s continuum when only subtlechanges in Aβ pathology are detected. EMBO Mol Med 12: , e12921. |
[48] | Barthélemy NR , Mallipeddi N , Moiseyev P , Sato C , Bateman RJ ((2019) ) Tau phosphorylation rates measured by mass spectrometry differ in the intracellular brain vs. Extracellular cerebrospinal fluid compartments and are differentially affected by Alzheimer’s disease. Front Aging Neurosci 11: , 121. |
[49] | Liu S , Mahairaki V , Bai H , Ding Z , Li J , Witwer KW , Cheng L ((2019) ) Highly purified human extracellular vesicles produced by stem cells alleviate aging cellular phenotypes of senescent human cells. Stem Cells 37: , 779–790. |
[50] | Szeliga M ((2020) ) Peroxiredoxins in neurodegenerative diseases. Antioxidants 9: , 1203. |
[51] | Kim SH , Fountoulakis M , Cairns N , Lubec G LubecG(2001) Protein levels of human peroxiredoxin subtypes in brains of patients with Alzheimer’s disease and Down syndrome. J Neural Transm Suppl, 223-235. |
[52] | Krapfenbauer K , Engidawork E , Cairns N , Fountoulakis M , Lubec G ((2003) ) Aberrant expression of peroxiredoxin subtypes in neurodegenerative disorders. Brain Res 967: , 152–160. |
[53] | Lee YJ , Goo JS , Kim JE , Nam SH , Hwang IS , Choi S Il , Lee HR , Lee EP , Choi HW , Kim HS , Lee JH , Jung YJ , Kim HJ , Hwang DY ((2011) ) Peroxiredoxin I regulates the component expression of γ-secretase complex causing the Alzheimer’s disease. Lab Anim Res 27: , 293–299. |
[54] | Yun HM , Jin P , Han JY , Lee MS , Han SB , Oh KW , Hong SH , Jung EY , Hong JT ((2013) ) Acceleration of the development of alzheimer’s disease in amyloid beta-infused peroxiredoxin 6 overexpression transgenic mice. Mol Neurobiol 48: , 941–951. |
[55] | Pankiewicz JE , Diaz JR , Martá-Ariza M , Lizińczyk AM , Franco LA , Sadowski MJ ((2020) ) Peroxiredoxin 6 mediates protective function of astrocytes in Aβ proteostasis. Mol Neurodegener 15: , 50. |
[56] | Mullen L , Hanschmann EM , Lillig CH , Herzenberg LA , Ghezzi P ((2015) ) Cysteine oxidation targets peroxiredoxins 1 and 2 for exosomal release through a novel mechanism of Redox-dependent secretion. Mol Med 21: , 98–108. |
[57] | Szabó-Taylor K , Tóth E , Balogh AM , Sódar BW , Kádár L , Pálóczi K , Fekete N , Németh A , Osteikoetxea X , Vukman KV , Holub M , Pállinger , Nagy G , Winyard PG , Buzás EI ((2017) ) Monocyte activation drives preservation of membrane thiols by promoting release of oxidised membrane moieties via extracellular vesicles. Free Radic Biol Med 108: , 56–65. |
[58] | Yamanaka K , Sasagawa Y , Ogura T ((2012) ) Recent advances in p97/VCP/Cdc48 cellular functions. Biochim Biophys Acta 1823: , 130–137. |
[59] | Guo X , Sun X , Hu D , Wang YJ , Fujioka H , Vyas R , Chakrapani S , Joshi AU , Luo Y , Mochly-Rosen D , Qi X ((2016) ) VCP recruitment to mitochondria causes mitophagy impairment and neurodegeneration in models of Huntington’s disease. Nat Commun 7: , 12646. |
[60] | Li B , Yamamori H , Tatebayashi Y , Shafit-Zagardo B , Tanimukai H , Chen S , Iqbal K , Grundke-Iqbal I ((2008) ) Failure of neuronal maturation in Alzheimer disease dentate gyrus. J Neuropathol Exp Neurol 67: , 78–84. |
[61] | Boldrini M , Fulmore CA , Tartt AN , Simeon LR , Pavlova I , Poposka V , Rosoklija GB , Stankov A , Arango V , Dwork AJ , Hen R , Mann JJ ((2018) ) Human hippocampal neurogenesis persists throughout aging. Cell Stem Cell 22: , 589–599.e5. |
[62] | Toyo-Oka K , Wachi T , Hunt RF , Baraban SC , Taya S , Ramshaw H , Kaibuchi K , Schwarz QP , Lopez AF , Wynshaw-Boris A ((2014) ) 14-3-3ɛ and ζ regulate neurogenesis and differentiation of neuronal progenitor cells in the developing brain.. J Neurosci 34: , 12168–12181. |
[63] | Gulisano W , Bizzoca A , Gennarini G , Palmeri A , Puzzo D ((2017) ) Role of the adhesion molecule F3/Contactin in synaptic plasticity and memory. Mol Cell Neurosci 81: , 64–71. |
[64] | Sherman DL , Tait S , Melrose S , Johnson R , Zonta B , Court FA , Macklin WB , Meek S , Smith AJH , Cottrell DF , Brophy PJ ((2005) ) Neurofascins are required to establish axonal domains for saltatory conduction. Neuron 48: , 737–742. |
[65] | Akiyama H , Tooyama I , Kawamata T , Ikeda K , McGeer PL ((1993) ) Morphological diversities of CD44 positive astrocytes in the cerebral cortex of normal subjects and patients with Alzheimer’s disease. Brain Res 632: , 249–259. |
[66] | Matsumoto T , Imagama S , Hirano K , Ohgomori T , Natori T , Kobayashi K , Muramoto A , Ishiguro N , Kadomatsu K ((2012) ) CD44 expression in astrocytes and microglia is associated with ALS progression in a mouse model. Neurosci Lett 520: , 115–120. |
[67] | Muraoka S , Lin W , Chen M , Hersh SW , Emili A , Xia W , Ikezu T ((2020) ) Assessment of separation methods for extracellular vesicles from human and mouse brain tissues and human cerebrospinal fluids. Methods 177: , 35–49. |
[68] | Gallart-Palau X , Guo X , Serra A , Sze SK ((2020) ) Alzheimer’s disease progression characterized by alterations in the molecular profiles and biogenesis of brain extracellular vesicles. Alzheimers Res Ther 12: , 54. |
[69] | Ulvestad E , Williams K , Bø L , Trapp B , Antel J , Mørk S ((1994) ) HLA class II molecules (HLA-DR, -DP, -DQ) on cells in the human CNSstudied in situ and in vitro. Immunology 82: , 535. |
[70] | Hendrickx DAE , van Eden CG , Schuurman KG , Hamann J , Huitinga I ((2017) ) Staining of HLA-DR, Iba1 and CD68 in human microglia reveals partially overlapping expression depending on cellular morphology and pathology. J Neuroimmunol 309: , 12–22. |


