
Polygenic Risk Scores in Alzheimer’s Disease Genetics: Methodology, Applications, Inclusion, and Diversity
Abstract
The success of genome-wide association studies (GWAS) completed in the last 15 years has reinforced a key fact: polygenic architecture makes a substantial contribution to variation of susceptibility to complex disease, including Alzheimer’s disease. One straight-forward way to capture this architecture and predict which individuals in a population are most at risk is to calculate a polygenic risk score (PRS). This score aggregates the risk conferred across multiple genetic variants, ultimately representing an individual’s predicted genetic susceptibility for a disease. PRS have received increasing attention after having been successfully used in complex traits. This has brought with it renewed attention on new methods which improve the accuracy of risk prediction. While these applications are initially informative, their utility is far from equitable: the majority of PRS models use samples heavily if not entirely of individuals of European descent. This basic approach opens concerns of health equity if applied inaccurately to other population groups, or health disparity if we fail to use them at all. In this review we will examine the methods of calculating PRS and some of their previous uses in disease prediction. We also advocate for, with supporting scientific evidence, inclusion of data from diverse populations in these existing and future studies of population risk via PRS.
INTRODUCTION
Polygenic risk scores (PRS) have increasingly become a tool of interest in both research and clinical settings. As a measure of an individual’s genetic risk for a specific trait, PRS hold the possibility of increasing the efficiency of disease diagnosis and prognosis beyond what can be achieved using lifestyle and environmental risk information alone. Scores have been calculated for a multitude of phenotypes [1–13], including for Alzheimer’s disease (AD) [14–21]. AD is a neurodegenerative disease characterized by devastating memory loss and cognitive deterioration. It is the sixth leading cause of death in adults in the United States, affecting more than 6 million adults over the age of 65 [22]. Previous studies have shown that PRS and PHS (polygenic hazard scores, which look at time to event) are able to quantify differences in genetic risk between individuals, enabling stratification of those individuals based on their risk levels [17, 20, 23, 24] and personalized treatment options.
While this finding is useful, there is one major drawback of using PRS: the population in which these scores may prove useful is only a subset of the global population. The majority of PRS analyses, and the genome-wide association studies (GWAS) they are built on, are computed on samples of exclusively European lineage [2, 25, 26]. Due to the known differences in linkage disequilibrium (LD) structure and environmental factors between ethnic groups, these European-based PRS analyses have been shown to be far less useful for non-European populations, especially those of African American descent [25]. Because of all this, it is vital that researchers perform PRS analyses on a diverse group of individuals to maximize the usefulness of this method globally. This review will examine PRS, their previous uses in disease prediction generally and AD specifically, some of the methods used to calculate them, and the various reasons why data from a variety of populations must be included in these studies.
POLYGENIC RISK SCORES AS A RESEARCH TOOL
What is a polygenic risk score?
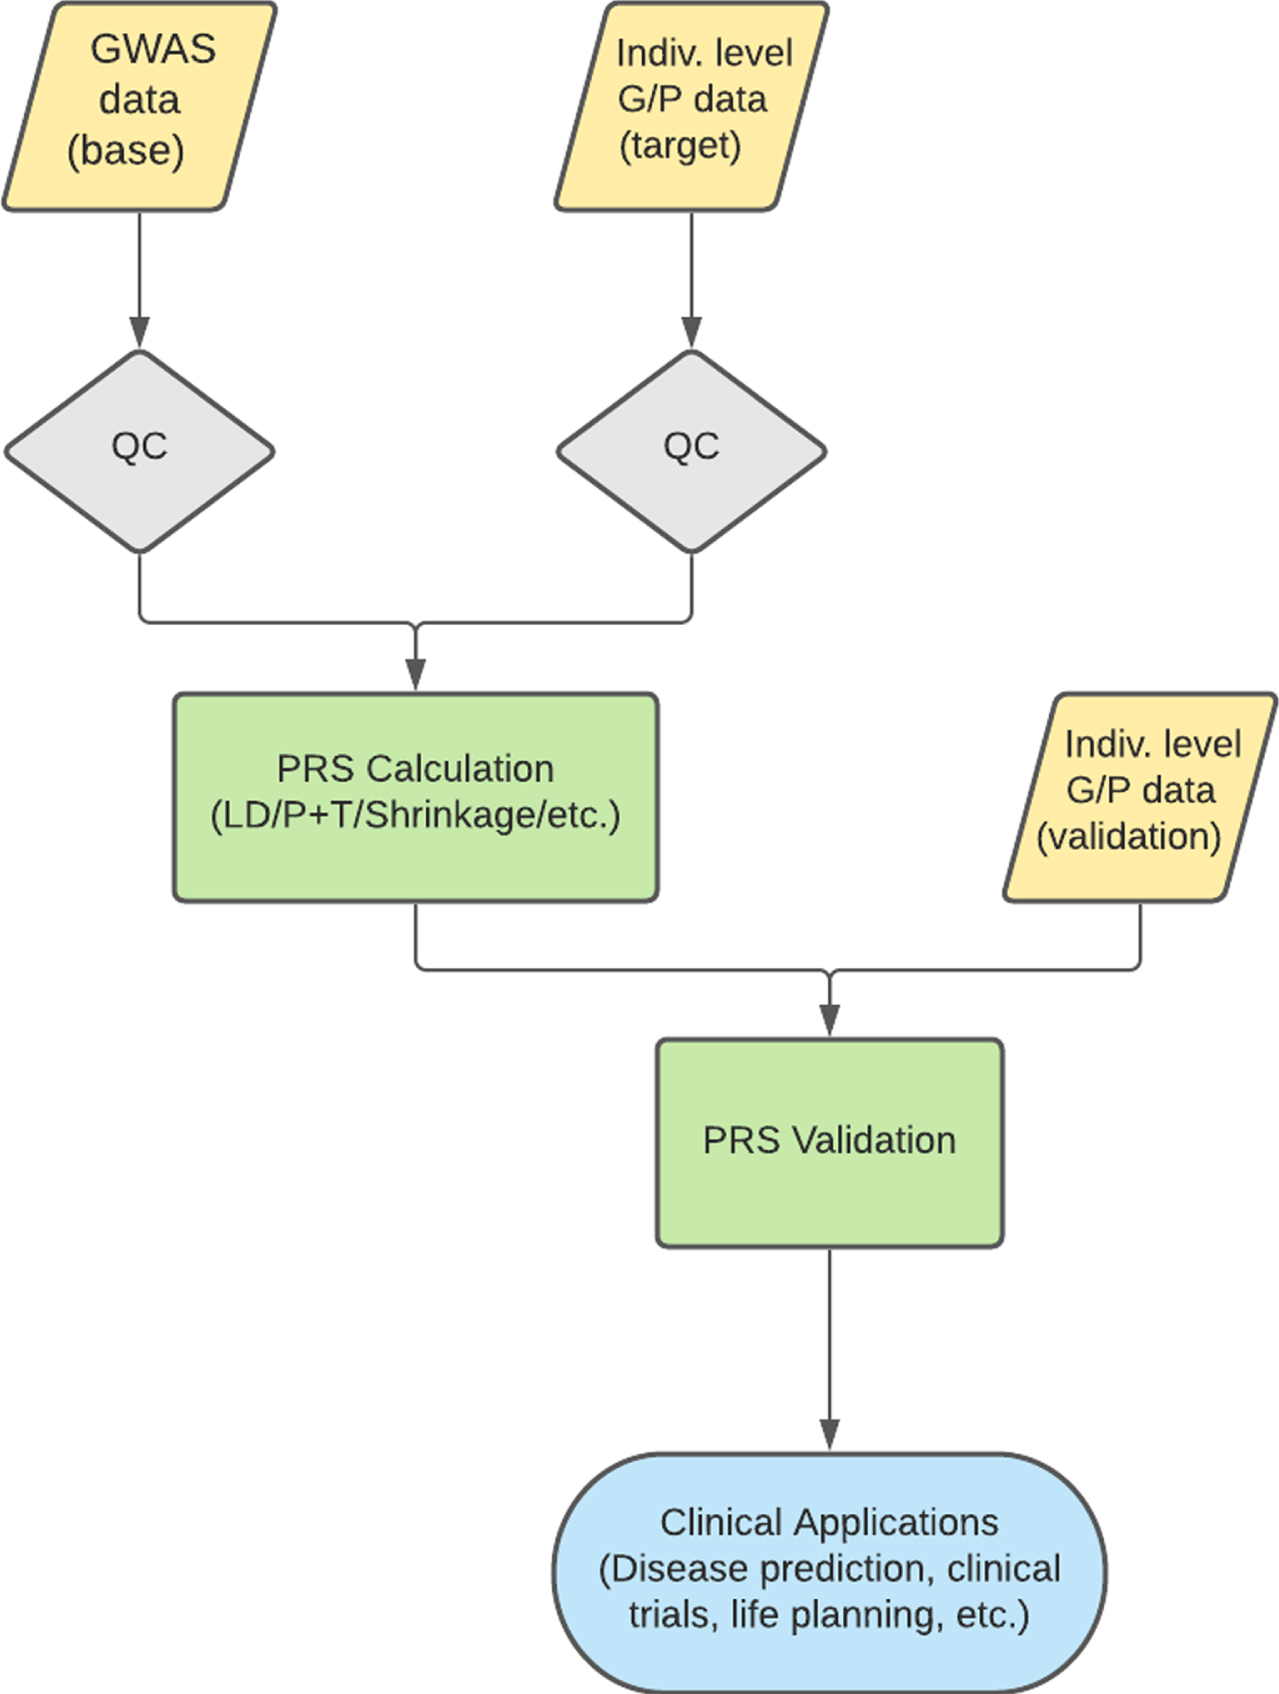
In its simplest form, a PRS, also known as genetic risk score or risk profile score, is an estimate of an individual’s genetic risk for a particular trait. PRS is a sum of an individual’s genotypes, either genome-wide or only at specific genomic locations, weighted by the effect size estimates for single nucleotide polymorphisms (SNPs) present in a GWAS dataset for the trait of interest [27, 28]. For binary traits, effect sizes are represented as beta in the summary statistics, but continuous traits (height, body mass index, etc.) are reported as an odds ratio (OR). These effect sizes must be transformed into betas, using log(OR), before being used to calculate PRS. Using just these two inputs, genotype information and GWAS summary statistics, the typically normally distributed PRS can be used to stratify individuals based on genetic risk for a trait, with the tails representing individuals with higher or lower genetic risk (Fig. 1 shows this characteristic holding for AD) [29]. When used in combination with phenotype data for a second trait, for the purpose of examining whether genetic risk for one trait is predictive of another, PRS can also be used to indicate shared etiology between diseases. An overview of a typical PRS workflow is shown in Fig. 2.
Fig. 1
Alzheimer’s disease PRS distribution. PRS is typically normally distributed, as seen here, with cases shifted slightly right of controls due to higher genetic risk. In the best case it is able to discriminate between the groups of study. The PRS for this figure was calculated for samples (2635 cases, 2471 controls) from the National Alzheimer’s Coordinating Center (NACC) [55] using effect size estimates from the 2019 IGAP GWAS [36] summary statistics. The C+T method was implemented using PLINK software (code available upon request).
![Alzheimer’s disease PRS distribution. PRS is typically normally distributed, as seen here, with cases shifted slightly right of controls due to higher genetic risk. In the best case it is able to discriminate between the groups of study. The PRS for this figure was calculated for samples (2635 cases, 2471 controls) from the National Alzheimer’s Coordinating Center (NACC) [55] using effect size estimates from the 2019 IGAP GWAS [36] summary statistics. The C+T method was implemented using PLINK software (code available upon request).](https://content.iospress.com:443/media/jad/2022/89-1/jad-89-1-jad220025/jad-89-jad220025-g001.jpg)
Fig. 2
Typical PRS workflow. A normal PRS workflow involves the QC of both a base and target dataset. PRS are then calculated on the base dataset to predict the trait of interest in the target data. Validation is performed in an independent dataset to ensure a predictive and informative risk score model. This model can then be used for various clinical applications. QC, quality control; LD, linkage disequilibrium; P+T, pruning and thresholding; G/P, genotype/phenotype.
Previous use of PRS
Since researchers began using polygenic scores for research in 2008, there have been many studies that have applied PRS to various diseases and phenotypic traits [3–13, 24], both continuous and binary. In Oetjens et al., the authors calculated PRS for height and body mass index. They noted that the variance explained by both scores were similar to that of the respective GWAS summary statistics that were used to build the scores, thus providing more evidence for the clinical utility of PRS [30]. Similarly, Ripke et al. [5] showed that a PRS for schizophrenia was able to predict case/control status for individuals from a dataset independent of the discovery set. This ability to stratify individuals could prove useful in both epidemiological and clinical studies. While only discussing two examples in this review, PRS have been calculated and shown predictive for many different types of diseases [1–4].
With the possibility of PRS being of clinical use, there has also been interest in whether the performance of a risk score could be predicted a priori. In creating a model to achieve this, Chatterjee et al. identified several indicators of how predictive the PRS will be. Among these were the sample size of the discovery GWAS dataset, the underlying genetic architecture and degree of heritability of the trait of interest, and knowledge about relevant environmental and lifestyle risk factors [31]. Knowing the expected utility of a risk score before producing it allows for efficient dispersal of resources to completing these studies.
USE OF PRS FOR ALZHEIMER’S DISEASE
Alzheimer’s disease
AD is a neurodegenerative disease characterized by devastating memory loss and cognitive deterioration that affects more than 6 million adults over the age of 65 [22, 32]. Postmortem autopsies show brain atrophy, amyloid plaque deposition, and tau tangles [32], but these changes may begin to take place about two decades before symptoms appear. Because of this delayed symptom onset, AD is difficult to manage, with standard treatment focused on management of cognitive and behavioral symptoms. With a better understanding of the biology underlying AD, and the ability to identify increased disease risk earlier in life, it is possible to move toward a treatment for AD. This has, in part, driven the use of PRS to further our understanding of (age-stratified AD PRS in Fig. 3AD, previous studies summarized in Supplementary Table 1).
Fig. 3
Average PRS for Alzheimer’s disease. Average Alzheimer’s disease PRS by age for cases (2635, red) and controls (2471, blue) from the National Alzheimer’s Coordinating Center (NACC) [55]. Risk scores were calculated using the C+T method in PLINK (code available upon request), using effect size estimates from the 2019 IGAP GWAS [36] summary statistics. Samples were grouped by age, with bin width = 1, with the exception of group 90 which includes all samples 90 years of age and older.
![Average PRS for Alzheimer’s disease. Average Alzheimer’s disease PRS by age for cases (2635, red) and controls (2471, blue) from the National Alzheimer’s Coordinating Center (NACC) [55]. Risk scores were calculated using the C+T method in PLINK (code available upon request), using effect size estimates from the 2019 IGAP GWAS [36] summary statistics. Samples were grouped by age, with bin width = 1, with the exception of group 90 which includes all samples 90 years of age and older.](https://content.iospress.com:443/media/jad/2022/89-1/jad-89-1-jad220025/jad-89-jad220025-g003.jpg)
Table 1
Summary of PRS Tools. Summary of PRS tools mentioned in this review, with required platform and input needed for analysis. ISC, International Schizophrenia Consortium; GCTB, genome-wide complex trait Bayesian analyses; LD, linkage disequilibrium; G/P, genotype/phenotype
| Tool | Authors | Development Year | Platform | Input Requirements | Approach |
| P+T/C+T | ISC [56] | 2009 | PLINK | Base phenotype GWAS results Target G/P data | C+T |
| PRSice | Euesden et al. [41] | 2015 | R | Base phenotype GWAS results Target G/P data | C+T |
| LDpred | Vilhjálmsson et al. [44] | 2015 | R | Genetic architecture prior GWAS summary statistics LD reference panel Target G/P data | Bayesian (Gibbs Sampler) |
| PRS-CS | Ge et al. [45] | 2019 | Python | GWAS summary stats LD reference panel Target G/P data | Bayesian (Continuous Shrinkage) |
| SBayesR | Lloyd-Jones et al. [46] | 2019 | GCTB | GWAS summary stats LD reference panel Target G/P data | Bayesian (Gibbs Sampler) |
PRS and PHS in Alzheimer’s disease
One of the earliest applications of risk score calculation for AD was performed in 2017 by Desikan et al. [17], in the calculation of polygenic hazard scores (PHS). PHS are calculated using a Cox regression model, as opposed to the typical logistic or linear regression used in PRS for binary and continuous traits respectively. This model change also means the predicted outcome is different; PHS gives researchers the ability to estimate a person’s instantaneous risk for developing a disease. While Cox models are better able to detect risk variants compared to linear/logistic models due to their incorporation of time-to-event data, SNPs with a strong effect size will be marked as significant regardless of the model used [23]. In Desikan et al., the hazard scores strongly predicted the age of onset (p = 1.1×10⁻²⁶) for AD, showing that a higher PHS quartile correlated with a decreased age of onset and increased yearly incidence rate. In addition to this, their PHS also strongly associated with known markers of neurodegeneration, like decreased hippocampal and cortical volume, and neuropathological characteristics, such as neurofibrillary tangles and amyloid plaques.
Many research groups were able to replicate the results of Desikan et al. in their own studies, reinforcing the utility of PRS and PHS in AD risk stratification. Tan et al. [20] used a stepwise Cox proportional hazards model to investigate the relationship between AD PHS and multiple pathological and behavioral markers. These markers include longitudinal volume changes of 33 brain regions of interest, regional neuropathology, and longitudinal cognitive decline, among others. Their hazard scores, which were calculated using just the 31 SNPs that passed feature selection, showed association with amyloid deposition and neurodegeneration across multiple brain regions, as well as cognitive and clinical decline (p = 2.93×10⁻²) in people without an AD diagnosis. This provided more information than what could be gleaned solely from imaging biomarkers.
In 2021, Huq et al. [33] calculated AD PRS specifically for samples that were homozygous for the APOE ɛ4 allele. Presence of the APOE ɛ4 allele is considered the biggest risk factor for developing AD, conferring an almost 15-fold increase in the chances of developing the disease as compared to the most common genotype [34]. Huq et al. calculated PRS for young AD cases and cognitively healthy older controls, all homozygous for ɛ4, after removal of the APOE genomic region. This PRS, calculated without the SNPs with the largest effect sizes and done on samples with known heavy genetic burden, was able to significantly distinguish between the cases and controls. The PRS for cases was significantly higher than that of controls (p = 0.003), indicating the ability for PRS to effectively capture comparatively small genetic effects.
Felsky et al. [35] developed their PRS further than the previously mentioned studies. Instead of using PRS solely to classify levels of genetic risk for AD, they investigated whether immune-specific risk scores were associated with known characteristics of an aging brain. Many recent AD GWAS [36–38] have implicated immune genes in AD risk, and it has been previously shown that a diagnosis of certain immune diseases like rheumatoid arthritis (RA) and psoriasis is associated with increased AD risk [39], setting the foundation for this work. Felsky et al. calculated 8 different risk scores, including for RA, coronary artery disease, and telomere length, and looked for associations with microglial density, cognitive decline, and AD neuropathology. Among their results, the authors found that the risk scores calculated from the RA summary statistics were associated with both cognitive decline in living patients and neuropathology at autopsy. While they did not use a diagnosis of AD as their outcome, the use of these known AD features shows the ability of PRS to capture shared genetic risk between different phenotypes, even indirectly.
METHODS TO CALCULATE PRS
In order to calculate an individual’s genetic risk for a trait, PRS are calculated by weighing a subset of a person’s genetic variants by the strength of their association with the trait of interest, represented by the effect size reported in the GWAS summary statistics. While this appears relatively straightforward at first glance, there are multiple complexities that need to be considered. These include 1) the scope of the genome being captured, 2) how to best model LD, and 3) assumptions about the statistical distribution(s) underlying the disease of interest. As such, there have been many different methods developed [40] over the last decade that attempt to make this calculation as biologically relevant as possible. This review will briefly introduce five methods for calculating PRS, summarized in Table 1, showing the similarities and differences in terms of software needs, statistical approach, and input requirements.
Pruning/clumping and thresholding
The simplest, and most frequently used, methods for calculating PRS are called ‘Pruning and Thresholding’ and ‘Clumping and Thresholding’ (P+T and C+T, respectively). These methods differ in how SNPs are chosen to be included into the PRS model. In P+T, SNPs that pass a specified LD threshold in a pre-defined genomic window are retained. Due to the arbitrary way SNPs in LD are chosen to be pruned, this leads to a somewhat random collection of uncorrelated SNPs to be included in the risk score model [27]. In contrast, C+T selects SNPs that are highly associated with the trait of interest based on a specified p-value threshold, and then forms clumps around those SNPs that include all markers within a certain LD window [1]. This allows a single genetic locus to capture multiple independent effects stemming from different significant genetic markers. In short, P+T uses a random set of uncorrelated SNPs to build the PRS model, while C+T uses SNPs that have already been shown to be associated with the trait of interest. Once the subset of SNPs has been identified, both methods follow the same process to calculate the risk scores; the individual’s dosage for each SNP is multiplied by the reported GWAS effect size. These new weighted dosages are summed across all included variants to give a final risk score, the units of which correspond to the units of the discovery GWAS phenotype.
PRSice
The first dedicated software for calculating PRS, PRSice, was developed by Euesden et al. (2015) [41]. Rather than simply weighing genome-wide variants by the GWAS effect sizes, PRSice removes SNPs in LD and uses principal component analysis (PCA) to control for population substructure. Incorporation of this additional information allows for a more predictive PRS. PRSice also allows for flexibility in the risk scores calculated; users can calculate scores at any number of p-value cutoffs, allowing for the identification of the “best-fit” PRS based on R2 values. Along with calculating PRS, PRSice is a fully automated software that also applies, evaluates, and plots the results of a PRS analysis. This provides all the essential components needed to easily complete a PRS analysis, and the ability to have quick turnaround time for testing out different combinations of parameters.
Most recently, many researchers have been using an updated version of PRSice, called PRSice-2 [42], to calculate their risk scores. This newer version is more time- and memory-efficient than the original. For example, Andrews et al. [43] used PRSice-2 to quickly and easily calculate PRS for 22 different AD risk factors.
LDpred
Once researchers saw how accessible PRS studies could be, they began looking into ways to improve the method by better modeling the underlying LD structure and genetic architecture. To address this, many Bayesian PRS tools have been developed [40], including a tool called LDpred [44]. Developed in 2015, LDpred uses a prior on marker effect size (the genetic architecture) and LD information to estimate the posterior mean effect sizes for the causal GWAS SNPs. By using different fractions of causal markers in its prior, LDpred calculates multiple PRS, similar to the way P+T uses different p-value thresholds to calculate multiple scores. If we assume all markers are causal and hence no LD to account for, a scenario known as LDpred-inf, then the posterior effects are drawn from a Gaussian distribution. In practice, a far more reasonable model assumes that the variant data is comprised of a mixture of causal and non-causal risk variants; thus, the standard implementation approximates the posterior using a Monte-Carlo Gibbs sampler. Calculated this way, as opposed to the normal P+T method, the prediction accuracy of the risk scores calculated by LDpred’s Bayesian method converges to the heritability explained by the included SNPs.
PRS-CS
While Bayesian PRS methods like LDpred have a higher prediction accuracy compared to P+T, they can be computationally expensive and inaccurately adjust for LD due to their discrete mixture priors [45]. To address this issue, Ge et al. developed the python package PRS-CS, a Bayesian PRS method that uses a continuous shrinkage (CS) prior on the SNP effect sizes; the amount of shrinkage is inversely correlated with the strength of the GWAS signal. This CS prior puts strong shrinkage on small effects that are most likely to be noise while effectively putting no shrinkage on non-zero effects. It also allows for block updates of SNP effect sizes; updates are done for a group of consecutive SNPs instead of sequentially for each individual SNP, to better model LD patterns [45]. When compared to prediction accuracies produced by LDpred, Ge et al. found that PRS-CS outperformed as sample size increased and was computationally scalable; more markers added to the model does not necessarily increase the number of blocks that need to be updated, whereas with LDpred the number of updates grows exponentially with the number of markers.
SBayesR
One of the more recent PRS methods is SBayesR [46], developed by Lloyd-Jones et al. (2019). This method applies a Bayesian multiple regression model to GWAS summary statistics to calculate PRS. The posterior is estimated through a combination of multiple regression coefficients and a mixture of normal distributions prior on the SNP effect sizes. This model can simultaneously estimate heritability, perform genetic mapping, and estimate the distribution of marker effects, allowing SBayesR to outperform other PRS methods and reduce the average runtime of risk score calculations. This also has the potential for fine mapping in the future, with SBayesR’s ability to fit millions of variants into a single model.
As the work to develop these five methods highlights, there is great interest in developing methods that make PRS calculations faster and more predictive, whether that is by improving the statistical model used in prediction or by incorporating genomic characteristics into the calculation.
PERFORMANCE METRICS AND CAVEATS OF PRS
Assessing PRS model performance
With all the available software options available for calculating PRS, it is important now to consider what makes a model “good” in practice. There are many ways of evaluating the association between a calculated risk score and a trait of interest by looking at different characteristics of the model [27]. A low p-value would reject the null hypothesis of no association with the trait, while a high R2 value would point to the ability of the model to capture a large amount of variance in the chosen phenotype. Lastly, the discriminatory ability of the model can be represented by the area under the receiver operator curve (AUC), with a higher AUC indicating a higher ability to distinguish between case/control status in the context of binary phenotypes.
Caveats of PRS analysis
While PRS have been shown to be useful statistical tools for disease research, there are a few limitations due to how scores are calculated and interpreted.
When calculating risk scores, specific SNPs are chosen for inclusion in the final model. Regardless of whether this is due to significance thresholds or a priori selection by researchers, this restriction in the genomic information used leads to the inability of PRS to completely capture the genomic landscape of the selected trait [26, 47]. Along these same lines, PRS generally do not include rare variants (those with an allele frequency less than 1%) because they cannot be captured in most large-scale GWAS. This becomes a problem in the case of traits that are truly polygenic, or influenced by more than one gene, where the model may be missing information contained by the removed and/or absent genes.
Aside from the variants included in the PRS model, the model itself can cause issues. PRS calculations typically assume a linear, additive relationship, but this is not always the case in complex diseases. There are many interactions and non-linear effects that should be considered when assessing genetic risk for a disease. Unfortunately, these effects are typically hard to detect due to small sample sizes, meaning PRS models cannot account for these complexities. Continuing research into how to adequately handle these issues will certainly lead to more predictive PRS models.
It is also important to remember that risk scores can only indicate genetic risk for a disease; it cannot be used to diagnose patients. This distinction between a prediction and a definitive diagnosis becomes important as PRS continues to be more widely and publicly used in clinical and research settings.
CLINICAL APPLICATIONS OF PRS
While PRS have been shown to be useful research tools, they can also be used in a multitude of ways in clinical settings, especially in the context of AD. Alzheimer’s PRS have already been shown to be predictive of clinical symptoms like cognitive decline [15, 19], lending itself to uses in clinical trials, treatment decisions, and individual life planning.
Clinical trials
PRS can be particularly useful in the case of clinical trials, where the goal is to identify therapies that can prevent disease progression. By identifying cognitively normal adults that have a high risk for AD, and therefore a high PRS, clinicians can improve their chances of detecting effective prevention therapies in trial cohorts [18, 19]. Instead of trying to discern the effectiveness of a prevention drug on subjects that may or may not have gone on to develop AD without intervention, risk scores allow trials to be run on subjects that have the highest chance of needing the treatment. This in turn can save both time and money when running clinical trials [26] by targeting specific groups of people that will garner the most informative results.
Treatment
PRS can also be used to aid in treatment decisions. In the case of diseases with set guidelines for regular screenings, like mammograms for breast cancer, risk scores can be used to inform screening frequency for various diseases [18, 48]. In some cases, individuals with low PRS can safely delay screenings, while those with higher PRS may begin screenings earlier than the general recommendation. This would increase the efficiency and cost-effectiveness of screenings for many different diseases. In cases like AD, where treatment is mainly focused symptom management, identifying individuals with a high genetic risk and introducing earlier interventions can lead to higher quality of life for those affected.
For those with a known diagnosis, PRS can be used to determine whether specific subjects would be good candidates for certain drugs. If clinical trials show that a drug is differentially effective in subjects of varying risk profiles, that would help inform treatment options. For example, Mega et al. conducted a PRS study of coronary heart disease and found that subjects with the highest genetic risk saw the largest benefit from statin therapy [9]. Cases like this highlight the possibility of using risk scores to increase confidence when recommending drugs. This would not only save time when deciding between treatment options but would also save money that would otherwise be spent looking for an effective therapy [26].
Life planning
Along with a direct clinical use, PRS can also affect general life planning of patients visiting the clinic [26, 48]. Depending on the disease for which the risk score was calculated, patients with high genetic risk may implement certain changes (whether dietary, physical, etc.) in an effort to lower their total risk. As PRS continue to become more predictive, they have to potential to me more impactful when calculated earlier in life, especially when used for diseases with a later age of onset like AD [49].
Precautions
While risk scores clearly have their benefits as mentioned previously, it is also important to remember that a risk score does not definitively correlate with whether or not a person will develop a certain disease [7, 26]. There have been a few studies showing that PRS can actually overestimate a person’s genetic risk for a trait [50, 51]. It is especially important for clinicians, and researchers in general, to effectively communicate the implications of a high or low risk score [48]. The key is to find the balance between informing someone of their predisposition for a disease and causing possibly undue stress to the individual. Increasing public knowledge of PRS as a prediction tool, among other things, will aid in finding this balance.
PRS UTILITY IN DIVERSE POPULATIONS
As PRS become more popular, and their clinical utility becomes more appreciated, it is essential to ensure that everyone can reap the benefits of the tool, specifically people of non-European ancestries. These groups have historically been negatively impacted by health inequities and would greatly benefit from successful development and deployment of this methodology at scale.
Diversity in PRS calculation
A large proportion of the PRS studies that have been completed, including those mentioned in this review, have been performed on subjects of solely European descent. In fact, only ∼4% of previous PRS studies have included samples of African American, Hispanic, or Indigenous descent [2]. A naïve PRS based on information from European subjects applied to non-European subjects will overlook at least two major sources of variation that will reduce both the prediction ability and accuracy of a score: known differences in LD and variant allele frequencies across populations. The accumulation of these differences is thought to be the reason why many PRS studies have reported substantially decreased accuracy and predictive power in estimating genetic risk in non-European individuals when training models are derived from subjects of European ancestry [2, 6, 25, 26, 48]. For example, a PRS calculated in European samples have been shown to be about one-third as informative when applied to samples of African ancestry [2]. Thus, the previously mentioned clinical utility of PRS is greatly limited for diverse populations, especially in comparison to other commonly used clinical measures and tests. While there are many other factors, including both physical and social environmental differences, that could affect the predictive power of PRS across different groups [6, 26, 29, 52], it is apparent that ethnic background is a major contributor to the disparity in utility.
One way to address this is by performing principal PCA to capture population structure, and a few PRS studies [6, 16, 33, 53] (Supplementary Table 1) have been conducted with the goal of addressing this discrepancy in AD specifically. While controlling for multiple principal components does correct a lot of the population stratification present in the samples, there is still a small percentage that remains uncorrected. This leads to the inclusion of false positives in the model; SNPs that incorrectly have a significant, non-zero effect due to unaccounted-for correlation with the base population instead of the trait of interest. A PRS biased in this way contributes to the differences in utility seen when applied to a dataset of a different population, emphasizing the notion that PRS should be calculated and applied in a population-specific way. However, the fundamental lack of diversity in the sample makeup of the genetic association data used to train the PRS model makes this very difficult to achieve.
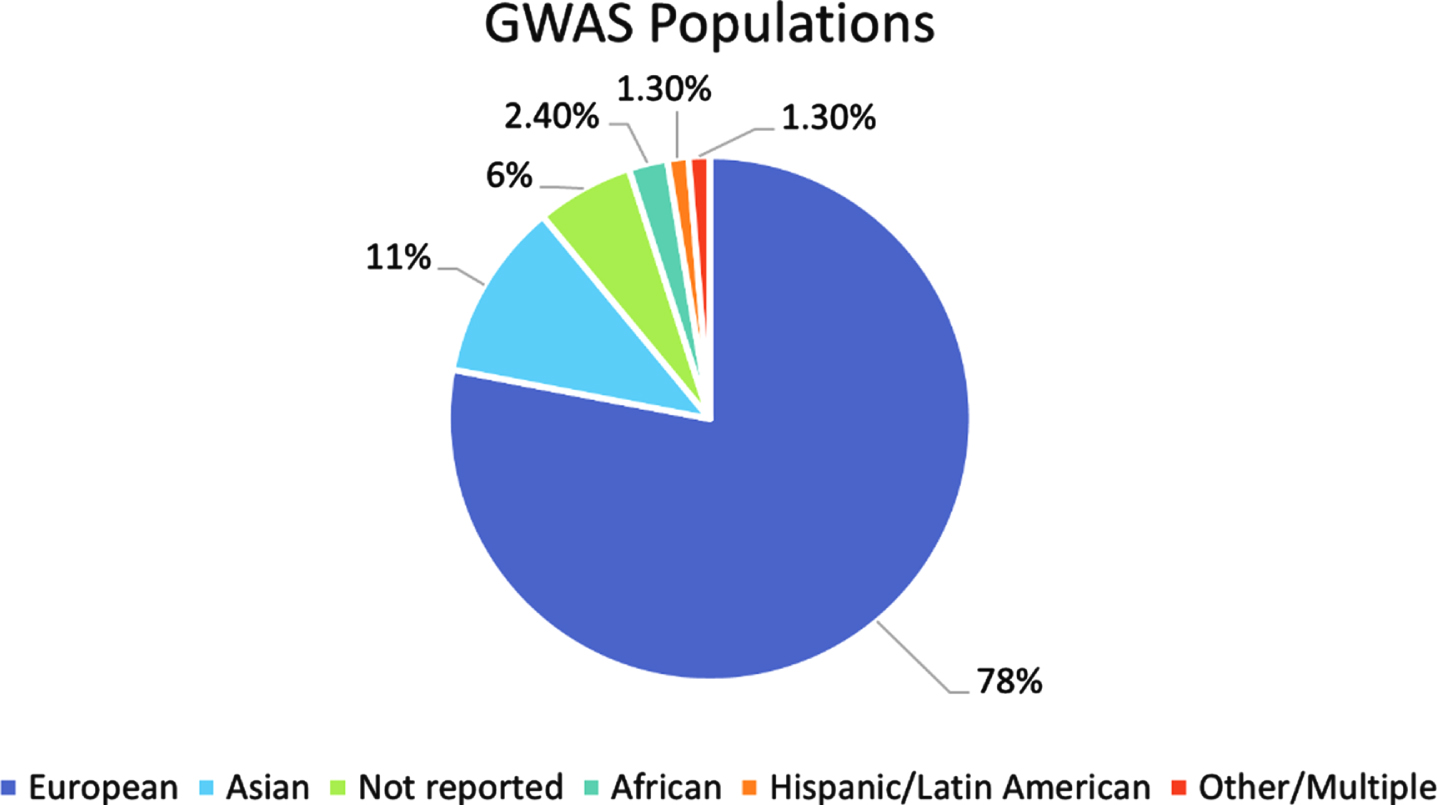
Diversity in underlying GWAS
The most common way to calculate a PRS depends on the variant effect sizes as reported in GWAS summary statistics data. While this can relieve some of the privacy concerns surrounding publicly available genetic data, about 80% of all GWAS participants are of European descent [25] (Fig. 4). This bias in the included samples is then passed along to the training sets for the PRS calculations. High genetic divergence between the GWAS samples and the target samples that a PRS is being tested on leads to reduced prediction accuracy [25, 26], meaning a research group that tries to incorporate populations of different backgrounds in their analysis would still be hindered by the lack of diversity present in the initial summary statistics data. By investing in more non-European GWAS, and thus population-specific genotyping arrays and imputation panels as well, we can start the process of properly balancing the functionality of PRS among diverse populations. More diverse GWAS will not only positively impact risk score calculations. It has been shown that, even if the sample sizes are considered small, GWAS of diverse populations have increased predictive power and can identify more associations as compared to those done on samples of European descent [25, 54]. This also holds for PRS calculations; Sariya et al. [54] showed that their PRS for Caribbean Hispanic (CH) samples either matched or exceeded prediction accuracies of European PRS despite their CH GWAS dataset being almost 15 times smaller in size. Investing in a more diverse collection of GWAS studies can lead to a better understanding of the genetic basis of many different traits which can then be extended to PRS studies.
Fig. 4
Breakdown of ancestry populations included in the GWAS Catalog. Ancestry data for all individuals included in the GWAS catalog published between 2005 and 2016. The “Other/Multiple” category includes individuals reported as “Non-European, Non-Asian”, “Greater Middle Eastern”, “Multiple”, “Multiple, non-European”, “Multiple, including European”, and “Other and other admixed”.
FUTURE DIRECTIONS: PATHWAY PRS
As the utility of PRS becomes increasingly clear, it is important to consider how they can be used for more than just basic risk prediction. One example of PRS being extended is in the use of pathway-specific risk scores. In the last few years, the community has begun calculating PRS in such a way that leads to a better understanding of the etiology of a specific disease [7, 19, 21] begun calculating PRS in such a way that leads to a better understanding of the etiology of a specific disease. In 2019, Morgan et al. [21] calculated both standard and immune-specific risk scores to investigate the relationship between immunity and AD. Their standard PRS included all SNPs that reached a specified significance threshold, while the immune PRS, referred to as an “IPS”, only included SNPs near genes that had been previously shown to be relevant to inflammation and immunity [21]. This IPS allowed for the identification of specific inflammatory biomarkers associated with AD risk that would have otherwise been missed.
In 2020, Bandres-Ciga et al. did something similar; they calculated what they called “Polygenic Effect Scores” for over 2000 gene sets representing different biological pathways [7]. After testing for significant associations with Parkinson’s disease (PD) and removing known PD risk loci and GWAS hits, the group identified 6 significant gene sets. These six sets represent PD risk that had not been identified previously, allowing the “new” risk that PRS capture to be classified into biologically relevant groups. These two research groups, among others, show the benefit of extending PRS to be more biologically meaningful.
CONCLUSION
As we have shown, PRS have been informative in many different disease contexts, with multiple software developed in the recent past to increase its accuracy. The goal of these new methods is to expand the benefit of PRS beyond a research tool, gaining value in both clinical settings and the lives of the general public. Despite this effort, PRS remain the most useful for subjects of European descent due to differences in genetic architecture between ethnic populations. While the clear solution is to increase the diversity of populations with calculated risk scores, this is only possible if the populations of the underlying large-scale GWAS are also diversified. Once this task is undertaken, PRS can grow to be applicable to people of all communities. This is especially true in the case of AD, where disease prevalence is much higher in people of African and Hispanic descent as compared to that of people of European or Asian descent [22]. With continued effort to increase the predictive ability of PRS software and an investment into GWAS of non-European populations, it is very likely that PRS will be a common tool used by the medical community.
ACKNOWLEDGMENTS
We would like to thank Dr. Iain Mathieson (University of Pennsylvania) for his invaluable explanations of PRS methodologies and implementation. This work was supported by the National Institute on Aging [U24-AG041689, U54-AG052427, U01-AG032984, U01AG058654] and the University of Pennsylvania Predoctoral Training Grant in Computational Genomics [5T32HG000046-22].
Authors’ disclosures available online (https://www.j-alz.com/manuscript-disclosures/22-0025r2).
SUPPLEMENTARY MATERIAL
[1] The supplementary material is available in the electronic version of this article: https://dx.doi.org/10.3233/JAD-220025.
REFERENCES
[1] | Khera AV , Chaffin M , Aragam KG , Haas ME , Roselli C , Choi SH , Natarajan P , Lander ES , Lubitz SA , Ellinor PT , Kathiresan S ((2018) ) Genome-wide polygenic scores for common diseases identify individuals with risk equivalent to monogenic mutations. Nat Genet 50: , 1219–1224. |
[2] | Duncan L , Shen H , Gelaye B , Meijsen J , Ressler K , Feldman M , Peterson R , Domingue B ((2019) ) Analysis of polygenic risk score usage and performance in diverse human populations. Nat Commun 10: , 3328. |
[3] | Hoffmann TJ , Ehret GB , Nandakumar P , Ranatunga D , Schaefer C , Kwok PY , Iribarren C , Chakravarti A , Risch N ((2017) ) Genome-wide association analyses using electronic health records identify new loci influencing blood pressure variation. Nat Genet 49: , 54–64. |
[4] | Knowles JW , Ashley EA ((2018) ) Cardiovascular disease: The rise of the genetic risk score. PLoS Med 15: , e1002546. |
[5] | Ripke S , Neale BM , Corvin A , Walters JTR , Farh KH , Holmans PA , Lee P , Bulik-Sullivan B , Collier DA , Huang H , et al. ((2014) ) Biological insights from 108 schizophrenia-associated genetic loci. Nature 511: , 421–427. |
[6] | Márquez-Luna C , Loh PR , Price AL , Kooner JS , Saleheen D , Sim X , Sehmi J , Zhang W , Frossard P , Been LF , Chia KS , Dimas AS , Hassanali N , Jafar T , Jowett JBM , Li X , Radha V , Rees SD , Takeuchi F , Young R , Aung T , Basit A , Chidambaram M , Das D , Grunberg E , Hedman AK , Hydrie ZI , Islam M , Khor CC , Kowlessur S , Kristensen MM , Liju S , Lim WY , Matthews DR , Liu J , Morris AP , Nica AC , Pinidiyapathirage JM , Prokopenko I , Rasheed A , Samuel M , Shah N , Shera AS , Small KS , Suo C , Wickremasinghe AR , Wong TY , Yang M , Zhang F , Abecasis GR , Barnett AH , Caulfield M , Deloukas P , Frayling T , Froguel P , Kato N , Katulanda P , Kelly MA , Liang J , Sanghera DK , Scott J , Seielstad M , Zimmet PZ , Elliott P , Teo YY , McCarthy MI , Danesh J , Tai ES , Chambers JC , Williams AL , Jacobs SBR , MorenoMacías H , Huerta-Chagoya A , Churchouse C , García-Ortíz H , GómezVázquez MJ , Ripke S , Manning AK , Neale B , Reich D , Stram DO , Fernández-López JC , Patterson N , Churchhouse C , Gopal S , Grammatikos JA , Smith IC , Bullock KH , Deik AA , Souza AL , Pierce KA , Clish CB , Martínez-Hernández A , Barajas-Olmos F , Centeno-Cruz F , MendozaCaamal E , Contreras-Cubas C , Revilla-Monsalve C , Islas-Andrade S , Córdova E , Soberón X , González-Villalpando ME , Henderson BE , Monroe K , Wilkens L , Kolonel LN , le Marchand L , Riba L , OrdóñezSánchez ML , Rodríguez-Guillén R , Cruz-Bautista I , Rodríguez-TorresM D , Muñoz-Hernández LL , Gómez D , Alvirde U , Arellano O , Onofrio RC , Brodeur WM , Gage D , Murphy J , Franklin J , Mahan S , Ardlie K , Crenshaw AT , Winckler W , Cortes ML , Burtt NP , Aguilar-Salinas CA , González-Villalpando C , Florez JC , Orozco L , Haiman CA , Tusié-Luna T , Altshuler D ((2017) ) Multiethnicpolygenic risk scores improve risk prediction in diversepopulations. Genet Epidemiol 41: , 811–823. |
[7] | Bandres-Ciga S , Saez-Atienzar S , Kim JJ , Makarious MB , Faghri F , Diez-Fairen M , Iwaki H , Leonard H , Botia J , Ryten M , Hernandez D , Gibbs JR , Ding J , Gan-Or Z , Noyce A , Pihlstrom L , Torkamani A , Soltis AR , Dalgard CL , Scholz SW , Traynor BJ , Ehrlich D , Scherzer CR , Bookman M , Cookson M , Blauwendraat C , Nalls MA , Singleton AB ((2020) ) Large-scale pathway specific polygenic risk and transcriptomic community network analysis identifies novel functional pathways in Parkinson disease. Acta Neuropathol 140: , 341–358. |
[8] | Natarajan P , Young R , Stitziel NO , Padmanabhan S , Baber U , Mehran R , Sartori S , Fuster V , Reilly DF , Butterworth A , Rader DJ , Ford I , Sattar N , Kathiresan S ((2017) ) Polygenic risk score identifies subgroup with higher burden of atherosclerosis and greater relative benefit from statin therapy in the primary prevention setting. Circulation 135: , 2091–2101. |
[9] | Mega JL , Stitziel NO , Smith JG , Chasman DI , Caulfield MJ , Devlin JJ , Nordio F , Hyde CL , Cannon CP , Sacks FM , Poulter NR , Sever PS , Ridker PM , Braunwald E , Melander O , Kathiresan S , Sabatine MS ((2015) ) Genetic risk, coronary heart disease events, and the clinical benefit of statin therapy: An analysis of primary and secondary prevention trials. Lancet 385: , 2264–2271. |
[10] | Abraham G , Havulinna AS , Bhalala OG , Byars SG , de Livera AM , Yetukuri L , Tikkanen E , Perola M , Schunkert H , Sijbrands EJ , Palotie A , Samani NJ , Salomaa V , Ripatti S , Inouye M ((2016) ) Genomic prediction of coronary heart disease. Eur Heart J 37: , 3267–3278. |
[11] | Tada H , Melander O , Louie JZ , Catanese JJ , Rowland CM , Devlin JJ , Kathiresan S , Shiffman D ((2016) ) Risk prediction by genetic risk scores for coronary heart disease is independent of self-reported family history. Eur Heart J 37: , 561–567. |
[12] | Tikkanen E , Havulinna AS , Palotie A , Salomaa V , Ripatti S ((2013) ) Genetic risk prediction and a 2-stage risk screening strategy for coronary heart disease. Arterioscler Thromb Vasc Biol 33: , 2261–2266. |
[13] | Ripatti S , Tikkanen E , Orho-Melander M , Havulinna AS , Silander K , Sharma A , Guiducci C , Perola M , Jula A , Sinisalo J , Lokki ML , Nieminen MS , Melander O , Salomaa V , Peltonen L , Kathiresan S ((2010) ) A multilocus genetic risk score for coronary heart disease: Case-control and prospective cohort analyses. Lancet 376: , 1393–1400. |
[14] | Escott-Price V , Shoai M , Pither R , Williams J , Hardy J ((2017) ) Polygenic score prediction captures nearly all common genetic risk for Alzheimer’s disease. Neurobiol Aging 49: , 214.e7–214.e11. |
[15] | Mormino EC , Sperling RA , Holmes AJ , Buckner RL , de Jager PL , Smoller JW , Sabuncu MR ((2016) ) Polygenic risk of Alzheimer disease is associated with early- and late-life processes. Neurology 87: , 481–488. |
[16] | Marden JR , Mayeda ER , Walter S , Vivot A , Tchetgen EJT , Kawachi I , Glymour MM ((2016) ) Using an Alzheimer disease polygenic risk score to predict memory decline in black and white Americans over 14 years of follow-up. Alzheimer Dis Assoc Disord 30: , 195–202. |
[17] | Desikan RS , Fan CC , Wang Y , Schork AJ , Cabral HJ , Cupples LA , Thompson WK , Besser L , Kukull WA , Holland D , Chen CH , Brewer JB , Karow DS , Kauppi K , Witoelar A , Karch CM , Bonham LW , Yokoyama JS , Rosen HJ , Miller BL , Dillon WP , Wilson DM , Hess CP , Pericak-Vance M , Haines JL , Farrer LA , Mayeux R , Hardy J , Goate AM , Hyman BT , Schellenberg GD , McEvoy LK , Andreassen OA , Dale AM ((2017) ) Genetic assessment of age-associated Alzheimer disease risk: Development and validation of a polygenic hazard score. PLoS Med 14: , e1002258. |
[18] | Tan CH , Hyman BT , Tan JJX , Hess CP , Dillon WP , Schellenberg GD , Besser LM , Kukull WA , Kauppi K , McEvoy LK , Andreassen OA , Dale AM , Fan CC , Desikan RS ((2017) ) Polygenic hazard scores in preclinical Alzheimer disease. Ann Neurol 82: , 484–488. |
[19] | Tan CH , Fan CC , Mormino EC , Sugrue LP , Broce IJ , Hess CP , Dillon WP , Bonham LW , Yokoyama JS , Karch CM , Brewer JB , Rabinovici GD , Miller BL , Schellenberg GD , Kauppi K , Feldman HA , Holland D , McEvoy LK , Hyman BT , Bennett DA , Andreassen OA , Dale AM , Desikan RS ((2018) ) Polygenic hazard score: An enrichment marker for Alzheimer’s associated amyloid and tau deposition. Acta Neuropathol 135: , 85–93. |
[20] | Tan CH , Bonham LW , Fan CC , Mormino EC , Sugrue LP , Broce IJ , Hess CP , Yokoyama JS , Rabinovici GD , Miller BL , Yaffe K , Schellenberg GD , Kauppi K , Holland D , McEvoy LK , Kukull WA , Tosun D , Weiner MW , Sperling RA , Bennett DA , Hyman BT , Andreassen OA , Dale AM , Desikan RS ((2019) ) Polygenic hazard score, amyloid deposition and Alzheimer’s neurodegeneration. Brain 142: , 460–470. |
[21] | Morgan AR , Touchard S , O’Hagan C , Sims R , Majounie E , Escott-Price V , Jones L , Williams J , Morgan BP ((2017) ) The correlation between inflammatory biomarkers and polygenic risk score in Alzheimer’s disease. J Alzheimers Dis 56: , 25–36. |
[22] | ((2021) ) 2021 Alzheimer’s disease facts and figures. Alzheimers Dement 17: , 327–406. |
[23] | Leonenko G , Sims R , Shoai M , Frizzati A , Bossù P , Spalletta G , Fox NC , Williams J , Hardy J , Escott-Price V ((2019) ) Polygenic riskand hazard scores for Alzheimer’s disease prediction. Ann ClinTransl Neurol 6: , 456–465. |
[24] | de Rojas I , Moreno-Grau S , Tesi N , Grenier-Boley B , Andrade V , Jansen IE , Pedersen NL , Stringa N , Zettergren A , Hernández I , et al. ((2021) ) Common variants in Alzheimer’s disease and riskstratification by polygenic risk scores. Nat Commun 12: , 3417. |
[25] | Martin AR , Kanai M , Kamatani Y , Okada Y , Neale BM , Daly MJ ((2019) ) Clinical use of current polygenic risk scores may exacerbate health disparities. Nat Genet 51: , 584–591. |
[26] | Lewis CM , Vassos E ((2020) ) Polygenic risk scores: From research tools to clinical instruments. Genome Med 12: , 44. |
[27] | Choi SW , Mak TSH , O’Reilly PF ((2020) ) Tutorial: A guide to performing polygenic risk score analyses. Nat Protoc 15: , 2759–2772. |
[28] | Dudbridge F ((2013) ) Power and predictive accuracy of polygenic risk scores . PLoS Genet 9: , e1003348. |
[29] | Kullo IJ , Dikilitas O ((2020) ) Polygenic risk scores for diverse ancestries: Making genomic medicine equitable. J Am Coll Cardiol 76: , 715–718. |
[30] | Oetjens MT , Kelly MA , Sturm AC , Martin CL , Ledbetter DH ((2019) ) Quantifying the polygenic contribution to variable expressivity in eleven rare genetic disorders. Nat Commun 10: , 4897. |
[31] | Chatterjee N , Wheeler B , Sampson J , Hartge P , Chanock SJ , Park JH ((2013) ) Projecting the performance of risk prediction based on polygenic analyses of genome-wide association studies. Nat Genet 45: , 400–405. |
[32] | Alzheimer’s Association (2021) What is Alzheimer’s Disease? https://www.alz.org/alzheimers-dementia/whatis-alzheimers. |
[33] | Huq AJ , Fulton-Howard B , Riaz M , Laws S , Sebra R , Ryan J , Alzheimer’s Disease Genetics Consortium, Renton AE , Goate AM , Masters CL , Storey E , Shah RC , Murray A , McNeil J , Winship I , James PA , Lacaze P ((2021) ) Polygenic score modifies risk for Alzheimer’s disease in APOE ɛ4 homozygotes at phenotypic extremes. Alzheimers Dement (Amst) 13: , e12226. |
[34] | Farrer LA , Cupples LA , Haines JL , Hyman B , Kukull WA , Mayeux R , Myers RH , Pericak-Vance MA , Risch N , van Duijn CM ((1997) ) Effects of age, sex, and ethnicity on the association between apolipoprotein E genotype and Alzheimer disease: A meta-analysis. J Am Med Assoc 278: , 1349–1356. |
[35] | Felsky D , Patrick E , Schneider JA , Mostafavi S , Gaiteri C , Patsopoulos N , Bennett DA , de Jager PL ((2018) ) Polygenic analysis of inflammatory disease variants and effects on microglia in the aging brain. Mol Neurodegener 13: , 38. |
[36] | Kunkle BW , Grenier-Boley B , Sims R , Bis JC , Damotte V , Naj AC , Boland A , Vronskaya M , van der Lee SJ , Amlie-Wolf A , et al. ((2019) ) Author Correction: Genetic meta-analysis of diagnosed Alzheimer’s disease identifies new risk loci and implicates Aβ, tau, immunity and lipid processing. Nat Genet 51: , 414–430. |
[37] | Sims R , van der Lee SJ , Naj AC , Bellenguez C , Badarinarayan N , Jakobsdottir J , Kunkle BW , Boland A , Raybould R , Bis JC , et al. ((2017) ) Rare coding variants in PLCG2, ABI3, and TREM2 implicate microglial-mediated innate immunity in Alzheimer’s disease. Nat Genet 49: , 1373–1384. |
[38] | Lambert JC , Ibrahim-Verbaas CA , Harold D , Naj AC , Sims R , Bellenguez C , Jun G , DeStefano AL , Bis JC , Beecham GW , et al. ((2013) ) Meta-analysis of 74,046 individuals identifies 11 new susceptibility loci for Alzheimer’s disease. Nat Genet 45: , 1452–1458. |
[39] | Goldacre MJ , Wotton CJ ((2017) ) Associations between specific autoimmune diseases and subsequent dementia: Retrospective record-linkage cohort study, UK. J Epidemiol Community Health 71: , 576–583. |
[40] | Pain O , Glanville KP , Hagenaars SP , Selzam S , Furtjes AE , Gaspar HA , Coleman JRI , Rimfeld K , Breen G , Plomin R , Folkersen L , Lewis CM ((2021) ) Evaluation of polygenic prediction methodology within a reference-standardized framework. PLoS Genet 17: , e1009021 |
[41] | Euesden J , Lewis CM , O’Reilly PF ((2015) ) PRSice: Polygenic Risk Score software. Bioinformatics 31: , 1466–1468. |
[42] | Choi SW , O’Reilly PF ((2019) ) PRSice-2: Polygenic risk score software for biobank-scale data. Gigascience 8: , giz082. |
[43] | Andrews SJ , Fulton-Howard B , O’Reilly P , Marcora E , Goate AM , Farrer LA , Haines JL , Mayeux R , Naj AC , Pericak-Vance MA , Schellenberg GD , Wang LS ((2020) ) Causal associations between modifiable risk factors and the Alzheimer’s phenome. Ann Neurol 89: , 54–65. |
[44] | Vilhjálmsson BJ , Yang J , Finucane HK , Gusev A , Lindström S , Ripke S , Genovese G , Loh PR , Bhatia G , Do R , et al. ((2015) ) Modelinglinkage disequilibrium increases accuracy of polygenic risk scores. Am J Hum Genet 97: , 576–592. |
[45] | Ge T , Chen CY , Ni Y , Feng YCA , Smoller JW ((2019) ) Polygenic prediction via Bayesian regression and continuous shrinkage priors. Nat Commun 10: , 1776. |
[46] | Lloyd-Jones LR , Zeng J , Sidorenko J , Yengo L , Moser G , Kemper KE , Wang H , Zheng Z , Magi R , Esko T , Metspalu A , Wray NR , Goddard ME , Yang J , Visscher PM ((2019) ) Improved polygenic prediction by Bayesianmultiple regression on summary statistics. Nat Commun 10: , 5086. |
[47] | Nguyen TV , Eisman JA ((2020) ) Post-GWAS polygenic risk score: Utility and challenges. JBMR Plus 4: , e10411. |
[48] | Torkamani A , Wineinger NE , Topol EJ ((2018) ) The personal and clinical utility of polygenic risk scores. Nat Rev Genet 19: , 581–590. |
[49] | Zhou X , Li YYT , Fu AKY , Ip NY ((2021) ) Polygenic score models for Alzheimer’s disease: From research to clinical applications. Front Neurosci 15: , 650220. |
[50] | Cook NR , Ridker PM ((2016) ) Calibration of the pooled cohort equations for atherosclerotic cardiovascular disease: An update. Ann Intern Med 165: , 786–794. |
[51] | Rana JS , Tabada GH , Solomon MD , Lo JC , Jaffe MG , Sung SH , Ballantyne CM , Go AS ((2016) ) Accuracy of the atherosclerotic cardiovascular risk equation in a large contemporary, multiethnic population. J Am Coll Cardiol 67: , 2118–2130. |
[52] | Mostafavi H , Harpak A , Agarwal I , Conley D , Pritchard JK , Przeworski M ((2020) ) Variable prediction accuracy of polygenic scores within an ancestry group. Elife 9: , e48376. |
[53] | Tosto G , Bird TD , Tsuang D , Bennett DA , Boeve BF , Cruchaga C , FaberK , Foroud TM , Farlow M , Goate AM , Bertlesen S , Graff-Radford NR , Medrano M , Lantigua R , Manly J , Ottman R , Rosenberg R , Schaid DJ , Schupf N , Stern Y , Sweet RA , Mayeux R ((2017) ) Polygenic risk scores in familial Alzheimer disease. Neurology 88: , 1180–1186. |
[54] | Sariya S , Felsky D , Reyes-Dumeyer D , Lali R , Lantigua RA , Vardarajan B , Jiménez-Velázquez IZ , Haines JL , Shellenberg GD , Pericak-Vance MA , Paré G , Mayeux R , Tosto G ((2021) ) Polygenicrisk score for Alzheimer’s disease in Caribbean Hispanics. AnnNeurol 90: , 366–376. |
[55] | Beekly DL , Ramos EM , van Belle G , Deitrich W , Clark AD , Jacka ME , Kukull WA ((2004) ) The National Alzheimer’s Coordinating Center (NACC) database: An Alzheimer disease database. Alzheimer Dis Assoc Disord 18: , 270–277. |
[56] | International Schizophrenia Consortium, Purcell S , Wray N , Stone J , Visscher P , O’Donovan M , Sullivan P , Sklar P ((2009) ) Common polygenic variation contributes to risk of schizophrenia that overlaps with bipolar disorder. Nature 460: , 748–752. |

