
Clinical Utility of Cerebrospinal Fluid Aβ42 and Tau Measures in Diagnosing Mild Cognitive Impairment in Early Onset Dementia
Abstract
Background:
The differentiation of a preclinical or prodromal Alzheimer’s disease (AD) is challenging particularly in patients with early onset Alzheimer’s or related dementias (EOARD). We report our experience on diagnostic lumbar puncture to diagnose EOARD at a tertiary neurocognitive referral center in Nottingham, England from March 2018 to October 2020.
Objective:
To assess amyloid-β42 (Aβ42), total tau, and Thr181-phosphorylated tau (p-tau) measurements in the cerebrospinal fluid (CSF) in patients with mild cognitive impairment (MCI) and in relation to their follow-up cognitive performance.
Methods:
Thirty participants aged 32–68 years old (mean 59 years; 57% female) were included. Clinical diagnosis was based on clinical presentation, neurocognitive profile, neuroradiological features (MRI, FDG-PET CT) and CSF Aβ42, total tau, and p-tau measurements.
Results:
Patients with MCI who progressed to AD (prodromal AD) had significantly higher CSF total (797.63 pg/ml) and p-tau (82.31 pg/ml), and lower Aβ42 levels (398.94 pg/ml) in comparison to their counterparts with stable MCI (total tau 303.67 pg/ml, p-tau 43.56 pg/ml, Aβ42 873.44 pg/ml) (p < 0.01 for CSF total and p-tau measures and p < 0.0001 for CSF Aβ42 measures). None of the CSF biomarkers correlated with any of the cognitive performance measures. Principal component analysis confirmed that the clinical diagnosis of MCI secondary to AD, namely prodromal AD (as per NIA-AA criteria) in younger adults, was associated with decreased CSF Aβ42.
Conclusion:
In early onset AD, low levels of CSF Aβ42 appear to be more sensitive than total and p-tau measures in differentiating AD MCI from other forms of dementia. Further work on larger samples of EOARD in clinical practice will address the cost effectiveness of making an earlier diagnosis.
INTRODUCTION
The differentiation of preclinical or prodromal Alzheimer’s disease (AD) can be challenging particularly in patients with early onset Alzheimer’s and related dementias (EOARD). The first clinical symptoms of AD during the prodromal phase are subjective mild cognitive impairment (MCI), that, in some, may present with features consistent with depression [1] or anxiety [2], which can cause hindrance in diagnosing EOARD at the early stage. After screening for objective cognitive impairment and appropriate investigations to exclude clinical mimics, some will be diagnosed with MCI.
On average, the conversion from AD MCI (i.e., MCI secondary to prodromal AD) to dementia takes five years, although some patients may remain stable over a prolonged period of time [3]. During this period, patients may be monitored annually by clinical services without the support that is appropriate for their employment and advanced planning, and these provisions are particularly relevant for those below the age of 65. Depending on the regional clinical services, patients with MCI may have multiple referrals between their general practitioners, memory clinics, and neurology services until they eventually progress to dementia. The long prodromal phase of uncertainties has an impact on patients’ lives as well as financial bearing upon the National Health Service (NHS) resources due to multiple assessments and investigations to differentiate normal aging from a prodromal AD.
During this prodromal phase, however, there are biochemical changes in the brain which are also reflected in the cerebrospinal fluid (CSF). Decreased levels of amyloid-β42 (Aβ42) or Aβ42/Aβ40 ratio in the CSF are well-established markers of AD that can be identified up to 15 years before the onset of AD [4]. Elevations of tau in the CSF, a marker of axonal damage, is another AD biomarker [5]. The presence of Aβ42 and tau abnormalities in the CSF has 95% sensitivity and 87% specificity to predict conversion of MCI to AD dementia [6].
The initial studies on CSF Aβ42 and tau proteins reported similar lower levels of Aβ42 between early and late onset established AD, but significantly higher total and phosphorylated tau (p-tau) protein in the early onset AD [7]. However, studies of the early stages of AD, i.e., prodromal AD with MCI, are underreported in younger adults. In a study of 308 people with MCI (<70 years), including mixed early and late onset MCI, a great overlap was reported in measurements across different diagnostic states [8], but no attempt was made to address whether any of the analyzed CSF biomarkers were related to the age of presentation with MCI. Thus, it remains largely unknown whether the CSF biomarker profile is similar between the early onset and the late onset AD. Since the progression and cognitive impairment are more expeditious in the early onset AD dementia compared to the late onset dementia, it is reasonable to expect that they may differ at a molecular and biomarker level.
In the current study, we address the CSF biomarker profile in early onset MCI patients who attended a tertiary neurocognitive referral center. In the absence of firm data regarding the CSF expression of Aβ42 and tau in early onset MCI secondary to AD, we analyzed these biomarker measures in relation to patients’ cognitive performance and age at the time of the MCI diagnosis and compared them with those of age-matched adults with stable MCI (sMCI).
MATERIALS AND METHODS
Participant recruitment
All participants in the current study came from the EOARD clinic at the Queen’s Medical Centre in Nottingham. This NHS tertiary referral Centre consists of a multidisciplinary team of Specialist Consultants in neurology, psychiatry, psychology, neuroradiology, and nuclear medicine, as well as allied healthcare professionals, such as occupational therapists, dementia nurses, and support workers. The Centre serves patients from primary and secondary health care services, memory clinics, psychiatry, clinical psychology, and general neurology services.
On average, 450 patients with cognitive symptoms in the absence of known causes (i.e., alcohol abuse, brain trauma, major depression, etc.) are annually referred and assessed at the Centre. A multi-disciplinary approach is used for uncertain or complex cases to consider further investigations including a diagnostic lumbar puncture for CSF studies. Patients with overt dementia are deemed unnecessary or non-capacitated to have a diagnostic lumbar puncture unless a neuroinflammatory, prion, or infectious cause is suspected according to the NICE guidelines [9].
For this study, we included 30 patients with the onset of cognitive symptoms under the age of 65 years, who attended the Service from March 2018 to October 2020. The clinical diagnosis of AD or other dementia syndrome was based on clinical and neuroradiological assessments, including neurocognitive examinations, multimodal MRI, positron emission tomography with 2-[fluorine-18] fluoro-2-deoxy-D-glucose (FDG-PET CT) of the brain and CSF studies of Aβ42, total tau, and Thr181-phosphorylated tau (p-tau) to characterize MCI etiology. Further follow up under the clinical service monitored the stability or progression of cognitive decline to confirm an underlying neurodegeneration.
The study was reviewed and approved by the East Midlands-Derby Research Ethics Committee (Ref:18/EM/0292) and also had an approval from the UK Health Research Authority. Informed consent was obtained from all participants to include and analyze their clinical data.
Clinical and cognitive assessments
Twenty-six out of the 30 participants who had diagnostic lumbar puncture also had neurocognitive testing results available from local hospital records (Table 1). Four patients did not undergo further cognitive assessment in the clinic due to previous assessments at other centers. Of these 26 patients, 21 agreed to have an additional neurocognitive battery for assessments of memory, attention, language, praxis, and number abilities with the Birmingham Cognitive Screen (BCoS) for research purposes [10]. Five participants did not opt into lengthy BCoS assessment due to multiple previous cognitive tests in the primary and secondary care settings. For these 5 patients, other clinical neurocognitive assessments were used for analysis, including Addenbrooke’s Cognitive Examination-Revised version III (ACE-R III) [11], Montreal Cognitive Assessment [12], Repeatable Battery for the Assessment of Neuropsychological Status [13], and Warrington’s Recognition memory task [14].
Table 1
Demographics data for the study population. Data were obtained from clinical records
| Parameters | All (n = 30) | AD (n = 16) | Stable MCI (n = 9) | Other neurodegenerative conditions (n = 5) |
| Gender, female (%) | 56.67 | 56.25 | 77.78 | 20 |
| Age at diagnosis: mean [range], (y) | 58 [31–67] | 56 [52–64] | 58 [51–66] | 53 [31–67] |
| Years in education: mean [range] | 13 [8–19] | 14 [10–18] | 14 [11–19] | 12 [8–16] |
| Smokers/ex-smokers [smokers/ex-smokers % ] | 3 [10] | 1 [6] | 0 [0] | 2 [40] |
| Previous alcohol excess [Previous alcohol excess [% ] | 2 [6.67] | 2 [12.5] | 0 [0] | 0 [0] |
| Mental health symptoms* (%) | 50 | 43.75 | 66.66 | 40 |
| Cardiovascular disorders (%) | 26.66 | 25 | 33.33 | 20 |
| Diabetes (%) | 10 | 0 | 22.22 | 20 |
| Time between symptom onset and presentation to clinic: mean [range], (y) | 3 [0–6] | 2 [0–4] | 4 [1–6] | 3 [2–4] |
| Memory Impairment (%) | 73.1 | 71.4 | 71.4 | 80 |
| Attention Impairment (%) | 34.6 | 42.9 | 0 | 60 |
| Language Impairment (%) | 23.1 | 35.7 | 0 | 20 |
| Executive Dysfunction (%) | 20.8 | 16.7 | 14.3 | 40 |
| Patients with disease progression from first to most recent clinic (%) | 46.67 | 56.25 | 22.22 | 60 |
| Months between initial clinic appointment and most recent follow up appointment [range] | 17 [5–30] | 17 [5–30] | 17 [5–30] | 20 [10–28] |
*Mental health symptoms included the diagnosis of depression, anxiety, or mental health disorders.
Patients were classified into three groups according to their clinical diagnosis: a) Prodromal AD - NIA-AA Research Framework Alzheimer’s Disease (n = 16) [15]; b) sMCI, impairment in cognitive battery with no evidence of neurodegeneration on physical examination, neuroimaging studies, or abnormal levels of Aβ42/tau in the CSF (n = 9); and c) Other neurodegenerative conditions included: frontotemporal dementia, corticobasal degeneration, Lewy body dementia, and mental health disorder (n = 5).
All patients with prodromal AD provided consent to have dementia gene panel including mutations of APP, PSEN1, and PSEN2. None of them had a known inherited abnormal mutation, and therefore all the cases in this study were classified as early onset sporadic AD. Patients remained under the care of the clinical service for at least 5 months (up to 30 months, Table 1) to ensure appropriate support is provided. Cognitive assessments were repeated during the follow-up to monitor their progression and match patients’ clinical need and support. The final clinical and neurocognitive assessment was used as the measure of progression.
CSF studies
The participants had a lumbar puncture at the Neuroscience’s Day Case Unit, Queen’s Medical Centre. Standard NHS protocols were followed to obtain CSF samples [16]. The analysis of cell count, protein, and infectious screening of the CSF samples was performed in the local clinical pathology laboratory. Aliquoted frozen CSF was transferred to an NHS approved laboratory (The CSF Dementia Biomarker Service at the NHS Neuroimmunology and CSF Laboratory, University College London) to measure Aβ42, total tau, and p-tau levels, using the INOTEST platform [17]. The reference laboratory [18] set up their own normal levels of Aβ42 (627–1322 pg/ml), total tau (146–595 pg/ml), and Thr181p-tau (below 68 pg/ml), and these were used as control/normal values in absence of a control clinical group in the current study. At the time of the study, the approved CSF Dementia Biomarker Service laboratory did not offer CSF Aβ40 measures, and the Aβ42/Aβ40 ratio, used as a measure of cerebral amyloid deposition, could not be established.
Statistical analysis
Differences in demographics and cognitive domains between three groups of patients including prodromal AD, sMCI, and other neurodegenerative disorders were analyzed employing the analysis of covariance (ANOVA). To determine the relationship between CSF analytes and age, Pearson Correlation analysis and Polynomial regression analysis were used. These statistical analyses were performed using SPSS for Windows (version 28.0; SPSS, Chicago, IL); p <0.05 was considered significant.
Principal component analysis (PCA) was performed to study the relationship between clinical measures and the CSF total tau, p-tau, and Aβ42 levels. This descriptive analysis helps observe clusters which can have a biological meaning. The aim was to find separate clusters for patients with prodromal AD and those with sMCI and use the obtained data for the diagnosis of each individual patient. The data that was obtained from the PCA plot was used to produce formulas (an algorithm, Supplementary Figure 1) in order to possibly segregate similar patients between the diagnostic groups.
The PCA analysis utilized the data for a total of 30 patients (summarized in Table 1) including 9 patients described as sMCI, 16 patients diagnosed with prodromal AD, and 5 patients classified in the “Other” diagnostic group. The latter represented dementia with Lewy body, frontotemporal dementia, corticobasal degeneration, and mental health disorder with autism background (Fig. 1).
Fig. 1
Linear regression analysis between protein biomarker levels. A) Phospho-tau to total-tau correlation: p = 2.973e-10; correlation coefficient = 0.895; R-squared=0.80. B) Amyloid-β to total-tau correlation: p = 0.004554; correlation coefficient = 0.511; R-squared=0.2344. C) Amyloid-β to phospho-tau correlation: p = 0.001903; correlation coefficient = 0.570; R-squared=0.3251.
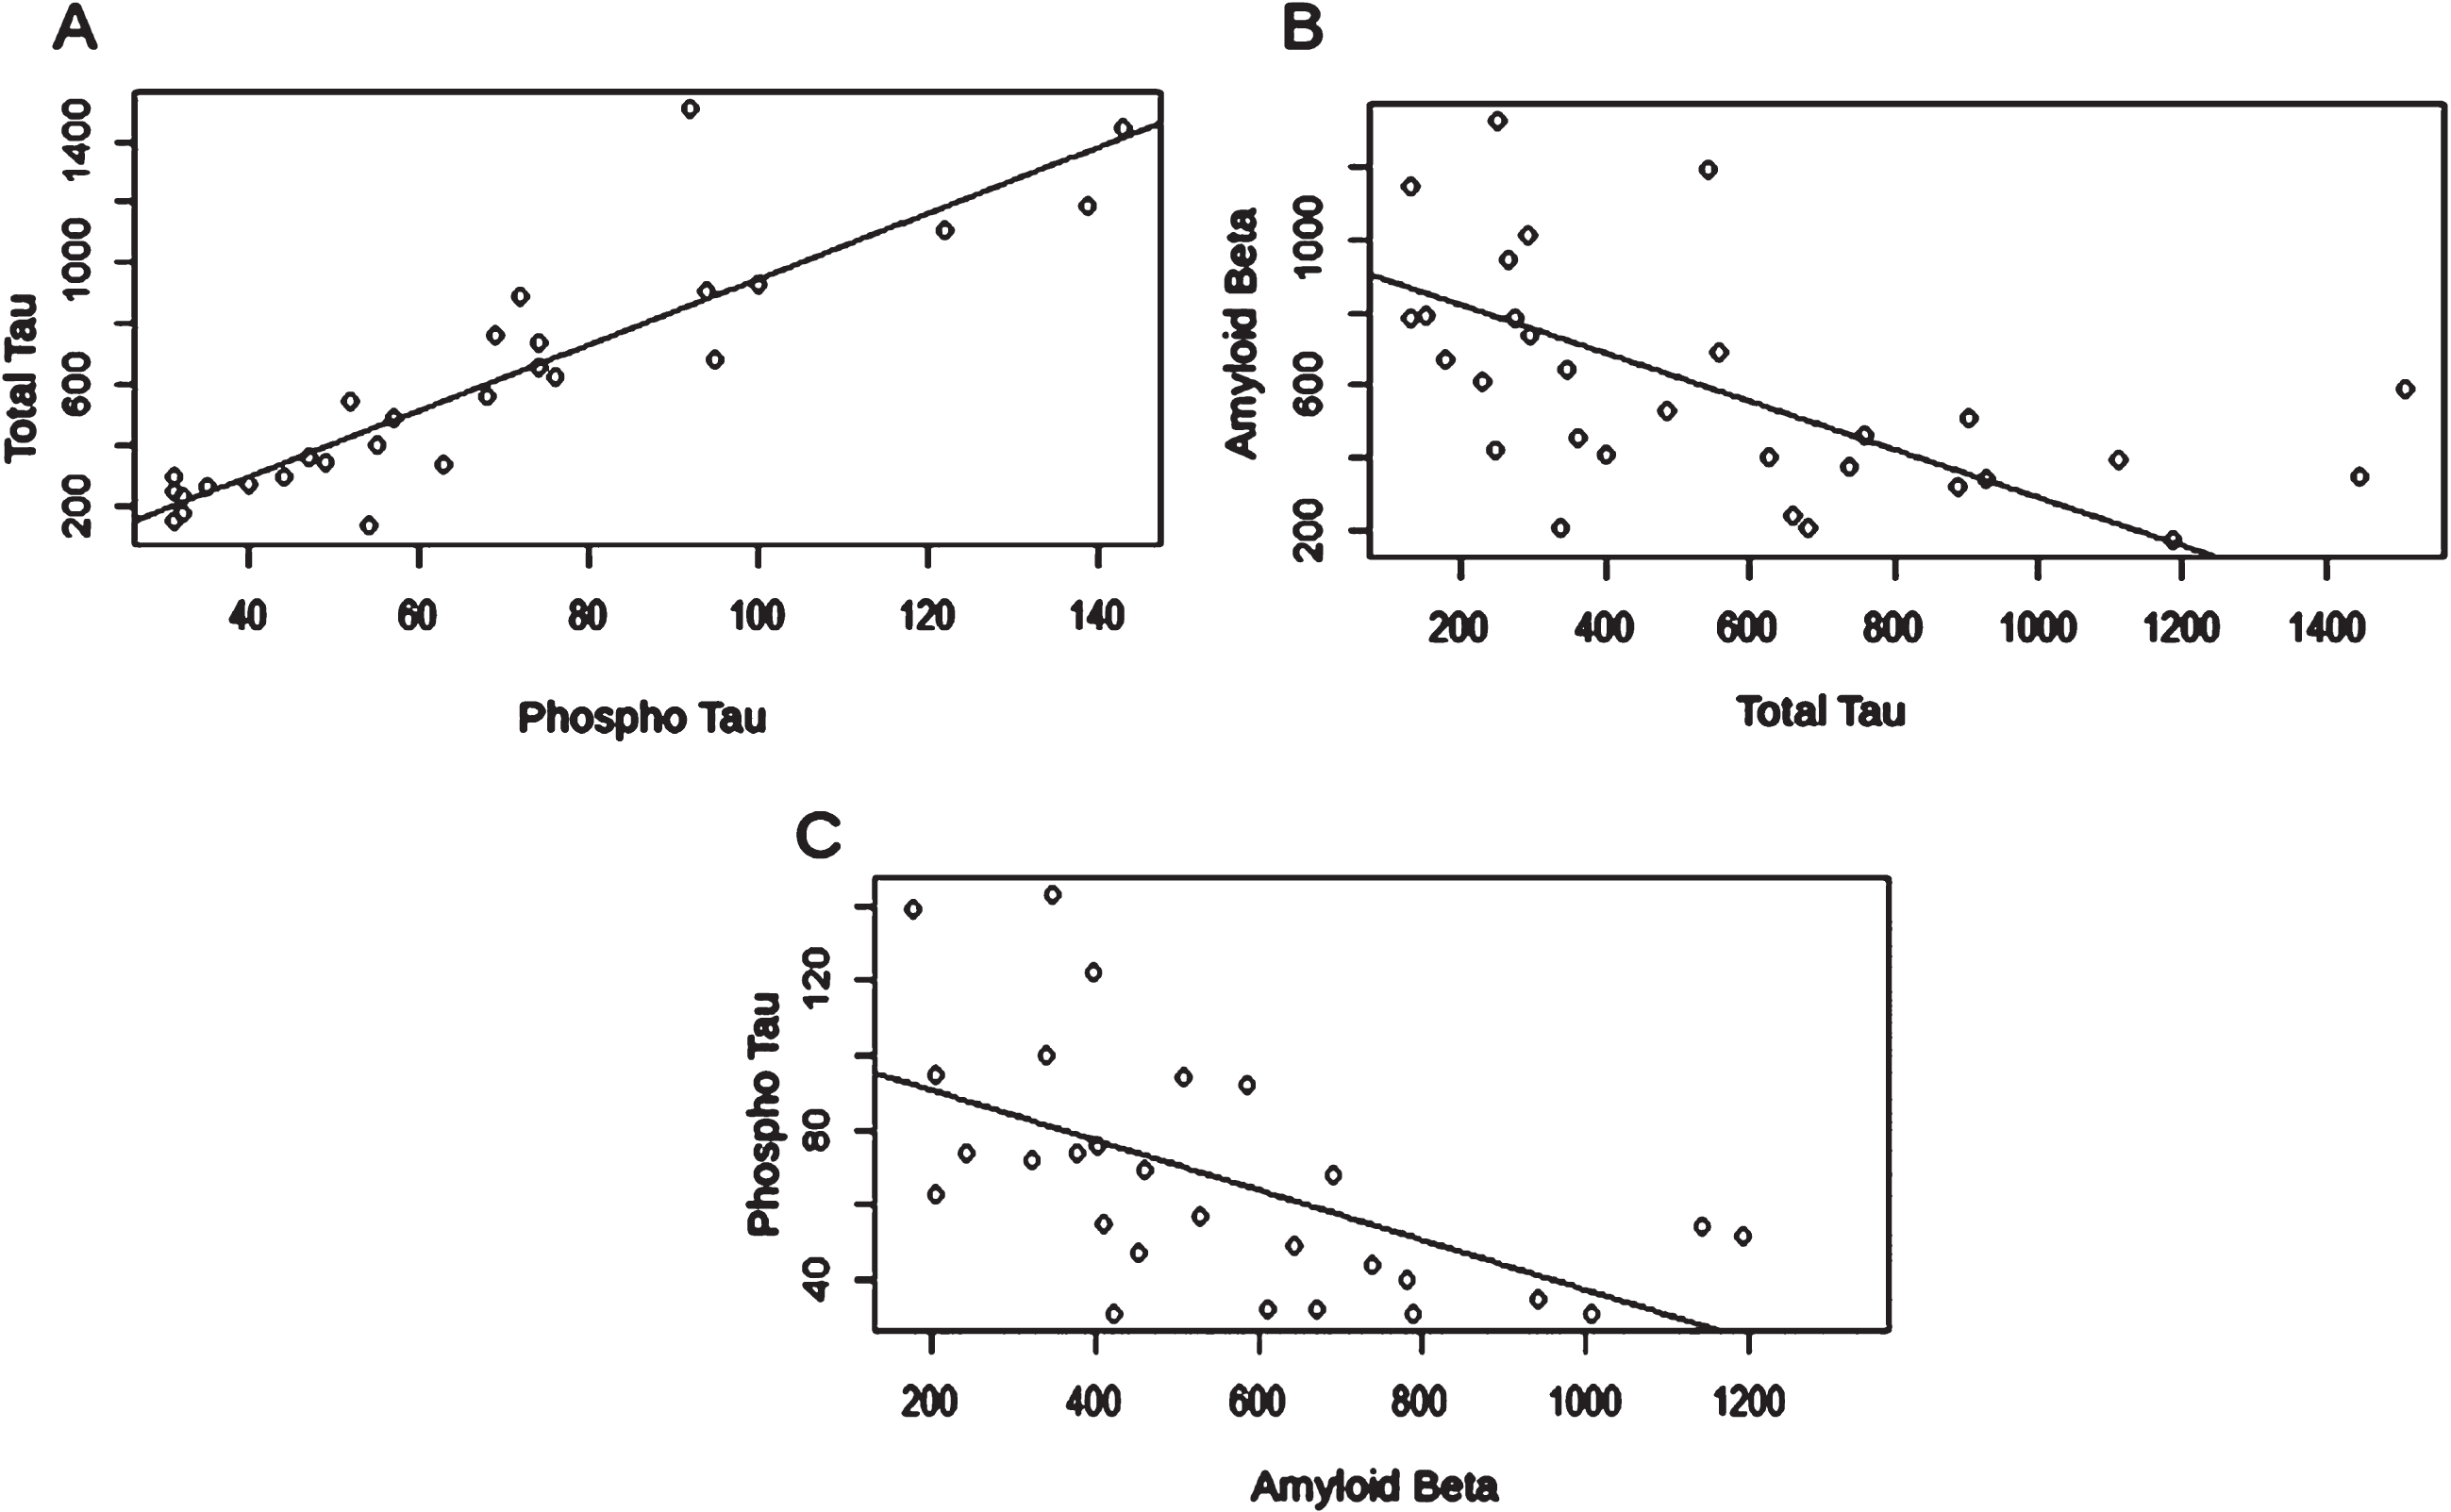
The PCA scores (Fig. 1) corresponded to the patients’ CSF total tau and Aβ42 levels minus the mean of all the patients analyzed in the PCA multiplied by the rotation. The analysis was carried out in Rstudio using the prcomp method [19–21].
To differentiate patients with prodromal AD from sMCI in this study, minimal sample sizes were calculated to obtain meaningful differences between the means of the Aβ42 and total tau.
RESULTS
Clinical measures of cognitive changes
Although none of the patients in the sMCI group showed impaired language or attention, over 70% of patients had memory impairment, irrespective of their diagnosis, with similar levels of executive dysfunction in prodromal AD and sMCI (16.7% and 14.3%, respectively) (Table 1). Thus, in this study population, patients with early-stage or prodromal AD could not be clearly distinguished from those with sMCI based on initial cognitive testing alone.
As in older people, the CSF tau and Aβ42 measures followed the well-known distribution of lower Aβ42 and higher total and p-tau levels in patients with prodromal AD (Table 2, Supplementary Figure 2). These were significantly different from the sMCI group, with only the p-tau that did not reach statistical significance (p = 0.065).
Table 2
Group differences in respect to age and CSF biomarkers
| Measures | MCI-AD (n = 16) | Stable MCI (n = 9) | Other (n = 4)a | F | p |
| Age (<68 y) | 58.56 + 1.19 | 57.67 + 2.24 | 59.50 + 3.38 | 0.489 | 0.783 |
| Total protein* | 487.93 + 53.04 | 537.50 + 45.72 | 528.25 + 34.22 | 0.205 | 0.817 |
| Total tau (146–595 pg/ml) | 797.63 + 95.66 | 303.67 + 51.99 | 315.00 + 45.24 | 10.414 | 0.005 |
| (MCI-AD versus stable MCI p = 0.001) | |||||
| p-tau (<68 pg/ml) | 82.31 + 8.34 | 43.56 + 4.32 | 54.00 + 5.51 | 11.557 | 0.003 |
| MCI-AD versus stable MCI p = 0.001; MCI-AD versus Other, p = 0.065 | |||||
| Aβ142 (627–1322 pg/ml)* | 398.94 + 31.70 | 873.44 + 68.58 | 669.75 + 244.54 | 13.340 | 0.0001 |
| (MCI-AD versus stable MCI 0.0001) |
Kruskal-Wallis used for nonparametric analysis for age, total tau and p-tau, whereas ANOVA (*) for total CSF protein measures and A-β142. aA middle-aged patient with attention deficit hyperactivity disorder was an outlier and removed from the CSF analysis.
Linear regression between CSF biomarkers
Correlation analysis was carried out to assess if there was a significant correlation between the CSF measures. As expected, p-tau and total tau had a strong positive linear correlation. There was also a statistically significant negative correlation between Aβ42 and both total tau and p-tau (Fig. 1). CSF biomarker results for all study participants can be seen in Table 3.
Table 3
CSF biomarker values for study participants
| ID | p-Tau (pg/ml) | Total Tau (pg/ml) | Aβ142 (pg/ml) |
| AD1 | 100 | 927 | 339 |
| AD2 | 95 | 682 | 205 |
| AD3 | 139 | 1188 | 176 |
| AD4 | 32 | 228 | 612 |
| AD5 | 72 | 890 | 323 |
| AD6 | 57 | 485 | 529 |
| AD7 | 76 | 628 | 404 |
| AD8 | 74 | 660 | 242 |
| AD9 | 94 | 903 | 507 |
| AD10 | 122 | 1111 | 397 |
| AD11 | 143 | 1447 | 347 |
| AD12 | 47 | 361 | 454 |
| AD13 | 69 | 758 | 460 |
| AD14 | 31 | 248 | 423 |
| AD15 | 74 | 737 | 378 |
| AD16 | 92 | 1509 | 587 |
| s-MCI1 | 32 | 178 | 671 |
| s-MCI2 | 40 | 273 | 781 |
| s-MCI3 | 52 | 542 | 1192 |
| s-MCI4 | 49 | 345 | 644 |
| s-MCI5 | 54 | 130 | 1142 |
| s-MCI6 | 35 | 264 | 942 |
| s-MCI7 | 68 | 557 | 692 |
| s-MCI8 | 31 | 293 | 1008 |
| s-MCI9 | 31 | 151 | 789 |
| OC1 | 44 | 293 | 739 |
| OC2 | 63 | * | 205 |
| OC3 | * | 128 | 783 |
| OC4 | 55 | 402 | 410 |
| OC5 | * | 250 | 1325 |
*CSF analysis conducted as part of clinical assessment within NHS. Tau testing not requested for all participants.
CSF biomarkers and age
The linear regression analysis on the total group of 29 participants (age range 55 to 68 years of age) did not show any significant relationship of CSF measures with age, though indicated a nonsignificant decline in p-tau and total tau measures with age (r = –0.416, p = 0.467, and r = –0.021, p = 0.914, respectively; Fig. 2A, B). In contrast, the CSF Aβ42 and total CSF protein measures tended to increase with age, albeit not reaching statistical significance (r = 0.116, p = 0.550 and r = 0.267, p = 0.198, respectively; Fig. 2C, D).
Fig. 2
Polynomial regression analysis for CSF biomarkers and age. CSF phosphorylated tau protein (r2 = 0.288; F = 5.057, p = 0.014) (A); CSF Total tau protein (r2 = 0.245; F = 4.050, p = 0.030) (B); CSF Amyloid protein (r2 = 0.047, F = 0.640, p = 0.535) (C); CSF Total protein content (r2 = 0.080; F = 0.951, p = 0.402) (D).
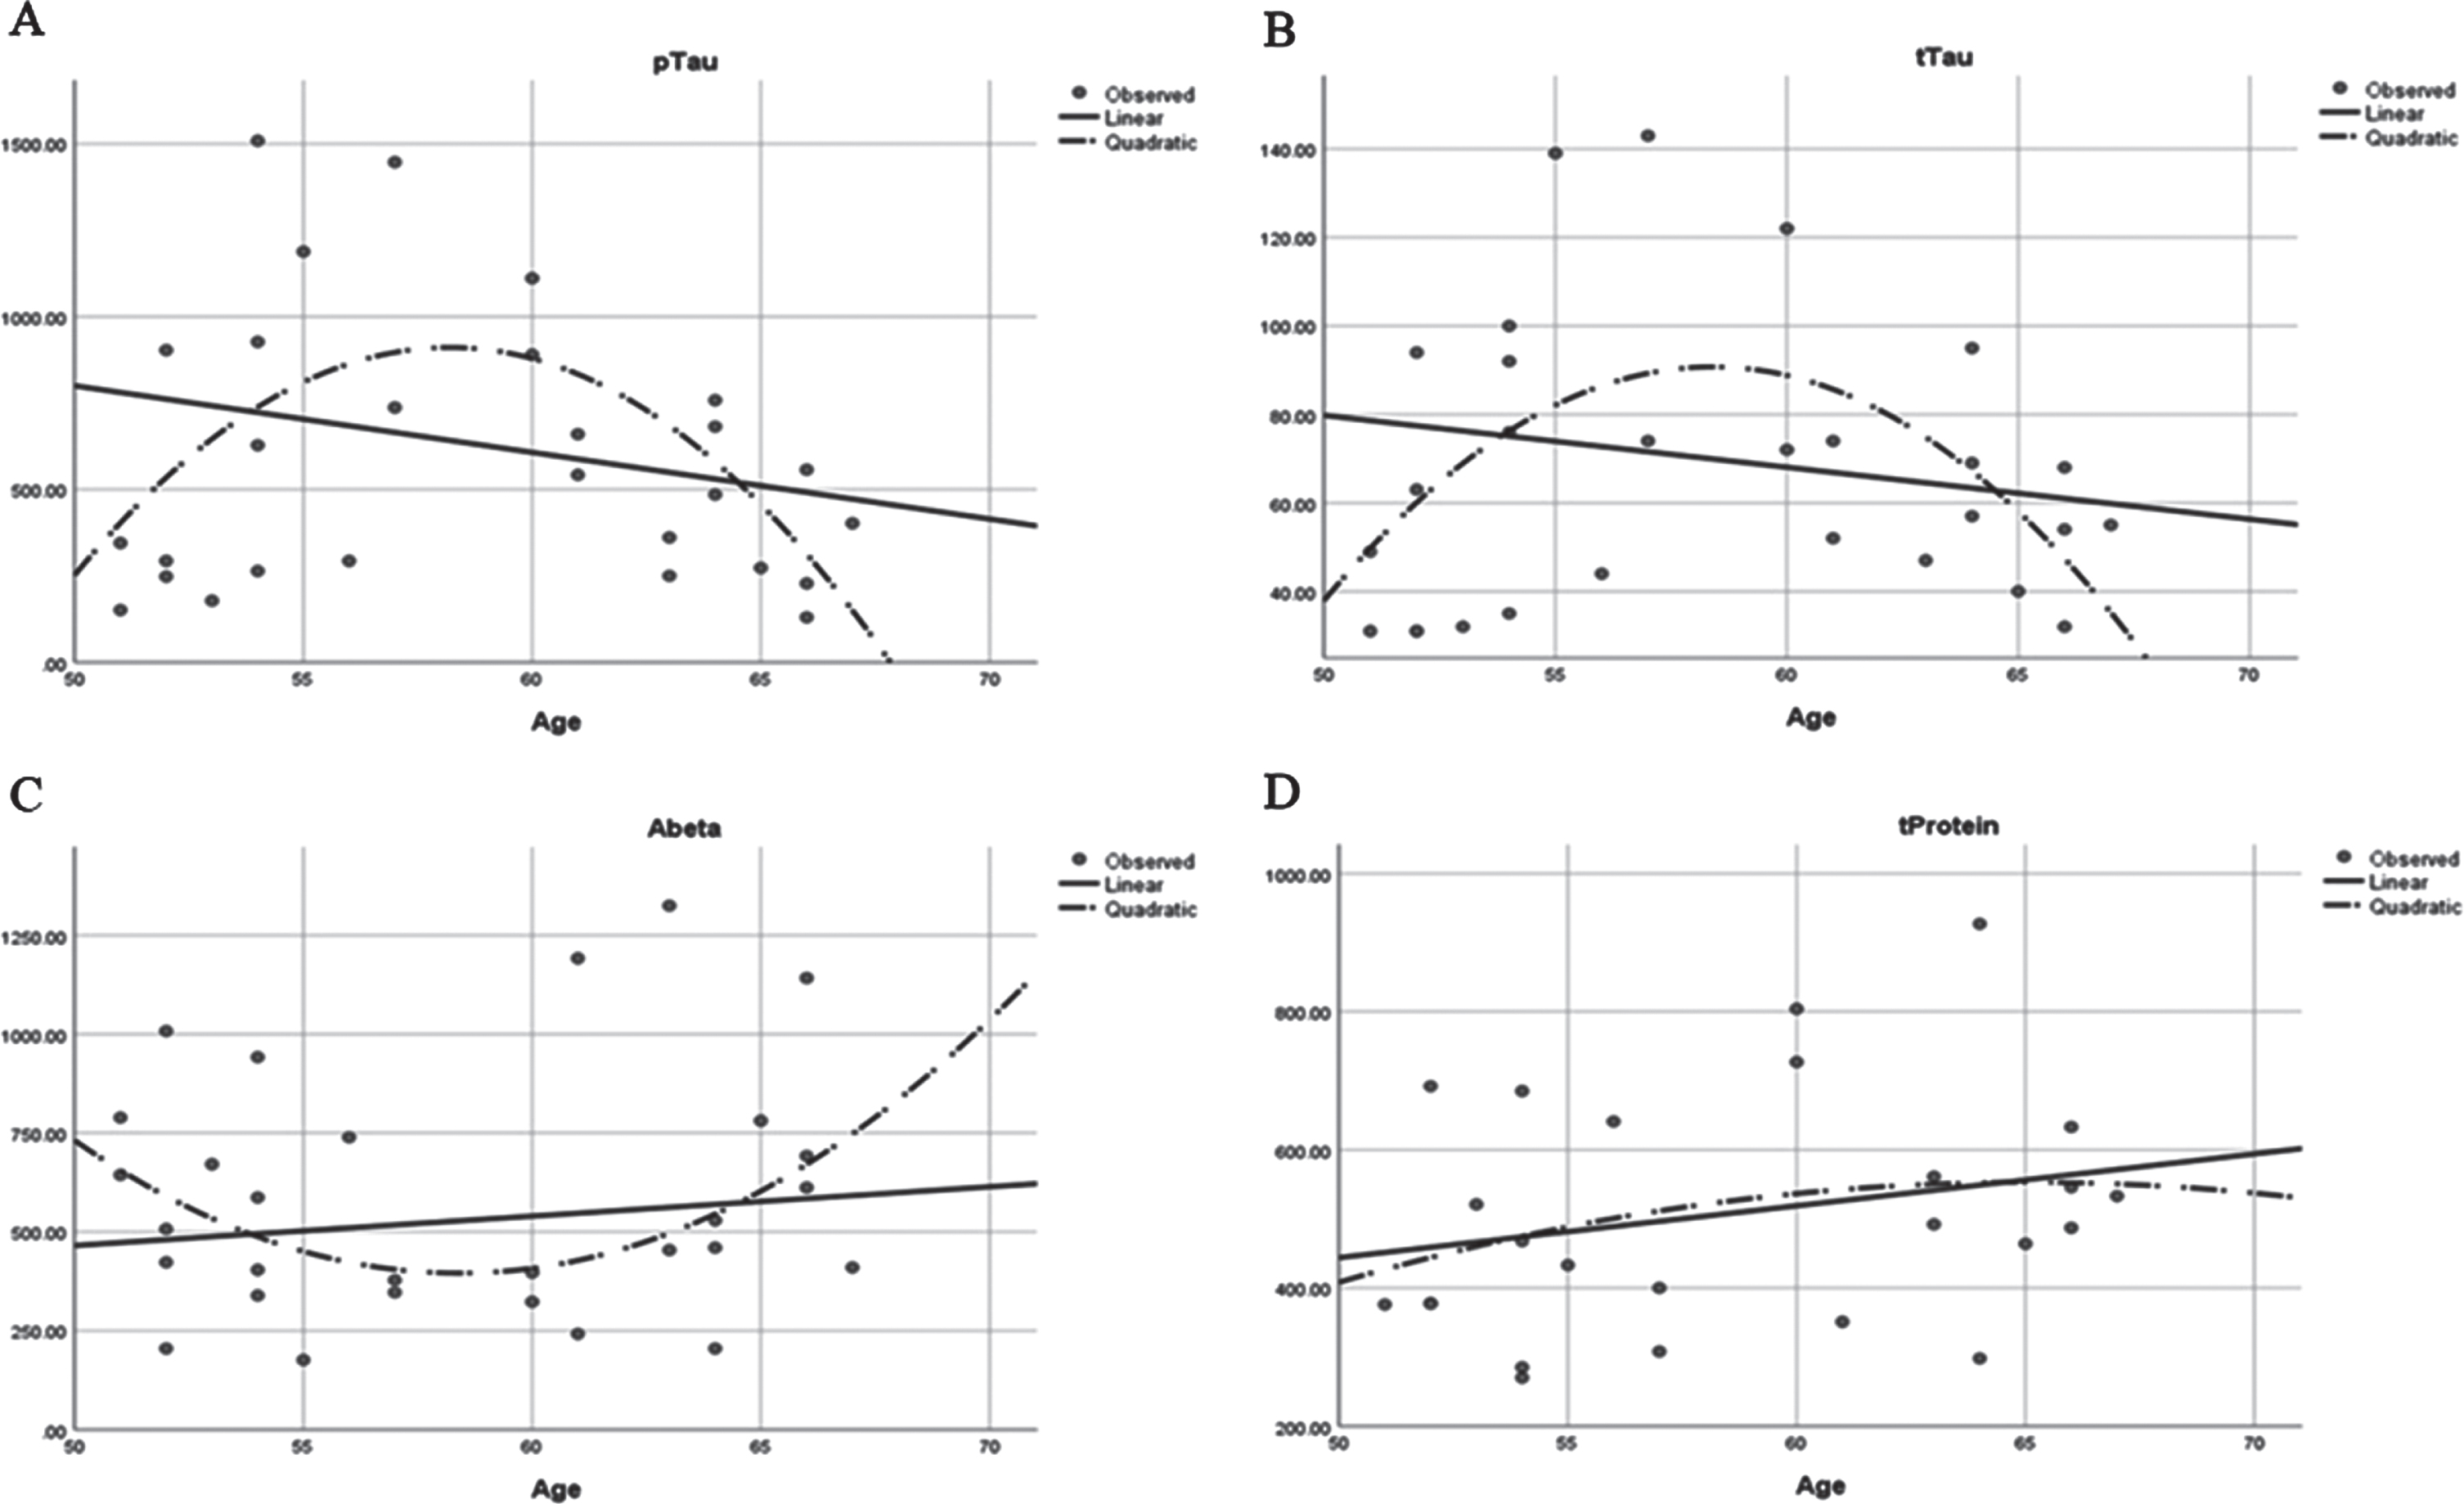
The low R2 values of the linear regression model indicated that the response between the predictor value (age) and the response variables (CSF Aβ42 and tau protein measures) are more complex than just a simple linear relationship, and that polynomial regression analysis may be required. Indeed, quadratic regression analysis better demonstrated the nonlinear relationship between the analyzed variables, and showed a significance between age and CSF total, p-tau, and Aβ42 CSF measures (Figs. 2 and 1c). In contrast to the linear analysis, the polynomial regression analysis indicated that > 29% of the analyzed tau values were explained by participants’ age in this new model.
Cognition is not related to CSF biomarkers in EOARD
Detailed cognitive assessments were carried out on 26 of the 30 patients with available CSF examination data. Of these, 21 had BCoS, whereas the remainder had different cognitive tests. None of the correlation analyses between cognitive and CSF measures yielded a significant p-value (Table 4). In general, there was little correlation between the CSF biomarkers of AD and cognitive assessment in adults with prodromal AD and/or sMCI.
Table 4
Relationship between cognitive measures (BCoS) and CSF biomarkers in patients with prodromal AD or stable MCI (N = 26)
| BCoS Cognitive domains/CSF measures | Total protein | Total tau | Phosphorylated tau | Aβ42 | |
| Total score | β | –0.055 | 0.985 | –0.879 | 0.443 |
| p | 0.864 | 0.410 | 0.406 | 0.309 | |
| Language | β | 0.105 | 1.268 | –1.018 | 0.530 |
| p | 0.735 | 0.263 | 0.320 | 0.211 | |
| Praxis | β | –0.013 | 1.005 | –0.905 | 0.343 |
| p | 0.968 | 0.398 | 0.402 | 0.437 | |
| Memory | β | –0.028 | 0.304 | –0.351 | 0.462 |
| p | 0.927 | 0.781 | 0.724 | 0.268 | |
| Attention | β | –0.128 | 0.385 | –0.528 | 0.228 |
| p | 0.700 | 0.743 | 0.623 | 0.603 | |
| Number and calculation abilities | β | –0.109 | –1.206 | –1.028 | 0.460 |
| p | 0.738 | 0.306 | 0.336 | 0.295 | |
Data refer to linear regression analysis, with CSF measures as independent values and cognitive scores as dependent variables. Standardized coefficients beta (β) and significance (p) values are presented.
CSF PCA analysis
In order to summarize the CSF biomarker findings in relation to their clinical use, we carried out a PCA analysis. For this, the PCA plot was based on both CSF Aβ42 and total tau levels to show differences in clusters of prodromal AD and sMCI (Fig. 3).
Fig. 3
PCA plot using CSF total tau and Aβ. This plot includes the 3 lines that could be used as an example to segregate prodromal AD from the sMCI patients with different levels of sensitivity and specificity. In addition to the prodromal AD and sMCI, the “Other” group was added to the plot to inform about the efficacy of the separation when more practical data are used. Panel B shows the data that are required for PC1 and PC2 calculations to produce the algorithm. Panel C shows the specificity and sensitivity values for an algorithm using the PCA graph with different equations to distinguish between the groups. The best cut-off line is the line for score 3. The equations will be improved upon by using a larger data set.
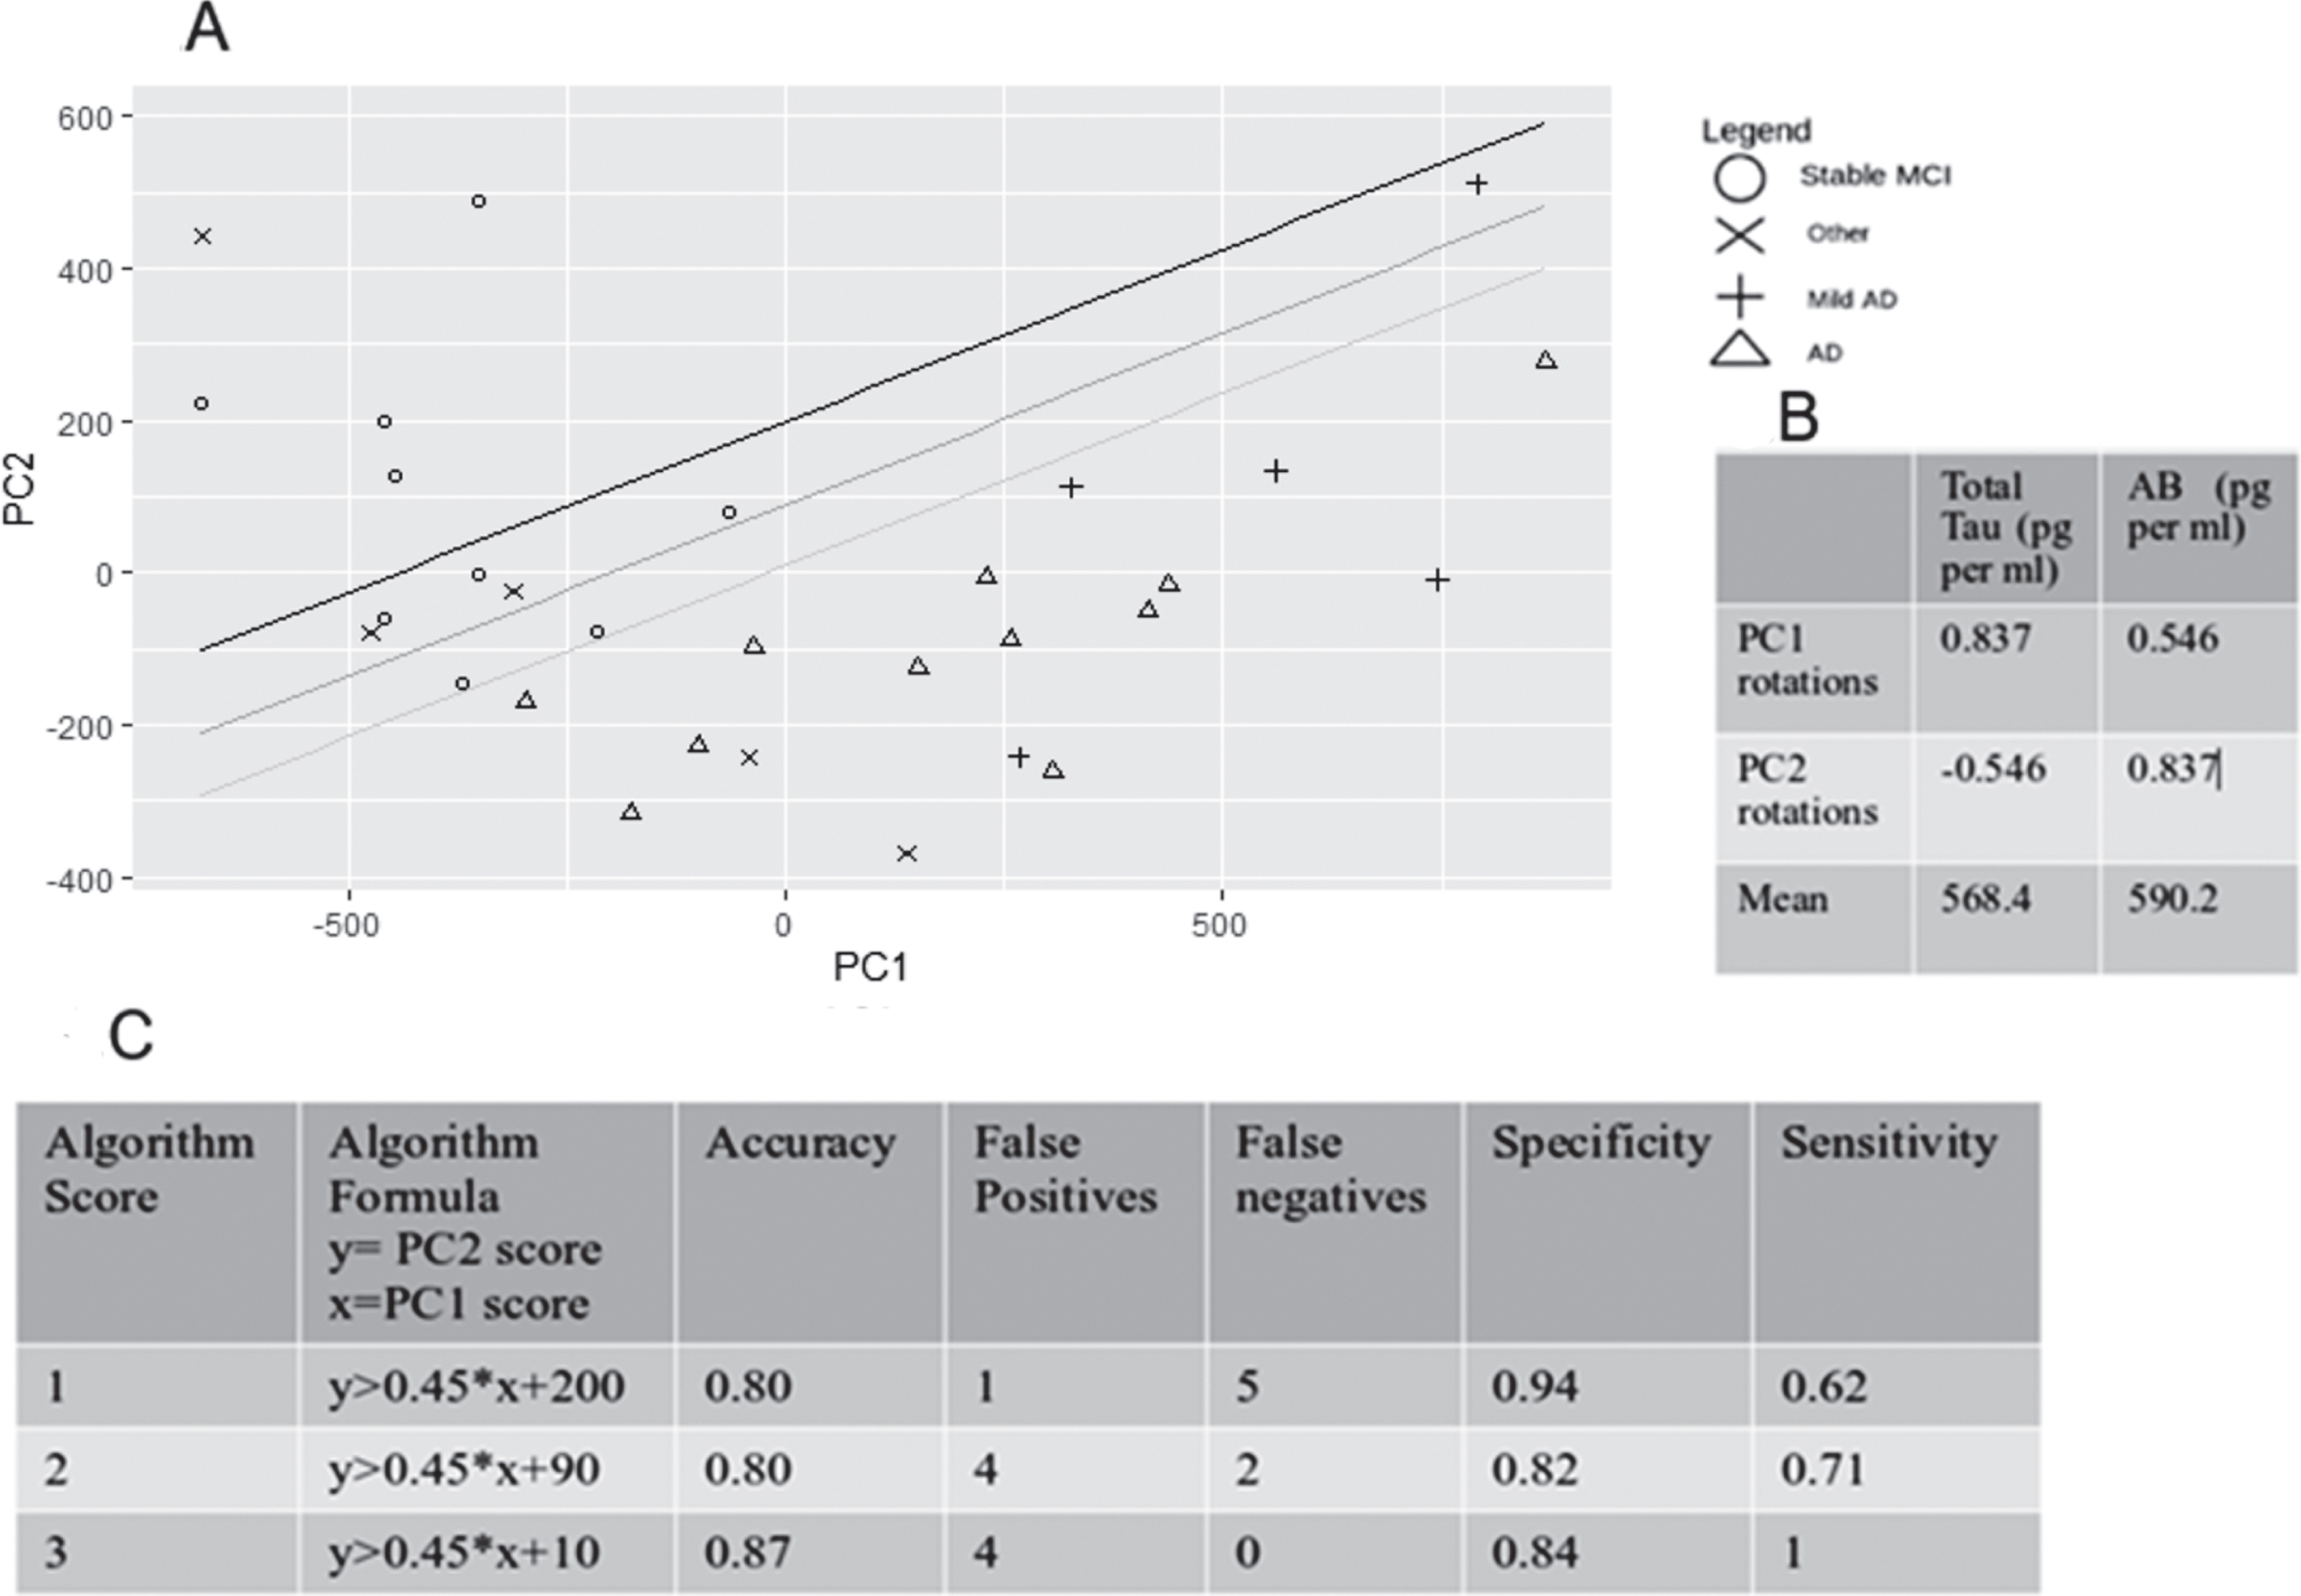
The data for CSF Aβ42 and total tau levels produced a sufficient segregation between the described diagnostic groups. However, the total tau data on the PCA plot did not reach the required sample size for 95% confidence. The fact that Aβ42 sample size calculation produced smaller sample sizes for 95% confidence level indicated that for this population, the CSF Aβ42 might have more discriminatory value to differentiate the patients. P-tau levels were considered for PCA analysis but finally it was discarded as a variable as it did not help discriminating the different groups.
Determination of sample size based on CSF measures
The two main groups analyzed in this study included the prodromal AD and sMCI groups. To determine meaningful sample sizes required for the CSF biomarkers (Aβ42, total tau, and p-tau) for the early diagnosis of prodromal AD in younger adults, we used the following formula:
(1)
Based on this formula, the CSF Aβ42 measures were conducted on an appropriate number of participants in both groups, whereas the use of CSF total and p-tau measures was underpowered, especially the numbers needed for the p-tau (Table 5).
Table 5
Population size needed for any of the CSF biomarkers confidence level at 95%
| CSF Variable | Mean Stable MCI (pg/mL) | Mean prodromal AD (mean, pg/mL) | SD pg/mL) sample size | Stable MCI (mean, needed for 95% confidence | AD sample size needed for 95% confidence confidence |
| Total tau | 303.7 | 878 | 386.8 | 10 | 17 |
| Aβ142 | 873.4 | 402 | 307.3 | 9 | 16 |
| p-tau | 43.6 | 80.9 | 32.2 | 16 | 27 |
These data were used to estimate the standard deviation (SD) for the population; the sample was obtained from including patients with stable MCI (N = 9) and prodromal AD (N = 16).
DISCUSSION
We report the benefits of diagnostic lumbar puncture for patients with early onset MCI in a clinical setting, and its contribution to differentiate a progressive cognitive decline (prodromal AD) from patients with sMCI. The use of CSF Aβ42 can be predictive of progressive cognitive decline and determinant of the early onset AD in clinical practice, whereas baseline cognitive assessments and neuroimaging have been inconclusive. In this study, insignificant correlation between abnormal CSF biomarkers and impaired cognition suggests that the initial cognitive testing is not sufficient for prognostication of patients with MCI and identification of individuals at risk of progression to prodromal AD against those who are anticipated to remain stable. Thus, the use of CSF biomarker analysis, particularly CSF Aβ42, is clinically useful for prompt diagnosis of early onset sporadic AD. During this early phase of the disease, AD pathology is evident in the CSF before significant AD-related cognitive impairment becomes apparent [17]. Further, identifying prodromal AD will be the key in the event of new disease-modifying treatments for AD.
Adults with early onset AD have cognitive impairment profile that is not identical to that seen in older adults with late onset dementia [22]. Various cognitive assessments prior to referral to our service is reflective of difficulties in establishing the correct diagnoses for these young adults. An early and accurate diagnosis can help these individuals to make decisions on planning extended family, provide them with appropriate support to continue employment in a safe environment, and potentially consider amyloid- or tau-targeting/disease-modifying treatments before emerging dementia. Since brain atrophy on MRI and changes in other imaging modalities for the diagnosis of neurodegenerative disorders (i.e., FDG-PET) are not necessarily an early marker to differentiate individuals with prodromal AD (with progressive MCI) from those with sMCI, the use of CSF Aβ42 can reliably help for diagnostic work up in selected individuals. We also confirm that the depletion of CSF Aβ42 is an early change in the AD cascade, as suggested in the AT(N) framework for established AD [15]. Furthermore, a smaller sample with 95% confidence interval was produced by using the Aβ42 for the calculation, and this suggests that the CSF Aβ42 may be more indicative for the diagnosis of early onset AD.
In a recent study, both Thr181p-tau and Thr217p-tau levels were significantly elevated in older individuals with MCI and distinguished prodromal AD from the MCI without AD (AUC = 82.6% –90.5%) [23]. However, a recent systematic review suggests that the lack of CSF Aβ42 and tau abnormalities in patients with MCI, has a great utility in excluding AD, whereas abnormal levels of Aβ42 and tau in the CSF does not necessarily rule in AD [22]. Our findings, on the other hand, suggest that in young adults it is the lower CSF Aβ42 levels that discriminate between the prodromal AD and sMCI.
Our study has some limitations. Although there were sufficient patients to meet the requirements in sample size for the CSF Aβ42 analysis, it had fewer than ideal patients for 95% confidence level for both CSF total and p-tau. Hence, a larger data set is needed to obtain more conclusive data. Further, we used a PCA analysis and took into account both Aβ42 and total tau data to show differences in clusters of prodromal AD and sMCI. Based on this analysis, it was the loss of Aβ42, but not changes in the CSF tau, that had a diagnostic advantage in the preclinical stages of AD. In addition, a confirmed memory impairment alone in the absence of Aβ42 abnormality seems to be consistent with sMCI.
There is evidence that performance on verbal fluency tasks is able to discriminate between patients with sMCI and those that will progress to AD [24], and our findings do show that the AD group had lower language test scores than those in the sMCI group. However, because the majority of participants in our study had cognitive assessment with BCoS, the data from the 5 participants who had ACE-R III cognitive assessment are not sufficient to explore differences in semantic and phonemic fluency between the sMCI and AD groups. Further studies into language assessment sub-score differences in sMCI and AD would need to be conducted.
Our pilot findings now need to be confirmed in a larger longitudinal study to determine the conversion from prodromal early onset AD to AD dementia. Further, we examined CSF Aβ42 and p-tau that were made available to the NHS by the reference laboratory during this study, meaning measures of Thr217p-tau were not available. Since then, the laboratory service has been upgraded to enable measuring Aβ42/Aβ40 ratio which our patients in this study were lacking. This could have provided further support of CSF amyloid decrease in preclinical AD in younger people, since CSF Aβ42/40 corresponds better than Aβ42 with Amyloid PET brain scan (AUC 0.936 versus 0.814, respectively, p < 0.0001) [25].
The cognitive assessment, BCoS, is an assessment tool lasting 1–2 h and examines cognitive functions including memory, attention, speech and language, executive function, numeric abilities, and action planning in order to build up a detailed cognitive profile. Similar to other detailed scales used in research studies, this scale addresses distinct aspects of cognition for the diagnosis of prodromal AD. However, memory problems alone were equally common in those with sMCI. Since BCoS is not routinely used in Memory clinic services, our findings need confirmation by standard cognitive tools used in clinical practice.
Conclusion
Although the initial aim of the study was to present the clinical value of diagnostic lumbar puncture in the differential diagnosis of early onset AD in routine clinical setting, the analysis of clinical, cognitive, and biochemical data provided a wealth of information and confirmed the heterogeneous outcomes of prodromal AD in younger people. Although the majority of our findings fell short of being ‘statistically significant’, we were able to determine the minimum size of participants required for similar studies in the future. Furthermore, our results helped identify the possible combination of cognitive and CSF biomarkers (CSF Aβ42) to predict the conversion to prodromal AD or sMCI. A recent study suggested that impairment on at least two memory tests for MCI diagnosis can improve the prediction of medial temporal atrophy and conversion to AD [26]. Future studies in young people with sMCI will provide further information as to whether our pilot findings may also represent the minimum criteria for diagnosing prodromal AD.
ACKNOWLEDGMENTS
The Medical Research Council (MRC) United Kingdom (research grant MR/T005580/1) partly funds AAH through her institute.
Authors’ disclosures available online (https://www.j-alz.com/manuscript-disclosures/21-5650r1).
SUPPLEMENTARY MATERIAL
[1] The supplementary material is available in the electronic version of this article: https://dx.doi.org/10.3233/JAD-215650.
REFERENCES
[1] | Rosness TA , Barca ML , Engedal K ((2010) ) Occurrence of depression and its correlates in early onset dementia patients. Int J Geriatr Psychiatry 25: , 704–711. |
[2] | Jainer AK , Onalaja D , Noushad F ((2005) ) Anxiety can be a harbinger of early onset dementia. Int J Psychiatry Clin Pract 9: , 299–300. |
[3] | Wilson RS , Leurgans SE , Boyle PA , Bennett DA ((2011) ) Cognitive decline in prodromal Alzheimer disease and mild cognitive impairment. Arch Neurol 68: , 351–356. |
[4] | Schoonenboom NS , Reesink FE , Verwey NA , Kester MI , Teunissen CE , van de Ven PM , Pijnenburg YA , Blankenstein MA , Rozemuller AJ , Scheltens P , van der Flier WM ((2012) ) Cerebrospinal fluid markers for differential dementia diagnosis in a large memory clinic cohort. Neurology 78: , 47–54. |
[5] | Skillback T , Zetterberg H , Blennow K , Mattsson N ((2013) ) Cerebrospinal fluid biomarkers for Alzheimer disease and subcortical axonal damage in 5,542 clinical samples. Alzheimers Res Ther 5: , 47. |
[6] | Hansson O , Zetterberg H , Buchhave P , Londos E , Blennow K , Minthon L ((2006) ) Association between CSF biomarkers and incipient Alzheimer’s disease in patients with mild cognitive impairment: A follow-up study. Lancet Neurol 5: , 228–234. |
[7] | Skillback T , Farahmand BY , Rosen C , Mattsson N , Nagga K , Kilander L , Religa D , Wimo A , Winblad B , Schott JM , Blennow K , Eriksdotter M , Zetterberg H ((2015) ) Cerebrospinal fluid tau and amyloid-beta1-42 in patients with dementia. Brain 138: , 2716–2731. |
[8] | Hadjichrysanthou C , Evans S , Bajaj S , Siakallis LC , McRae-McKee K , de Wolf F , Anderson RM , Alzheimer’s Disease Neuroimaging Initiative ((2020) ) The dynamics of biomarkers across the clinical spectrum of Alzheimer’s disease. Alzheimers Res Ther 12: , 74. |
[9] | NICE guideline [NG97] Dementia (2018) Assessment, management and support for people living with dementia and their carers,NICE,https://www.nice.org.uk/guidance/ng97. |
[10] | Bickerton WL , Demeyere N , Francis D , Kumar V , Remoundou M , Balani A , Harris L , Williamson J , Lau JK , Samson D , Riddoch MJ , Humphreys GW ((2015) ) The BCoS cognitive profile screen: Utility and predictive value for stroke. Neuropsychology 29: , 638–648. |
[11] | Noone P ((2015) ) Addenbrooke’s Cognitive Examination-III. Occup Med (Lond) 65: , 418–420. |
[12] | Nasreddine ZS , Phillips NA , Bedirian V , Charbonneau S , Whitehead V , Collin I , Cummings JL , Chertkow H ((2005) ) The Montreal Cognitive Assessment, MoCA: A brief screening tool for mild cognitive impairment. J Am Geriatr Soc 53: , 695–699. |
[13] | Randolph C , Tierney MC , Mohr E , Chase TN ((1998) ) The Repeatable Battery for the Assessment of Neuropsychological Status (RBANS): Preliminary clinical validity. J Clin Exp Neuropsychol 20: , 310–319. |
[14] | Warrington EK ((1984) ) for Recognition Memory Test, NFER-Nelson. |
[15] | Jack CR Jr. , Bennett DA , Blennow K , Carrillo MC , Dunn B , Haeberlein SB , Holtzman DM , Jagust W , Jessen F , Karlawish J , Liu E , Molinuevo JL , Montine T , Phelps C , Rankin KP , Rowe CC , Scheltens P , Siemers E , Snyder HM , Sperling R , Contributors ((2018) ) NIA-AA Research Framework: Toward a biological definition of Alzheimer’s disease. Alzheimers Dement 14: , 535–562. |
[16] | Teunissen CE , Petzold A , Bennett JL , Berven FS , Brundin L , Comabella M , Franciotta D , Frederiksen JL , Fleming JO , Furlan R , Hintzen RQ , Hughes SG , Johnson MH , Krasulova E , Kuhle J , Magnone MC , Rajda C , Rejdak K , Schmidt HK , van Pesch V , Waubant E , Wolf C , Giovannoni G , Hemmer B , Tumani H , Deisenhammer F ((2009) ) A consensus protocol for the standardization of cerebrospinal fluid collection and biobanking. Neurology 73: , 1914–1922. |
[17] | Keshavan A , Wellington H , Chen Z , Khatun A , Chapman M , Hart M , Cash DM , Coath W , Parker TD , Buchanan SM , Keuss SE , Harris MJ , Murray-Smith H , Heslegrave A , Fox NC , Zetterberg H , Schott JM ((2021) ) Concordance of CSF measures of Alzheimer’s pathology with amyloid PET status in a preclinical cohort: A comparisson of Lumipulse and established immunoassays. Alzheimers Dement (Amst) 13: , e12131. |
[18] | Neuroimmunology and CSF Laboratory User Handbook, University College London Hospitals,https://www.uclh.nhs.uk/our-services/find-service/neurology-and-neurosurgery/neuroimmunology. |
[19] | Becker RA , Chambers JM , Wilks AR ((1988) ) The New S Language. Chapman and Hall/CRC. |
[20] | Mardia KV , Kent JT , Bibby JM ((1979) ) Multivariate Analy-sis, Academic Press, London. |
[21] | Venables WN , Ripley BD ((2002) ), Modern Applied Statistics with S Springer-Verlag. |
[22] | Ritchie C , Smailagic N , Noel-Storr AH , Ukoumunne O , Ladds EC , Martin S ((2017) ) CSF tau and the CSF tau/ABeta ratio for the diagnosis of Alzheimer’s disease dementia and other dementias in people with mild cognitive impairment (MCI). Cochrane Database Syst Rev 3: , CD010803. |
[23] | Mielke MM , Aakre JA , Algeciras-Schimnich A , Proctor NK , Machulda MM , Eichenlaub U , Knopman DS , Vemuri P , Graff-Radford J , Jack CR Jr. , Petersen RC , Dage JL (2021) Comparison of CSF phosphorylated tau 181 and 217 for cognitive decline. Alzheimers Dement, doi: 10.1002/alz.12415. |
[24] | Vaughan RM , Coen RF , Kenny R , Lawlor BA ((2018) ) Semantic and phonemic verbal fluency discrepancy in mild cognitive impairment: Potential predictor of progression to Alzheimer’s disease. J Am Geriatr Soc 66: , 755–759. |
[25] | Lewczuk P , Matzen A , Blennow K , Parnetti L , Molinuevo JL , Eusebi P , Kornhuber J , Morris JC , Fagan AM ((2017) ) Cerebrospinal fluid abeta42/40 corresponds better than Abeta42 to amyloid PET in Alzheimer’s disease. J Alzheimers Dis 55: , 813–822. |
[26] | Vuoksimaa E , McEvoy LK , Holland D , Franz CE , Kremen WS , Alzheimer’sDisease Neuroimaging Initiative ((2020) ) Modifying the minimum criteria for diagnosing amnestic MCI to improve prediction of brain atrophy and progression to Alzheimer’s disease. Brain Imaging Behav 14: , 787–796. |


