
Bryostatin Placebo-Controlled Trials Indicate Cognitive Restoration Above Baseline for Advanced Alzheimer’s Disease in the Absence of Memantine1
Abstract
Background:
In pre-clinical studies of Alzheimer’s disease (AD) transgenic mice, bryostatin restored synaptic connections, prevented neuronal death, reduced amyloid plaques, and reduced neurofibrillary tangles.
Objective:
Within pre-specified cohorts of advanced AD patients in two double-blind placebo-controlled bryostatin Phase II trials, to conduct exploratory statistical analyses of patients with identical conditions of enrollment and treatment.
Methods:
Severe Impairment Battery (SIB) scores above baseline at 5, 9, and 13 weeks were analyzed initially in the complete cases, with multiple imputation methods based on an iterative Markov chain Monte Carlo algorithm used for missing SIB scores. To mitigate confounding by a chance imbalance of 4.9 SIB baseline scores (Study #203), each patient was used as their own control with differences in 13-week SIB from baseline in single trial and pooled analyses to measure benefit at 13 weeks using general estimating equations (GEE) modeling.
Results:
Patients treated with bryostatin pre-specified at Mini-Mental State Examination scores 10–14, without memantine, showed baseline balance, complete safety, and SIB improvements at 13 weeks with multiple imputation analysis: Study #203 = 4.1 SIB points above baseline (p = 0.005), and Study #202 = 4.2 SIB points above baseline (p = 0.016). An increased power (N = 95) “pooled analysis” showed an increased SIB over time and a higher mean SIB at 13 weeks in the bryostatin treatment group (p < 0.001) but not significant (NS) for the placebo patients.
Conclusion:
Pre-specified exploratory analyses for the individual trials and the pooled trials confirmed significant bryostatin-induced improvement over baseline (treatment p < 0.001, placebo NS).
INTRODUCTION
Discovery of treatments for the underlying pathophysiology of Alzheimer’s disease (AD) has proven exceptionally difficult. No drug that actually improves patients over their baseline cognitive performance or that prevents AD has as yet been approved by the U.S. Food and Drug Administration (FDA). For this reason, we have undertaken a search for a drug with an innovative, potentially restorative mechanism. Here, we are extending our initial analyses of two early clinical trials of such a drug, bryostatin, to further evaluate the available clinical evidence of potentially restorative efficacy for AD neurodegeneration.
In a number of pre-clinical studies, we demonstrated that activators of protein kinase C (PKC) epsilon, such as the marine macrocyclic lactone, bryostatin, restored cognitive loss in single, double, and quintuple transgenic AD mouse models, and increased synaptic numbers via synaptic growth factors such as brain-derived neurotrophic factor, nerve growth factor, and insulin-like growth factor [1, 2]. In addition to their potential synaptogenic efficacy, these PKC epsilon activators have also shown anti-apoptotic, anti-amyloid, anti-hyperphosphorylated tau, and cognitive enhancement efficacies. Specific enzymatic pathways in these pre-clinical studies were demonstrated to mediate such effects. For example, PKC epsilon activation by bryostatin was shown to activate endothelin converting enzyme to enhance the degradation of soluble amyloid-β oligomers [3]. As another example, bryostatin-activated PKC was also shown to enhance synaptogenesis by increasing the levels of brain-derived neurotrophic factor via the mRNA (ELAV)-stabilization pathway [4–7].
Thereafter, a Phase I pharmacokinetic study with AD patients demonstrated a peak elevation of PKC epsilon levels within one hour of infusion onset that was closely associated with a measured rise to peak of bryostatin blood levels [1, 8]. Furthermore, compassionate use trials showed marked improvements in AD patients with advanced disease [1]. In one case, it was possible to show that this marked clinical improvement closely tracked the level of PKC epsilon measured in the patient’s blood samples taken successively over time.
In an initial Phase II randomized, double-blind study (#202) of advanced AD patients not receiving concurrent standard-of-care memantine treatment, patients receiving 7 doses in a 20μg bryostatin protocol showed no safety issues and a sustained benefit of Severe Impairment Battery (SIB) improvement from baseline over the entire trial (15 weeks) in a pre-specified cohort [8, 9]. This cohort of patients who were not receiving standard-of-care (SOC) memantine (also called Namenda that blocks the NMDA glutamatergic receptor) was pre-specified because the principal target of bryostatin, PKC epsilon, phosphorylates and regulates the NMDA receptor. Thus, blocking the NMDA receptor with SOC memantine could affect NMDA-dependent efficacy of bryostatin-activation of PKC epsilon. In contrast to the bryostatin-treated patients, the placebo patients without memantine showed further decline in cognitive function over time. Results of this pre-specified exploratory analysis showed significant improvement in the mean SIB change from baseline in the 20μg treatment arm versus the placebo arm (difference (95% CI) = 5.6 (0.4, 10.9) points; p = 0.035).
In a recent follow-up Phase II study (#203), in the absence of memantine, there was a chance baseline imbalance of 4.9 SIB points in favor of the placebo group. Initial exploratory analyses showed that baseline SIB is statistically associated with the SIB score at 13 weeks post-randomization (Pearson’s ρ= 0.81, p < 0.001) and also the change in SIB scores at 13 weeks from baseline (Pearson’s ρ= – 0.25, p = 0.014), suggesting that the observed imbalance in baseline SIB may confound the analyses as specified in the statistical analysis plan (SAP) for study #203. In fact, study #203 did not meet its primary endpoint based on the pre-specified analytical plan, failing to show significant benefit in the treatment group compared to the placebo group in the change of SIB at 13 weeks from baseline for the full analysis set or the completers group (see clinicaltrials.gov).
Because of potential bias introduced by a large imbalance in baseline SIB, the pre-specified analyses presented in the original statistical analysis plan, therefore, may no longer be applicable for estimating a treatment effect for byrostatin versus placebo. Nevertheless, we reported results based on these pre-specified analyses in clinicaltrials.gov. Here, however, we focus on results for the #203 study by looking at patient data separately within the two pre-specified Mini-Mental State Examination (MMSE) cohorts using both the pre-specified SAP as well as ad hoc analyses using the method of general estimating equations (GEE).
As detailed in the Results section below for the pre-specified Moderate Stratum Cohort, MMSE 10–14 (2/3 of N = 97 total patients), the balance between treatment and placebo was acceptable. In contrast, the balance within the Severe Stratum Cohort (1/3 of N = 97) was even greater for the placebo than for the total trial cohort and thus not acceptable. We, therefore, focused our analyses here with special attention given to the Moderate Stratum Cohort, both in the #203 study alone and pooled with comparable data from the #202 study, as these patients had an acceptable balance in baseline SIB scores. Because of the aforementioned chance imbalance and the promising raw data signal, we used each patient as his/her own control as determined by subtracting the patient’s 13-week SIB from their baseline SIB and analyzed these changes post-hoc for the placebo and treatment patients within each MMSE Stratum using the one-sample t-test and GEE models in addition to the pre-specified two sample t-test for group comparisons (see Tables 5 and 6 below). Among the 32 subjects in the bryostatin treatment group in the Moderate Stratum Cohort in the #203 study, we found a difference = 4.1 points (with imputed data) in the mean SIB at week 13 from baseline (See Table 5 below), a result that is highly significant (p = 0.005). Some avoidance of the confounding of treatment benefit due to baseline imbalance was thought to be possible by comparing treatment differences with respect to each patient’s baseline SIB measurement; however, this imbalance in SIB baseline scores could still result in a biased treatment estimate given the correlation between SIB baseline scores and the change in SIB from baseline to 13 weeks as noted above. Chance inbalance leading to a biased treatment estimate is of particular concern for studies with small sample sizes, such as our #202 and #203 trials [10]. In addition, the power for the trial could be reduced even in the cases where imbalance is adjusted for in statistical modelling [11], suggesting the possibility of a pooled analysis.
Therefore, based on these signals of potential efficacy in study #202 and #203, we investigated the possibility of more thorough, and given the imbalance, more appropriate statistical analyses of each study separately and then, in combination, the possibility of a pooled analysis for the two studies. Specifically, the objective of the current study was to further analyze pre-specified subsets of patient data from the #202 study (patients who did not receive memantine) and of patient data from the #203 study, who also did not receive memantine, separately by trial and in a pooled analysis. For the pooled analysis, memantine-free patients from the #202 study were combined and analyzed together with #203 patients from the MMSE Stratum Cohort. The potential increase in power that could result from pooling the comparable cohorts from study #202 and #203 was thought to possibly offset the loss of power due to baseline SIB imbalance.
To recapitulate, both the #202 and #203 studies were randomized, double-blinded, placebo-controlled Phase II trials with the goal of assessing the tolerability (i.e., safety) and efficacy of bryostatin in the treatment of moderately severe to severe AD. For the analyses planned here, patients in the #203 study were restricted to those not treated with concomitant NMDA receptor antagonists. It should be noted, however, that patients in the total #202 study were a mix of those treated and not treated with NMDA receptor antagonists. Patients in both the placebo and bryostatin arms were potentially exposed to (donepezil) Aricept during the conduct of both the #202 and #203. However, previous exploratory analyses showed no effects of donepezil (Aricept) administration on the bryostatin treatment effects. Therefore, patients on (donepezil) Aricept were included in the pooled analysis. All analyses presented here are restricted to those patients in both studies with no exposure to memantine during the trial.
The data from the subsets of both trials were also planned to be analyzed by combining or pooling these data rather than using meta-analysis methods. The pooling of data over several studies has been considered to be a valuable tool for statistically estimating treatment effects in a subset of patient populations targeted in randomized clinical trials when such estimation is not possible from one study alone due to a small sample size [10]. The decision to pool data from across several clinical trials should be based on similarities of the studies in question. For example, pooled trials should be as similar as possible in terms of the study framework, inclusion and exclusion criteria, the times at which the outcome assessments are taken, and the treatment intervention protocol used [10].
Both the #202 and #203 studies were very similar in terms of the patients who were included and excluded (e.g., patients restricted to MMSE 4 to 15), and the timing of dosage and dosing amounts of placebo and bryostatin. Both trials had the same primary endpoint of the change in SIB 13-weeks post-randomization from baseline, with additional SIB scores taken at 5- and 9-weeks post-randomization as secondary efficacy endpoints. One difference between trials was that the #202 trial, except for a pre-specified sub-group analyzed here, allowed for patients who received concomitant NMDA receptor antagonists, while the #203 trial excluded these patients. Only the patients from the 10–14 MMSE Moderate Stratum Cohort in the #203 trial were included with patients in the #202 study for the pooled analyses. This was because the patients from the Moderate Stratum Cohort of #203 study had baseline SIBs that were comparable to those of patients from the #202 trial (i.e., median baseline SIBs were found to be 87 and 85 for the #203, 10–14 MMSE stratum patients and #202 trial patients, respectively). In contrast, the median baseline SIB was much lower among the #203 patients in the 4–9 MMSE stratum at 59.5 points, and therefore these patients were less comparable to those from the #202 study.
Data harmonization for the pooling analysis was not an issue since the data structures for both studies were similar. SIB data from baseline, 5, 9, and 13 weeks, randomized treatment arm, and MMSE category (for the #203 study) were abstracted from both trials and combined into one data set for the pooled analysis.
METHODS
Statistical analyses
Analyses were performed using four data sets: 1) patients from the #203 study within the Severe Stratum Cohort (i.e., MMSE scores 4 to 9, inclusive); 2) patients from the #203 study within the Moderate Stratum Cohort (i.e., MMSE scores 10 to 15, inclusive); 3) patients from the #202 study who were memantine-free during the course of the trial; and 4) memantine-free patients from the #202 study combined with patients from the #203 study from the Moderate Stratum Cohort. The SIB score at any given time point (e.g., 5, 9, 13 weeks) after subtracting the baseline SIB score from scores assessed each week during and after dosing is referred to in this document at the ‘change score’ or ‘SIB change score’.
Initially, the mean (SD) change in SIB scores from baseline at 5-, 9-, and 13-weeks post-randomization were calculated by treatment arm for complete data (i.e., using only those patients with SIB values recorded at each given time point). Confirmatory analysis included testing the null hypothesis of no change from 0 in the mean 13-week SIB scores from baseline within the one sample placebo and bryostatin arms using the one-sample t-test. The one-sample t-tests were performed on the complete cases (i.e., with only patients who had SIB data at 13 weeks and baseline) and with SIB values imputed at 13 weeks for patients with these SIB data missing. In the pooled analysis, the null hypothesis that the mean change scores calculated at 13 weeks were equal between these two treatment groups was statistically assessed using the two-sample t-test. Finally, the method of GEE was used to 1) perform trend analyses of SIB scores over time by considering a treatment arm-by-time interaction term and treating time as continuous in the GEE models; and 2) to estimate the difference in SIB change scores at 13 weeks between the placebo and bryostatin arms with time treated as a categorical variable.
Multiple imputation methods based on multivariate normal regression and an iterative Markov chain Monte Carlo algorithm were used to impute missing 13-week SIB data predicted from SIB baseline values [11]. Twenty-five imputed samples were estimated, and the reported p-values for the one-sample t-tests were obtained by combining results over these 25 imputation samples using combination methods as described by Rubin [12]. A standard recommendation is that the number of imputed samples should be ≥100 times the highest fraction of missing information (FMI) seen among the coefficients used in the imputation regression model [13]. In the present case, the largest FMI seen was 0.22 for the imputation model among bryostatin patients in the #202 study. Therefore, we chose to use 25 multiple imputation samples for all four data sets in the missing data analyses.
Imbalance
In theory, a parallel randomized trial provides for a balance of covariates between treatment arms that may be predictive of the trial outcome (i.e., prognostic factors). In practice, imbalance can occur between treatment arms in prognostic factors, especially when the sample size is small. As noted above, such an imbalance in treatment arms of a continuous prognostic factor can lead to both a biased estimate in the treatment effect [14], as well as a loss of power for the trial [15].
As noted above, the #203 study showed a chance imbalance in the baseline SIB between treatment arms. Initial exploratory analyses showed that baseline SIB is statistically associated with both SIB score at 13 weeks post-randomization (Pearson’s ρ= 0.81, p < 0.001) and the change in SIB scores at 13 weeks from baseline (Pearson’s ρ= –0.25, p = 0.014), suggesting that an imbalance in baseline SIB may confound the analyses. Among the total patient sample, the mean and median baseline SIB scores were reported as 78.6 and 86.0, respectively, in the placebo arm and 73.7 and 82.0, respectively, in the bryostatin arm, giving an imbalance of 4.9 points in the means and 4 points in the medians of baseline SIB scores. In the Severe Stratum Cohort, this imbalance was more pronounced with a treatment group difference of 6.1 points in the means and 18 points in medians of baseline SIB scores (mean and median baseline SIB = 62.3 and 70.5 in the placebo arm, and a mean and a median baseline SIB = 56.2 and 52.5 in the bryostatin arm). In the Moderate Stratum Cohort, the imbalance was much smaller, reporting a treatment group difference of 3.8 points in the means and 4 points in medians of baseline SIB scores (mean and median baseline SIB = 86.8 and 89.0 in the placebo arm, and a mean and a median baseline SIB = 83.0 and 85.0 in the bryostatin arm). Therefore, pooling the data of memantine-free patients in the #202 study with patients from the #203 study from the Moderate Stratum Cohort was anticipated to provide additional power to compensate for a potential loss of power in the #203 study from the treatment arm imbalance at baseline of SIB scores.
RESULTS
Two patients in the #203 study who had only baseline SIB and no follow-up SIB scores were excluded in all analyses. Tables 1 through 4 give the mean change in SIB from baseline at 5-, 9-, and 13-weeks post-randomization for the four data sets considered. In these tables, a positive value indicates an improvement in the SIB score from baseline at any given follow-up time point. Tables 2 through 4 demonstrate that the mean 13-week change scores increased in the bryostatin arm for three data sets (mean (SD) 13-week change scores = 3.94 (7.80), 3.44 (4.80), and 3.77 (1.00) for patients in the Moderate Stratum Cohort of the #203 study, memantine-free patients from the #202 study, and in the pooled data, respectively. Placebo patients showed a decrease in mean 13-week change scores among the memantine-free patients in the #202 study (mean (SD) change score = –1.14 (6.89)). Although the placebo patients in the Moderate Stratum Cohort of the #203 study and the pooled study showed an increase in SIB at 13 weeks from baseline, these increases were less than those observed among the corresponding bryostatin patients (mean (SD): 13-week change scores = 2.15 (4.78) and 1.17 (0.82) for the placebo patients in the Moderate Stratum Cohort of the #203 study and placebo patients from the pooled study, respectively. In the Severe Stratum Cohort from the #203 study, with an unacceptably high baseline imbalance (N = 17), bryostatin-treated patients showed a decrease in mean SIB at 13 weeks from baseline, while those in the placebo group (N = 15) demonstrated, as noted in Table 1, an increase in mean SIB over the same duration of time (mean (SD) 13 week change scores = –3.65 (7.42) and 1.87 (15.26) for the bryostatin and placebo groups, respectively).
Table 1
Mean (SD) SIB change from baseline by week and treatment arm for the #203 study data, Severe Stratum Cohort (MMSE = 4–9), along with the number of patients with SIB data at each time
| Visit | ||||
| Treatment | Base | Week 5 | Week 9 | Week 13 |
| Bryostatin | ||||
| N | 18 | 18 | 16 | 17 |
| Mean (SD) | 0 (n/a) | –3.06 (9.55) | 1.06 (8.98) | –3.65 (7.42) |
| Placebo | ||||
| N | 18 | 17 | 16 | 15 |
| Mean (SD) | 0 (n/a) | 1.41 (11.07) | 1.12 (13.32) | 1.87 (15.26) |
Table 2
Mean (SD) SIB change from baseline by week and treatment arm for the #203 study data, Moderate Stratum Cohort (MMSE = 10–14), along with the number of patients with SIB data at each time
| Visit | ||||
| Treatment | Base | Week 5 | Week 9 | Week 13 |
| Bryostatin | ||||
| N | 34 | 34 | 33 | 32 |
| Mean (SD) | 0 (n/a) | 1.41 (6.57) | 3.45 (6.13) | 3.94 (7.80) |
| Placebo | ||||
| N | 36 | 34 | 35 | 33 |
| Mean (SD) | 0 (n/a) | 0.29 (11.06) | 1.49 (4.61) | 2.15 (4.78) |
Table 3
Mean (SD) SIB change from baseline by week and treatment arm for the #202 study data, memantine-free, along with the number of patients with SIB data at each time
| Visit | ||||
| Treatment | Base | Week 5 | Week 9 | Week 13 |
| Bryostatin | ||||
| N | 18 | 18 | 15 | 16 |
| Mean (SD) | 0 (n/a) | 2.50 (4.25) | 2.33 (4.62) | 3.44 (4.80) |
| Placebo | ||||
| N | 15 | 15 | 14 | 14 |
| Mean (SD) | 0 (n/a) | –1.20 (10.26) | 0.79 (7.44) | –1.14 (6.89) |
Table 4
Mean (SD) SIB change from baseline by week and treatment arm for the #202 study data, memantine-free, plus the #203 study data, Moderate Stratum Cohort (MMSE = 10–15). The number of patients with SIB data at each time point is given
| Visit | ||||
| Treatment | Base | Week 5 | Week 9 | Week 13 |
| Bryostatin | ||||
| N | 52 | 52 | 48 | 48 |
| Mean (SD) | 0 (n/a) | 1.79 (0.81) | 3.10 (0.82) | 3.77 (1.00) |
| Placebo | ||||
| N | 51 | 49 | 49 | 47 |
| Mean (SD) | 0 (n/a) | –0.16 (1.53) | 1.29 (0.78) | 1.17 (0.82) |
Table 5 shows the mean change (95%CI) in SIB at 13 weeks from baseline for the four data sets under both complete case and multiple imputation scenarios. The p-values given in the table are from the one-sample t-test, where a p-value <or = 0.05 indicates a statistically significant change in SIB scores at 13 weeks from baseline. As with the previous tables, a positive mean indicates improvement in SIB at 13 weeks post-randomization. The bryostatin patients consistently demonstrated a statistically significant increase in SIB scores at 13 weeks from baseline for both the complete and the imputed data sets among patients in the Moderate Stratum Cohort of the #203 study, memantine-free patients from the #202 study, and for patients in the pooled data, with the results being most pronounced in the pooled study (mean (95% CI) change scores = 3.77 (1.77, 5.77), p < 0.001; and 4.14 (2.09, 6.18), p < 0.001 for the complete and imputed data sets, respectively). In contrast, placebo patients showed a statistically significant increase in SIB scores from baseline for only patients in the Moderate Stratum Cohort of the #203 study (mean (95% CI) 13-week change score = 2.15 (0.46, 3.85), p = 0.014; and 2.20 (0.33, 4.08), p = 0.023 for the for the complete and imputed data sets, respectively).
Table 5
Mean change (95%CI) in SIB from baseline for all four data subsets with corresponding p-values from the one-sample t-test. These means are given for the complete case (i.e., includes only patients with SIB data at week 13) and under multiple imputation
| Sample/Treatment Arm | Complete Case | Multiple Imputation |
| #203 Study, Severe MMSE | ||
| Placebo | 1.87 (–6.59, 10.32) | 1.32 (–6.41, 9.06) |
| p = 0.643 | p = 0.719 | |
| Bryostatin | –3.65 (–7.46, 0.17) | –3.37 (–7.55, 0.82) |
| p = 0.060 | p = 0.106 | |
| #203 Study, Moderate MMSE | ||
| Placebo | 2.15 (0.46, 3.85) | 2.20 (0.33, 4.08) |
| p = 0.014 | p = 0.023 | |
| Bryostatin | 3.94 (1.12, 6.75) p = 0.008 | 4.12 (1.36, 6.89) p = 0.005 |
| #202 Study, Memantine-free | ||
| Placebo | –1.14 (–5.12, 2.84) | –0.99 (–4.98, 3.01) |
| p = 0.546 | p = 0.600 | |
| Bryostatin | 3.44 (0.88, 6.00) | 4.22 (0.95, 7.49) |
| p = 0.012 | p = 0.016 | |
| Combined # 202/ 203 Study | ||
| Placebo | 1.17 (–0.48, 2.82) | 1.27 (–0.48, 3.01) |
| p = 0.160 | p = 0.150 | |
| Bryostatin | 3.77 (1.77, 5.77) | 4.14 (2.09, 6.18) |
| p < 0.001 | p < 0.001 |
As an aside, the number of patients with imputed SIB scores in Table 5 can be determined by the difference in the number of patients at baseline and week 13 as given in Tables 1 through 4. For example, one patient had an imputed SIB score at 13 weeks in the bryostatin arm of the #203 study, Severe Stratum Cohort (i.e., 18 – 17 = 1 from Table 1), while 3 patients had an imputed 13-week SIB score in the placebo arm of #203 study, Severe Stratum Cohort (i.e., 18–15 = 3 from Table 1).
Table 6 presents the group differences in SIB change scores at 13 weeks for the pooled data analysis, from both the two-sample t-test and the GEE model where time is treated as a categorical variable. In these analyses, the GEE results are presented for the full data set as well as for the completer data set (i.e., only for those patients with both a week 13 and baseline SIB score). A positive value indicates that the mean change in SIB at 13 weeks was greater in the bryostatin arm as compared to the placebo arm, and a p-value p < or = 0.05 means that this group difference in the change scores is statistically significant. From the table, the t-test shows that the bryostatin arm had a SIB change score at 13 weeks that was 2.6 points higher (95% CI = 0.03, 5.17), on average, than that from the placebo group among patients in the pooled data, a result that is statistically significant (p = 0.047). Similarly, the GEE model showed a mean increase of 2.51 points for bryostatin patients compared to placebo patients in the 13-week SIB from baseline (95% CI = 0.14, 4.88) among those with any follow-up data in the pooled study, and an increase of 2.60 points for bryostatin patients compared to placebo patients (95% CI = 0.18, 5.02) among completers in the pooled study, results that are statistically significant (p = 0.038 and p = 0.035 for the full data and completers, respectively). In general, note that in comparison to the t-test, the GEE model results give tighter confidence intervals than those associated with the t-test across all four data sets, and a smaller p-value for the difference in group means for the change scores. This is because the GEE model leverages the within person correlations in SIB scores over time to give a reduced standard error corresponding to the group difference in mean change scores.
Table 6
Differences in the group means (95%CI) of the change in SIB scores at 13 weeks from baseline (i.e., difference of the difference) as estimated by the two-sample t-test and the GEE model for all four data sets. Note that a positive difference indicates that the change score shows more improvement in the bryostatin as compared to the placebo
| Analytical | #203 Study, | #203 Study, | #202 Study, | Combined #202/ |
| Method | Severe MMSE | Moderate MMSE | Memantine-free | 203 Study |
| Mean Difference | Mean Difference | Mean Difference | Mean Difference | |
| (95 % CI) | (95 % CI) | (95 % CI) | (95 % CI) | |
| Two-sample | –5.51 (–14.01,3.00) | 1.79 (–1.41, 4.99) | 4.58 (8.98, 0.18) | 2.60 (0.03, 5.17) |
| t-test | p = 0.195 | p = 0.268 | p = 0.042 | p = 0.047 |
| GEE model | –5.51 (–12.11, 1.09) | 1.63 (–1.27, 4.53) | 4.22 (0.31, 8.13) | 2.51 (0.14, 4.88) |
| –full data | p = 0.101 | p = 0.271 | p = 0.035 | p = 0.038 |
| GEE model | –5.80 (–13.08, 1.48) | 1.79 (–1.21, 4.79) | 4.58 (0.63, 8.53) | 2.60 (0.18, 5.02) |
| –completers | p = 0.118 | p = 0.243 | p = 0.023 | p = 0.035 |
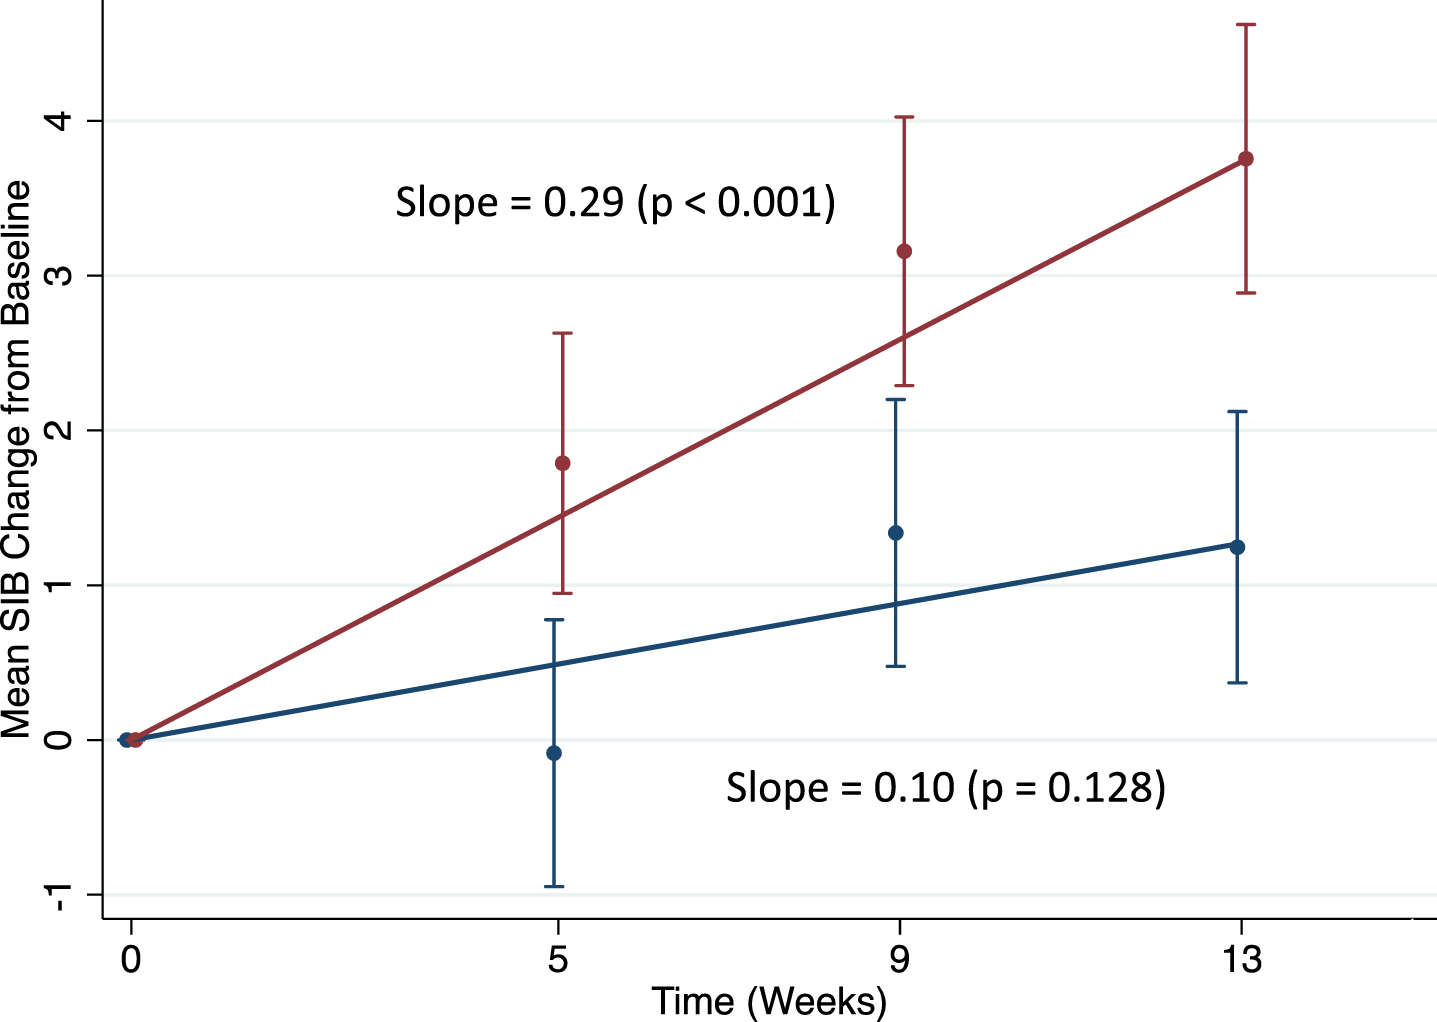
Finally, Figs. 1 through 3 show the results of the trend analysis from the GEE models that treat time as continuous. In these figures, the slopes over time are presented by treatment arm for three of the four data sets considered. Mean+/- standard errors in SIB change scores at each time point were obtained from the GEE models with time as categorical, giving values that are very similar to those obtained from the raw data. Slopes are in units of change in SIB from baseline per week, and the corresponding p-values assess the null hypothesis that the slope = 0. A p-value<or = 0.05 indicates a statistically significant non-zero slope. Patients in the bryostatin arm showed a greater increase in SIB scores over time as compared to the placebo patients in all three plots, with bryostatin patients in the Moderate Stratum Cohort #203 study, memantine-free patients in the #202 study and in the pooled analyses all demonstrating highly statistically significant increasing slopes in SIB score over the 13-week follow-up time (p < 0.001 for patients in all data sets).
Fig. 1
Trend analysis for the #203 study, MMSE = 10–14. red = bryostatin; blue = placebo.
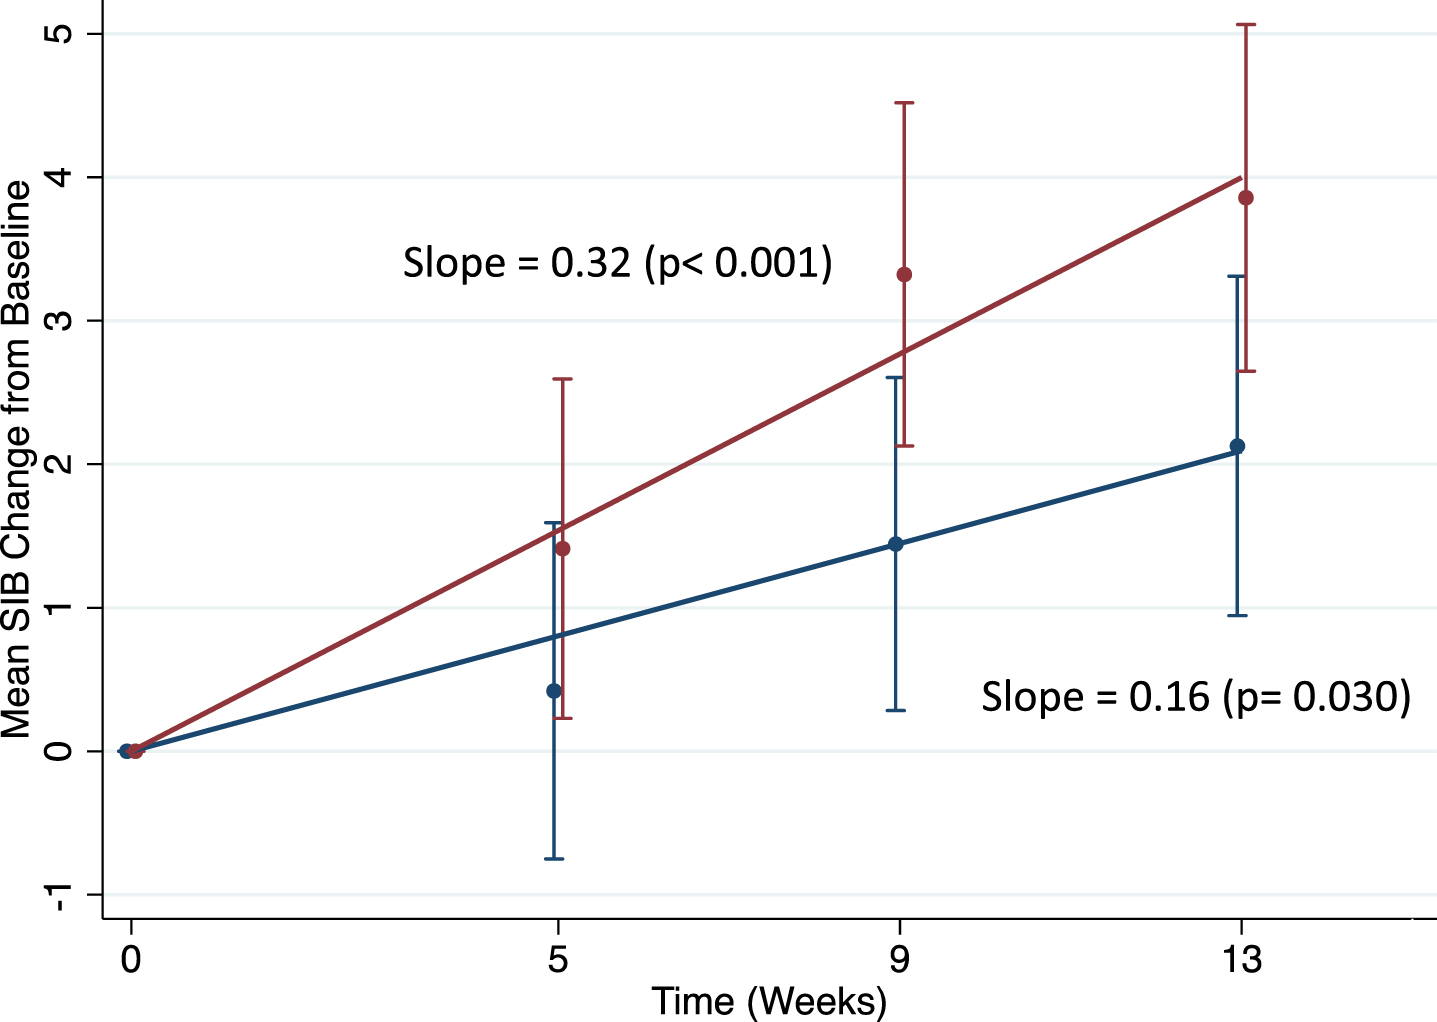
Fig. 2
Trend analysis for the #202 study, memantine-free. red = bryostatin; blue = placebo.
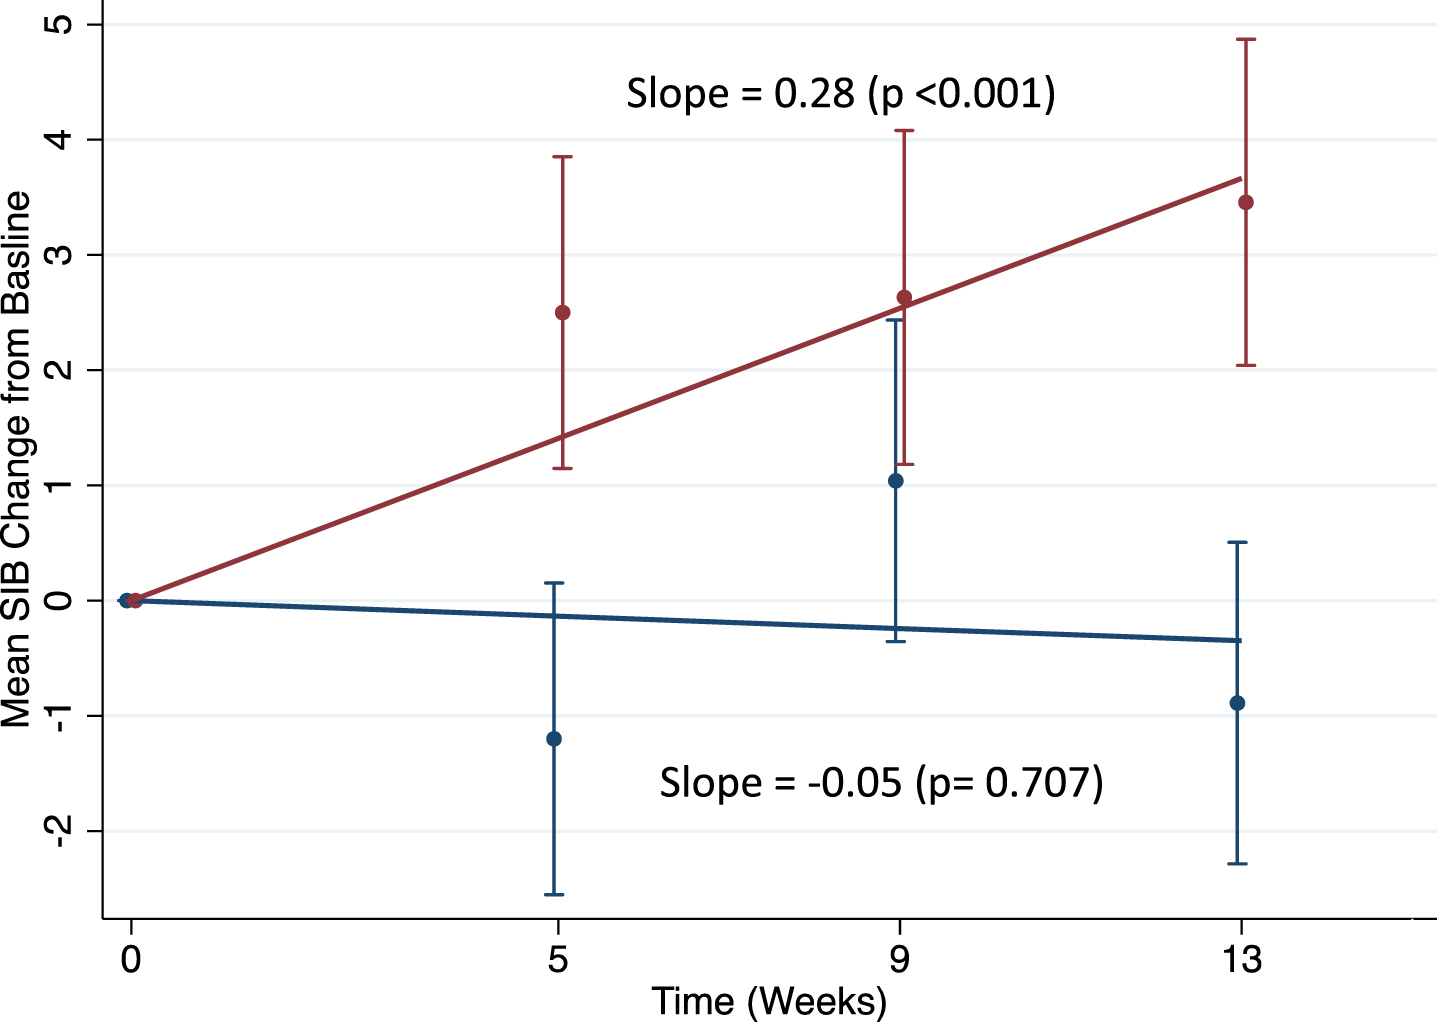
Fig. 3
Trend analysis for the #202 Study, memantine-free, plus the 203 study, MMSE = 10–15. red = bryostatin, blue = placebo.
DISCUSSION
The only drug to treat AD receiving any FDA approval, aducanumab, in the last 15 years, showed a potential reduction in the rate of cognitive decline of 22% for mild cognitive impairment patients. Previously, in 2003, the FDA approved memantine for a decline of 23% for advanced AD patients. Illustrating the huge unmet medical need, no drug has ever been approved to restore cognitive function above baseline for AD patients— with any duration of disease. In the case of aducanumab, the single dose associated with slowing of cognitive decline, was also associated with serious side effects (e.g., brain swelling and/or bleeding) in 40% of cases.
The two bryostatin pilot trials showed potential efficacy in pre-specified cohorts with advanced AD patients, in the absence of memantine. This efficacy involved improvement of 4.0 points or more in the SIB, in the absence of any side effects compared to the placebo patients. Given the lack of a safe treatment that provides evidence of restoration of function in AD patients, with any disease duration, we conducted further analyses of these pre-specified cohorts in #202 and #203 studies to rigorously evaluate bryostatin’s benefit over the entire trial and to consider the possibility of consolidating the data from both studies, according to the requirements of a pooled analysis. An analysis that integrates efficacy across the entire duration of the trial, throughout the protocol, applied the GEE trend analysis that measures drug benefit as a function of successively increasing numbers of trial doses that included weeks #5, 9, and 13. These analyses measured SIB improvement for each week with respect to the initial baseline SIB measurements. This measure avoids the potential bias of the results due to baseline imbalance, a significant SIB covariant, particularly in #203 study.
The results of these analyses indicate that bryostatin improved cognitive function in each of the two studies for the pre-specified cohorts of patients who were advanced, MMSE 10-14, but who did not receive memantine. These cohorts showed acceptable baseline imbalance and complete safety, and, in addition, SIB improvement of 4.0 SIB points above baseline. Not only were the mean SIB improvements statistically significant, but the GEE analyses were also positive when measured over the entire trial. Because the pre-specified cohorts for #202 and #203 studies were virtually identical, the data could be combined in a “pooled analysis” to increase the power of these two studies where each had limited power. The results of the pooled analysis, with greater power from the two studies, provided the clearest evidence of a bryostatin treatment effect. The bryostatin treatment group, with and without multiple imputation, showed a GEE result that was significant at p < 0.001, while the placebo group showed no significant effect above baseline. The overall improvement of 4.12 SIB points above baseline is of sufficient magnitude to have clinically significant benefit, as was observed in the bryostatin expanded access trials [1]. This clear evidence of efficacy with the potential significant improvement above baseline, justifies, we believe, continued testing under conditions that are based on “lessons learned” from the two pooled studies. The currently ongoing, NIH-supported trial, for example has a duration of 6 months to avoid any “placebo effect” that is more likely to occur within the first few months of trial duration. The current trial has also included a blinded observer to continuously monitor baseline balance to avoid the potential imbalance that can occur by chance with smaller patient cohorts. Finally, the most seriously compromised patients with MMSE of 4–9 were not included based on previous experience of difficulty in obtaining reliable patient measurements.
The results presented here have the potential to address advanced AD patients who are almost entirely absent from almost all other current studies to identify treatments that could make a difference for this disease and whose impact is growing year by year to epidemic proportions.
ACKNOWLEDGMENTS
This work was supported by Synaptogenix, Inc. and the National Institutes of Health.
Authors’ disclosures available online (https://www.j-alz.com/manuscript-disclosures/21-5545r1).
REFERENCES
[1] | Nelson TJ , Sun MK , Lim C , Sen A , Khan T , Chirila FV , Alkon DL ((2017) ) Bryostatin effects on cognitive function and PKCɛ in Alzheimer’s phase IIa and expanded access trials. J Alzheimers Dis 58: , 521–535. |
[2] | Hongpaisan J , Sun MK , Alkon DL ((2011) ) PKC ɛ activation prevents synaptic loss, Aβ elevation, and cognitive deficits in Alzheimer’s disease transgenic mice. J Neurosci 31: , 630–643. |
[3] | Nelson TJ , Cui C , Luo Y , Alkon DL ((2009) ) Reduction of beta-amyloid levels by novel PKC(epsilon) activators. J Biol Chem 284: , 34514–34521. |
[4] | Quattrone A , Pascale A , Nogues X , Zhao W , Gusev P , Pacini A , Alkon DL ((2001) ) Posttranscriptional regulation of gene expression in learning by the neuronal ELAV-like mRNA-stabilizing proteins. Proc Natl Acad Sci U S A 98: , 11668–11673. |
[5] | Pascale A , Amadio M , Scapagnini G , Lanni C , Racchi M , Provenzani A , Govoni S , Alkon DL , Quattrone A ((2005) ) Neuronal ELAV proteins enhance mRNA stability by a PKCalpha-dependent pathway. Proc Natl Acad Sci U S A 102: , 12065–12070. |
[6] | Lim CS , Alkon DL ((2012) ) Protein kinase C stimulates HuD-mediated mRNA stability and protein expression of neurotrophic factors and enhances dendritic maturation of hippocampal neurons in culture. Hippocampus 22: , 2303–2319. |
[7] | Sun MK , Nelson TJ , Alkon DL ((2015) ) Towards universal therapeutics for memory disorders. Trends Pharmacol Sci 36: , 384–394. |
[8] | Farlow MR , Thompson RE , Wei LJ , Tuchman AJ , Grenier E , Crockford D , Wilke S , Benison J , Alkon DL ((2019) ) A randomized, double-blind, placebo-controlled, phase II study assessing safety, tolerability, and efficacy of bryostatin in the treatment of moderately severe to severe Alzheimer’s disease. J Alzheimers Dis 67: , 555–570. |
[9] | Wei LJ , Lachin JM ((1984) ) Two sample asymptotically distribution free tests for incomplete multivariate observations. J Am Stat Assoc 79: , 653–661. |
[10] | Chu R , Walter SD , Guyatt G , Devereaux PJ , Walsh M , Thorlund , K , Thabane L ((2012) ) Assessment and implication of prognostic imbalance in randomized controlled trials with a binary outcome – a simulation study. PLoS One 7: , e36677. |
[11] | Ciolino J , Zhao W , Martin R , Palesch Y ((2011) ) Quantifying the cost in power of ignoring continuous covariate imbalances in clinical trial randomization. Contemp Clin Trials 32: , 250–259. |
[12] | Bangdiwala SI , Bhargava A , O’Connor DP , Robinson TN , Michie S , Murray DM , Stevens J , Belle SH , Templin TN , Pratt CA ((2016) ) Statistical methodologies to pool across multiple intervention studies. Transl Behav Med 6: , 228–235. |
[13] | Li K-H ((1988) ) Imputation using Markov chains. J Stat Comput Simul 30: , 57–79. |
[14] | Rubin DB ((1987) ) Multiple Imputation for Nonresponse in Surveys. Wiley, New York. |
[15] | White IR , Royston P , Wood AM ((2011) ) Multiple imputation using chained equations: Issues and guidance for practice. Stat Med 30: , 377–399. |

