
Dementia Risk Score for a Population in Southern Europe Calculated Using Competing Risk Models
Abstract
Background:
Dementia prevention can be addressed if the intervention is applied early.
Objective:
The objective of this study was to develop and validate competing risk models to predict the late risk of dementia based on variables assessed in middle age in a southern European population.
Methods:
We conducted a prospective observational study of the EPIC-Spain cohort that included 25,015 participants. Dementia cases were identified from electronic health records and validated by neurologists. Data were gathered on sociodemographic characteristics and cardiovascular risk factors. To stratify dementia risk, Fine and Gray competing risk prediction models were constructed for the entire sample and for over-55-year-olds. Risk scores were calculated for low (the 30% of the sample with the lowest risk), moderate (> 30% –60%), and high (> 60% –100%) risk.
Results:
The 755 cases of dementia identified represented a cumulative incidence of 3.1% throughout the study period. The AUC of the model for over-55-year-olds was much higher (80.8%) than the overall AUC (68.5%) in the first 15 years of follow-up and remained that way in the subsequent follow-up. The weight of the competing risk of death was greater than that of dementia and especially when the entire population was included.
Conclusion:
This study presents the first dementia risk score calculated in a southern European population in mid-life and followed up for 20 years. The score makes it feasible to achieve the early identification of individuals in a southern European population who could be targeted for the prevention of dementia based on the intensive control of risk factors.
INTRODUCTION
Dementia has reached epidemic proportions in developed countries [1]. The number of patients is expected to double, or even triple, over the next 20 years, unless effective interventions are implemented [2, 3]. Until now, symptomatic and etiopathogenic pharmacological interventions for dementia have been the focus of research. Unfortunately, approved dementia drugs have small effect sizes, and disease-modifying treatments have so far failed to demonstrate efficacy [4]. Evidence that the neuropathological changes in Alzheimer’s disease (AD) begin decades before the onset of symptoms has prompted clinical trials of anti-amyloid therapies in asymptomatic individuals with abnormal levels of AD biomarkers [5]. Nonetheless, even if this approach proves successful and an effective drug is found, its application would be expensive and faces challenges such as target population identification and screening procedures [6, 7]. On the other hand, mathematical models have shown that dementia does not appear in two-thirds of individuals with some degree of amyloid-β deposition due to the existence of the competing risk of death from other causes [6]. Dementia management has evolved from the treatment of symptoms to focus on various primary prevention strategies in healthy individuals and secondary prevention in people with mild cognitive impairment (MCI) [8–10].
Predictive models have been developed to predict the risk of events associated with diseases such as complications or death [11, 12]. The translation of such models into risk scores by selecting only a few easily measurable factors enables the implementation of preventive measures in people at higher risk of a disease. Although the absolute risk of an event may differ between populations, the classification of individuals’ risk through the use of scores is consistent and enables prevention to be addressed in a stratified manner [13]. The evidence that modifiable cardiovascular risk factors such as hypertension, hypercholesterolemia, obesity, and diabetes are directly associated with the risk of dementia opens the door to the use of interventions tackling these factors to reduce the prevalence of dementia [3, 14, 15]. Adding sociodemographic and genetic variables, scores have been proposed for assessing the risk of developing dementia in mid-life or after 65 years of age [14, 16]. These predictive models make it possible to identify asymptomatic individuals at high risk of dementia to be targeted by multimodal interventions to modify risk factors [5]. On the other hand, the external validation of these scores has not been satisfactory for several reasons [17, 18]. Among them, we note that the models have not included competing risks and their predictive performance is limited by the small number of events recorded when the exposure is measured at middle age [19, 20]. On the other hand, the studies have been based on populations from northern Europe and the United States, which hinders their application to other populations such as those in southern Europe [14, 17, 21]. The objective of this study was to develop competing risk models to predict the late risk of dementia based on risk factors at middle age using data from the European Prospective Investigation into Cancer and Nutrition (EPIC)-Spain cohort.
METHODS
Study design and subjects
The study design consisted of a prospective observational analysis of the EPIC cohort to develop predictive models and dementia risk scores. This design was feasible because the EPIC cohort assessed the exposure of individuals from the general population to risk factors in mid-life, the incidence of dementia throughout a 20-year follow-up, and the competing risk of death from other causes [14, 20, 22]. The sample included 25,015 participants (57% women), between 30 and 70 years old, from the three EPIC-Spain Dementia Cohort centers (Gipuzkoa, Navarra, and Murcia) [23]. The EPIC study protocol was approved by the International Agency for Research on Cancer Ethics Committee and the participants gave written informed consent to update their clinical information from available medical records.
Identification of dementia in the sample.
The baseline assessment of the EPIC study was carried out in 1992–1996 and did not include any cognitive questionnaires. Nonetheless, participants needed to demonstrate the physical and mental capacity necessary to complete extensive assessments, including a 1 h interview on their dietary habits. Fulfilling all the requirements for this interview implied that participants had normal cognition and failure to complete it led to exclusion from the study. Incident cases of dementia were identified by searching for this diagnosis in the electronic health record (EHR) and validating it with a protocol that has been described in detail elsewhere [23, 24]. First, to identify potential cases of dementia the EPIC registries and mortality registries were linked to the organizational databases of the Murcian, Basque, and Navarre Health Services using the dementia codes of the International Classification of Diseases and Related Health Problems 9a and 10a editions (ICD-9 : 290, 331 and ICD-10: F00–F03, G30), International Classification of Primary Care (ICPC2: P20, P70, N29, N99), and the Anatomical Therapeutic Chemical (ATC) classification system (N06DA02 [Donepezil], N06DA03 [Rivastigmine], N06DDA04 [Galantamine], and N06DX01 [Memantine]). Second, a group of neurologists reviewed all the information extracted from the EHR on potential cases of dementia using a validation protocol to confirm the incident cases identified. The follow-up of the sample was measured from the date of inclusion until the date of diagnosis, death, loss to follow-up or the most recent confirmation of vital status (December 31, 2017, for Gipuzkoa; December 31, 2015, for Navarra; and November 30, 2016, for Murcia). The diagnosis of dementia in computerized health records in Spain has been validated with a sensitivity of 80.2% and a specificity of 99.9% [25, 26].
Variables
Baseline data on diet, lifestyle, and medical history were collected during face-to-face interviews. In addition, participants underwent a physical examination to obtain anthropometric information. The study design has been described in more detail elsewhere [22]. The types of data collected at recruitment were: age, sex, level of education, body mass index (BMI), waist circumference (considering < 102 cm low in men and < 88 cm low in women), physical activity (active versus sedentary), adherence to a Mediterranean diet according to the relative Mediterranean Diet Score (rMED) and physical activity at work. The rMED score is a linear scale incorporating nine key components of a Mediterranean diet that ranks participants into low (0–6), moderate (7–10), and high (11–18) adherence groups. [27] Information on physical activity at work was used to classify individuals as active or non-active according to the Cambridge Physical Activity Index (CPAI) [28, 29]. Specifically, the four categories of the CPAI were re-coded as active versus not active (inactive, moderately inactive, and moderately active). We also included self-reported variables such as smoking, history of heart attack, stroke, arterial hypertension, hypercholesterolemia, diabetes, cancer, and asthma.
Statistical analysis
Differences between participants with and without dementia were assessed using Student’s t-tests or Mann-Whitney U tests for continuous variables and χ2 or Fisher’s exact tests for categorical variables. Missing values were handled by multiple imputation using the package mice created by van Buuren and Groothuis-Oudshoorn [30, 31].
Following the recommendations of Licher et al., we accounted for the competing risk of death from other causes [17]. A competing risk is an event whose occurrence precludes the occurrence of the primary event of interest [32]. For this reason, neither logistic regression nor Cox regression was used to construct the predictive models and scores, but rather the non-parametric models of Fine and Gray that analyze survival together with other competing risks [20]. We developed multivariate cause-specific Fine and Gray risk models to estimate the effect of the covariates on the cumulative incidence function or on the probability of events occurring over time, and thereby, estimated the expected probabilities over several years. The assumption of proportional hazards was checked by analyzing the Schoenfeld residuals. Besides variables found to be statistically significant, we took into account those used previously in predictive models and recommended in the literature [17, 33]. As the target was a southern European population, Mediterranean diet assessed by the rMED score was also incorporated into the model [24]. The discriminatory power of the model was assessed using the modified C statistic and the Brier score [34].
Age since recruitment was used as the time scale in the models. The end time was age at diagnosis (for cases), age at most recent follow-up (for participants at risk), or age at death. Given the cumulative number of cases from 55 years of age, scores were constructed from the models using, first, the entire study sample and, second, only those 55 years of age or older. To make the risk probabilities intuitive for the end user, a risk score was created based on the validated models by approximating all coefficients by integers such that the risk score was obtained by summing integer scores corresponding to each factor. Specifically, the estimated regression coefficients were multiplied by 10 to show more clearly the effect of the coefficients that make the smallest contributions. The hazard model was linear in the coefficients, with a one unit change in the covariate having an additive effect on the log hazard ratio equal to the regression coefficient. The resulting coefficients were rounded to the nearest integer to achieve a model based on integer scores and represented the component of the score for the presence of the given risk factor. The reference levels of the variables were assigned a score of zero, and this is the category that confers the least risk when a risk has more than two levels. [35] The discriminatory power of the final score was measured against that of the original model. Given the large effect of baseline age on the models [17], we built, besides the general model with the whole sample, a specific model for individuals aged 55 years or older. In contrast, as the baseline age distribution of the cohort was very young and the number of events in the population younger than 55 years very low, we did not build a specific model for individuals younger than 55 years.
Instead of split-sample methods, we applied bootstrap for estimating the performance of the predictive models with the “riskRegression” R library. This technique meant that 1,000 bootstrap samples with replacement were used to develop, first, a prediction model and, second, the performance of the estimated model. From the final regression models and based on their characteristics in middle age, each individual was assigned the probability that the event occurred before 15, 20, or 25 years respectively, and the calibration and discriminatory power of the predictive models were validated by comparing with the corresponding events observed for each instant in time [36, 37].
The calibration curve was generated at different years of follow-up and the Hosmer-Lemeshow C statistic was calculated [38]. To optimize the fit, calibration was achieved at 15, 20, and 25 years of follow-up. This C statistic compares the observed and expected number of cases that are ordered and grouped by quintile based on the estimated probability to have the event before time t.
The discrimination of the models was evaluated using the Brier score and the area under the receiver operating characteristic curve (AUC), which shows the sensitivity and the 1-specificity obtained at different cut-off values of the estimated probability for each time t in each predictive model evaluated. In addition, for two individuals in whom the event is observed, we would expect that the assigned probability would be higher for the one who experienced it earlier in time [34]. The Brier score compares the prognostic probabilities with the individual by individual results and is calculated as the root mean square difference between forecast probabilities and actual results [34]. Like reliability, the lower the value of the Brier score, the better the prognostic performance. Therefore, a perfect score is 0. Finally, we split the sample into three groups establishing cut-off points for the distribution of risk score percentiles. Cut-off points were set for low (the 30% of the sample with the lowest risk), moderate (> 30% –60%), and high (> 60% –100%) risk and we calculated the corresponding rates of incidence of dementia and mortality over time.
RESULTS
The initial data sample included 25,015 individuals. After cleansing records missing data in some variables (smoking, BMI, level of education, and/or rMed), we deleted 508 records and kept a database containing a total of 24,507 for analysis. Within these records, eleven variables were found to have some missing data, the one with the most missing data lacking values for 150 records and that with the least for just 3 records. Using multiple imputation for these cases, we processed the sample of 24,507 individuals. Their characteristics are summarized in Table 1. The 755 cases of dementia represented an incidence of 3.1% for the entire cohort. The incidence increased with age at recruitment, reaching 11.7% in those over 60 years of age. The mean follow-up was 21.5 years, with a mean age at recruitment of 49 years. The differences in risk of dementia associated with level of education stand out, ranging from 1.2% in individuals with higher education to 5.1% in the group without studies. The cases of dementia in over-50-year-olds represented 91.9% (694) of the total, 6.0% of individuals in this group being diagnosed with dementia compared to 0.5% of those in the younger group. Physical activity was associated with a lower probability of developing dementia (2.4% among those classified as active versus 3.2% among inactive participants).
Table 1
Baseline characteristics of the total sample and of the cases that developed dementia
| Number | % | Dementia | % | ||
| Total | 24,507 | 100.0 | 755 | 3.1 | |
| Sex | Women | 10,534 | 43.0 | 313 | 3.0 |
| Men | 13,973 | 57.0 | 442 | 3.2 | |
| Center | 33 | 8,344 | 34.0 | 268 | 3.2 |
| 34 | 7,919 | 32.3 | 216 | 2.7 | |
| 35 | 8,244 | 33.6 | 271 | 3.3 | |
| Age group, y | < 56 | 18,330 | 74.8 | 196 | 26.0 |
| 56–58 | 1,487 | 6.1 | 72 | 9.5 | |
| 58–60 | 1,449 | 5.9 | 109 | 14.4 | |
| 60–62 | 1,337 | 5.5 | 111 | 14.7 | |
| 62–64 | 1,174 | 4.8 | 146 | 19.3 | |
| 64–66 | 657 | 2.7 | 109 | 14.4 | |
| ≥66 | 73 | 0.3 | 12 | 1.6 | |
| Level of education | Primary | 7,962 | 32.5 | 404 | 5.1 |
| Secondary | 12,305 | 50.2 | 292 | 2.4 | |
| Higher | 4,240 | 17.3 | 59 | 1.4 | |
| Occupational physical activity | Active | 18,661 | 76.1 | 604 | 3.2 |
| Sedentary | 5,846 | 23.9 | 151 | 2.6 | |
| Myocardial infarction | No | 24,407 | 99.6 | 752 | 3.1 |
| Yes | 100 | 0.4 | 3 | 3.0 | |
| Stroke | No | 24,380 | 99.5 | 747 | 3.1 |
| Yes | 127 | 0.5 | 8 | 6.3 | |
| Hypertension | No | 19,584 | 79.9 | 511 | 2.6 |
| Yes | 4,923 | 20.1 | 244 | 5.0 | |
| Hyperlipemia | No | 19,338 | 78.9 | 518 | 2.7 |
| Yes | 5,169 | 21.1 | 237 | 4.6 | |
| Diabetes | No | 23,288 | 95.0 | 669 | 2.9 |
| Yes | 1,219 | 5.0 | 86 | 7.1 | |
| Cancer | No | 24,287 | 99.1 | 743 | 3.1 |
| Yes | 220 | 0.9 | 12 | 5.5 | |
| Asthma | No | 23,810 | 97.2 | 734 | 3.1 |
| Yes | 697 | 2.8 | 21 | 3.0 | |
| Physical activity | Active | 2,991 | 12.2 | 71 | 2.4 |
| Not active | 21,516 | 87.8 | 684 | 3.2 | |
| Smoking | Smoker | 7,115 | 29.0 | 137 | 1.9 |
| No smoker | 17,392 | 71.0 | 618 | 3.6 | |
| Body mass index (categories), kg/m2 | < 25 | 5,763 | 23.5 | 100 | 1.7 |
| 25–30 | 11,984 | 48.9 | 361 | 3.0 | |
| > 30 | 6,760 | 27.6 | 294 | 4.3 | |
| Waist circumference | High | 10,684 | 43.6 | 456 | 4.3 |
| Low | 13,823 | 56.4 | 299 | 2.2 | |
| rMed | Low (< 7) | 3,093 | 12.6 | 75 | 2.4 |
| Moderate (7–10) | 12,086 | 49.3 | 364 | 3.0 | |
| High (≥11) | 9,328 | 38.1 | 316 | 3.4 | |
| Mean | Standard deviation | Mean | Standard deviation | ||
| Age at recruitment | 49.08 | 7.75 | 58.36 | 5.41 | |
| Follow-up time | 21.61 | 3.45 | 17.48 | 4.09 |
rMed, relative Mediterranean Diet Score.
The Fine and Gray models for the entire sample and the specific version for people≥55 years of age established total scores, from summing the scores for all the factors included, of 148 and 79 points respectively (Table 2). Unlike predictive models based on logistic regression, their calibration and discrimination indicators vary according to the length of follow-up. The calibration curves that compare the observed and predicted cases by quintile at 15, 20, and 25 years are shown in Fig. 1. A model is said to be calibrated if the number of expected cases is not significantly different from the number of observed cases.
Table 2
Results from the Fine and Gray models in terms of odds ratios, confidence intervals and risk scores for the entire population and for those≥55 years of age
| Entire population | ≥55 years | |||||
| OR | OR CIs | Score | OR | CI | Score | |
| Sex (men versus women) | 1.09 | [0.84–1.42] | 1 | 1.11 | [0.87–1.42] | 1 |
| Physical activity (active versus sedentary) | 1.15 | [0.94–1.41] | 1 | 1.12 | [0.89–1.42] | 1 |
| Hypertension (yes versus no) | 1.06 | [0.90–1.25] | 1 | 1.00 | [0.83–1.19] | 0 |
| Waist circumference (high versus low) | 1.03 | [0.81–1.31] | 0 | 1.00 | [0.98–1.01] | 0 |
| Hyperlipemia (yes versus no) | 1.26 | [1.07–1.48] | 2 | 1.18 | [0.99–1.42] | 2 |
| Diabetes (yes versus no) | 1.31 | [1.03–1.67] | 3 | 1.28 | [0.99–1.65] | 2 |
| Cambridge index (not active versus active) | 1.12 | [0.86–1.44] | 1 | 1.07 | [0.79–1.44] | 1 |
| Smoker (no versus yes) | 1.24 | [1.02–1.52] | 2 | 1.16 | [0.90–1.49] | 1 |
| Age, y | ||||||
| ≥55 | Ref. | [Ref.-Ref.] | Ref. | [Ref.-Ref.] | ||
| 56–58 | 3.88 | [2.94–5.13] | 14 | 1.31 | [0.85–2.03] | 3 |
| 58–60 | 6.11 | [4.76–7.84] | 18 | 2.09 | [1.37–3.16] | 7 |
| 60–62 | 6.71 | [5.23–8.61] | 19 | 2.31 | [1.52–3.50] | 8 |
| 62–64 | 10.23 | [8.12–12.89] | 23 | 3.53 | [2.35–5.30] | 13 |
| 64–66 | 13.87 | [10.74–17.91] | 26 | 4.79 | [3.15–7.29] | 16 |
| ≥66 | 13.32 | [7.26–24.44] | 26 | 4.66 | [2.34–9.29] | 15 |
| Level of education | ||||||
| Higher | Ref. | [Ref.-Ref.] | Ref. | [Ref.-Ref.] | ||
| Secondary | 1.39 | [1.04–1.85] | 3 | 1.23 | [0.88–1.71] | 2 |
| Primary | 1.66 | [1.24–2.23] | 5 | 1.37 | [0.98–1.90] | 3 |
| Body mass index, kg/m2 | ||||||
| < 26 | Ref. | [Ref.-Ref.] | Ref. | [Ref.-Ref.] | ||
| 25–30 | 1.10 | [0.87–1.40] | 1 | 1.01 | [0.76–1.35] | 0 |
| ≥30 | 1.26 | [0.95–1.60] | 2 | 1.22 | [0.85–1.75] | 2 |
| rMed | ||||||
| High (≥11) | Ref. | [Ref.-Ref.] | Ref. | [Ref.-Ref.] | ||
| Moderate ([7–10)]) | 1.03 | [0.88–1.20] | 0 | 1.14 | [0.84–1.54] | 1 |
| Low (< 7) | 1.00 | [0.77–1.29] | 0 | 1.07 | [0.79–1.45] | 1 |
| Total Score | 148 | 79 | ||||
OR, odds ratio; rMed, relative Mediterranean Diet Score.
Fig. 1
Calibration plot for the entire population and those≥55 years of age by years of follow-up comparing observed and predicted cases at 15, 20 and 25 years of follow-up. Time, years after prediction.
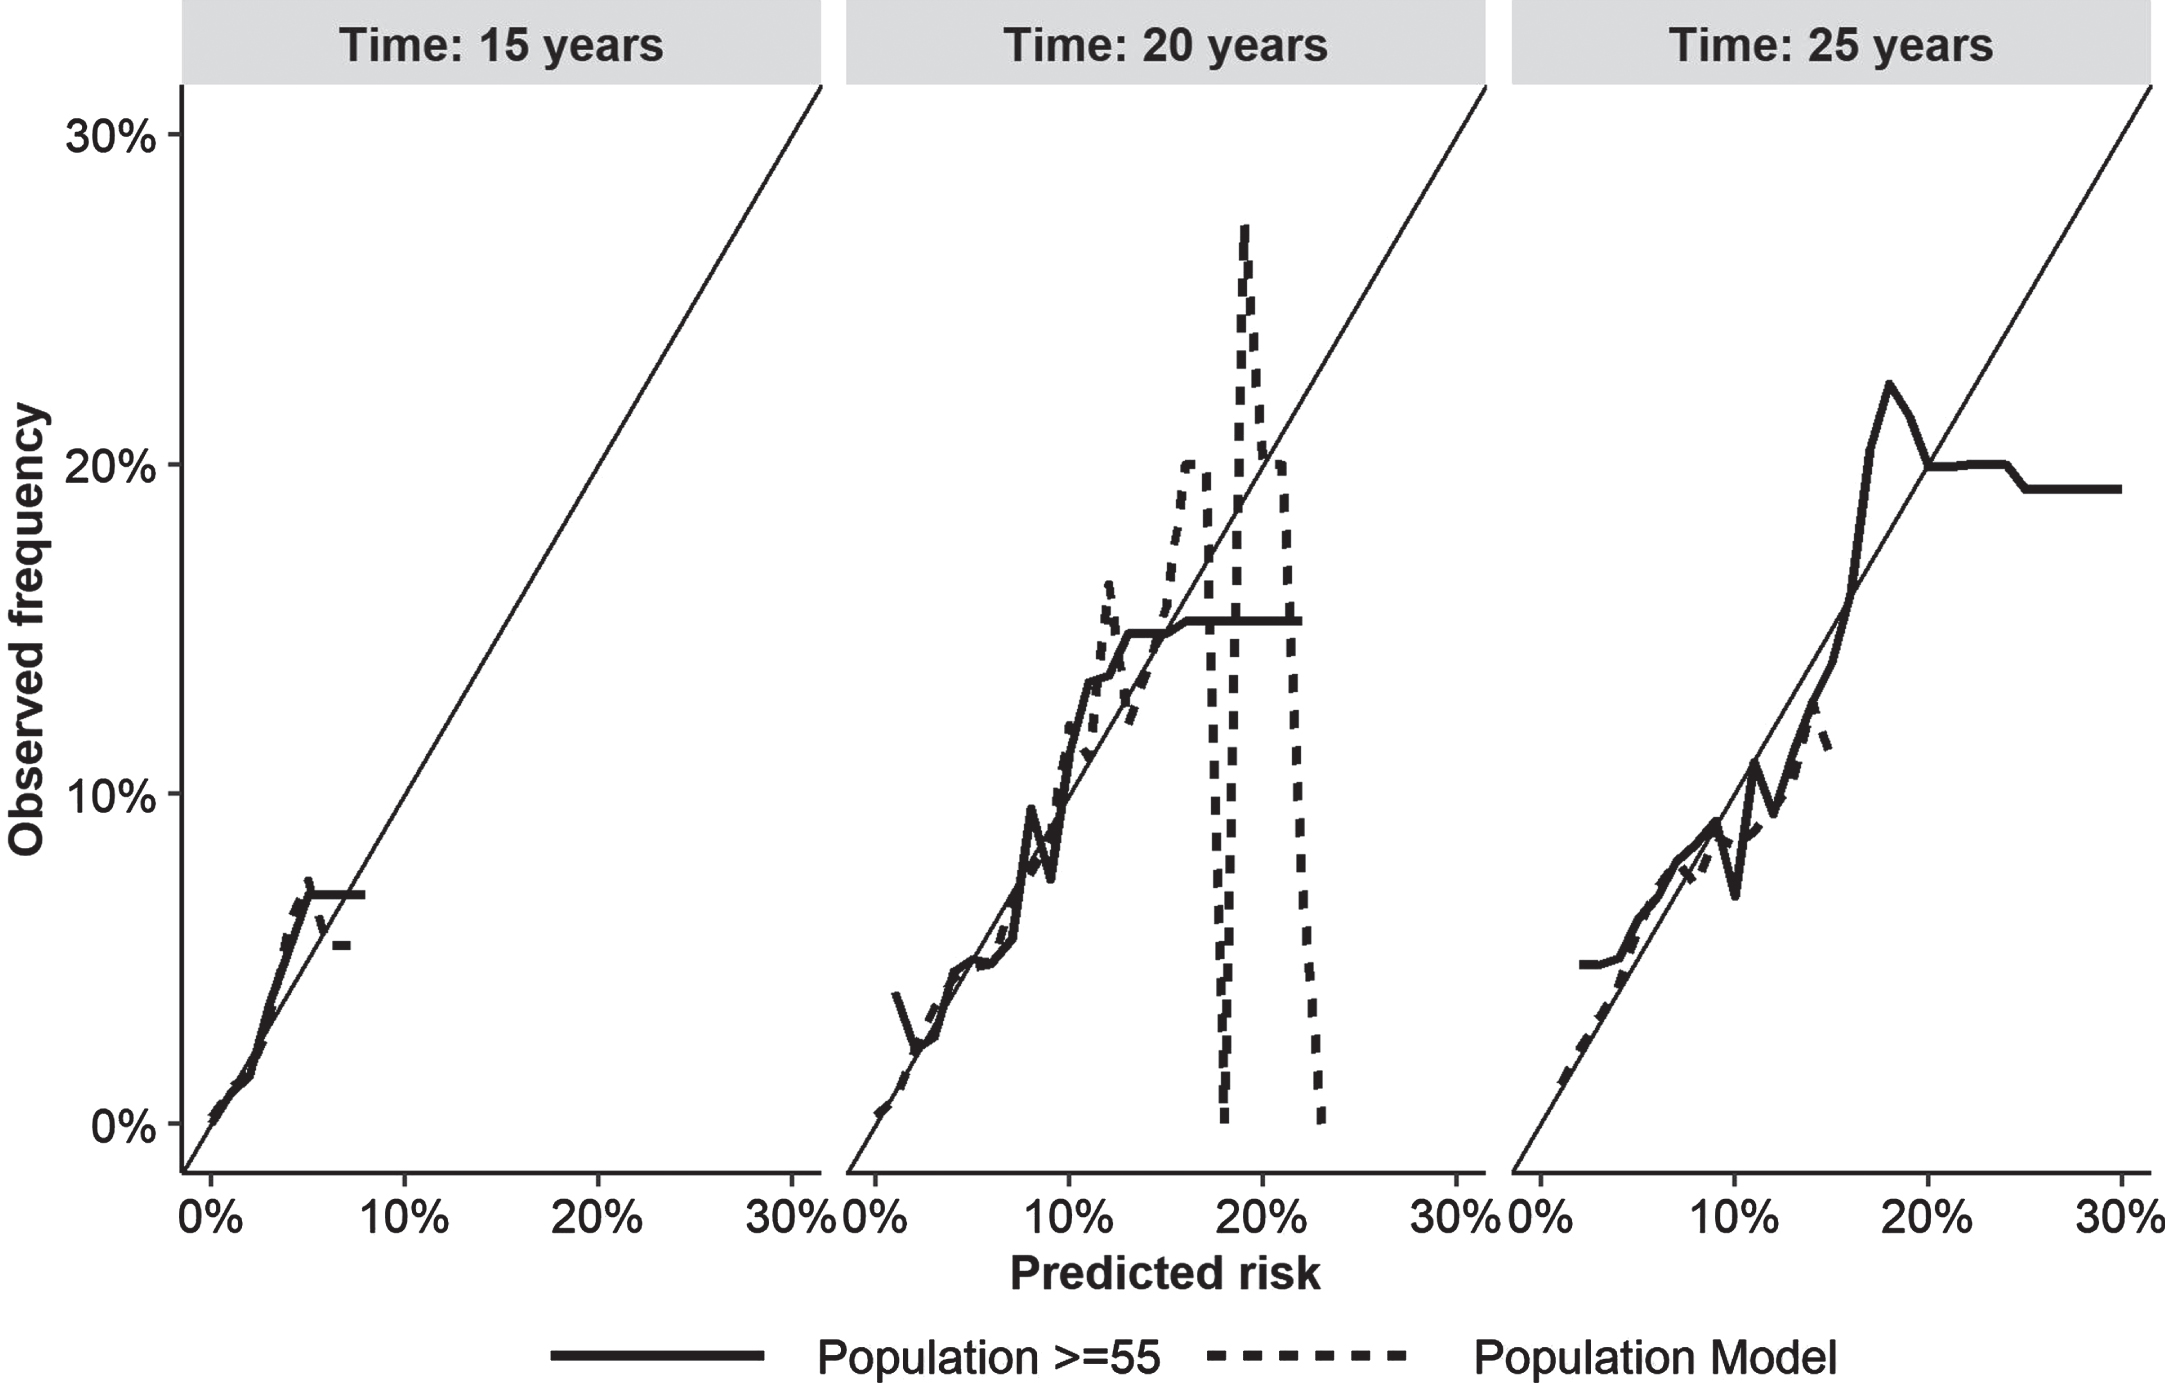
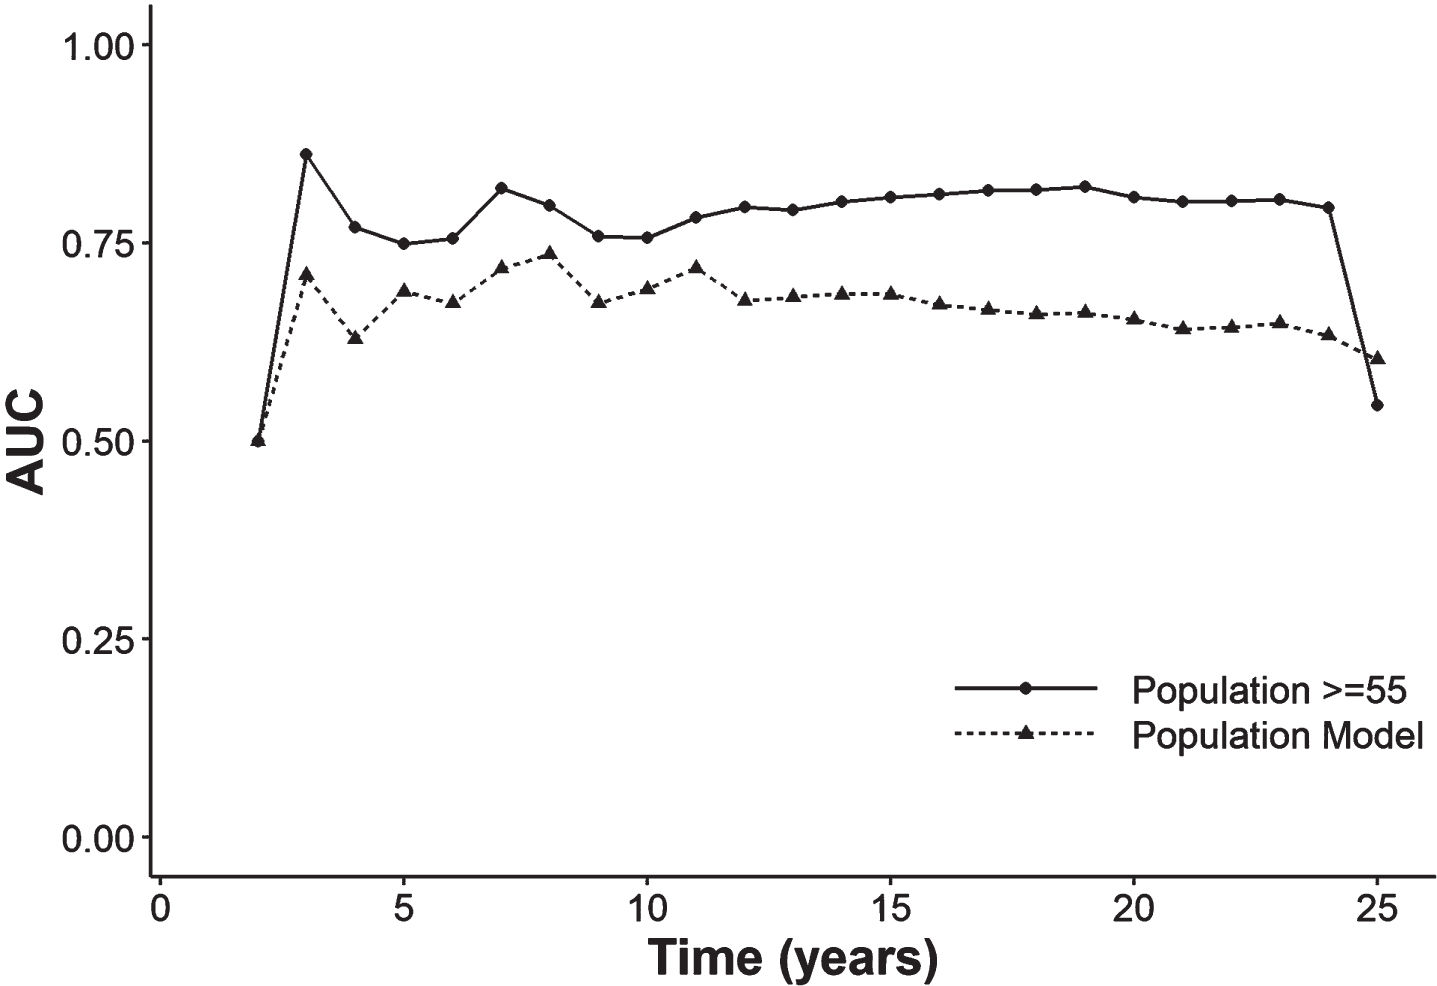
Figure 2 and Supplementary Table 1 report the AUC and the Brier score throughout the fortnightly follow-up (5, 10, 15, 20, and 25 years). The AUC of the model for people over-55-year-olds was much higher (80.8%) than the overall AUC (68.5%) in the first 15 years of follow-up and remained that way in the subsequent follow-up. The Brier score is close to 0 in both models, although it rises slightly at 25 years of follow-up.
Fig. 2
Area under the receiver operating characteristic curve throughout the follow-up in the model with the entire population and with people≥55 years of age. AUC, area under the curve
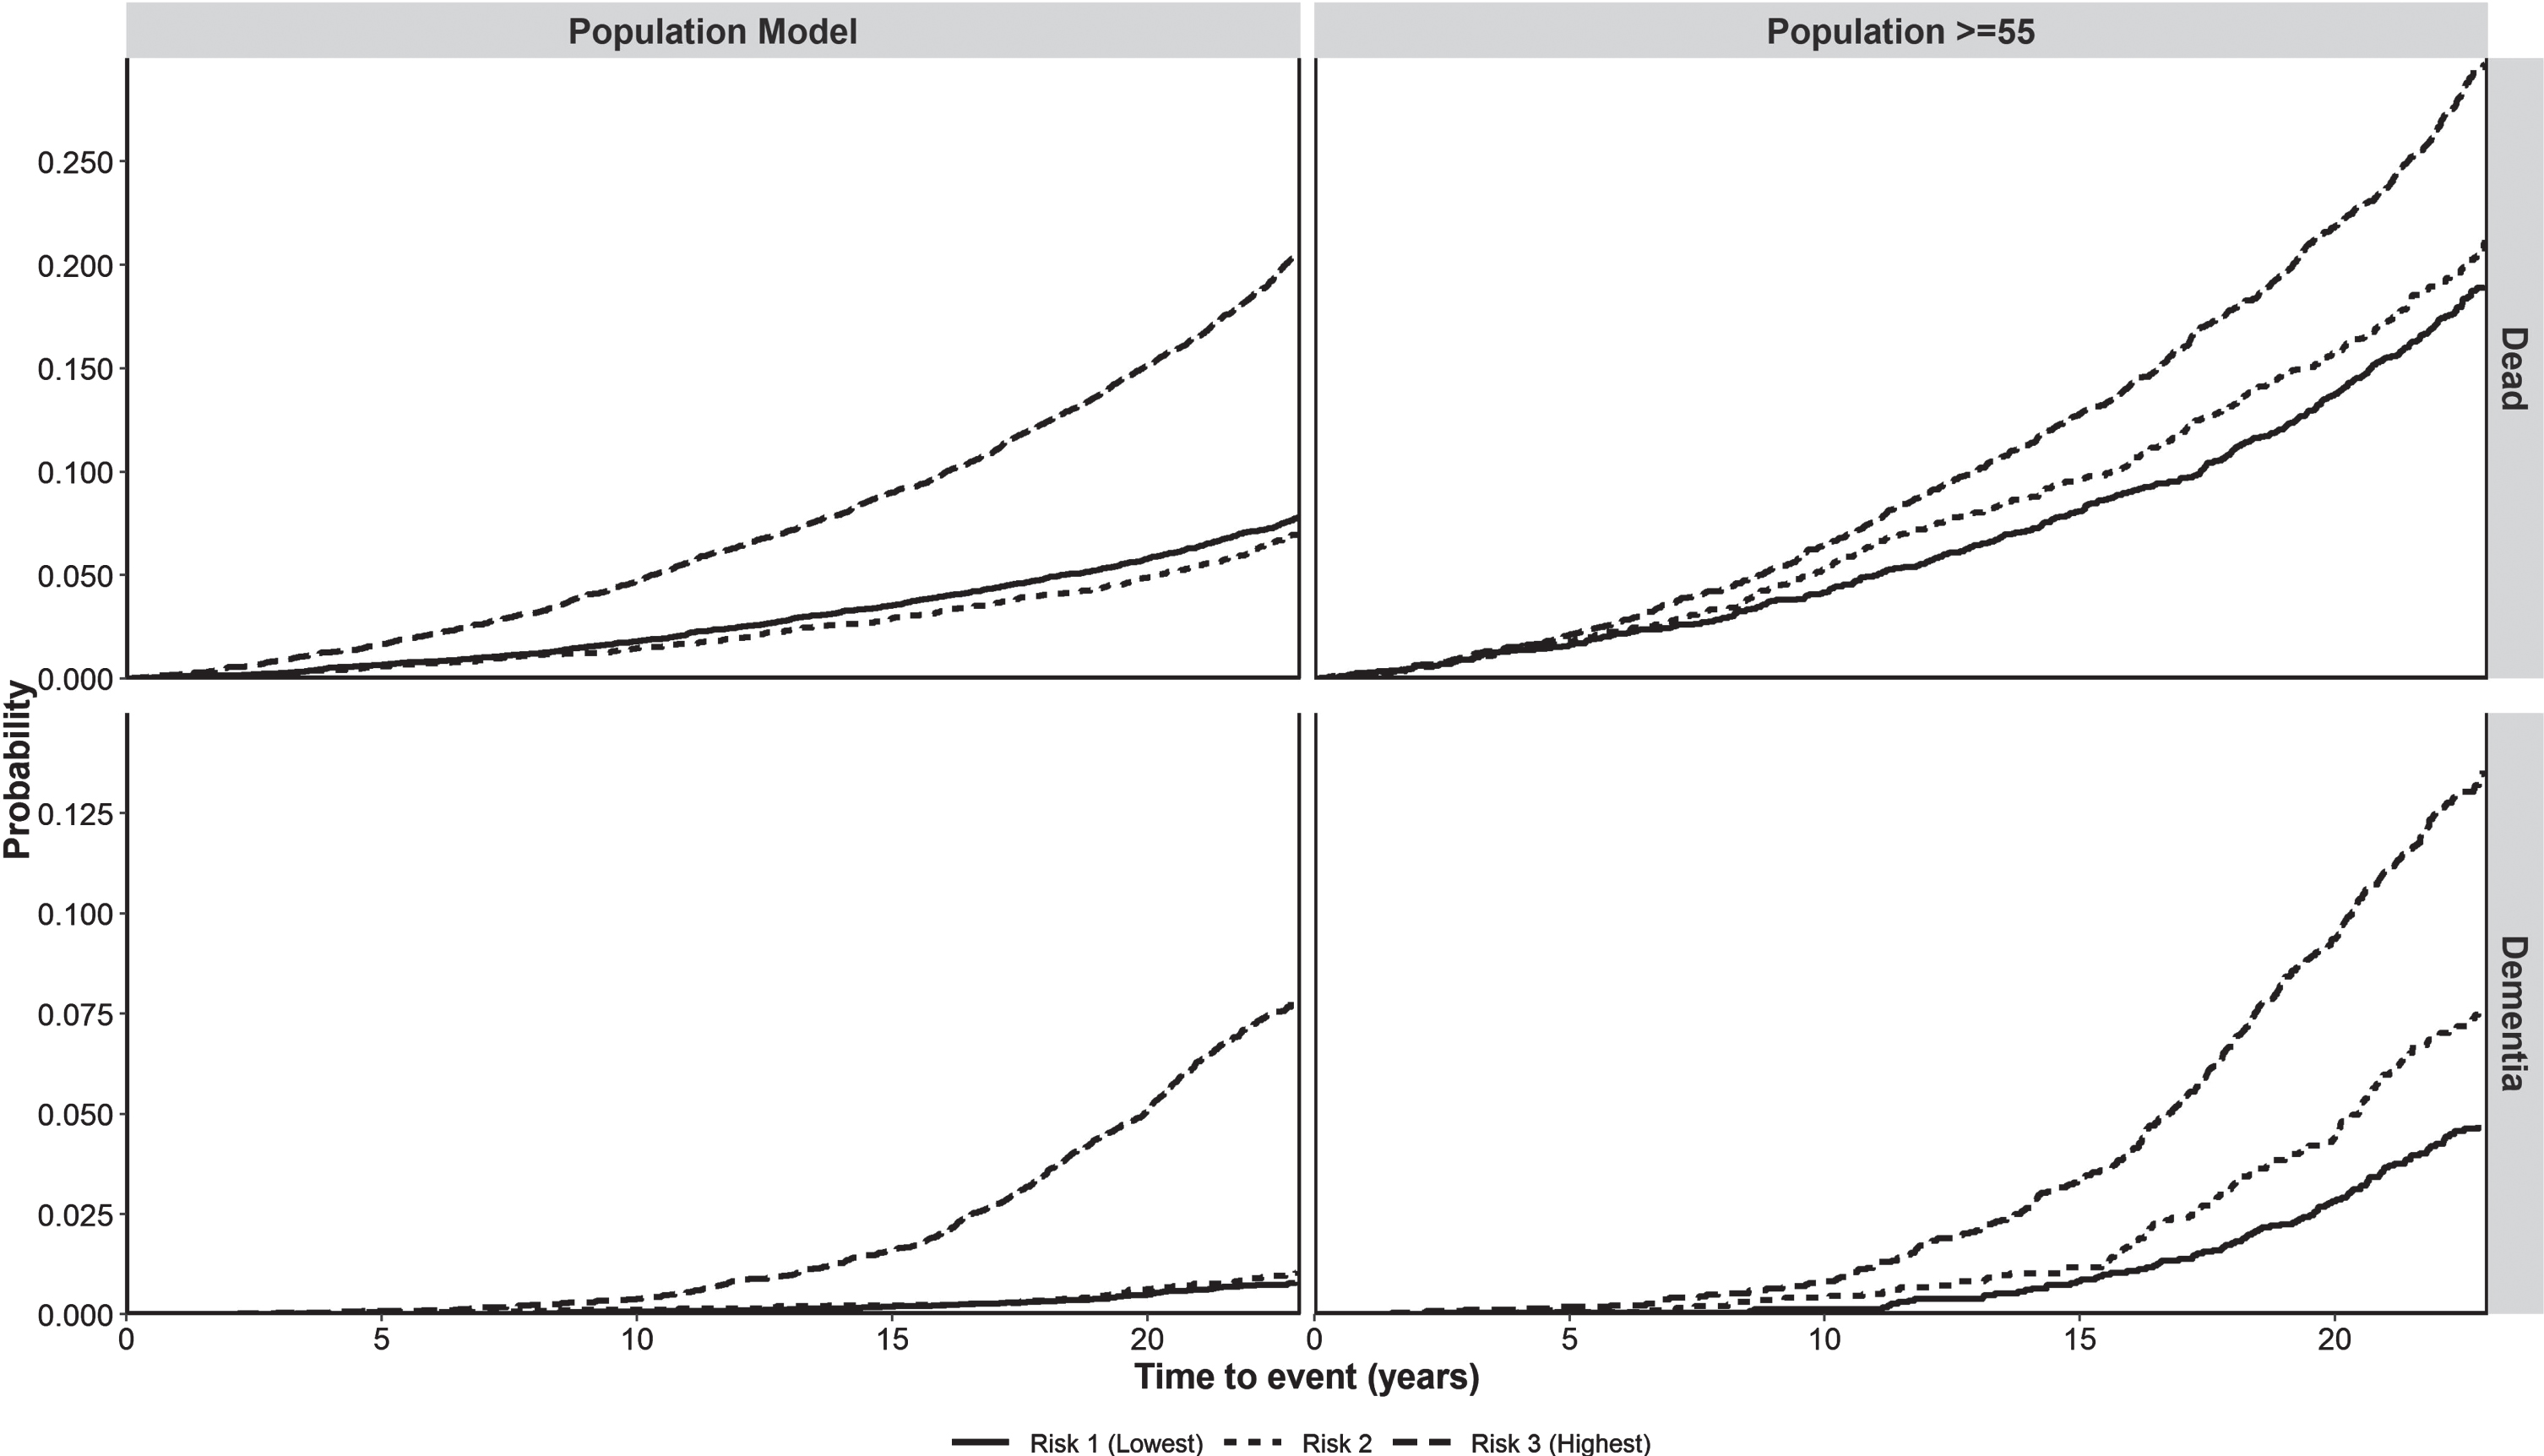
The score made it possible to differentiate three levels of risk of developing dementia in the model with the entire population (low < 8, moderate 8–11, and high > 11) and for those≥55 years (low < 12, moderate 12–16, and high > 16). Having classified the population, we obtained Fig. 3, which plots the cumulative incidence of dementia by the category of the score according to the years of follow-up (5, 10, 15, 20, or 25). In contrast, Fig. 4 presents separately both the probability of death and that of dementia for the two populations analyzed, disaggregated by risk group. This allowed us to see that the weight of the competing risk of death was greater than that of dementia, especially when the entire population is included. In the model with the entire population, the intermediate-risk group behaved like the low-risk group. In contrast, when selecting those≥55 years of age, the intermediate-risk group has a similar risk of death to the high-risk group and an intermediate risk of dementia.
Fig. 3
Incidence of dementia for the different levels of scores by length of follow-up (5, 10, 15, 20, 25 years) in the whole population and in people≥55 years of age. t5, t10, t15, t20, t25 : 5, 10, 15, 20, 25 years of follow-up.
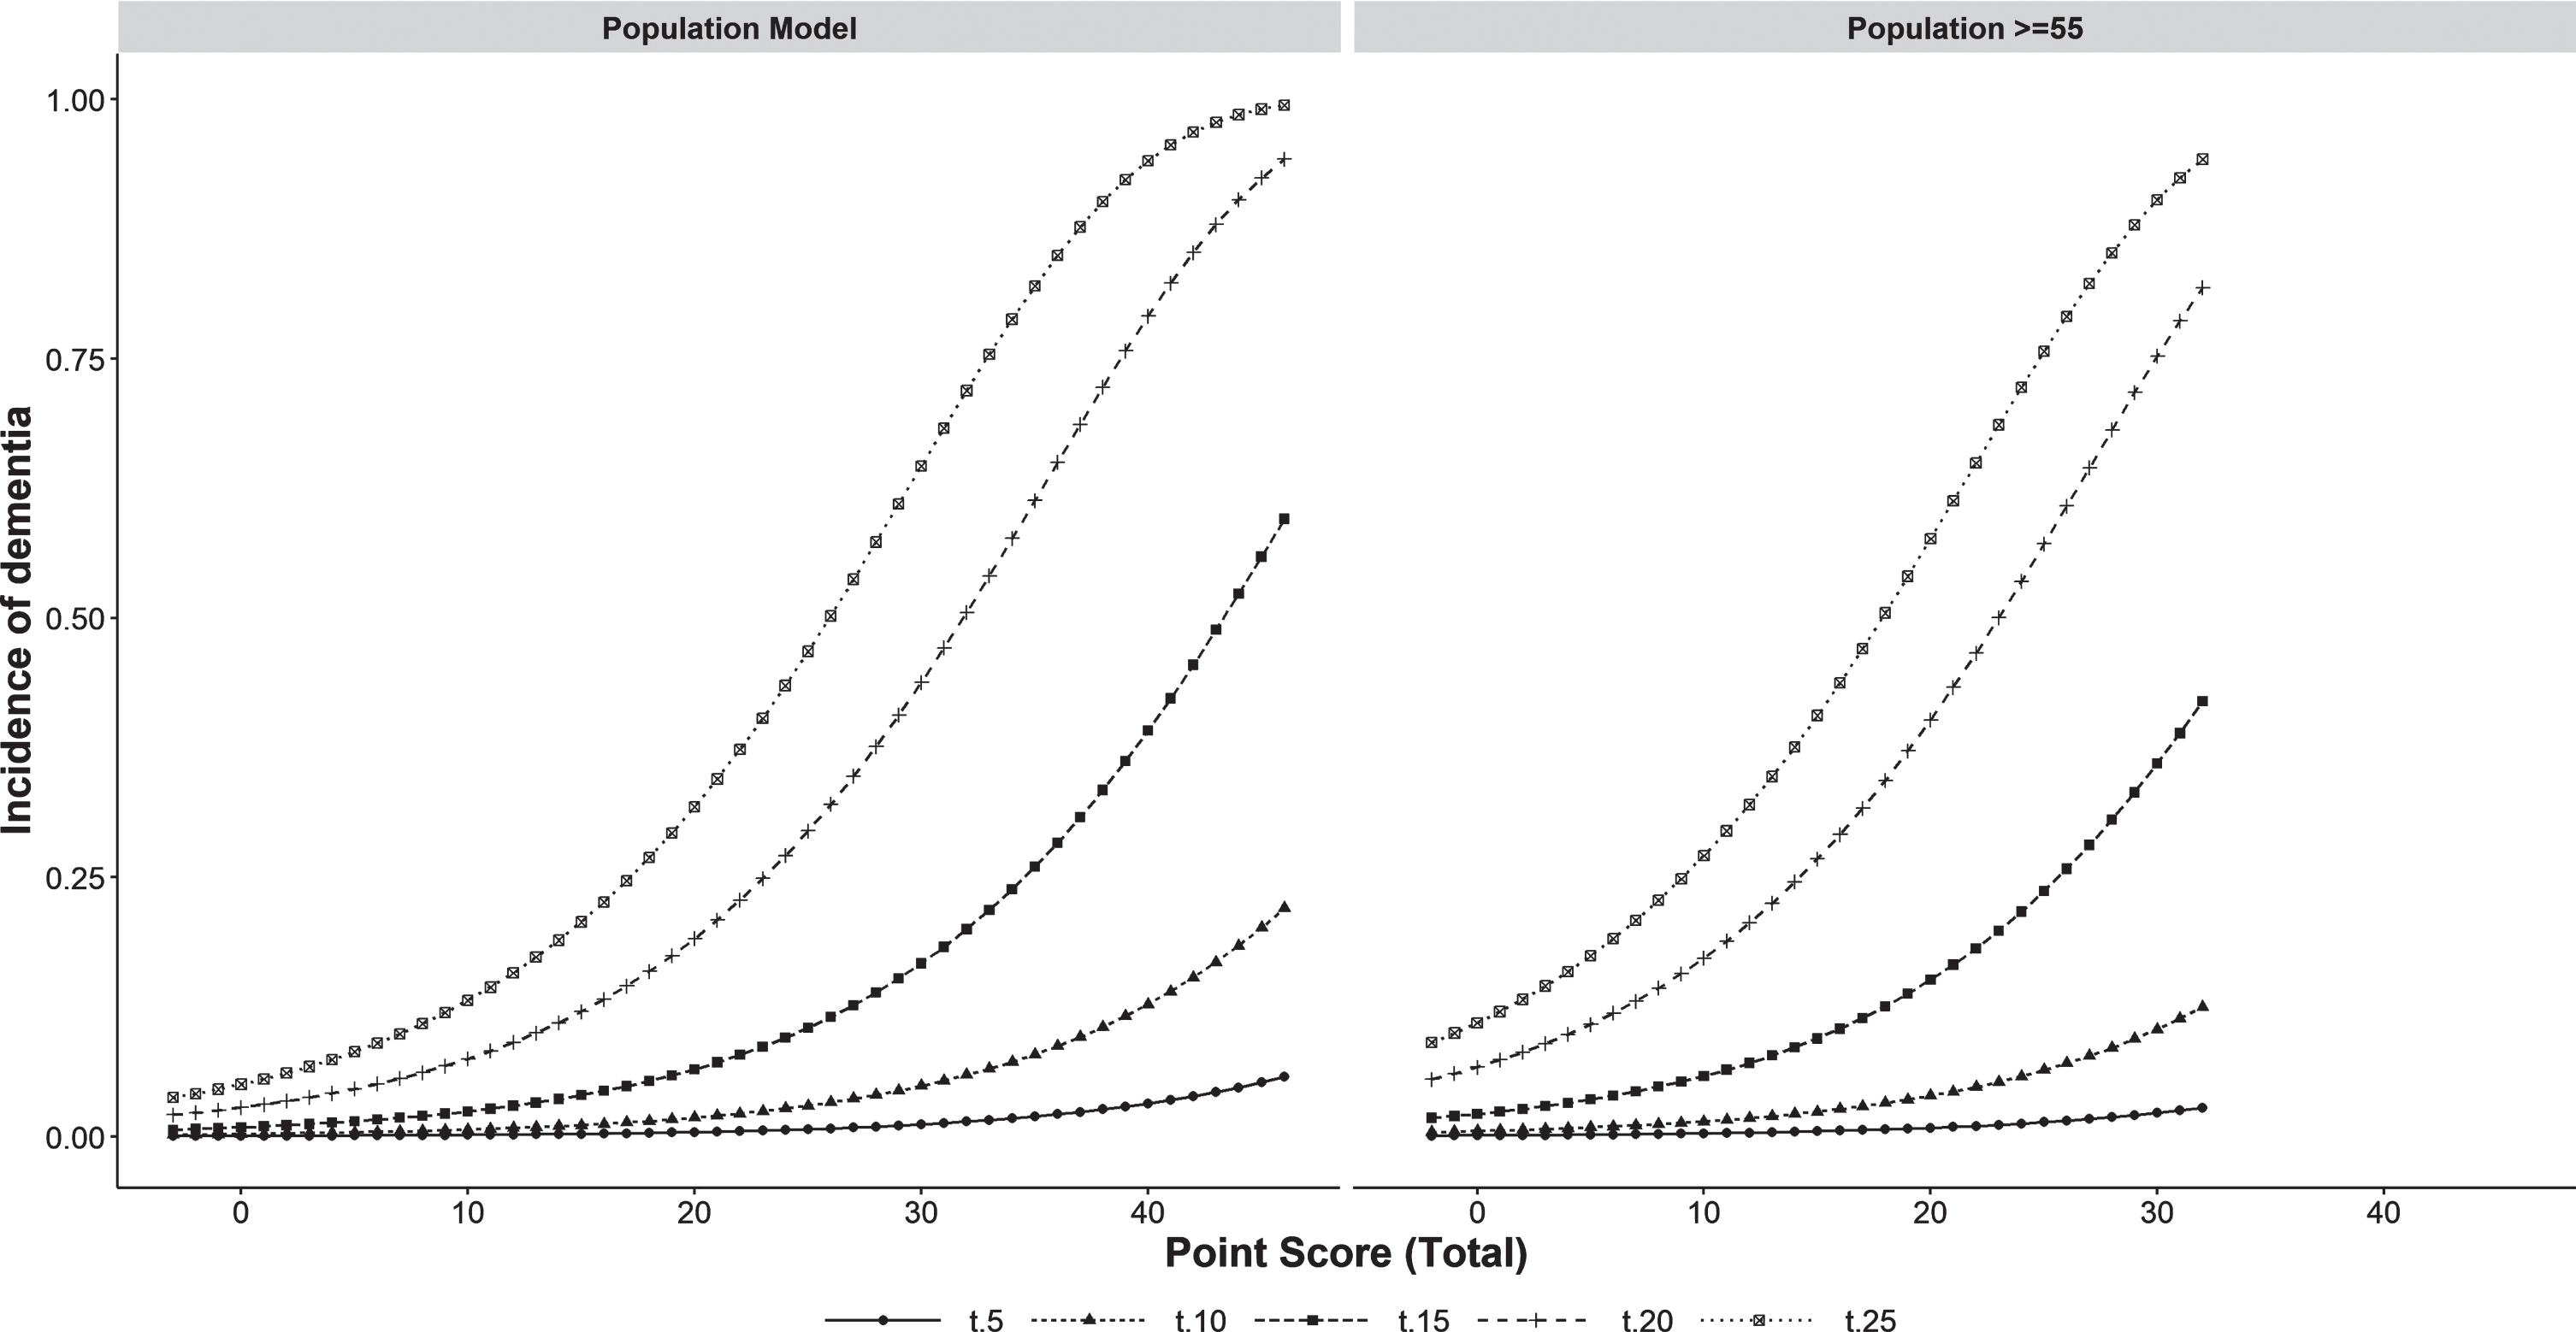
Fig. 4
Probability of cumulative incidence of death and dementia in the whole population and people≥55 years of age according to level of risk. Probability, probability of having the event (dementia or death).
DISCUSSION
This study presents the first dementia risk score calculated in a southern European population in mid-life and followed up for 20 years. Its use allows early identification of individuals who could be a target population for the prevention of dementia based on the intensive control of risk factors. We are unable to compare our models with most risk prediction models since they address populations over 65 years of age [17, 21], while our score, like the Cardiovascular Risk Factors, Aging, and Incidence of Dementia (CAIDE) Dementia Risk Score, analyzes a younger population [14]. It is difficult to establish which populations should be the focus of dementia prevention policies primarily due to the need to compromise between the optimal window for intervention and the ability to assess effectiveness [39, 40]. As Livingston et al. say, in the prevention of dementia, it is never too early or too late [41]. Generally, models have considered stratifying the risk from 65 years of age [17, 21]. They have the advantage that the older the age of the sample, the easier it is to measure the effectiveness of an intervention and the better the performance (predictive accuracy) of the model since it has more events for statistical analysis [19]. On the other hand, at older ages, it is biologically less viable to reverse or delay the neuropathological processes associated with dementia. That is, whether the pathological substrate is amyloid or vascular, the earlier the preventive intervention, the more effective it will be in delaying the progression to dementia. In practice, both early models (45–65 years) aimed at primary prevention in the entire population and later models (> 65 years) aimed at secondary prevention in individuals at higher risk will be necessary. As Sexton and Yaffe point out, preventive policies will differ depending on whether they try to slow down the transition from a healthy status to MCI or from the MCI stage to that of dementia [16].
When comparing our score with the CAIDE Dementia Risk Score, it is found that the protective and risk factors are similar, although the weight of each of them differs. Comparison with other dementia risk functions is more difficult because they are aimed at later stages. The external validation of these functions according to the literature has been disappointing when age is removed [17, 18]. As in our models, how age is included in the model is a key determinant of its predictive performance. Therefore, it is also suitable for use in the selection of target populations for multidomain preventive interventions such as the Finnish Geriatric Intervention Study to Prevent Cognitive Impairment and Disability (FINGER) [5].
Our model achieved good predictive performance with AUCs of 80.8% at 15 years and at 20 years, which was based on its great discriminatory power when separating the population≥55 years of age into three risk groups for both dementia and death. Further, the calibration curves and the Brier score close to zero confirmed the good fit of the model by comparing its results with those observed. Licher et al. have highlighted the lack of dementia prediction models that take into account the competing risk of death and the relevance of their use to avoid overestimating the incidence of dementia [17, 42]. A strength of the Fine and Gray models is that they allowed us to analyze the performance of stratification into three groups separately in both competing risks (death and dementia). The two extreme risk groups (high and low) behaved consistently in the two models for both the incidence of dementia and death. On the other hand, in the model for people≥55 years of age, the incidence of dementia in the intermediate-risk group lay between the other two curves while it overlapped with the high-risk group for death.
Given the epidemiological differences between countries, dementia prevention policies must be adapted to local characteristics, which implies developing specific risk scores for the selection of target populations in each country [16]. Analyzing the differences in predictive performance between the two models that we have developed, we concluded that the score that makes the most sense to apply in our context is that of the population≥55 years of age. The general model weights age in such a way that it dilutes the weight of the rest of the risk factors. It indicates that below 55 years of age we do not need predictive risk stratification models since what matters is to closely monitor people who at that early age are smokers or have diabetes, hypertension, or hypercholesterolemia, while promoting physical, social, and intellectual activity in the whole population. On the contrary, the model in those≥55 years of age takes into account the weight of the other factors and makes it possible to identify higher risk profiles.
Most of the variables included are cardiovascular factors and their relationship with dementia is in line with that with heart health, confirming the well-known adage that “What is good for your heart is good for your brain” [43]. Long-term cohort analysis has shown a reduction in the incidence of dementia in recent years, associated with an improvement in cardiovascular factors [44]. In relation to this, a question that arises is whether these predictive models are taking into account a pattern of variables related to the vascular pathophysiology of dementia, but not to the amyloid cascade. As in all scores, years in education are also a protective factor in our model [14, 17, 18]. Unlike the variables that measure cardiovascular risk, the protective effect of education is related to the improvement in cognitive reserve through a different pathophysiological mechanism [41, 45].
Limitations
Our study had some limitations. Despite the diagnosis of dementia being validated by a panel of neurologists, it would have been desirable to also have an initial and final cognitive assessment of the individuals in the sample. Further, we have collected the data from health records that have demonstrated their validity as a method of identifying dementia. Specifically, in Spain, positive predictive values of 95.1% and negative of 99.4% have been documented. Although the specificity is very high, this approach implies a loss of sensitivity. Nonetheless, the figure of 80% measured in the validation study for average sensitivity might be higher in our work given the differences in the distribution of age of diagnosis between the two samples. The sensitivity of the diagnosis of dementia is higher in younger age groups and the mean age of dementia diagnosis in our cohort is much lower than that of the incident cases in the general population [25, 26]. Despite the large sample size achieved in our case, a limitation of risk models in young populations is the small number of recorded events since this increases the confidence intervals and reduces statistical significance. Nonetheless, given existing evidence, factors such as sex, physical exercise, hypertension and hyperlipidemia were included despite not reaching statistical significance [41]. The lack of statistical significance of unhealthy lifestyle and medical conditions could be explained by the selection bias associated with the recruitment process of the cohort. As participants needed to demonstrate the physical and mental capacity necessary to complete extensive assessments, not only those who had cognitive impairment but also those who were physically might have been excluded. Further, BMI and abdominal circumference were included as separate variables because they represent different substrates of cardiovascular pathophysiology [46].
Conclusions
This study presents the first dementia risk score calculated in a southern European population in mid-life and followed up for 20 years and its main conclusion is that our score makes it possible to select target populations for multidomain interventions in southern European populations, taking into account their risk of dementia in a valid way. In this way, it may be possible achieve the early identification of at-risk individuals who could then be targeted for the prevention of dementia based on the intensive control of risk factors. Strengths of this model include the large sample size, the 20-year follow-up of a middle-aged population and the use of statistical methods that take into account competing risks.
ACKNOWLEDGMENTS
We thank all EPIC-Spain participants for their contribution to the study. We would like to acknowledge the help of Ideas Need Communicating Language Services in improving the use of English in the manuscript.
The EPIC study received financial support from the International Agency for Research on Cancer (AEP/93/06), the European Commission (SO-97-200302-05F02, SP23-CT-2005-006438), the Health Research Fund (FIS) of the Spanish Ministry of Health, the Red Temática de Investigación Cooperativa de Centros de Cáncer (RTICCC C03/10, RD06/0020), the CIBER de Epidemiología y Salud Pública (CIBERESP), the participating Regional Governments of Andalusia, Asturias, Basque Country, Murcia (no. 6236), and Navarra, and the Catalan Institute of Oncology (ICO). The EPIC-Murcia study received partial funding from the Fundación Seneca (19487/PI/14), the Murcia Biomedical Research Institute (IMIB)-FFIS and the Spanish Biomedical Research Network Center (CIBER) (BOE-A-2020-6018). The funding sources had no involvement in study design, in the collection, analysis and interpretation of data, in the writing of the report; and in the decision to submit the article.
Authors’ disclosures available online (https://www.j-alz.com/manuscript-disclosures/21-5211r3).
SUPPLEMENTARY MATERIAL
[1] The supplementary material is available in the electronic version of this article: https://dx.doi.org/10.3233/JAD-215211.
REFERENCES
[1] | Mangialasche F , Kivipelto M , Solomon A , Fratiglioni L ((2012) ) Dementia prevention: Current epidemiological evidence and future perspective. Alzheimers Res Ther 4: , 6. |
[2] | Barnes DE , Yaffe K ((2011) ) The projected effect of risk factor reduction on Alzheimer’s disease prevalence. Lancet Neurol 10: , 819–828. |
[3] | Soto-Gordoa M , Arrospide A , Moreno-Izco F , Martínez-Lage P , Castilla I , Mar J ((2015) ) Projecting burden of dementia in Spain, 2010-2050: Impact of modifying risk factors. J Alzheimers Dis 48: , 721–730. |
[4] | Cummings J , Lee G , Ritter A , Sabbagh M , Zhong K ((2019) ) Alzheimer’s disease drug development pipeline: 2019. Alzheimers Dement (NY) 5: , 272–293. |
[5] | Kivipelto M , Mangialasche F , Snyder HM , Allegri R , Andrieu S , Arai H , Baker L , Belleville S , Brodaty H , Brucki SM , Calandri I , Caramelli P , Chen C , Chertkow H , Chew E , Choi SH , Chowdhary N , Crivelli L , Torre RDL , Du Y , Dua T , Espeland M , Feldman HH , Hartmanis M , Hartmann T , Heffernan M , Henry CJ , Hong CH , Håkansson K , Iwatsubo T , Jeong JH , Jimenez-Maggiora G , Koo EH , Launer LJ , Lehtisalo J , Lopera F , Martínez-Lage P , Martins R , Middleton L , Molinuevo JL , Montero-Odasso M , Moon SY , Morales-Pérez K , Nitrini R , Nygaard HB , Park YK , Peltonen M , Qiu C , Quiroz YT , Raman R , Rao N , Ravindranath V , Rosenberg A , Sakurai T , Salinas RM , Scheltens P , Sevlever G , Soininen H , Sosa AL , Suemoto CK , Tainta-Cuezva M , Velilla L , Wang Y , Whitmer R , Xu X , Bain LJ , Solomon A , Ngandu T , Carrillo MC ((2020) ) World-Wide FINGERS Network:A global approach to risk reduction and prevention of dementia. Alzheimers Dement 16: , 1078–1094. |
[6] | Mar J , Soto-Gordoa M , Arrospide A , Moreno-Izco F , Martínez-Lage P ((2015) ) Fitting the epidemiology and neuropathology of the early stages of Alzheimer’s disease to prevent dementia. Alzheimers Res Ther 7: , 2. |
[7] | Brayne C ((2007) ) The elephant in the room - healthy brains in later life, epidemiology and public health. Nat Rev Neurosci 8: , 233–239. |
[8] | Stephan BCM , Kurth T , Matthews FE , Brayne C , Dufouil C ((2010) ) Dementia risk prediction in the population: Are screening models accurate? Nat Rev Neurol 6: , 318–326. |
[9] | Solomon A , Mangialasche F , Richard E , Andrieu S , Bennett DA , Breteler M , Fratiglioni L , Hooshmand B , Khachaturian AS , Schneider LS , Skoog I , Kivipelto M ((2014) ) Advances in the prevention of Alzheimer’s disease and dementia. J Intern Med 275: , 229–250. |
[10] | Angehrn Z , Nordon C , Turner A , Gove D , Karcher H , Keenan A , Neumann M , Sostar J , de Reydet de Vulpillieres F ((2019) ) Ethical and social implications of using predictive modeling for Alzheimer’s disease prevention: A systematic literature review protocol. BMJ Open 9: , e026468. |
[11] | Pocock SJ , McCormack V , Gueyffier F , Boutitie F , Fagard RH , Boissel JP ((2001) ) A score for predicting risk of death from cardiovascular disease in adults with raised blood pressure, based on individual patient data from randomised controlled trials. BMJ 323: , 75–81. |
[12] | Lindström J , Tuomilehto J ((2003) ) The diabetes risk score: A practical tool to predict type 2 diabetes risk. Diabetes Care 26: , 725–731. |
[13] | D’Agostino RB , Grundy S , Sullivan LM , Wilson P , CHD Risk Prediction Group ((2001) ) Validation of the Framingham coronary heart disease prediction scores: Results of a multiple ethnic groups investigation. JAMA 286: , 180–187. |
[14] | Kivipelto M , Ngandu T , Laatikainen T , Winblad B , Soininen H , Tuomilehto J ((2006) ) Risk score for the prediction of dementia risk in 20 years among middle aged people: A longitudinal, population-based study. Lancet Neurol 5: , 735–741. |
[15] | Stephan BCM , Brayne C ((2014) ) Risk factors and screening methods for detecting dementia: A narrative review 42. J Alzheimers Dis Suppl 4: , S329–338. |
[16] | Sexton CE , Yaffe K ((2019) ) Population-based approaches to dementia prevention. J Alzheimers Dis 70: , S15–S17. |
[17] | Licher S , Yilmaz P , Leening MJG , Wolters FJ , Vernooij MW , Stephan BCM , Ikram MK , Ikram MA ((2018) ) External validation of four dementia prediction models for use in the general community-dwelling population: A comparative analysis from the Rotterdam Study. Eur J Epidemiol 33: , 645–655. |
[18] | Fayosse A , Nguyen D-P , Dugravot A , Dumurgier J , Tabak AG , Kivimäki M , Sabia S , Singh-Manoux A ((2020) ) Risk prediction models for dementia: Role of age and cardiometabolic risk factors. BMC Med 18: , 107. |
[19] | Steyerberg EW , Vickers AJ , Cook NR , Gerds T , Gonen M , Obuchowski N , Pencina MJ , Kattan MW ((2010) ) Assessing the performance of prediction models: A framework for some traditional and novel measures. Epidemiology 21: , 128–138. |
[20] | Fine JP , Gray RJ ((1999) ) A proportional hazards model for the subdistribution of a competing risk. J Am Stat Assoc 94: , 496–509. |
[21] | Stephan BCM , Pakpahan E , Siervo M , Licher S , Muniz-Terrera G , Mohan D , Acosta D , Rodriguez Pichardo G , Sosa AL , Acosta I , Llibre-Rodriguez JJ , Prince M , Robinson L , Prina M ((2020) ) Prediction of dementia risk in low-income and middle-income countries (the 10/66 Study): An independent external validation of existing models. Lancet Glob Health 8: , e524–e535. |
[22] | Riboli E , Hunt KJ , Slimani N , Ferrari P , Norat T , Fahey M , Charrondière UR , Hémon B , Casagrande C , Vignat J , Overvad K , Tjønneland A , Clavel-Chapelon F , Thiébaut A , Wahrendorf J , Boeing H , Trichopoulos D , Trichopoulou A , Vineis P , Palli D , Bueno-De-Mesquita HB , Peeters PHM , Lund E , Engeset D , González CA , Barricarte A , Berglund G , Hallmans G , Day NE , Key TJ , Kaaks R , Saracci R ((2002) ) European Prospective Investigation into Cancer andNutrition (EPIC): Study populations and data collection. PublicHealth Nutr 5: , 1113–1124. |
[23] | Andreu-Reinón ME , Gavrila D , Chirlaque MD , Colorado-Yohar SM , Amiano P , Ardanaz E , Navarro-Mateu F , Navarro C , Huerta JM ((2019) ) Ascertainment of dementia cases in the Spanish European Prospective Investigation into Cancer and Nutrition-Murcia Cohort. Neuroepidemiology 52: , 63–73. |
[24] | Andreu-Reinón ME , Huerta JM , Gavrila D , Amiano P , Mar J , Tainta M , Ardanaz E , Larumbe R , Navarro C , Colorado-Yohar SM , Navarro-Mateu F , Chirlaque MD ((2020) ) Incidence of dementia and associated factors in the EPIC-Spain Dementia Cohort. J Alzheimers Dis 78: , 543–555. |
[25] | Ponjoan A , Garre-Olmo J , Blanch J , Fages E , Alves-Cabratosa L , Martí-Lluch R , Comas-Cufí M , Parramon D , Garcia-Gil M , Ramos R ((2019) ) Epidemiology of dementia: Prevalence and incidence estimates using validated electronic health records from primary care. Clin Epidemiol 11: , 217–228. |
[26] | Mar J , Arrospide A , Soto-Gordoa M , Machón M , Iruin Á , Martinez-Lage P , Gabilondo A , Moreno-Izco F , Gabilondo A , Arriola L ((2021) ) Validity of a computerized population registry of dementiabased on clinical databases. Neurologia 36: , 418–425. |
[27] | Buckland G , Travier N , Cottet V , González CA , Luján-Barroso L , Agudo A , Trichopoulou A , Lagiou P , Trichopoulos D , Peeters PH , May A , Bueno-de-Mesquita HB , Bvan Duijnhoven FJ , Key TJ , Allen N , Khaw KT , Wareham N , Romieu I , McCormack V , Boutron-Ruault M , Clavel-Chapelon F , Panico S , Agnoli C , Palli D , Tumino R , Vineis P , Amiano P , Barricarte A , Rodríguez L , Sanchez MJ , Chirlaque MD , Kaaks R , Teucher B , Boeing H , Bergmann MM , Overvad K , Dahm CC , Tjønneland A , Olsen A , Manjer J , Wirfält E , Hallmans G , Johansson I , Lund E , Hjartåker A , Skeie G , Vergnaud AC , Norat T , Romaguera D , Riboli E ((2013) ) Adherence to the Mediterranean diet andrisk of breast cancer in the European prospective investigation intocancer and nutrition cohort study. Int J Cancer 132: , 2918–2927. |
[28] | Wareham NJ , Jakes RW , Rennie KL , Schuit J , Mitchell J , Hennings S , Day NE ((2003) ) Validity and repeatability of a simple index derived from the short physical activity questionnaire used in the European Prospective Investigation into Cancer and Nutrition (EPIC) study. Public Health Nutr 6: , 407–413. |
[29] | InterAct Consortium, Peters T , Brage S , Westgate K , Franks PW , Gradmark A , Tormo Diaz MJ , Huerta JM , Bendinelli B , Vigl M , Boeing H , Wendel-Vos W , Spijkerman A , Benjaminsen-Borch K , Valanou E , de Lauzon Guillain B , Clavel-Chapelon F , Sharp S , Kerrison N , Langenberg C , Arriola L , Barricarte A , Gonzales C , Grioni S , Kaaks R , Key T , Khaw KT , May A , Nilsson P , Norat T , Overvad K , Palli D , Panico S , Ramón Quirós J , Ricceri F , Sanchez M-J , Slimani N , Tjonneland A , Tumino R , Feskins E , Riboli E , Ekelund U , Wareham N ((2012) ) Validity of a short questionnaire to assess physical activity in 10 European countries. Eur J Epidemiol 27: , 15–25. |
[30] | Sterne JAC , White IR , Carlin JB , Spratt M , Royston P , Kenward MG , Wood AM , Carpenter JR ((2009) ) Multiple imputation for missing data in epidemiological and clinical research: Potential and pitfalls. BMJ 338: , b2393. |
[31] | Buuren S van , Groothuis-Oudshoorn K ((2011) ) mice: Multivariate imputation by chained equations in R. J Stat Softw 45: , 1–67. |
[32] | Austin PC , Lee DS , Fine JP ((2016) ) Introduction to the analysis of survival data in the presence of competing risks. Circulation 133: , 601–609. |
[33] | Read S , Wittenberg R , Karagiannidou M , Anderson R , Knapp M ((2017) ) The effect of midlife risk factors on dementia in older age. Public Health England, London. |
[34] | Harrell FE Jr, Lee KL , Mark DB ((1996) ) Multivariable prognostic models: Issues in developing models, evaluating assumptions and adequacy, and measuring and reducing errors. Stat Med 15: , 361–387. |
[35] | Moons KGM , Harrell FE , Steyerberg EW ((2002) ) Should scoring rules be based on odds ratios or regression coefficients? J Clin Epidemiol 55: , 1054–1055. |
[36] | Mar J , Gorostiza A , Ibarrondo O , Cernuda C , Arrospide A , Iruin Á , Larrañaga I , Tainta M , Ezpeleta E , Alberdi A ((2020) ) Validation of random forest machine learning models to predictdementia-related neuropsychiatric symptoms in real-world data. J Alzheimers Dis 77: , 855–864. |
[37] | Austin PC , Steyerberg EW ((2017) ) Events per variable (EPV) and the relative performance of different strategies for estimating the out-of-sample validity of logistic regression models. Stat Methods Med Res 26: , 796–808. |
[38] | Hosmer DW , Lemeshow S , Sturdivant RX ((2013) ) Applied Logistic Regression, John Wiley & Sons. Hoboken. |
[39] | Richard E , Andrieu S , Solomon A , Mangialasche F , Ahtiluoto S , Moll van Charante EP , Coley N , Fratiglioni L , Neely AS , Vellas B , van Gool WA , Kivipelto M ((2012) ) Methodological challenges in designing dementia prevention trials - the European Dementia Prevention Initiative (EDPI). J Neurol Sci 322: , 64–70. |
[40] | Brayne C , Richard E ((2019) ) Prevention of cognitive decline: A goal in sight? J Alzheimers Dis 70: , S11–S14. |
[41] | Livingston G , Huntley J , Sommerlad A , Ames D , Ballard C , Banerjee S , Brayne C , Burns A , Cohen-Mansfield J , Cooper C , Costafreda SG , Dias A , Fox N , Gitlin LN , Howard R , Kales HC , Kivimäki M , Larson EB , Ogunniyi A , Orgeta V , Ritchie K , Rockwood K , Sampson EL , Samus Q , Schneider LS , Selbæk G , Teri L , Mukadam N ((2020) ) Dementia prevention, intervention, and care: 2020 report of the Lancet Commission. Lancet 396: , 413–446. |
[42] | Koller MT , Raatz H , Steyerberg EW , Wolbers M ((2012) ) Competing risks and the clinical community: Irrelevance or ignorance? Stat Med 31: , 1089–1097. |
[43] | Collins R , Silarova B , Clare L ((2019) ) Dementia primary prevention policies and strategies and their local implementation: A scoping review using England as a case study. J Alzheimers Dis 70: , S303–S318. |
[44] | Derby CA , Katz MJ , Lipton RB , Hall CB ((2017) ) Trends in dementia incidence in a birth cohort analysis of the Einstein Aging Study. JAMA Neurol 74: , 1345–1351. |
[45] | Perneczky R , Kempermann G , Korczyn AD , Matthews FE , Ikram MA , Scarmeas N , Chetelat G , Stern Y , Ewers M ((2019) ) Translational research on reserve against neurodegenerative disease: Consensus report of the International Conference on Cognitive Reserve in the Dementias and the Alzheimer’s Association Reserve, Resilience and Protective Factors Professional Interest Area working groups. BMC Med 17: , 47. |
[46] | Klein S , Allison DB , Heymsfield SB , Kelley DE , Leibel RL , Nonas C , Kahn R , Association forWeight Management and Obesity Prevention, NAASO, Obesity Society, American Society for Nutrition, American Diabetes Association ((2007) ) Waist circumference and cardiometabolic risk: A consensus statement from shaping America’s health: Association for Weight Management and Obesity Prevention; NAASO, the Obesity Society; the American Society for Nutrition; and the American Diabetes Association. Diabetes Care 30: , 1647–1652. |


