
Associations Between Brain Volumes and Cognitive Tests with Hypertensive Burden in UK Biobank
Abstract
Background:
Mid-life hypertension is an established risk factor for cognitive impairment and dementia and related to greater brain atrophy and poorer cognitive performance. Previous studies often have small sample sizes from older populations that lack utilizing multiple measures to define hypertension such as blood pressure, self-report information, and medication use; furthermore, the impact of the duration of hypertension is less extensively studied.
Objective:
To investigate the relationship between hypertension defined using multiple measures and length of hypertension with brain measure and cognition.
Methods:
Using participants from the UK Biobank MRI visit with blood pressure measurements (n = 31,513), we examined the cross-sectional relationships between hypertension and duration of hypertension with brain volumes and cognitive tests using generalized linear models adjusted for confounding.
Results:
Compared with normotensives, hypertensive participants had smaller brain volumes, larger white matter hyperintensities (WMH), and poorer performance on cognitive tests. For total brain, total grey, and hippocampal volumes, those with greatest duration of hypertension had the smallest brain volumes and the largest WMH, ventricular cerebrospinal fluid volumes. For other subcortical and white matter microstructural regions, there was no clear relationship. There were no significant associations between duration of hypertension and cognitive tests.
Conclusion:
Our results show hypertension is associated with poorer brain and cognitive health however, the impact of duration since diagnosis warrants further investigation. This work adds further insights by using multiple measures defining hypertension and analysis on duration of hypertension which is a substantial advance on prior analyses—particularly those in UK Biobank which present otherwise similar analyses on smaller subsets.
INTRODUCTION
Hypertension is a well-established midlife risk factor for future cognitive impairment and the different types of dementia such as Alzheimer’s disease and vascular dementia [1, 2]. It has been estimated that up to 31.1%of the world’s adult population (1.13–1.39 billon people) has hypertension [3] and 50 million people worldwide are living with dementia, with the prevalence of both of these diseases likely to rise due to aging populations [4]. The high prevalence of hypertension and its link with dementia results is a significant public health issue. Furthermore, the lack of suitable disease modifying drug treatments for dementia has increased the emphasis on characterizing the roles of modifiable risk factors such as hypertension for dementia prevention strategies [5].
Hypertension or high blood pressure (BP) has been linked to brain and cognitive health through studies focusing on brain imaging and/or cognitive tests [6, 7]. The literature has highlighted that hypertension is related to smaller volumes of brain tissue, such as white matter [8], grey matter [9]; specific regions such as the hippocampus [10], as well other brain areas in extensive neuroimaging analysis [11]. Furthermore, hypertension has been associated with poorer cognition function such as memory, reaction time, reasoning, and executive function [12, 13]. There is also evidence to suggest that brain structures mediate the relationship between cognition and BP [14]. However, some of these studies have relatively small sample sizes (n < 1000) with different age distributions which may explain conflicting or null findings between hypertension with brain structure and cognition [15–17]. Additionally, previous studies using UK Biobank [18] have focused on relationships between either brain structures and/or cognition using single hypertensive phenotypes [11, 13] such as BP or self-reported information and lack detailed characterization of hypertensive status using information from BP, self-report, and BP lowering medications. Additionally, the role of duration of hypertension on brain structures and cognition is less extensively studied; however, examples in the literature imply increased duration of hypertension (particularly starting in midlife) is related to poorer cognition or brain health with few studies focusing on both in the same population or using extensive measures of global and sub brain structures [19–21].
Therefore, it is important build on these existing studies to define the impact of hypertension using multiple measures (BP, BP medication use, and self-report) and investigate the impact of duration of hypertension on the brain and cognition in a large cohort of dementia free individuals. The objective of this study is to compare associations between normotensive and hypertensive individuals with both brain volumes and cognition tests in the UK Biobank cohort. Furthermore, the impact of duration of hypertension will also be evaluated. It is hypothesized that those individuals with hypertension will have smaller brain volumes and white matter pathologies as well as poorer results on the cognitive tests compared to normotensive individuals. Furthermore, these differences could be greater for those who have had hypertension the longest; following the assumption individuals will have more cumulative damage to the different areas of the brain from prolonged hypertension exposure, which in turn could influence cognition.
This work provides a novel investigation by using multiple measures to define hypertension (BP measurements, hypertensive medication, and self-reported) and the investigation of duration of hypertension and the combination of these is a substantial advance on prior large-sample brain-cognitive analyses—particularly those in UK Biobank which present otherwise similar analyses.
MATERIALS AND METHODS
Study design
A cross-sectional study of nearly 40,000 participants in UK Biobank was used to determine the association between normotensive and hypertensive people with a variety of brain volumes and a series of cognitive tests. Furthermore, the impact of duration of hypertension calculated retrospectively was also investigated.
Setting
The UK Biobank cohort is a large prospective cohort of over half a million participants. All participants, who were aged between 40 and 69, attended their baseline assessment center from 2006 to 2010 where they completed a series of physical, sociodemographic, cognitive, and medical assessments. In this study, only data from 2014 to early 2020 from the first imaging visit was utilized (n = 39,696).
2.3Participants
All participants who attended the assessment center for an MRI scan were included in this study. Participants also took part in cognitive assessments and a nurse-led interview asking questions about medical history and medications on the same day. To address the possibility that associations between hypertension and cognitive function might be driven by participants with prevalent neurological disorders, these participants were excluded who had self-reported conditions that affected brain function at the assessment (n = 1,113) [11, 22]. The UK Biobank field codes for all these variables and all other variables utilized in this paper can be found in Supplementary Tables 1 and 2.
Variables
Hypertension and length of hypertension
Participants with valid BP were utilized for this study (n = 31,513). Using an Omron 705 IT electronic blood pressure monitor (OMRON Healthcare Europe B.V. Kruisweg 577 2132 NA Hoofddorp), two BP measures were obtained at two different times from the sitting position taken using the left arm only unless this was not practical. A Seca tape was used to determined cuff sized (small, medium, large). For this work, an average of these two measurements were taken and where only one valid measure was available this single measure used (SBP n = 1,941, DBP n = 1,937).
Following the NICE guidelines [23] for suspected hypertension, participants were defined as hypertensive if they had systolic blood pressure (SBP) ≥140 mm Hg and diastolic blood pressure (DBP) ≥90 mm Hg or were taking BP medications or those who reported a doctor had ever told them they had high BP. This resulted in a total of 17,196 hypertensive individuals and 14,317 normotensive individuals.
We additionally split participants from this hypertensive group (n = 17,196) into two further groups based on whether or not an individual had or had not reported they had hypertension at the nurse interview. This produced two hypertensive groups of 1) no self-reported information on hypertension diagnosis (n = 8,434) but with high BP but not taking BP medications, 2) hypertension self-reported (n = 8,762) containing participants with both high BP and/or taking BP lowering medications and self-reported hypertension. The justification for this was to investigate the relationships between normotensives with individuals with potential undiagnosed hypertension as well as those with individuals who confirmed their diagnosis. Secondly, by splitting the hypertensive group in this way we can reduce any heterogeneity of the cohort, which might be diminishing the power of any analysis. Length of hypertension in years was calculated from participants (n = 7,142) using age at imaging assessment date and the age at which participants reported when a doctor first diagnosed high BP.
Brain volumes
For this work, we utilized the Imaging Derived Phenotypes (IDPs) derived from the MRI brain images provided by UK Biobank. These IDPs were generated using an image-processing pipeline developed and run on behalf of UK Biobank. Further details are available on the UK Biobank website (http://biobank.ndph.ox.ac.uk/showcase/label.cgi?id=100) and other publications [24].
Based on other works [11, 14], for this study we included total brain volume, grey matter volume, white matter hyperintensity (WMH) volume, subcortical volumes (accumbens, amygdala, caudate, hippocampus, pallidum, putamen, thalamus), and latent measures of tract-averaged fractional anisotropy (FA) and mean diffusivity (MD) of all the white matter tracts available from UK Biobank. FA and MD are imaged using diffusion-tensor imaging (DTI) which can indicate white matter tract microstructural integrity: higher FA values suggest better health, whereas higher MD suggests worse white matter tract health. Due to the high correlation across the brain of individual regions of FA and MD we created single general latent measures of FA and MD (gFA and gMD) using confirmatory factor analysis as described in other published works [11, 25]. Outlier data points, defined as being further than±4 SD from the mean, were excluded (<1%of values).
Cognitive tests
For this work, the cognitive tests used were verbal–numerical reasoning, pairs matching (memory), reaction time (processing speed), Matrix Pattern (nonverbal reasoning), Symbol-Digit Substitution (executive function/processing speed), tower rearranging (executive function/ planning), and the difference between Trail-Making Tests (TMT) B and A (processing speed/executive function). Further information regarding the cognitive tests can be found https://biobank.ctsu.ox.ac.uk/crystal/label.cgi?id=100026 and in the Supplementary Material. The first three tests are bespoke to UK Biobank and administered both at baseline and the imaging visits. The remaining tests were validated cognitive tests (Matrix Pattern, Symbol-Digit Substitution, tower rearranging, Trail-Making Tests (TMT) B and A) which were additionally administered at the MRI visits from 2016 to provide further measures of cognitive function in domains affected by increasing age [26]. Higher values indicate better cognitive performance on verbal and numeric reasoning, matrix reasoning, symbol-digit substitution, and tower rearranging, and worse cognitive performance on the reaction time, pairs matching, and TMT B - TMT A. Further information on the cognitive tests can be found in the Supplementary Material.
Covariates
In the main analysis, brain volumes and cognitive test outcomes were adjusted for age at assessment visit, sex, education, ethnicity, assessment center, and other related vascular risk factors: body mass index (BMI), smoking status, diabetes, and hyperlipidemia. In order to correct for the interactions between sex, age, age2 (non-linear effects), we included sex*age and sex*age2 as covariates in all analysis [11, 27]. For the brain volume analysis only, we corrected for head size (which is which is synonymous with intracranial volume) and head position using the x-, y-, and z-axis position coordinates which were mean centered. Further information regarding covariates can be found in the Supplementary Material.
Statistical methods
All analysis were performed using R version 4.0.2. Descriptive statistics were generated to characterize the study cohort with respect to all study variables. We used one-way analysis of variance and Chi-square testing to compare normotensive and hypertensive state on continuous and categorical variables. Linear regression models were used to estimate the association between hypertensive state or length of hypertension with brain volumes or cognitive performance while adjusting for other covariates. Natural logarithm transformations or square root transformations were applied to make to any non-normally distributed outcome variables normally distributed prior to analysis and quantile-quantile (qq) plots were used to assess the validity of all transformed distributions. Natural Log transformations were applied to the cognitive outcome reaction time and the brain volume WMH. For the pairs matching cognitive tests, a natural log transformation+1 (ln(x + 1)) was used, and for TMT B –A, a square root transformation was applied as log transformation did not create a normal distribution for this variable. For all analysis, the standardized beta coefficients are reported throughout to facilitate comparison of associations across the brain volumes and cognitive tests. p values were adjusted for multiple testing using False Discovery Rate (FDR) [28].
RESULTS
In this study, all 31,513 participants who attended the imaging assessment center, had MRI brain images, BP measurements, and no prevalent neurological disorders were included. Participants were aged between 44 and 82 (M = 63.46, SD = 7.53) years, and their characteristics stratified by hypertensive state are shown in Table 1. The descriptive information from Table 1 indicates that, when using monovariate (one-way analysis of variance and Chi-square or Fisher exact) tests, for all demographics, brain volumes, and cognitive tests, there is a statistically significant difference between normotensive and hypertensive individuals. An additional table presenting the descriptive demographics for normotensives versus hypertensives further divided into 1) no self-reported information on hypertension diagnosis and 2) hypertension self-reported can be founding in Supplementary Table 3.
Table 1
Cross-sectional characteristics of UK Biobank participants at imaging visit stratified by hypertensive state
| Normotensive (n = 14,317) | Hypertensive (n = 17,196) | p | n | |
| Demographics | ||||
| Age, y (mean (SD)) | 61.16 (7.39) | 65.38 (7.09) | < 0.001 | 31,513 |
| Gender (Male (%)) | 5,423 (37.9) | 9,397 (54.6) | < 0.001 | 31,513 |
| BMI, kg/m2 (mean (SD)) | 25.35 (3.88) | 27.45 (4.56) | < 0.001 | 31,227 |
| Ethnicity (White (%)) | 13,820 (96.8) | 16,681 (97.3) | 0.016 | 31,429 |
| Education –Degree (%) | 7,541 (53.1) | 7,731 (45.4) | < 0.001 | 31,231 |
| Assessment Centre (%) | < 0.001 | 31,513 | ||
| Cheadle | 9,927 (69.3) | 11,290 (65.7) | ||
| Reading | 1,898 (13.3) | 1,831 (10.6) | ||
| Newcastle | 2,492 (17.4) | 4,075 (23.7) | ||
| Smoking Status (Ever/Current (%)) | 5,015 (35.3) | 6,599 (38.7) | < 0.001 | 31,260 |
| DBP, mm Hg (mean (SD)) | 73.29 (7.57) | 83.03 (9.74) | < 0.001 | 31,513 |
| SBP, mm Hg (mean (SD)) | 124.17 (10.09) | 149.77 (15.78) | < 0.001 | 31,513 |
| Hypercholesterolemia (N (%)) | 1,818 (12.7) | 5,785 (33.6) | < 0.001 | 31,513 |
| Diabetes (N (%)) | 362 (2.5) | 1,348 (7.8) | < 0.001 | 31,513 |
| Length of Hypertension, y (mean (SD)) | – | 12.27 (9.28) | – | 7,142 |
| Brain Volumes (Voxels) | ||||
| Total Brain Volume mm3 (mean (SD)) | 1,165,040.96 (110,430.33) | 1,160,670.69 (111,722.22) | 0.001 | 31,506 |
| WMH mm3 (mean (SD)) | 3,249.73 (3,635.94) | 5,346.95 (5,241.52) | < 0.001 | 30,013 |
| Ventricular CSF mm3 (mean (SD)) | 32,800.50 (14,472.97) | 38,430.21 (16,451.27) | < 0.001 | 31,354 |
| Grey Matter mm3 (mean (SD)) | 620,528.85 (54,781.27) | 611,822.81 (55,915.62) | < 0.001 | 31,508 |
| Hippocampus mm3 (mean (SD)) | 3,874 (424) | 3,822 (440) | < 0.001 | 31,473 |
| Accumbens mm3 (mean (SD)) | 459 (103) | 430 (105) | < 0.001 | 31,498 |
| Amygdala mm3 (mean (SD)) | 1,246 (215) | 1,251 (218) | 0.065 | 31,493 |
| Pallidum mm3 (mean (SD)) | 1,783 (213) | 1,774 (229) | < 0.001 | 31,443 |
| Putamen mm3 (mean (SD)) | 4,828 (555) | 4,782 (577) | < 0.001 | 31,470 |
| Caudate mm3 (mean (SD)) | 3,470 (412) | 3,475 (425) | 0.219 | 31,468 |
| Thalamus mm3 (mean (SD)) | 7,722 (728) | 7,618 (723) | < 0.001 | 31,449 |
| gFA units M (SD) | 0.09 (0.52) | –0.08 (0.58) | < 0.001 | 29,686 |
| gMD units M (SD) | –0.10 (0.41) | 0.08 (0.48) | < 0.001 | 29,686 |
| Cognitive Tests | ||||
| Pairs Matching - incorrect matches (mean (SD)) | 3.51 (2.78) | 3.77 (2.93) | < 0.001 | 29,241 |
| Verbal and Numerical Reasoning –Correct answers | 6.78 (2.06) | 6.57 (2.06) | < 0.001 | 29,182 |
| (mean (SD)) | ||||
| Reaction Time, s (mean (SD)) | 585.21 (106.45) | 599.11 (109.60) | < 0.001 | 29,628 |
| Trail-Making Test B –A, s (mean (SD)) | 314.41 (178.04) | 352.33 (199.38) | < 0.001 | 18,801 |
| Matrix Reasoning –Correct answers (mean (SD)) | 8.21 (2.10) | 7.85 (2.14) | < 0.001 | 19,478 |
| Symbol-Digit Substitution –Correct answers (mean (SD)) | 19.94 (5.16) | 18.34 (5.17) | < 0.001 | 19,503 |
| Tower Rearranging –Correct answers (mean (SD)) | 10.17 (3.22) | 9.77 (3.22) | < 0.001 | 19,310 |
p values are adjusted for multiple tests using FDR, one-way analysis of variance and Chi-square testing to compare normotensive and hypertensive state on continuous and categorical variables. DBP, diastolic blood pressure; SBP, systolic blood pressure.
From Table 1, hypertensive individuals are generally older, more likely to be male, have a higher BMI, with a larger proportion of current or previous smokers compared to normotensive people. As expected, the hypertensive group have higher SBP and DBP as well as a higher percentage of co morbidities such as diabetes. The level of missingness for the variables in Table 1 were < 1%and < 5%for the demographics and brain volumes. For the cognitive tests, for the original battery (reaction time, pairs matching, etc.) had between 5–7%missing data. As expected, the newer cognitive tests had the highest level of missingess (38–40%) due to the introduction of these tests in 2016.
Association of brain volumes between normotensive and hypertensive individuals
After adjusting for demographics, other vascular risk factors and technical confounds there were statistically significant associations between hypertensive (n = 17,196) and normotensive (n = 14,317) individuals across the majority of brain volumes apart from the sub cortical regions hippocampus, putamen, and pallidum (Table 2). The covariates which contributed significantly to these associations were age, age2, education, smoking, gender, assessment center, BMI, and age gender interactions. We also showed that stratifying hypertensive participants by BP medication use, those taking BP medications also had smaller brain measures (Supplementary Figure 1).
Table 2
Association between hypertensive and normotensive participants with brain volumes
| 95%CI | |||||
| Standardized β | Lower | Upper | p | n | |
| Brain Volumes | |||||
| Total Brain Volume | –0.0118 | –0.0219 | –0.0017 | 0.028 | 30,778 |
| Total Grey Matter | –0.0346 | –0.0461 | –0.0231 | < 0.001 | 30,781 |
| Ventricular CSF | 0.0414 | 0.022 | 0.0607 | < 0.001 | 30,631 |
| WMH | 0.1976 | 0.177 | 0.2183 | < 0.001 | 29,322 |
| gFA | –0.0957 | –0.1091 | –0.0824 | < 0.001 | 28,997 |
| gMD | 0.0978 | 0.0875 | 0.1081 | < 0.001 | 28,997 |
| Hippocampus | –0.0178 | –0.039 | 0.0035 | 0.184 | 30,745 |
| Thalamus | –0.0273 | –0.0439 | –0.0108 | 0.002 | 30,722 |
| Caudate | 0.0322 | 0.0118 | 0.0525 | 0.004 | 30,741 |
| Putamen | –0.0047 | –0.0233 | 0.0139 | 0.828 | 30,742 |
| Pallidum | –0.0071 | –0.028 | 0.0139 | 0.564 | 30,716 |
| Amygdala | –0.0351 | –0.0576 | –0.0126 | 0.005 | 30,764 |
| Accumbens | –0.0625 | –0.0835 | –0.0414 | < 0.001 | 30,770 |
Standardized betas, 95%CI and p-values are reported from regression models where hypertension status is regressed onto MRI measures adjusted for age, sex, sex*age, sex*age2, education, ethnicity, assessment center, body mass index, smoking status, diabetes, and hyperlipidemia. position MRI confounds and head size. Negative values indicate smaller volumes for hypertensive participants compared with normotensive participants for all volumes apart from WHM, ventricular CSF, and gMD. gFA, latent measure of white matter fractional anisotropy; gMD, latent measure of white matter mean diffusivity. p values are adjusted using false discovery rate.
In additional analyses, we investigated the interaction between age and hypertension on brain volumes. A significant interaction would indicate a different association magnitude at different ages (Supplementary Table 4 and Supplementary Figure 2a-d). The results show there is a small significant positive interaction between age and hypertension on lower total brain volume (interaction β= 0.016, main effect β= –0.011), and lower thalamus volume (interaction β= 0.042, main effect β= –0.026) and higher gMD (interaction β= 0.024, main effect β= 0.098). There was a negative interaction between age and hypertension on lower gFA (interaction β= –0.027, main effect β= –0.096). This indicates that hypertension is more strongly associated with smaller brain volumes in younger age for total brain volume, gFA, and the thalamus whereas for gMD, hypertension is more strongly associated with less healthy white matter in older age. There was no evidence that associations between other brain measures.
To determine if the differences in brain volumes between the normotensive and hypertensive individuals were being attenuated by misclassification of hypertension using BP measures or undiagnosed hypertension, we carried out an additional analysis using information of self-reported hypertension diagnosis. We then tested the association between all brain volumes with normotensive individuals and hypertensive individuals split into these two groups. The results for this analysis are presented in Fig. 1.
Fig. 1
Forest plot showing the association of different brain volumes with hypertensive participants with and without self-reported hypertension versus normotensive participants. Black circles indicate standardized betas with FDR p values < 0.05. For brain volumes, negative values indicate smaller volumes for each hypertensive group compared to normotensive participants apart from ventricular CSF, WMH, and gMD. gFA, latent measure of white matter fractional anisotropy; gMD, latent measure of white matter mean diffusivity.
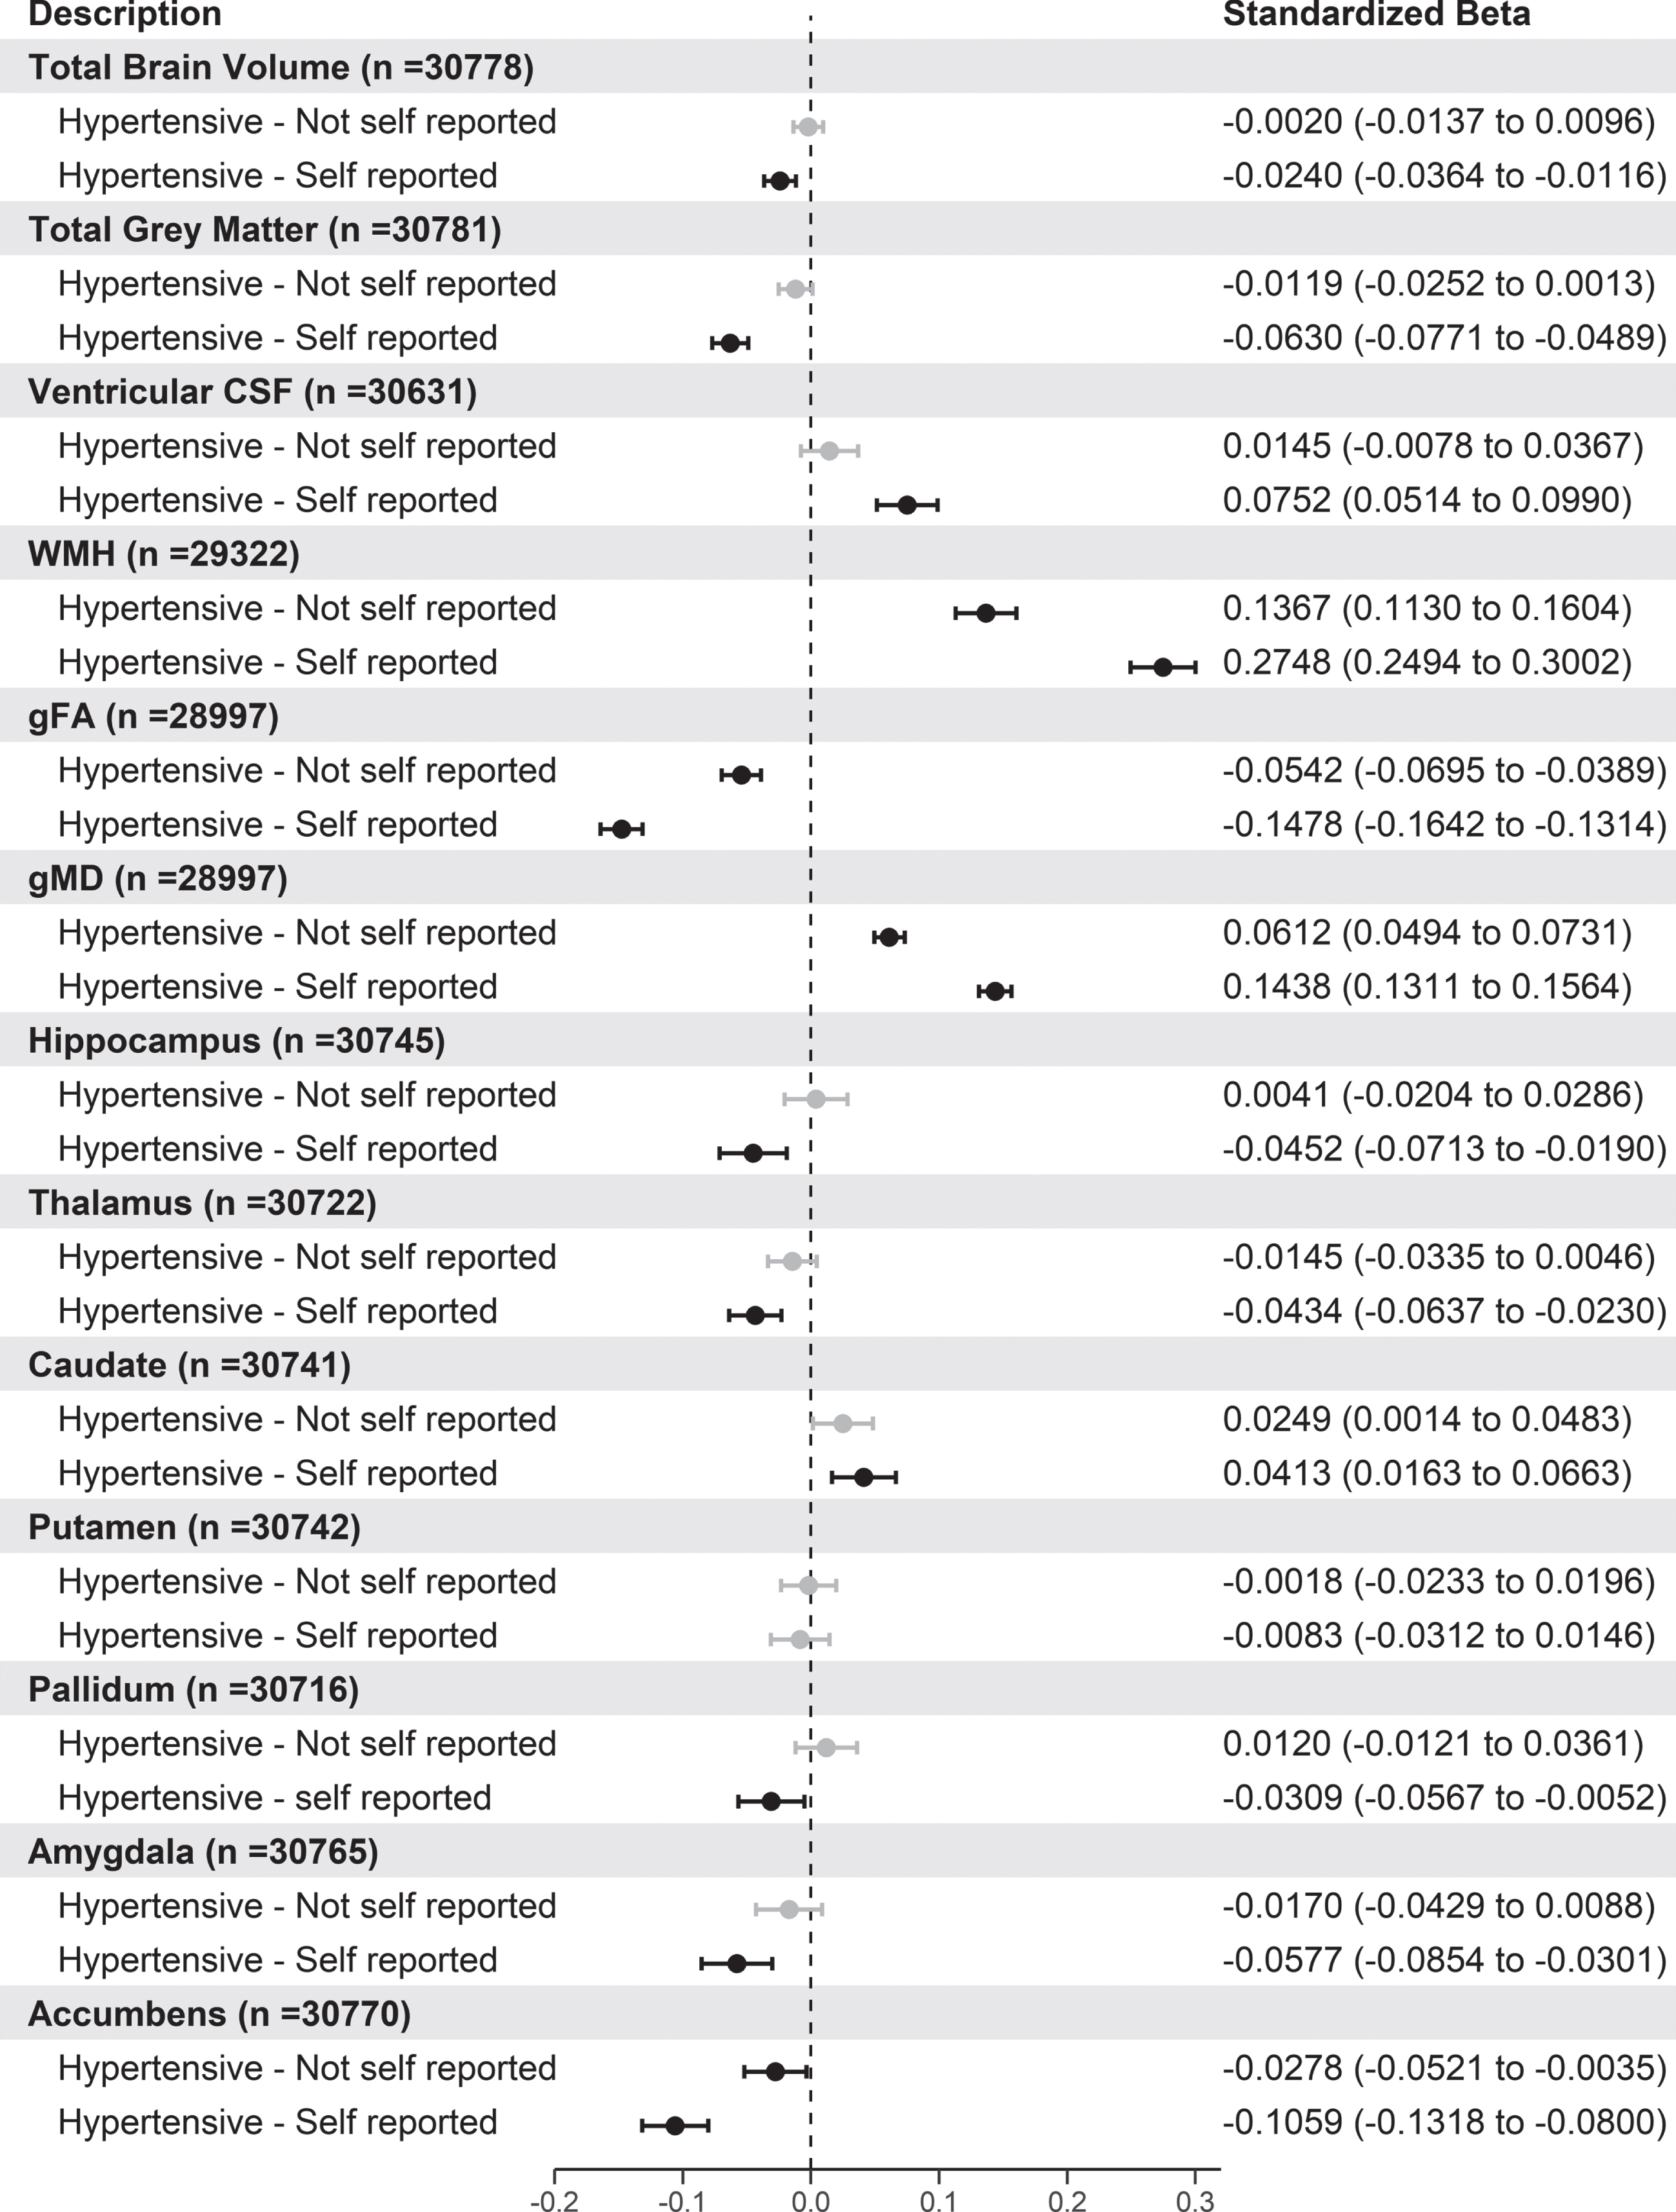
From Fig. 1, participants who were hypertensive and had self-reported hypertension had smaller brain volumes for the majority of brain volumes tested apart from the putamen. Interestingly, compared to normotensive participants, both hypertensive groups had significantly larger WMH, gFA, and smaller gMD volumes with those with self-reported hypertension having the largest standardized betas. Stratification of self-reported hypertensives by BP medication use showed similar results (Supplementary Figure 3).
The association of duration of hypertension on brain volumes
We next explored the impact of the length of hypertension (in years) with brain volumes in those participants who reported the date they were first diagnosed with high BP (n = 7,142). The results are shown in Table 3.
Table 3
Association between length of hypertension in years with brain volumes in hypertensive participants
| 95%CI | |||||
| Standardized β | Lower | Upper | p | n | |
| Brain Volumes | |||||
| Total Brain Volume | –0.012 | –0.022 | –0.001 | 0.064 | 6,996 |
| Total Grey Matter | –0.017 | –0.029 | –0.005 | 0.009 | 6,998 |
| Ventricular CSF | 0.021 | 0.000 | 0.042 | 0.094 | 6,934 |
| WMH | 0.017 | –0.004 | 0.038 | 0.180 | 6,588 |
| gFA | –0.010 | –0.024 | 0.004 | 0.299 | 6,574 |
| gMD | 0.006 | –0.005 | 0.018 | 0.423 | 6,574 |
| Hippocampus | –0.021 | –0.043 | 0.000 | 0.134 | 6,989 |
| Thalamus | –0.017 | –0.033 | 0.000 | 0.102 | 6,986 |
| Caudate | –0.007 | –0.027 | 0.014 | 0.577 | 6,986 |
| Putamen | –0.007 | –0.026 | 0.012 | 0.593 | 6,987 |
| Pallidum | –0.018 | –0.039 | 0.004 | 0.177 | 6,983 |
| Amygdala | –0.021 | –0.043 | 0.002 | 0.184 | 6,992 |
| Accumbens | –0.021 | –0.042 | 0.000 | 0.082 | 6,992 |
Standardized betas, 95%CI and p-values are reported from regression models where length of hypertension is regressed onto MRI measures adjusted for age, age2, sex, sex*age, sex*age2, education, ethnicity, assessment center, body mass index, smoking status, diabetes, and hyperlipidemia. position MRI confounds and head size. For brain volumes, negative values indicate smaller volumes for each hypertensive group compared to normotensive participants apart from ventricular CSF, WMH, and gMD. gFA, latent measure of white matter fractional anisotropy; gMD, latent measure of white matter mean diffusivity. p values are adjusted using false discovery rate.
From Table 3, there was a significant association between grey matter volume with increasing number of years of hypertension with decreases of brain volumes of –0.017 per year since diagnosis which when unstandardized equates to a decrease in total grey matter volume of 102 mm3 per year since hypertension diagnosis. Although other brain volumes were not statistically significant, they do indicate a direction of effect with smaller total brain volumes (β= –0.012), larger ventricular CSF (β= +0.021) and smaller accumbens volumes (β= –0.021).
Next, we wanted to investigate whether certain groups based on their length of hypertension were driving the effect of the association between brain volumes or any potential non-linear effects. Therefore, we took those with a length of hypertension value (n = 7,142) and split this group into four groups based on the quartiles of the length of hypertension. The cut-offs obtained based on the quartiles were less than 5 years, 6–11 years, 12–17 years, and > 18 years. This resulted in 1,902, 1,958, 1,528, and 1,754 hypertensive participants in each group respectively. Using normotensive people as the reference group (n = 14,317), we analyzed the association between this multi-level variable with the brain volumes. The results for the association of brain volumes for these different quartile groups are shown in Fig. 2.
Fig.2
Forest plot showing the association of different brain volumes with length of hypertension split into quartiles versus normotensive participants. Black circles indicate standardized betas with FDR p values < 0.05. gFA, latent measure of white matter fractional anisotropy; gMD, latent measure of white matter mean diffusivity. For brain volumes, negative values indicate smaller volumes for each hypertensive group compared to normotensive participants apart from ventricular CSF, WMH, and gMD.
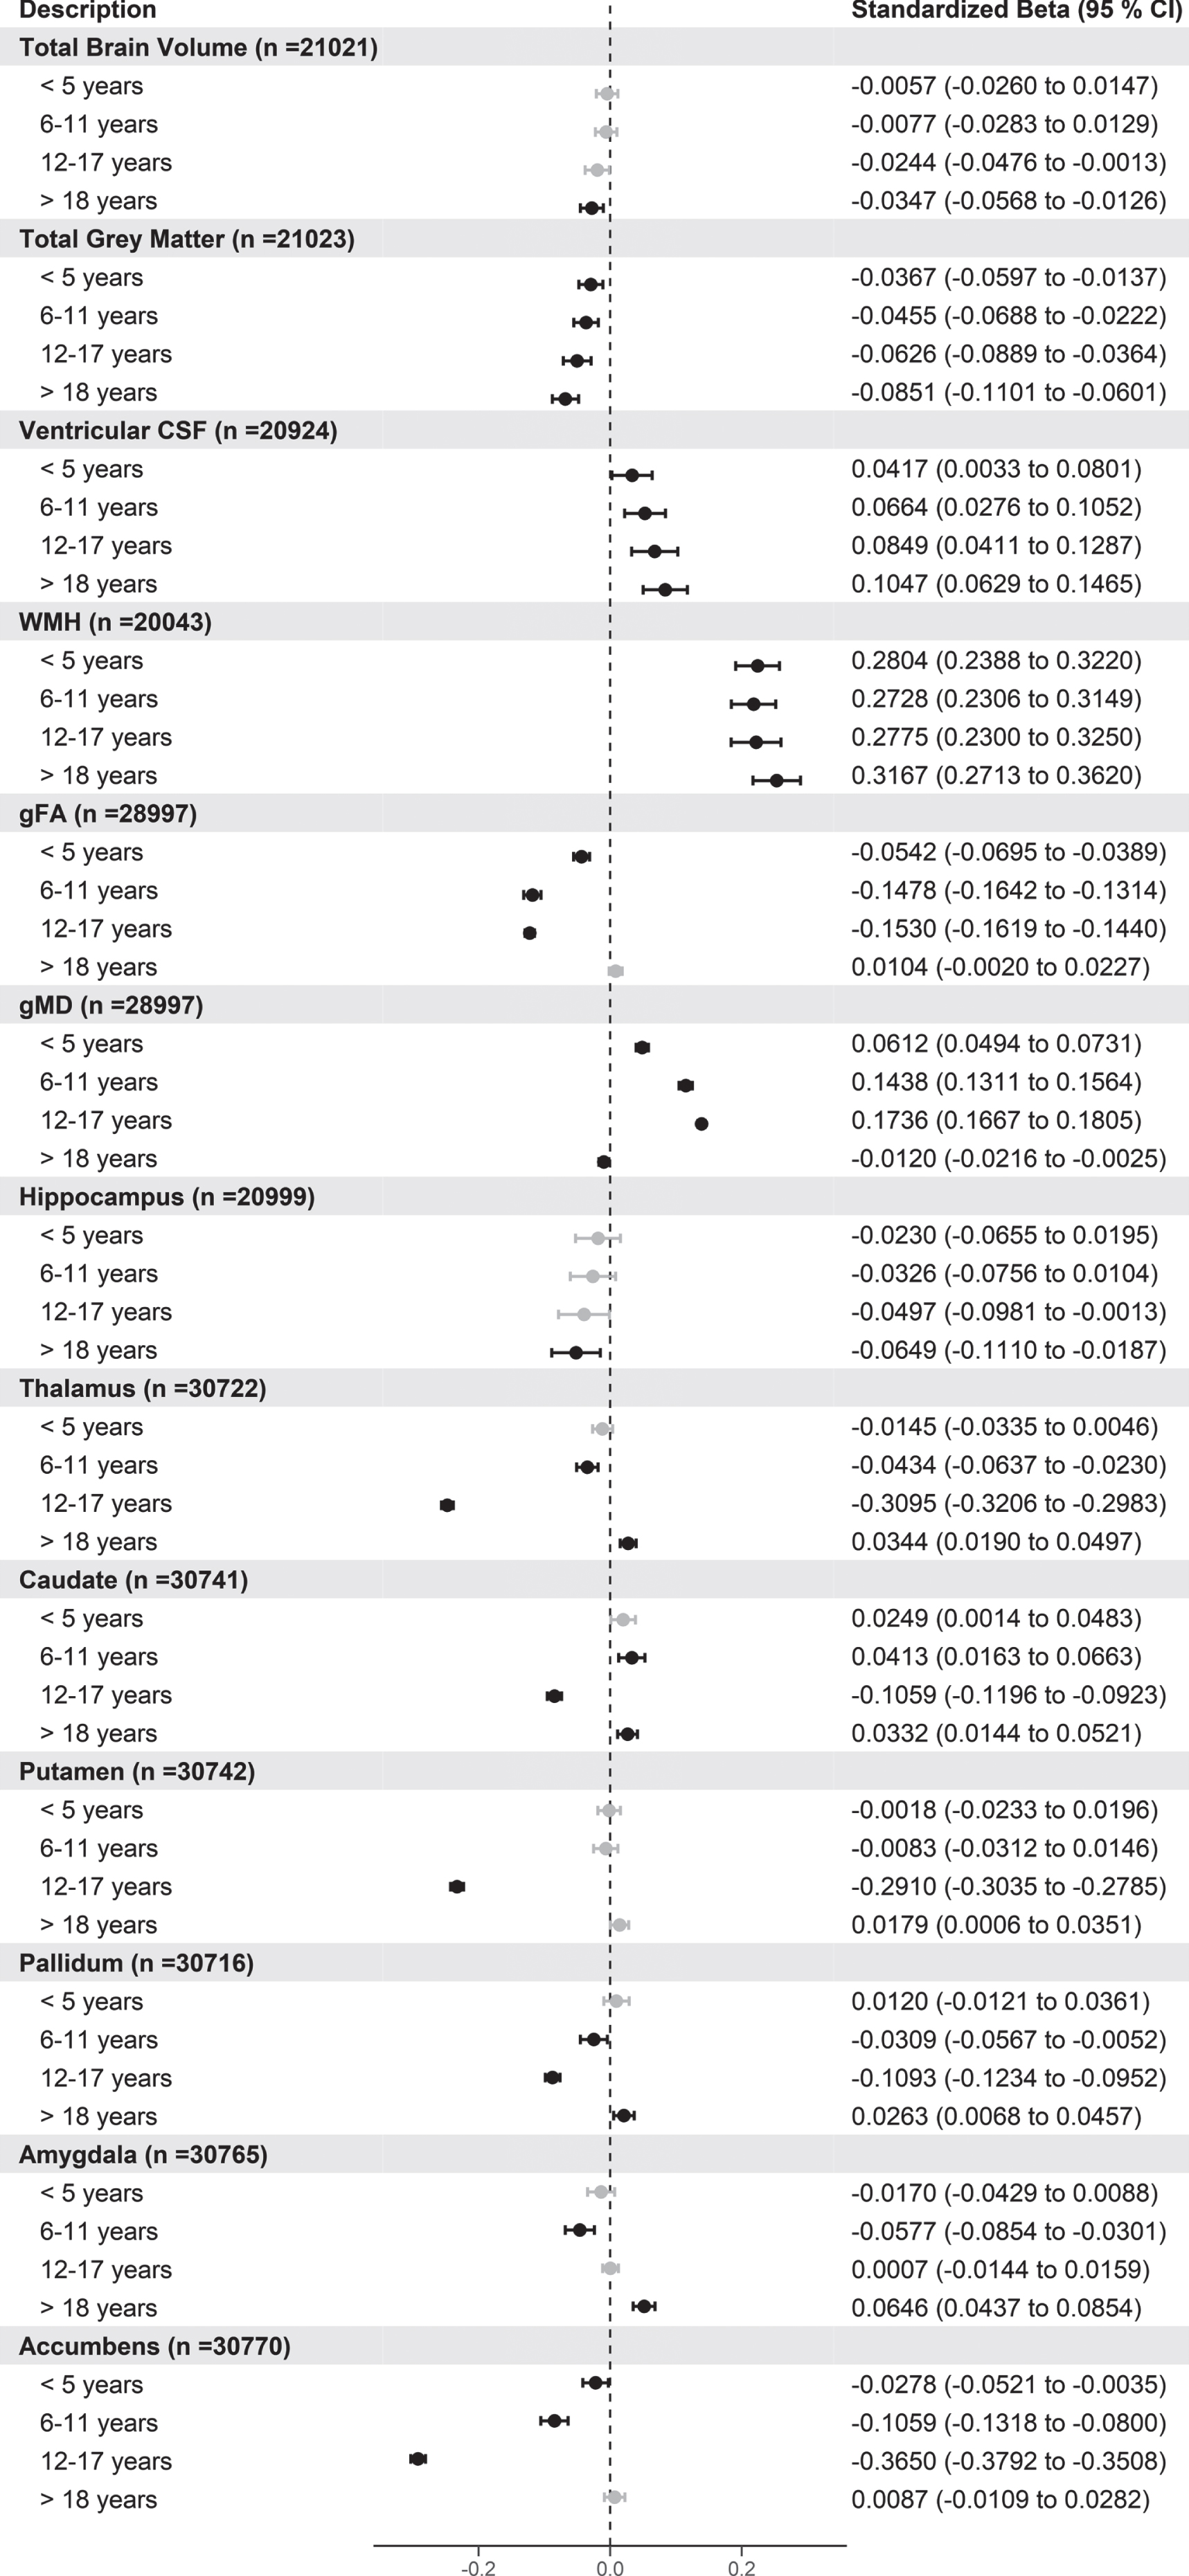
From Fig. 2, there are clear trends between participants with longer time since hypertension diagnosis and smaller total grey matter and larger ventricular CSF and WMH compared to normotensives. Additionally, for hippocampal and total brain volume, compared to normotensives, participants with more than 18 years since hypertensive diagnosis were associated with smaller total and hippocampal volumes. For the other grey matter regions, there was no clear relationship with length of hypertension apart from accumbens where smaller volumes are associated with length of hypertension up to 18 years compared with normotensives. Additionally, for gFA, gMD latent factors there appears to be non-linear relationships with these latent factors and with smaller gFA and larger gMD up to 18 years compared to normotensives. For the majority of other sub cortical volumes, those with hypertension between 12–17 years had smaller sub cortical volumes compared to normotensive participants. In additional analysis, we repeated the analysis changing the reference group to those with the shortest time since hypertension diagnosis (< 5 years) and removing the normotensive participants. This analysis showed that those with the longest length of hypertension (> 18 years) still had significantly smaller total brain, total grey matter volumes, and accumbens as well as larger ventricular CSF volumes (Supplementary Figure 4).
3.3The association of cognitive function between normotensive and hypertensive individuals
Next, we wanted to test whether there were differences in cognitive function between normotensive and hypertensive individuals among those who attended the imaging assessment. This was in order to understand if the differences in brain volumes between hypertensive statuses were also reflected in cognitive function. For the majority of cognitive tests, there were no statistically significant associations between hypertensive (n = 17,196) and normotensive (n = 14,317) individuals apart from verbal and numerical reasoning (Table 4). For all the majority of the cognitive tests, covariates that contributed significantly were age, education, gender, and ethnicity. Stratification by BP medication use showed differences for pairs matching, matrix pattern and tower rearranging in medicated participants (Supplementary Figure 5). Furthermore, there were no significant age interactions between hypertension and any of the cognitive tests (Supplementary Table 5).
Table 4
Association between hypertensive and normotensive participants with cognitive function tests
| Standardized β | 95%CI | p | n | ||
| Lower | Upper | ||||
| Cognitive test | |||||
| Reaction Time | –0.023 | –0.047 | 0.001 | 0.094 | 29,098 |
| Verbal and numerical reasoning | –0.039 | –0.063 | –0.015 | 0.003 | 28,666 |
| Pairs Matching | 0.021 | –0.004 | 0.047 | 0.173 | 28,716 |
| Trail Making Test Part B - A | 0.011 | –0.020 | 0.041 | 0.621 | 18,394 |
| Matrix Pattern | –0.020 | –0.049 | 0.010 | 0.208 | 19,053 |
| Symbol Digit Substitution | –0.019 | –0.047 | 0.009 | 0.241 | 19,074 |
| Tower Rearranging | –0.028 | –0.058 | 0.003 | 0.102 | 18,895 |
Standardized betas, 95%CI and p-values are reported from regression models where hypertension status is regressed onto cognitive test measures adjusted for age, age2, sex, sex*age, sex*age2, education, ethnicity, assessment center, body mass index, smoking status, diabetes, and hyperlipidemia. For the cognitive tests, negative values indicate better cognitive function for reaction time, pairs matching, TMT B-A, whereas positive scores indicate better cognitive scores for verbal and numerical reasoning, matrix pattern, symbol digit substitution and tower rearranging. p values are adjusted using false discovery rate.
In additional analysis, we also ran the same analysis using the whole baseline cohort (n = 453,516) for the original cognitive tests reaction time (n = 437,794), verbal and numerical reasoning (n = 155,151), and pairs matching (n = 429,847). This was to determine if the negative results could be due to lack of power to detect the smaller effect sizes for the cognitive tests. In this analysis, we found significant associations, showing poorer cognitive performance between hypertensive individuals and normotensives for all three cognitive tests in the baseline participants (Supplementary Figure 6).
As with the brain imaging variables, we further tested the association between normotensive and hypertensive groups by further sub dividing the hypertensive group into those that did or did not report that they had hypertension as shown in in Fig. 3.
Fig. 3
Forest plot showing the association of cognitive tests with hypertensive participants with and without self-reported hypertension versus normotensive participants. Black circles indicate standardized betas with p values < 0.05. For the cognitive tests, negative values indicate better cognitive function for reaction time, pairs matching, and TMT B-A, whereas positive scores indicate better cognitive scores for verbal and numerical reasoning, matrix pattern, symbol digit substitution, and tower rearranging. p values are adjusted using FDR.
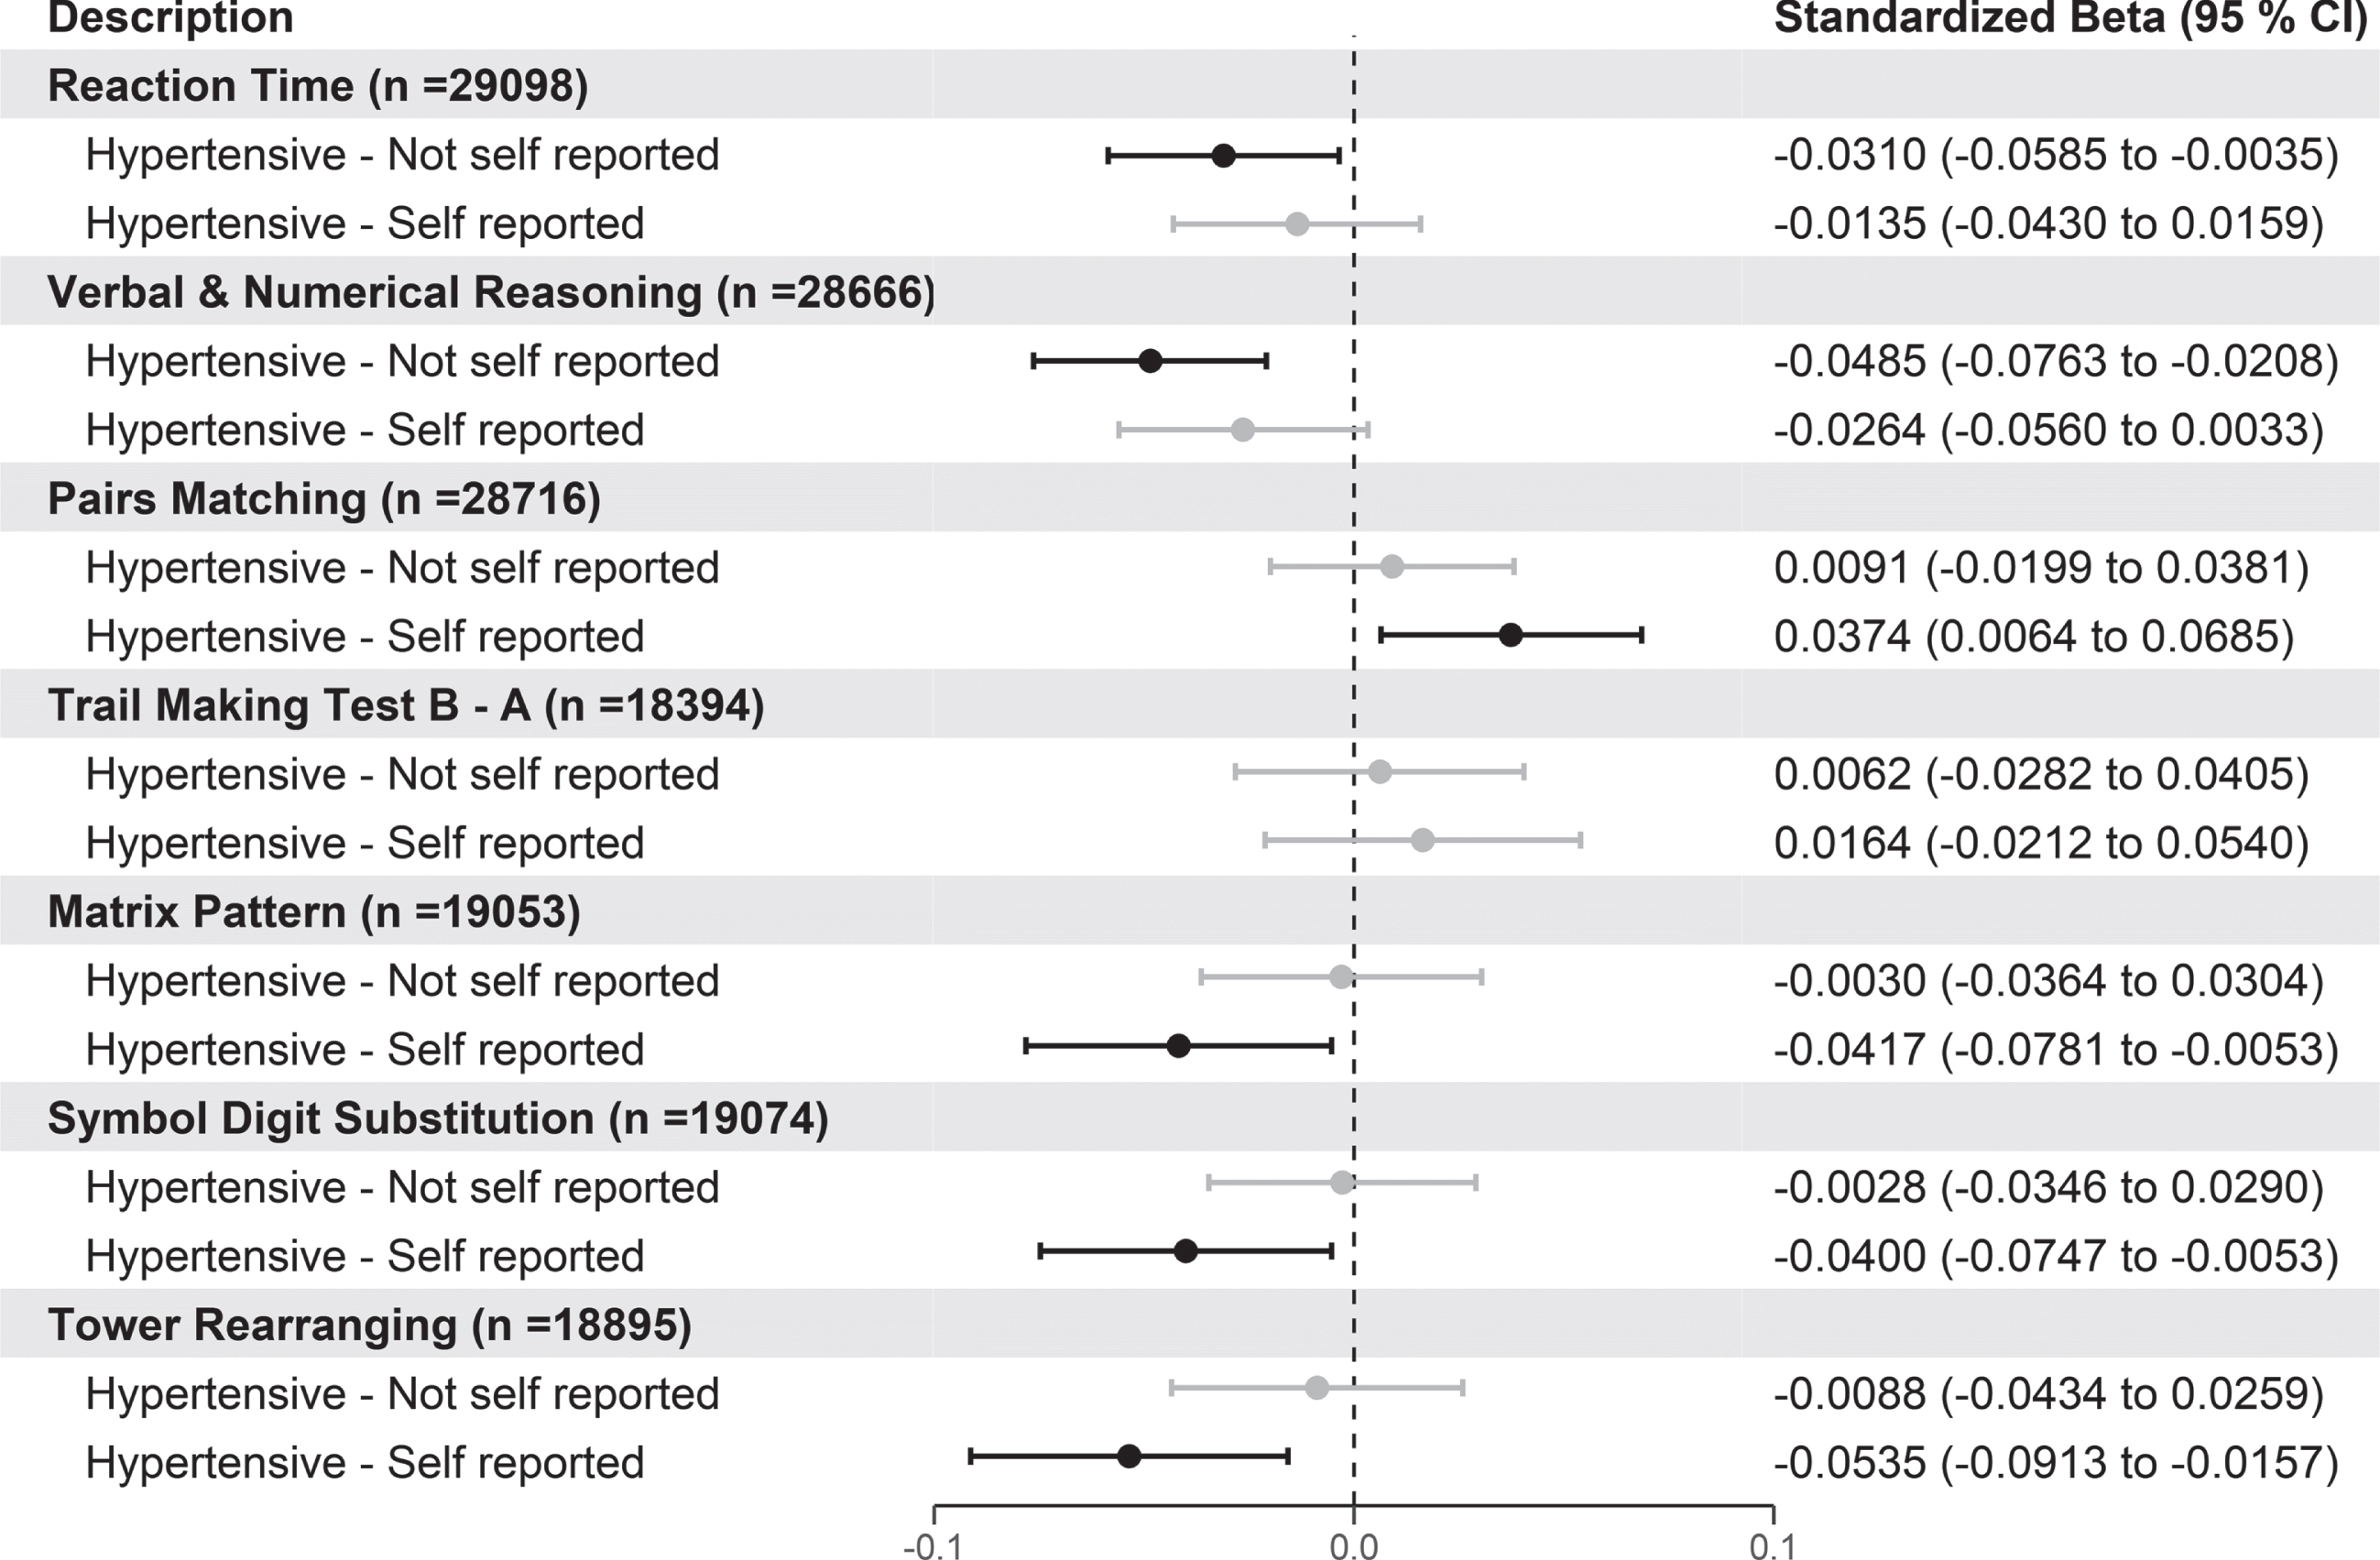
According to Fig. 3, those hypertensive individuals who also reported they had high BP had poorer cognitive performance for pairs matching (β= +0.037 [95%CI 0.006 to 0.069]), matrix pattern (β= –0.042 [95%CI –0.078 to –0.005]), symbol digit substitution (β= –0.040 [95%CI –0.075 to –0.005]), and tower rearranging (β= –0.054 [95%CI –0.091 to –0.016]). Finally, compared to the normotensive group those hypertensive individuals with no confirmed self-reported hypertension had better scores on the reaction time and verbal and numerical reasoning cognitive tests. Stratification by BP medication in self-reported hypertensives showed similar results to Fig. 3 (Supplementary Figure 7). Again, we also performed the same analysis using the participants from the baseline visit (Supplementary Figure 8). The results using the baseline individuals replicated those seen in Fig. 3 for pairs matching and showed that people with self-reported hypertension also had slower reaction times and poorer scores on verbal and numerical reasoning.
The association of duration of hypertension on cognitive function
The relationship between number of years of hypertension and the cognitive tests showed no statistically significant results using only individuals who attended the imaging visit (Table 5). However, when we analyzed the larger baseline cohort, we found that the greater the length of hypertension was associated with slower reaction time but interestingly better verbal and numerical reasoning scores, whereas there was no significant association with pairs matching (Supplementary Table 6).
Table 5
Association between length of hypertension with cognitive function tests in hypertensive participants at imaging visit
| 95%CI | |||||
| Standardized β | Lower | Upper | p | n | |
| Cognitive Tests | |||||
| Reaction Time | 0.015 | –0.009 | 0.039 | 0.318 | 6,596 |
| Verbal and numerical reasoning | 0.012 | –0.012 | 0.035 | 0.424 | 6,490 |
| Pairs Matching | 0.012 | –0.013 | 0.037 | 0.520 | 6,505 |
| Trail Making Test Part B-A | –0.002 | –0.033 | 0.028 | 0.879 | 4,061 |
| Matrix Pattern | 0.027 | –0.002 | 0.056 | 0.146 | 4,238 |
| Symbol Digit Substitution | 0.002 | –0.026 | 0.029 | 0.915 | 4,229 |
| Tower Rearranging | –0.001 | –0.031 | 0.028 | 0.927 | 4,189 |
Standardized betas, 95%CI and p-values are reported from regression models where length of hypertension is regressed onto cognitive test measures adjusted for age, age2, sex, sex*age, sex*age2, education, ethnicity, assessment center, body mass index, smoking status, diabetes, and hyperlipidemia. For the cognitive tests, negative values indicate better cognitive function for reaction time, pairs matching, TMT B-A, whereas positive scores indicate better cognitive scores for verbal and numerical reasoning, matrix pattern, symbol digit substitution and tower rearranging. p values are adjusted using false discovery rate.
When we analyzed the number of years of hypertension split into quartiles and compared these groups to normotensive individuals there were not any significant trends for any cognitive tests. However, for verbal and numerical reasoning and matrix pattern cognitive tests, those with less than 5 years since hypertensive diagnosis had poorer performance compared to normotensives (Fig. 4). We additionally performed the same analysis using the larger baseline data, and the results indicate there were trends between increasing length of hypertension with poorer reaction time and more errors on the pairs matching tests but better performance on verbal and numerical reasoning (Supplementary Figure 9).
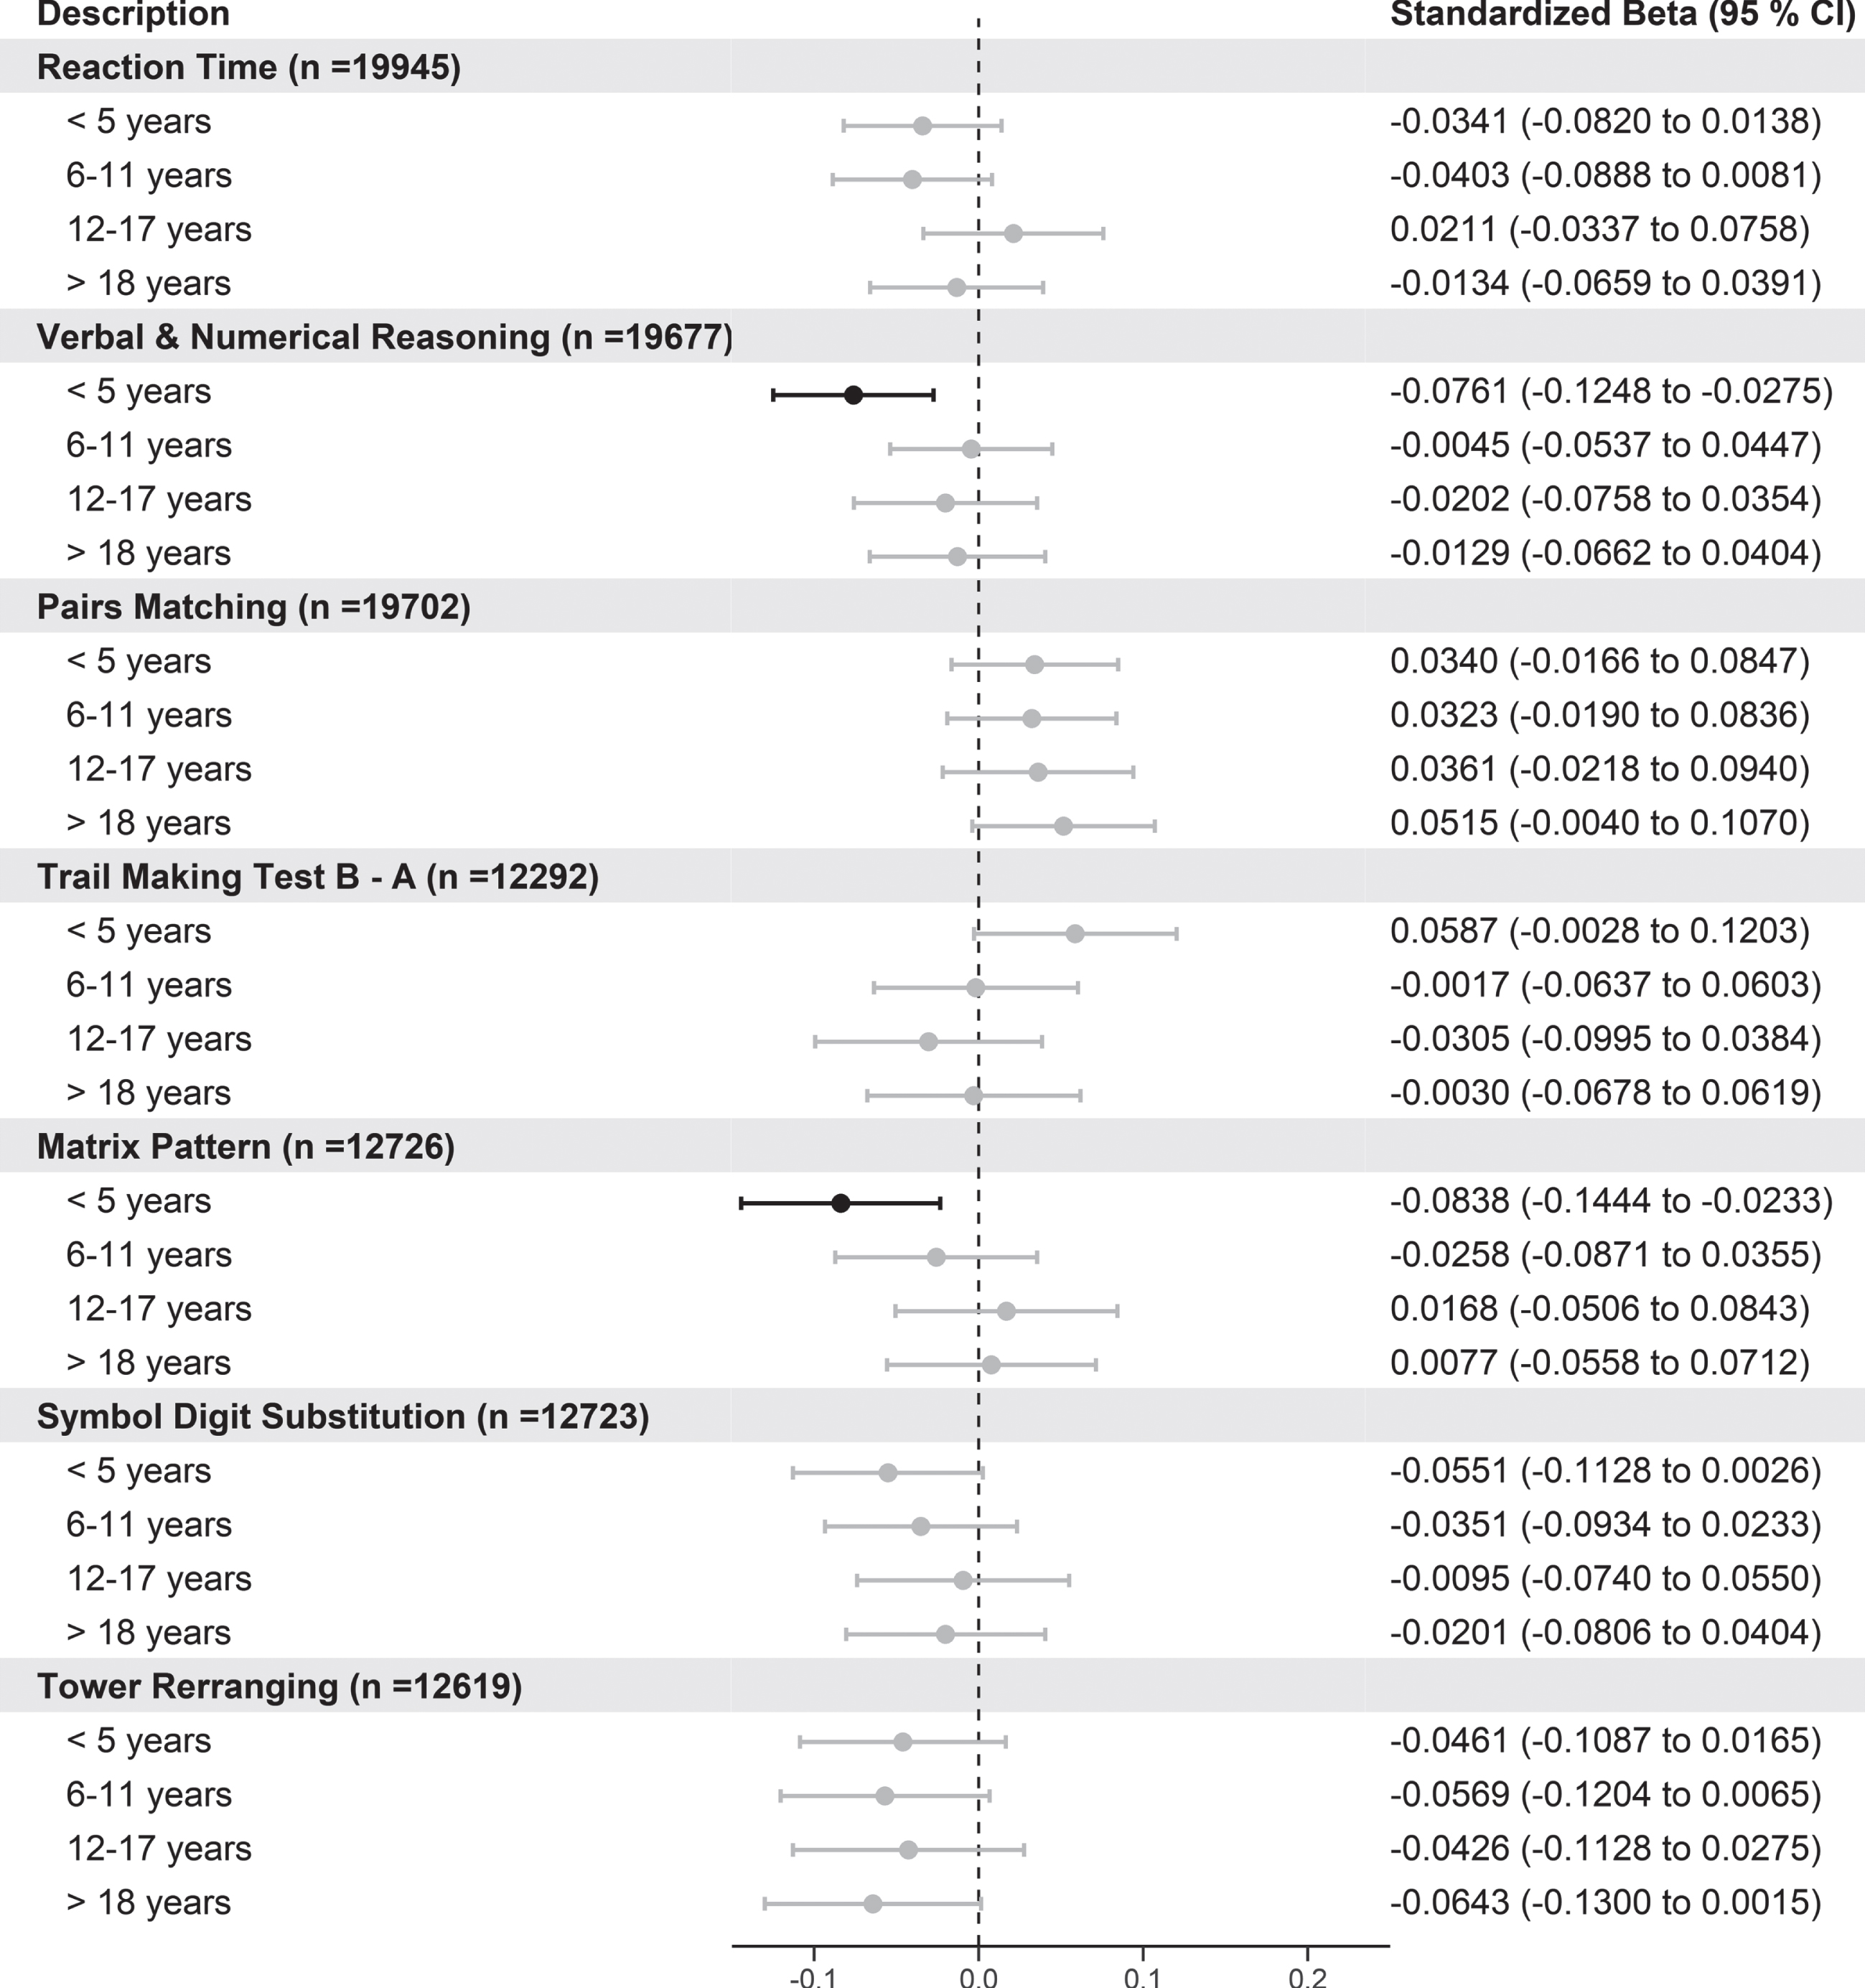
Fig. 4
Forest plot showing the association of cognitive function tests with length of hypertension split into quartiles versus normotensive participants. Standardized betas, 95%CI, and p-values are reported from regression models where length of hypertension split into quartiles with normotensives as. For the cognitive tests, negative values indicate better cognitive function for reaction time, pairs matching, and TMT B-A, whereas positive scores indicate better cognitive scores for verbal and numerical reasoning, matrix pattern, symbol digit substitution, and tower rearranging. p values are adjusted using FDR.
DISCUSSION
In this largest imaging study from UK Biobank, where we focused on using multiple measures to define hypertension (BP measurements, hypertensive medication, self-reported information) and duration of hypertension, we found evidence that overall people with hypertension were associated with smaller brain volumes, larger WMH and ventricular CSF, and worse cognitive function. Furthermore, we found that this association was strongest in those individuals with high BP who also confirmed they were hypertensive through self-report. Finally, we have shown that as the duration of hypertension increases, this is associated with smaller total, grey, hippocampal, and larger WMH and ventricular CSF. However, for the majority of subcortical regions and latent white matter measures this relationship was not clear. Finally, there was no clear relationship with duration of hypertension with cognitive function in the imaging cohort but there were significant associations when we examined the whole population at baseline. The unique aspect of this work is due to using multiple measures defining hypertension and analysis on duration of hypertension which is a substantial advance on prior UK Biobank studies.
Association of hypertension on brain volume and cognition
Our observations using the largest dataset of brain imaging in UK Biobank are in agreement with the majority of studies showing associations between hypertension, brain volumes, and cognition [11, 13, 14, 16, 29–31]. In particular, Cox et al. (2019) [11], using a subset of UK Biobank imaging cohort (n = 9,722), showed that combinations of vascular risk factors including hypertension were associated with poorer brain health across grey and white matter macro- and microstructures. The majority of results from Cox et al. match this study; however, they only used information on self-reported hypertension not additional measures such as BP or BP medication use which may give rise to unidentified hypertensive cases attenuating potential results. Despite this, consistent with this work, we also found small effect sizes between hypertension and brain volumes. We found the subcortical caudate region showed larger volumes in hypertensive participants whereas Cox et al. showed a non-significant association. One explanation could be that as this region is adjacent to the ventricles, an area highly susceptible to WHM; it could be possible that WMH could be misclassified as caudate grey matter [32].
However, there are a few studies, which contradict our findings, which could be explained by the small effect sizes related to hypertension, which may not be detected in other smaller studies using older populations. Firstly, Beauchet et al. (2013) carried out a meta-analysis which showed there were significant differences in hippocampal volume (n = 942); however, no between-group differences regarding the whole-grey matter volume (n = 768) [6]. Wiseman et al. (2004) showed older hypertensive subjects (≥70 years old) had significantly smaller whole brain volumes (887±109 versus 930±97 cm3, p = 0.02) but there were no differences in hippocampal volumes (n = 154) [16]. This inconsistencies between these studies and this work could be explained by the small sample sizes used, different demographics, MRI scanners, BP medication use, different cut offs for defining hypertension and different age distributions used for these studies.
Our results relating to cognition function are also in line with the literature potentially supporting the detrimental impact of hypertension on cognition function such as executive function, memory, reasoning and processing speed [33, 34]. For example, a study with 40 participants (age 63.3±9.29), using latent growth modelling has shown hypertension was associated with greater deep WMH volume in the frontal lobe (β= 1.09, p < 0.05), indicating that the frontal lobe is especially susceptible to the hypertension-related WMH [35]. This study alongside others [36], indicates potentially that WMH caused by hypertension and other co morbidities could negatively impact cognition via damage to the frontal lobe which could be related to worse scores on cognitive tests of memory (pairs matching), executive function (tower rearranging) and reasoning (matrix pattern) from this paper. However, it must be noted that WMH can accumulate superior to the lateral ventricles too, such that an array of connections not exclusive to the frontal lobes are affected.
We did not find a significant relationship between reaction time with hypertension in those who attended the imaging visit which contradicts previous findings [37, 38]. However, when analyzing the baseline cohort, we did find significant relationship between hypertension and reaction time. This result is consistent with Lyall et al. (2016) [13] who found hypertension (self-reported only) as well as other cardiometabolic diseases had poorer performance on all cognitive tests using the baseline cohort of UK Biobank participants. Therefore, a lack of power to detect very small effect sizes could explain null findings when analyzing cognition in the imaging cohort. Despite this, the symbol digit substitution test, a validated cognitive test also used to test processing speed, did show slower processing speed in those with hypertension in the imaging subset. However, it must be noted that the cognitive function tests used in UK Biobank can cover multiple domains of cognitive function. A recent study by Ferguson et al. (2020) showed there were significant relationships between SBP with cognition specifically reasoning and matrix pattern but not reaction time, pairs matching, tower rearranging, or symbol digit substitution. However, this study used SBP as a continuous measure rather than hypertension diagnosis, which could explain the difference in results.
The lack of statistical significance for some of our results when we compared the hypertensive group versus normotensive individuals contradicts studies that have found high BP/hypertensive diagnosis is associated with poorer brain health and cognition. However, there are explanations for this. It is possible that the results are attenuated due to the misclassification of participants into the hypertensive group due to white coat hypertension [39], undiagnosed hypertension, BP medication use, and systematic error on the BP measurements. We confirmed this in our analysis where we split our hypertensive group and those with high BP who also reported they had hypertension were driving these results (Figs. 1 and 3), whereas those with high BP who did not report they were hypertensive had similar brain volumes and cognition scores to normotensives individuals apart from WMH, gFA, and gMD. This result could indicate that WMH and related white matter tracts could highlight subtle differences between those with different stages of hypertension compared with other brain volumes related to cognitive decline and dementia [40]. Additionally, those individuals with non-reported hypertension may have elevated heterogeneity, comprising both uncontrolled hypertensive subjects and normotensive subjects with elevated BP readings, which could explain why the majority of the brain volumes were not statistically different from normotensive individuals.
The data used in this study does not permit any conclusive causal information regarding the biological processes of hypertension relative to brain health, cognitive reserve, and future dementia risk. By highlighting these potential processes will be helpful in pointing to future directions for understanding the underlying mechanisms in basic research of hypertension and dementia. Hypertension contributes to cerebral small and large vessel disease and accelerates arteriosclerotic changes in the brain, which influences blood flow to the brain. These changes affect both grey and white matter and WMH resulting in diminished brain function. Hypertension related cognitive decline is potentially a result of the impact of brain vascular damage and changes to blood flow resulting diminished cognition function [7]. There is a clear pathway from hypertension to vascular dementia, involving atherosclerosis and cerebral ischemia leading to decline in cognitive function; however, there is also evidence to suggest hypertension is increases risk of Alzheimer’s disease, although the exact mechanisms are unclear.
Association of duration of hypertension on brain volume and cognition
In our study, we have shown there is an association between increasing duration of hypertension and global brain volumes such as total, grey, WMH, and ventricular CSF when comparing against normotensive and those with the lowest duration of hypertension (<5 years) but not for other brain areas. There was no association found between duration of hypertension and any of the cognitive function tests when just focusing on those who attended the imaging cohort. However, we did show that when we carried out the same analysis using the baseline individuals the results do indicate longer duration of hypertension is associated with poorer cognition. Although we showed that participants with hypertension had smaller volumes, the majority of sub cortical regions and white matter regions there was no clear relationship that supported our hypothesis. This highlights the complexity of possible relationships between cross-sectional measures and retrospective hypertensive measure and brain health for certain sub cortical regions.
There are few published studies, which have described the impact of duration of hypertension on brain volume and cognition. Power et al. (2016) showed BP status 15 to 24 years before neuroimaging to be most relevant to overall brain atrophy and specific sub regions using a population from the Atherosclerosis Risk in Communities Neurocognitive Study [21]. Although this study confirms our findings, we have shown there is a difference earlier for total grey matter volumes.
It is interesting to note that hippocampal volume was significantly associated with those with confirmed hypertension and in those with hypertension > 18 years but not significantly associated with length of hypertension as a continuous measure, highlighting those with the longest duration could be driving the effect. A recent study by Triantafyllou et al. [15] who showed a longer duration of hypertension is associated with lower hippocampal volumes (β= –0.01, 95%CI–0.02 to –0.01, p = 0.014). However, the average age in this cohort was 75.1±5.6 years compared to our study, which was 63.57±7.54 years. Additionally, this study by Triantafyllou only contained participants with mild memory problems whereas this paper analyzed healthy participants in UK Biobank. The study by Triantafyllou alongside others indicate that hippocampal atrophy is likely to be greater in those older cohorts with midlife hypertension and therefore 20–30 years before neuroimaging has taken place [10].
Power et al. (2013) [41] have shown using marginal structure models that for each one year increase in duration of time since hypertension was associated with a decrease in mean age-adjusted cognitive test z-scores (standard unit difference per year increase = –0.02 [95%CI = –0.04 to –0.001]). Our initial analysis did not show a significant relationship between length of hypertension and cognitive tests however, this could be for numerous reasons. The smaller sample size for the length of hypertension for the cognitive tests could result in a lack of statistical power to detect the small effects sizes found in this study as well as the lack of correlation of the cognitive tests across the different follow up visits indicating a high variability of cognitive test measures. It may be necessary in order to observe a significant hypertension-related decrement in cognitive performance a larger sample would be required to detect the smaller effect size between cognition and years of hypertension. This is highlighted in our work where when we considered the baseline data, we observed significant differences between longer duration of hypertension and poorer cognition (reaction time and pairs matching). Despite this, when we considered the baseline data verbal and numerical reasoning test, we found that better scores on this cognitive test was associated with longer duration of hypertension. An explanation for this could be that this cognitive test is measuring aspects of crystalized intelligence, which peak later on in midlife [42].
Limitations of the study
Although our study has many strengths such as using multiple measures to characterize hypertensive status and focusing on duration of hypertension, it also has some limitations. Firstly, the data used does not permit conclusive causal claims due to it being cross-sectional. However, we do have an indication of temporal associations from the measured effects of length of hypertension, which was possible to calculate in a subset of the hypertensive individuals. Secondly, we did not explore the complete exhaustive list of all the imaging derived phenotypes, of which UK Biobank has derived several hundred. Furthermore, we only carried out analysis focusing on the linear relationships between brain volumes and cognition versus length of hypertension whereas some of the results do indicate non-linear associations. Along with other cohort studies, UK Biobank has healthy participant bias, where the participants of the cohort are healthier than the general population [43, 44]. It is possible that there are recall biases in some of the self-reported variables used in this study such as the self-reported hypertension and age of hypertension diagnosis, which could attenuate results. Furthermore, for the length of hypertension due to the silent nature of hypertension it might be unclear how long a person had hypertension before their diagnosis, which could affect our results. Due to the nature of collection of BP measurements, how we defined ‘hypertension’ may lack clinical accuracy and introduce further heterogeneity attenuating our results. This is because a clinical diagnosis of hypertension is confirmed by ambulatory BP monitoring to prevent misdiagnosis. Whereas in this work, only two measures were taken so it is possible other factors could have caused short-term hypertension such as stress, pain, or white coat hypertension, which could attenuate results. The effectiveness of BP lowering medications could also affect the results by increasing the heterogeneity of potential brain atrophy. This is because it is possible that brain injury due to hypertension could be different in individuals with controlled hypertension versus uncontrolled hypertension. It is plausible that hypertension may well interact with differences in genetic susceptibility that can determine cognitive decline and dementia related outcomes (e.g., [44, 45]), and this will be a priority for future work as well as investigating the life course and interactions with other risk factors and different hypertensive severity states. Although we removed people with neurological and neurodegenerative disorders there is the possibility that due to misclassification bias some participants may have some of these disorders, which could potentially be driving the results seen. Finally, another important limitation is the quality and validity of the bespoke cognitive tests used in UK Biobank. Research has shown that some of the cognitive tests have poor reliability, and they are brief and non-standard in nature. Improvement was shown when combining these cognitive tests into a single latent measure. Work has been carried out to investigate the validity of the cognitive tests at baseline and follow ups [46, 47]. Despite this, the bespoke cognitive tests continue to be valuable and were designed to be practical for such a large-scale study.
CONCLUSIONS
In conclusion, we showed that hypertension, a common cardiovascular risk factor for cognitive decline and dementia in midlife, is associated with smaller brain volumes and poorer cognitive performance. In particular, as duration of hypertension increases overall global brain volumes decreases; however, there appears to be nonlinear effects for specific brain regions. Our results build upon existing evidence regarding the role of hypertension as well as other vascular risk factors could play in the development of subsequent brain pathology and how this affects current and future cognitive decline. In particular, using a variety of measures to define the hypertensive phenotype (BP, BP medications, self-reported) adds a significant noteworthy novelty to this work compared with other smaller studies using the same cohort. However, this work has shown alongside others that the effects of hypertension are relatively small. Despite this, this work supports the importance of maintaining a healthy BP with regards to the preservation of brain and cognitive health in later life. Furthermore, the results suggest the idea of a slowly progressive effect of hypertension on brain, which can provide a window of opportunity for early treatment. Further research is required to identify the underlying mechanisms involved in hypertension-related brain changes, specifically in sub cortical regions and how and when this influences cognitive decline. By understanding this and the factors that contribute to the morphological and functional abnormalities observed with hypertension, new treatments can be developed to specifically address the neurophysiological and cognitive changes associated with hypertension for dementia prevention.
DATA AVAILABILITY STATEMENT
UK Biobank is an open access resource available to verified researchers upon application (http://www.ukbiobank.ac.uk/). Analysis syntax for this work is available upon request.
ACKNOWLEDGMENTS
We thank the UK Biobank participants and the UK Biobank team for their work in collecting, processing, and disseminating these data for analysis. This research was conducted, using the UK Biobank Resource under approved project 43309. The funding sources has no role in the study design; in the collection, analysis, and interpretation of data; in the writing of the report; and in the decision to submit the paper for publication.
This work was supported by a discovery award awarded by Dementia’s Platform UK (DPUK), by the MRC (MR/L023784/2) awarded to DN, and by Janssen Pharmaceuticals. Additionally, this project has received funding from the European Union’s Horizon 2020 research and innovation programme under grant agreement No 826421.
Authors’ disclosures available online (https://www.j-alz.com/manuscript-disclosures/21-0512r2).
SUPPLEMENTARY MATERIAL
[1] The supplementary material is available in the electronic version of this article: https://dx.doi.org/10.3233/JAD-210512.
REFERENCES
[1] | Sharp SI , Aarsland D , Day S , Sønnesyn H , Group ASVDSR , Ballard C ((2011) ) Hypertension is a potential risk factor for vascular dementia: Systematic review, Int J Geriatr Psychiatry 26: , 661–669. |
[2] | Lennon MJ , Makkar SR , Crawford JD , Sachdev PS ((2019) ) Midlife hypertension and Alzheimer’s disease: A systematic review and meta-analysis, J Alzheimers Dis 71: , 307–316. |
[3] | Mills KT , Stefanescu A , He J ((2020) ) The global epidemiology of hypertension, Nat Rev Nephrol 16: , 223–237. |
[4] | Martin Prince A , Wimo A , Guerchet M , Gemma-Claire Ali M , Wu Y-T , Prina M , Yee Chan K , Xia Z ((2015) ) World Alzheimer Report 2015. The Global Impact of Dementia: An Analysis of Prevalence, Incidence, Cost and Trends. Alzheimer’s Disease International, London. |
[5] | Livingston G , Huntley J , Sommerlad A , Ames D , Ballard C , Banerjee S , Brayne C , Burns A , Cohen-Mansfield J , Cooper C , Costafreda SG , Dias A , Fox N , Gitlin LN , Howard R , Kales HC , Kivimäki M , Larson EB , Ogunniyi A , Orgeta V , Ritchie K , Rockwood K , Sampson EL , Samus Q , Schneider LS , Selbæk G , Teri L , Mukadam N ((2020) ) Dementia prevention, intervention, and care: 2020 report of the Lancet Commission, Lancet 396: , 413–446. |
[6] | Beauchet O , Celle S , Roche F , Bartha R , Montero-Odasso M , Allali G , Annweiler C ((2013) ) Blood pressure levels and brain volume reduction: A systematic review and meta-analysis, J Hypertens 31: , 1502–1516. |
[7] | Gąsecki D , Kwarciany M , Nyka W , Narkiewicz K ((2013) ) Hypertension, brain damage and cognitive decline, Curr Hypertens Rep 15: , 547–558. |
[8] | Strassburger TL , Lee HC , Daly EM , Szczepanik J , Krasuski JS , Mentis MJ , Salerno JA , DeCarli C , Schapiro MB , Alexander GE ((1997) ) Interactive effects of age and hypertension on volumes of brain structures, Stroke 28: , 1410–1417. |
[9] | Jennings JR , Mendelson DN , Muldoon MF , Ryan CM , Gianaros PJ , Raz N , Aizenstein H ((2012) ) Regional grey matter shrinks in hypertensive individuals despite successful lowering of blood pressure, J Hum Hypertens 26: , 295–305. |
[10] | Korf ESC , White LR , Scheltens P , Launer LJ ((2004) ) Midlife blood pressure and the risk of hippocampal atrophy: The Honolulu Asia aging study, Hypertension 44: , 29–34. |
[11] | Cox SR , Lyall DM , Ritchie SJ , Bastin ME , Harris MA , Buchanan CR , Fawns-Ritchie C , Barbu MC , de Nooij L , Reus LM , Alloza C , Shen X , Neilson E , Alderson HL , Hunter S , Liewald DC , Whalley HC , McIntosh AM , Lawrie SM , Pell JP , Tucker-Drob EM , Wardlaw JM , Gale CR , Deary IJ ((2019) ) Associations between vascular risk factors and brain MRI indices in UK Biobank, Eur Heart J 40: , 2290–2300. |
[12] | Elias MF , Goodell AL , Dore GA ((2012) ) Hypertension and cognitive functioning: A perspective in historical context, Hypertension 60: , 260–268. |
[13] | Lyall DM , Celis-Morales CA , Anderson J , Gill JMR , Mackay DF , McIntosh AM , Smith DJ , Deary IJ , Sattar N , Pell JP ((2016) ) Associations between single and multiple cardiometabolic diseases and cognitive abilities in 474 129 UK Biobank participants, Eur Heart J 38: , ehw528. |
[14] | Ferguson AC , Tank R , Lyall LM , Ward J , Welsh P , Celis-Morales C , McQueenie R , Strawbridge RJ , Mackay DF , Pell JP , Smith DJ , Sattar N , Cavanagh J , Lyall DM ((2020) ) Association of SBP and BMI with cognitive and structural brain phenotypes in UK Biobank, J Hypertens 38: , 2482–2489. |
[15] | Triantafyllou A , Ferreira JP , Kobayashi M , Micard E , Xie Y , Kearney-Schwartz A , Hossu G , Rossignol P , Bracard S , Benetos A ((2020) ) Longer duration of hypertension and MRI microvascular brain alterations are associated with lower hippocampal volumes in older individuals with hypertension, J Alzheimers Dis 74: , 227–235. |
[16] | Wiseman RM , Saxby BK , Burton EJ , Barber R , Ford GA , O’Brien JT ((2004) ) Hippocampal atrophy, whole brain volume, and white matter lesions in older hypertensive subjects, Neurology 63: , 1892–1897. |
[17] | Salerno JA , Murphy DG , Horwitz B , DeCarli C , Haxby J V , Rapoport SI , Schapiro MB ((1992) ) Brain atrophy in hypertension. A volumetric magnetic resonance imaging study, Hypertension 20: , 340–348. |
[18] | Sudlow C , Gallacher J , Allen N , Beral V , Burton P , Danesh J , Downey P , Elliott P , Green J , Landray M , Liu B , Matthews P , Ong G , Pell J , Silman A , Young A , Sprosen T , Peakman T , Collins R ((2015) ) UK Biobank: An open access resource for identifying the causes of a wide range of complex diseases of middle and old age, PLoS Med 12: , e1001779. |
[19] | McGrath ER , Beiser AS , DeCarli C , Plourde KL , Vasan RS , Greenberg SM , Seshadri S ((2017) ) Blood pressure from mid-to late life and risk of incident dementia, Neurology 89: , 2447–2454. |
[20] | Petrea RE , O’Donnell A , Beiser AS , Habes M , Aparicio H , Decarli C , Seshadri S , Romero JR ((2020) ) Mid to late life hypertension trends and cerebral small vessel disease in the Framingham Heart Study, Hypertension 76: , 707–714. |
[21] | Power MC , Schneider ALC , Wruck L , Griswold M , Coker LH , Alonso A , Jack CR , Knopman D , Mosley TH , Gottesman RF ((2016) ) Life-course blood pressure in relation to brain volumes, Alzheimers Dement 12: , 890–899. |
[22] | Cullen B , Newby D , Lee D , Lyall DM , Nevado-Holgado AJ , Evans JJ , Pell JP , Lovestone S , Cavanagh J ((2018) ) Cross-sectional and longitudinal analyses of outdoor air pollution exposure and cognitive function in UK Biobank, Sci Rep 8: , 12089. |
[23] | NICE (2019) Recommendations | Hypertension in adults: Diagnosis and management | Guidance | NICE guideline [NG136], NICE. |
[24] | Alfaro-Almagro F , Jenkinson M , Bangerter NK , Andersson JLR , Griffanti L , Douaud G , Sotiropoulos SN , Jbabdi S , Hernandez-Fernandez M , Vallee E , Vidaurre D , Webster M , McCarthy P , Rorden C , Daducci A , Alexander DC , Zhang H , Dragonu I , Matthews PM , Miller KL , Smith SM ((2018) ) Image processing and quality control for the first 10,000 brain imaging datasets from UK Biobank, Neuroimage 166: , 400–424. |
[25] | Cox SR , Ritchie SJ , Tucker-Drob EM , Liewald DC , Hagenaars SP , Davies G , Wardlaw JM , Gale CR , Bastin ME , Deary IJ ((2016) ) Ageing and brain white matter structure in 3,513 UK Biobank participants, Nat Commun 7: , 13629. |
[26] | Salthouse TA ((2010) ) Selective review of cognitive aging, J Int Neuropsychol Soc 16: , 754–760. |
[27] | Alfaro-Almagro F , McCarthy P , Afyouni S , Andersson JLR , Bastiani M , Miller KL , Nichols TE , Smith SM ((2020) ) Confound modelling in UK Biobank brain imaging, Neuroimage 224: , 117002. |
[28] | Benjamini Y , Hochberg Y ((1995) ) Controlling the false discovery rate: A practical and powerful approach to multiple testing, J R Stat Soc Ser B 57: , 289–300. |
[29] | d’Arbeloff T , Elliott ML , Knodt AR , Melzer TR , Keenan R , Ireland D , Ramrakha S , Poulton R , Anderson T , Caspi A , Moffitt TE , Hariri AR ((2019) ) White matter hyperintensities are common in midlife and already associated with cognitive decline, Brain Commun 1: , fcz041. |
[30] | Lane CA , Barnes J , Nicholas JM , Sudre CH , Cash DM , Parker TD , Malone IB , Lu K , James SN , Keshavan A , Murray-Smith H , Wong A , Buchanan SM , Keuss SE , Gordon E , Coath W , Barnes A , Dickson J , Modat M , Thomas D , Crutch SJ , Hardy R , Richards M , Fox NC , Schott JM ((2019) ) Associations between blood pressure across adulthood and late-life brain structure and pathology in the neuroscience substudy of the 1946 British birth cohort (Insight 46): An epidemiological study, Lancet Neurol 18: , 942–952. |
[31] | Launer LJ , Lewis CE , Schreiner PJ , Sidney S , Battapady H , Jacobs DR , Lim KO , D’Esposito M , Zhang Q , Reis J , Davatzikos C , Bryan RN ((2015) ) Vascular factors and multiple measures of early brain health: CARDIA brain MRI study, PLoS One 10: , e0122138. |
[32] | Jenkins LM , Garner CR , Kurian S , Higgins JP , Parrish TB , Sedaghat S , Nemeth AJ , Lloyd-Jones DM , Launer LJ , Hausdorff JM , Wang L , Sorond FA ((2020) ) Cumulative blood pressure exposure, basal ganglia, and thalamic morphology in midlife, Hypertension 75: , 1289–1295. |
[33] | Veldsman M , Tai XY , Nichols T , Smith S , Peixoto J , Manohar S , Husain M ((2020) ) Cerebrovascular risk factors impact frontoparietal network integrity and executive function in healthy ageing, Nat Commun 11: , 4340. |
[34] | Forte G , De Pascalis V , Favieri F , Casagrande M ((2019) ) Effects of blood pressure on cognitive performance: A systematic review, J Clin Med 9: , 34. |
[35] | Raz N , Yang YQ , Rodrigue KM , Kennedy KM , Lindenberger U , Ghisletta P ((2012) ) White matter deterioration in 15 months: Latent growth curve models in healthy adults, Neurobiol Aging 33: , 429.e1–429.e5. |
[36] | Kuller LH , Margolis KL , Gaussoin SA , Bryan NR , Kerwin D , Limacher M , Wassertheil-Smoller S , Williamson J , Robinson JG ((2010) ) Relationship of hypertension, blood pressure, and blood pressure control with white matter abnormalities in the Women’s Health Initiative Memory Study (WHIMS) - MRI trial, J Clin Hypertens 12: , 203–212. |
[37] | Köhler S , Baars MAE , Spauwen P , Schievink S , Verhey FRJ , van Boxtel MJP ((2014) ) Temporal evolution of cognitive changes in incident hypertension: Prospective cohort study across the adult age span, Hypertension 63: , 245–51. |
[38] | Arvanitakis Z , Fleischman DA , Arfanakis K , Leurgans SE , Barnes LL , Bennett DA ((2016) ) Association of white matter hyperintensities and gray matter volume with cognition in older individuals without cognitive impairment, Brain Struct Funct 221: , 2135–2146. |
[39] | Cobos B , Haskard-Zolnierek K , Howard K ((2015) ) White coat hypertension: Improving the patient–health care practitioner relationship, Psychol Res Behav Manag 8: , 133–141. |
[40] | Maillard P , Seshadri S , Beiser A , Himali JJ , Au R , Fletcher E , Carmichael O , Wolf PA , DeCarli C ((2012) ) Effects of systolic blood pressure on white-matter integrity in young adults in the Framingham Heart Study: A cross-sectional study, Lancet Neurol 11: , 1039–1047. |
[41] | Power MC , Tchetgen EJT , Sparrow D , Schwartz J , Weisskopf MG ((2013) ) Blood pressure and cognition: Factors that may account for their inconsistent association, Epidemiology 24: , 886–893. |
[42] | Cornelis MC , Wang Y , Holland T , Agarwal P , Weintraub S , Morris MC ((2019) ) Age and cognitive decline in the UK Biobank, PLoS One 14: , e0213948. |
[43] | Fry A , Littlejohns TJ , Sudlow C , Doherty N , Adamska L , Sprosen T , Collins R , Allen NE ((2017) ) Comparison of sociodemographic and health-related characteristics of UK Biobank participants with those of the general population, Am J Epidemiol 186: , 1026–1034. |
[44] | Lyall DM , Cox SR , Lyall LM , Celis-Morales C , Cullen B , Mackay DF , Ward J , Strawbridge RJ , McIntosh AM , Sattar N , Smith DJ , Cavanagh J , Deary IJ , Pell JP ((2020) ) Association between APOE e4 and white matter hyperintensity volume, but not total brain volume or white matter integrity, Brain Imaging Behav 14: , 1468–1476. |
[45] | Nation DA , Preis SR , Beiser A , Bangen KJ , Delano-Wood L , Lamar M , Libon DJ , Seshadri S , Wolf PA , Au R ((2016) ) Pulse pressure is associated with early brain atrophy and cognitive decline: Modifying effects of APOE-ɛ4, Alzheimer Dis Assoc Disord 30: , 210–215. |
[46] | Fawns-Ritchie C , Deary IJ ((2020) ) Reliability and validity of the UK Biobank cognitive tests, PLoS One 15: , e0231627. |
[47] | Lyall DM , Cullen B , Allerhand M , Smith DJ , Mackay D , Evans J , Anderson J , Fawns-Ritchie C , McIntosh AM , Deary IJ , Pell JP ((2016) ) Cognitive test scores in UK Biobank: Data reduction in 480,416 participants and longitudinal stability in 20,346 participants, PLoS One 11: , e0154222. |


