
Diet Effects on Cerebrospinal Fluid Amino Acids Levels in Adults with Normal Cognition and Mild Cognitive Impairment
Abstract
Background:
Exploration of cerebrospinal fluid (CSF) amino acids and the impact of dietary intake on central levels may provide a comprehensive understanding of the metabolic component of Alzheimer’s disease.
Objective:
The objective of this exploratory study was to investigate the effects of two diets with varied nutrient compositions on change in CSF amino acids levels in adults with mild cognitive impairment (MCI) and normal cognition (NC). Secondary objectives were to assess the correlations between the change in CSF amino acids and change in Alzheimer’s disease biomarkers.
Methods:
In a randomized, parallel, controlled feeding trial, adults (NC, n = 20; MCI, n = 29) consumed a high saturated fat (SFA)/glycemic index (GI) diet [HIGH] or a low SFA/GI diet [LOW] for 4 weeks. Lumbar punctures were performed at baseline and 4 weeks.
Results:
CSF valine increased and arginine decreased after the HIGH compared to the LOW diet in MCI (ps = 0.03 and 0.04). This pattern was more prominent in MCI versus NC (diet by diagnosis interaction ps = 0.05 and 0.09), as was an increase in isoleucine after the HIGH diet (p = 0.05). Changes in CSF amino acids were correlated with changes in Alzheimer’s disease CSF biomarkers Aβ42, total tau, and p-Tau 181, with distinct patterns in the relationships by diet intervention and cognitive status.
Conclusion:
Dietary intake affects CSF amino acid levels and the response to diet is differentially affected by cognitive status.
INTRODUCTION
Alzheimer’s disease (AD) is traditionally characterized by extracellular accumulation of amyloid-β (Aβ) peptide and formation of intracellular neurofibrillary tau tangles. In addition to these distinctive pathological hallmarks, AD is also defined by complex systemic metabolic aberrations [1]. Cerebral glucose hypometabolism in parieto-temporal, posterior cingulate, and frontal regions is recognized as a key feature of AD preceding clinical manifestation [2] and is present in individuals with mild cognitive impairment (MCI) [3–5], a prodromal state of AD that may represent early metabolic changes. Exploring other metabolic pathway substrates, such as amino acids, in the context of neurodegenerative disease is of interest to provide a more comprehensive understanding of the metabolic component of AD.
Amino acids and their metabolites play a role in diverse biological processes, including protein synthesis, energy generation, nitrogenous waste production and elimination, neuronal signaling, and others [6]. Numerous observational and cross-sectional studies have explored circulating amino acid levels in AD, MCI, and healthy populations and identified associations between peripheral amino acid profiles and cognitive status, although the direction of the relationships is inconsistent [7–12]. Elevated circulating amino acids, particularly branched-chain amino acids (BCAAs) and aromatic amino acids, are associated with insulin resistance (IR) [13], a metabolic state to which AD patients are vulnerable [14]. In addition to the periphery, CSF amino acid profiles have also been assessed in persons with MCI and AD [15–17] and continued exploration of this biological compartment would provide new insights into AD pathogenesis from a metabolic perspective. Although the aforementioned studies suggest relationships between amino acid metabolism and cognitive decline, they are limited in that they provide merely a snapshot in time and are limited by lack of temporal relationship and potential reverse causation; interventional trials are necessary to elucidate the dynamic metabolic processes in AD pathogenesis. Further, no human studies to date have investigated CSF amino acid metabolites, such as the arginine metabolites citrulline and ornithine, as well as α-aminoadipic acid.
The impact of nutrition on the metabolic health of the brain is of particular interest, given the established role of diet in the prevention and treatment of cardiometabolic disease [18, 19]. Epidemiological studies of the Dietary Approaches to Stop Hypertension (DASH), Mediterranean, and Integrated Mediterranean-DASH Intervention for Neurodegenerative Delay (MIND) diets indicate high adherence to these healthy dietary patterns reduces AD incidence [20]. Further, the MIND diet is associated with slower cognitive decline in aging [21]. Although varied in their specific components, these patterns are similar in their reduction of animal food sources and saturated fats, and emphasis on plant-based foods. Western-style diets, in contrast, are characterized by high intakes of animal products, saturated fats, sodium, and refined carbohydrates. The precise mechanisms by which healthy dietary patterns confer neuroprotection or, alternatively, unhealthy dietary patterns increase risk of AD pathology remain to be fully understood. A 3-year multimodal brain imaging study assessed how the Mediterranean diet influenced AD progression and reported low diet adherence was associated with glucose hypometabolism and amyloid deposition [22]. In an interventional study, we previously reported that a dietary pattern low in fat, saturated fat, and glycemic index produced beneficial effects on CSF AD biomarkers, while a Western-style diet high in fat, saturated fat, and glycemic index elicited shifts indicative of presymptomatic AD in normal older adults [23]. Such shifts in AD biomarkers in response to our diet interventions provide an opportunity to explore simultaneous pathological processes in early cognitive decline, chief among them brain amino acid metabolism. Although many previous studies have looked at dietary impacts on metabolites in the plasma, no studies have looked at the dietary effect on CSF metabolites, such as amino metabolites that are known to be altered in AD.
Therefore, the primary objective of this exploratory study was to investigate the effects of 4 weeks of a low fat, saturated fat, and glycemic index control diet (LOW) compared to a high fat, saturated fat, and glycemic index Western diet (HIGH) on change in CSF amino acids levels in adults with MCI and normal cognition (NC). The secondary objective was to explore associations between change in amino acids and established AD biomarkers and insulin in response to diet.
MATERIALS AND METHODS
Study design and participants
A detailed description of the study methods is provided elsewhere [23]. In brief, 49 adults with NC or amnestic MCI consumed a HIGH diet or a LOW diet for 4 weeks in a randomized, parallel, controlled feeding design. Of those participants, 43 had baseline CSF in which amino acids could be reliably measured and were included in the present study. The study was approved by the Human Subjects Review Committees of the University of Washington and the Veterans Affairs Puget Sound Health Care System. All participants provided written informed consent prior to study entry.
Participant cognitive status was evaluated by a comprehensive medical and neuropsychological battery; amnestic MCI was determined by expert consensus panel as previously described [23]. Exclusion criteria included major psychiatric disorders, alcoholism, neurologic disorders (other than amnestic MCI), renal or hepatic disease, diabetes mellitus, chronic obstructive pulmonary disease, and unstable cardiac disease. Participants taking any cholesterol-lowering medications, such as statins, fibrates, niacin, or fish oil, were excluded.
Diet intervention
All meals were prepared centrally according to menus designed by a research nutritionist and delivered to the participants’ homes twice weekly. Caloric needs for weight maintenance were calculated by averaging the Mifflin-St. Jeor and Harris-Benedict equations, adjusted for physical activity, and rounding up to the nearest 200 calorie diet level. The nutrient composition of the HIGH diet was 45% fat (saturated fat 25%), 35%–40% carbohydrates (glycemic index > 70), and 15%–20% protein, while the LOW diet was 25% fat (saturated fat < 7%), 55%–60% carbohydrates (glycemic index < 55), and 15%–20% protein. Actual food intake during the diet intervention was assessed by participant’s completion of daily food records throughout the intervention in which participants recorded all food consumed. Number of non-adherent events was small and did not differ between groups (mean incidents per week ranged from 1.23–1.80 per group).
Procedures
Lumbar punctures were performed at baseline and during the fourth week of the diet intervention. Following a 12 h fast, an intravenous catheter was inserted and the L4-5 interspace was infiltrated with local anesthesia (1% lidocaine). Using a 24-gauge Sprott atraumatic spinal needle, 30 mL of CSF was withdrawn, aliquoted into prechilled polyethylene tubes, frozen immediately with dry ice, and stored at –70°C until assay. CSF Aβ42, tau, and phosphorylated tau (p-Tau) were measured with the immunoassay INNO-BIA AlzBio3 (Innogenetics NV, Gent, Belgium). CSF Aβ40 was measured by sandwich enzyme-linked immunosorbent assays. CSF amino acids were analyzed using liquid chromatography tandem mass spectrometry (LC-MS/MS) in the Mayo Clinic Metabolomics Core, as described previously [24–26]. Amino acids included alanine, arginine, asparagine, glutamine, glycine, histidine, isoleucine, leucine, lysine, methionine, phenylalanine, serine, threonine, tryptophan, tyrosine, and valine. CSF insulin levels were measured, as described previously [27].
Statistical methods
Continuous data were expressed as least squares mean (standard error of the mean) and categorical data were expressed as frequency (percent). Differences in means for each continuous baseline variable and differences in mean change scores (week 4 – week 0) for diet composition were each assessed using analysis of variance techniques (Proc MIXED; SAS statistical software, version 9.4; SAS Institute Inc., Cary, NC) with terms for diet, diagnosis, and diet-by-diagnosis. Pairwise comparisons were assessed using the Tukey–Kramer method. Chi-square and Fisher’s exact test were used to assess categorical baseline variables. For amino acid outcome variables, diet effects on differences in mean change scores (week 4 – week 0) were assessed using analysis of variance techniques. Independent variables and covariates for consideration in the model were diet, diagnosis, gender, apolipoprotein E4 status (APOE4; presence of E4 allele referred to as E4+, absence of E4 allele referred to as E4-), age, BMI at baseline, and baseline value of the respective amino acid, and were dropped if they were not substantively related to the model (p > 0.15). Correlations of the change in CSF amino acids and CSF AD biomarkers were assessed with Pearson product moment correlations, and Spearman correlations were assessed in sensitivity analyses. All non-normally distributed variables were transformed prior to analysis. The amino acids aspartic acid, cysteine, and glutamic acid were not normally distributed after transformations due to numerous undetectable values and were removed from the analyses. Given the exploratory nature of the study, no adjustments were made for multiple comparisons and power analyses were not conducted to determine sample size; all participants who provided CSF in the primary trial were included in this exploratory study.
RESULTS
Baseline characteristics
Baseline characteristics of participants who provided at least one CSF sample (n = 43; 18 NC and 25 MCI) are presented in Table 1. Participants on the LOW diet had lower BMI values at baseline compared to those on the HIGH diet, regardless of cognitive status (26.64±0.78 versus 28.96±0.79 kg/m2; p = 0.04). For years of education, there was a diet and diagnosis interaction (p = 0.03). NC on the LOW diet tended to have less years of education at baseline compared to NC on the HIGH diet (p = 0.08). As expected, participants with NC had higher scores on the 3-Mini-Mental State Exam (3MSE) compared to MCI, regardless of randomly assigned diet (95.91±0.97 versus 95.47±0.96; p = 0.03). All other baseline variables were comparable among the groups.
Table 1
Baseline characteristics (mean and standard error) for participants who provided at least one CSF sample (n = 43)1
| LOW Diet | HIGH Diet | |||
| Variable | NC (n = 10) | MCI (n = 11) | NC (n = 8) | MCI (n = 14) |
| Age, y | 68.90 (2.24) | 68.82 (2.14) | 68.25 (2.51) | 67.64 (1.89) |
| BMI2 | 26.81 (1.13) | 26.48 (1.08) | 30.06 (1.26) | 27.85 (0.94) |
| Education, y 3 | 13.40 (0.66) | 15.55 (0.63) | 15.88 (0.74) | 15.07 (0.56) |
| 3MS4 | 96.56 (1.44) | 95.27 (1.31) | 97.88 (1.53) | 93.07 (1.16) |
| Gender | ||||
| female | 6 (28.6) | 5 (23.8) | 5 (23.8) | 5 (23.8) |
| male | 4 (18.2) | 6 (27.3) | 3 (13.6) | 9 (40.9) |
| APOE4 status5 | ||||
| E4- | 7 (23.3) | 6 (20) | 6 (20) | 11 (36.7) |
| E4+ | 3 (25) | 4 (33.3) | 2 (16.7) | 3 (25) |
| AD Biomarkers (pg/ml) | ||||
| Aβ42 | 1265.2 (155.7) | 1135.6 (155.7) | 1223.3 (174.1) | 1248.9 (127.1) |
| Tau | 81.4 (16.2) | 116.7 (15.5) | 72.0 (18.2) | 78.5 (14.2) |
| PTau181 | 59.7 (12.4) | 93.8 (11.8) | 64.0 (13.9) | 66.2 (10.5) |
1Continuous data are expressed as least squares mean (standard error of the mean) and categorical data are expressed as frequency (percent). A mixed model was used to assess the differences in means for each continuous baseline variable by diet, diagnosis, and diet-by-diagnosis. Pairwise comparisons were assessed using the Tukey–Kramer method. Chi-square and Fisher’s exact test were used to assess categorical baseline variables. 2Participants on the LOW diet had a lower BMI then participants on the HIGH diet (26.64±0.78 versus 28.96±0.79 kg/m2; p = 0.04). 3There was a diet by diagnosis interaction for years of education (p = 0.03). NC on the LOW diet tended to have less years of education at baseline compared to MCI on the LOW diet (p = 0.11) and NC on the HIGH diet (p = 0.08). 4Data was missing for one participant (n = 42). Participants with NC had higher cognitive testing scores compared to MCI (95.91±0.97 versus 95.47±0.96; p = 0.03). 5Data was missing for one participant with MCI on the LOW diet (n = 10). APOE4, apolipoprotein E4 (presence of E4 allele referred to as E4+, absence of E4 allele referred to as E4-); BMI, body mass index (calculated as kg/m2); HIGH, high saturated fat/high glycemic index; LOW, low saturated fat/low glycemic index; MCI, mild cognitive impairment; 3MS, modified Mini-Mental State test (100 point range with lower scores indicating more severe cognitive deficit); NC, normal cognition.
The baseline values of CSF amino acids for all participants who provided a sample at week 0 (n = 40) were compared between cognitive status groups (Supplementary Table 1). There was a trend toward a difference between cognitive status at baseline for histidine only (p = 0.07), with higher values in NC compared to MCI. All other baseline CSF amino acid values were similar between the groups.
Nutrient composition
Average daily macronutrient intake calculated from self-reported three-day food records was used to assess participants’ typical dietary intake at baseline, prior to diet intervention, and following 4 weeks of intervention; the change in composition following the LOW and HIGH diets is presented in Table 2. The diets did not differ in change in total calories, protein, or polyunsaturated fat. There was an increase in total fat (p < 0.0001), saturated fat (p < 0.0001), monounsaturated fat (p = 0.0001), trans fat (p = 0.004), and cholesterol (p < 0.0001) following the HIGH diet. In contrast, there was an increase in total carbohydrate (p < 0.0001), fiber (p < 0.0001), sugar (p < 0.0001), and fructose (p = 0.003) following the LOW diet. These changes in intake confirm participant compliance to the randomly assigned diets.
Table 2
Average daily change in diet composition (week 4 – week 0) for the LOW and HIGH diets, according to three-day food records1
| Variable | LOW Diet | HIGH Diet |
| Calories (kcal) | 230.07 (141.61) | 302.73 (139.57) |
| Protein (g) | 21.08 (6.74) | 12.82 (6.65) |
| Fat (g)2 | –18.71 (7.08) | 41.67 (6.97) |
| Saturated Fat (g)2 | –7.69 (3.03) | 34.73 (2.98) |
| Monounsaturated Fat (g)2 | –5.27 (2.61) | 11.03 (2.557) |
| Polyunsaturated Fat (g)2 | –2.48 (1.49) | –4.03 (1.47) |
| Trans Fat (g)2 | –0.13 (0.20) | 0.75 (0.19) |
| Cholesterol (mg)2 | –183.29 (38.42) | 105.55 (37.87) |
| Carbohydrate (g)3 | 104.00 (15.90) | –31.95 (15.67) |
| Fiber (g)3 | 17.84 (2.11) | –13.32 (2.08) |
| Sugar (g)3 | 20.26 (8.27) | –35.53 (8.15) |
| Fructose (g)3 | 4.01 (1.95) | –4.98 (1.92) |
1Dietary intake data from participants who provided CSF samples at baseline and endpoint (n = 31). Data are expressed as least squares mean (standard error of the mean). A mixed model was used to assess the differences in means in nutrient composition change (week 4 – week 0) by diet, diagnosis, and diet-by-diagnosis. Pairwise comparisons were assessed using the Tukey–Kramer method. 2Total fat (p < 0.0001), saturated fat (p < 0.0001), monounsaturated fat (p = 0.0001), trans fat (p = 0.004), and cholesterol (p < 0.0001) increased after consumption of the HIGH diet compared to the LOW diet. 3Total carbohydrate (p < 0.0001), fiber (p < 0.0001), sugar (p < 0.0001), and fructose (p = 0.003) increased after consumption of the LOW diet compared to the HIGH diet.
Diet effects on CSF amino acids and metabolites
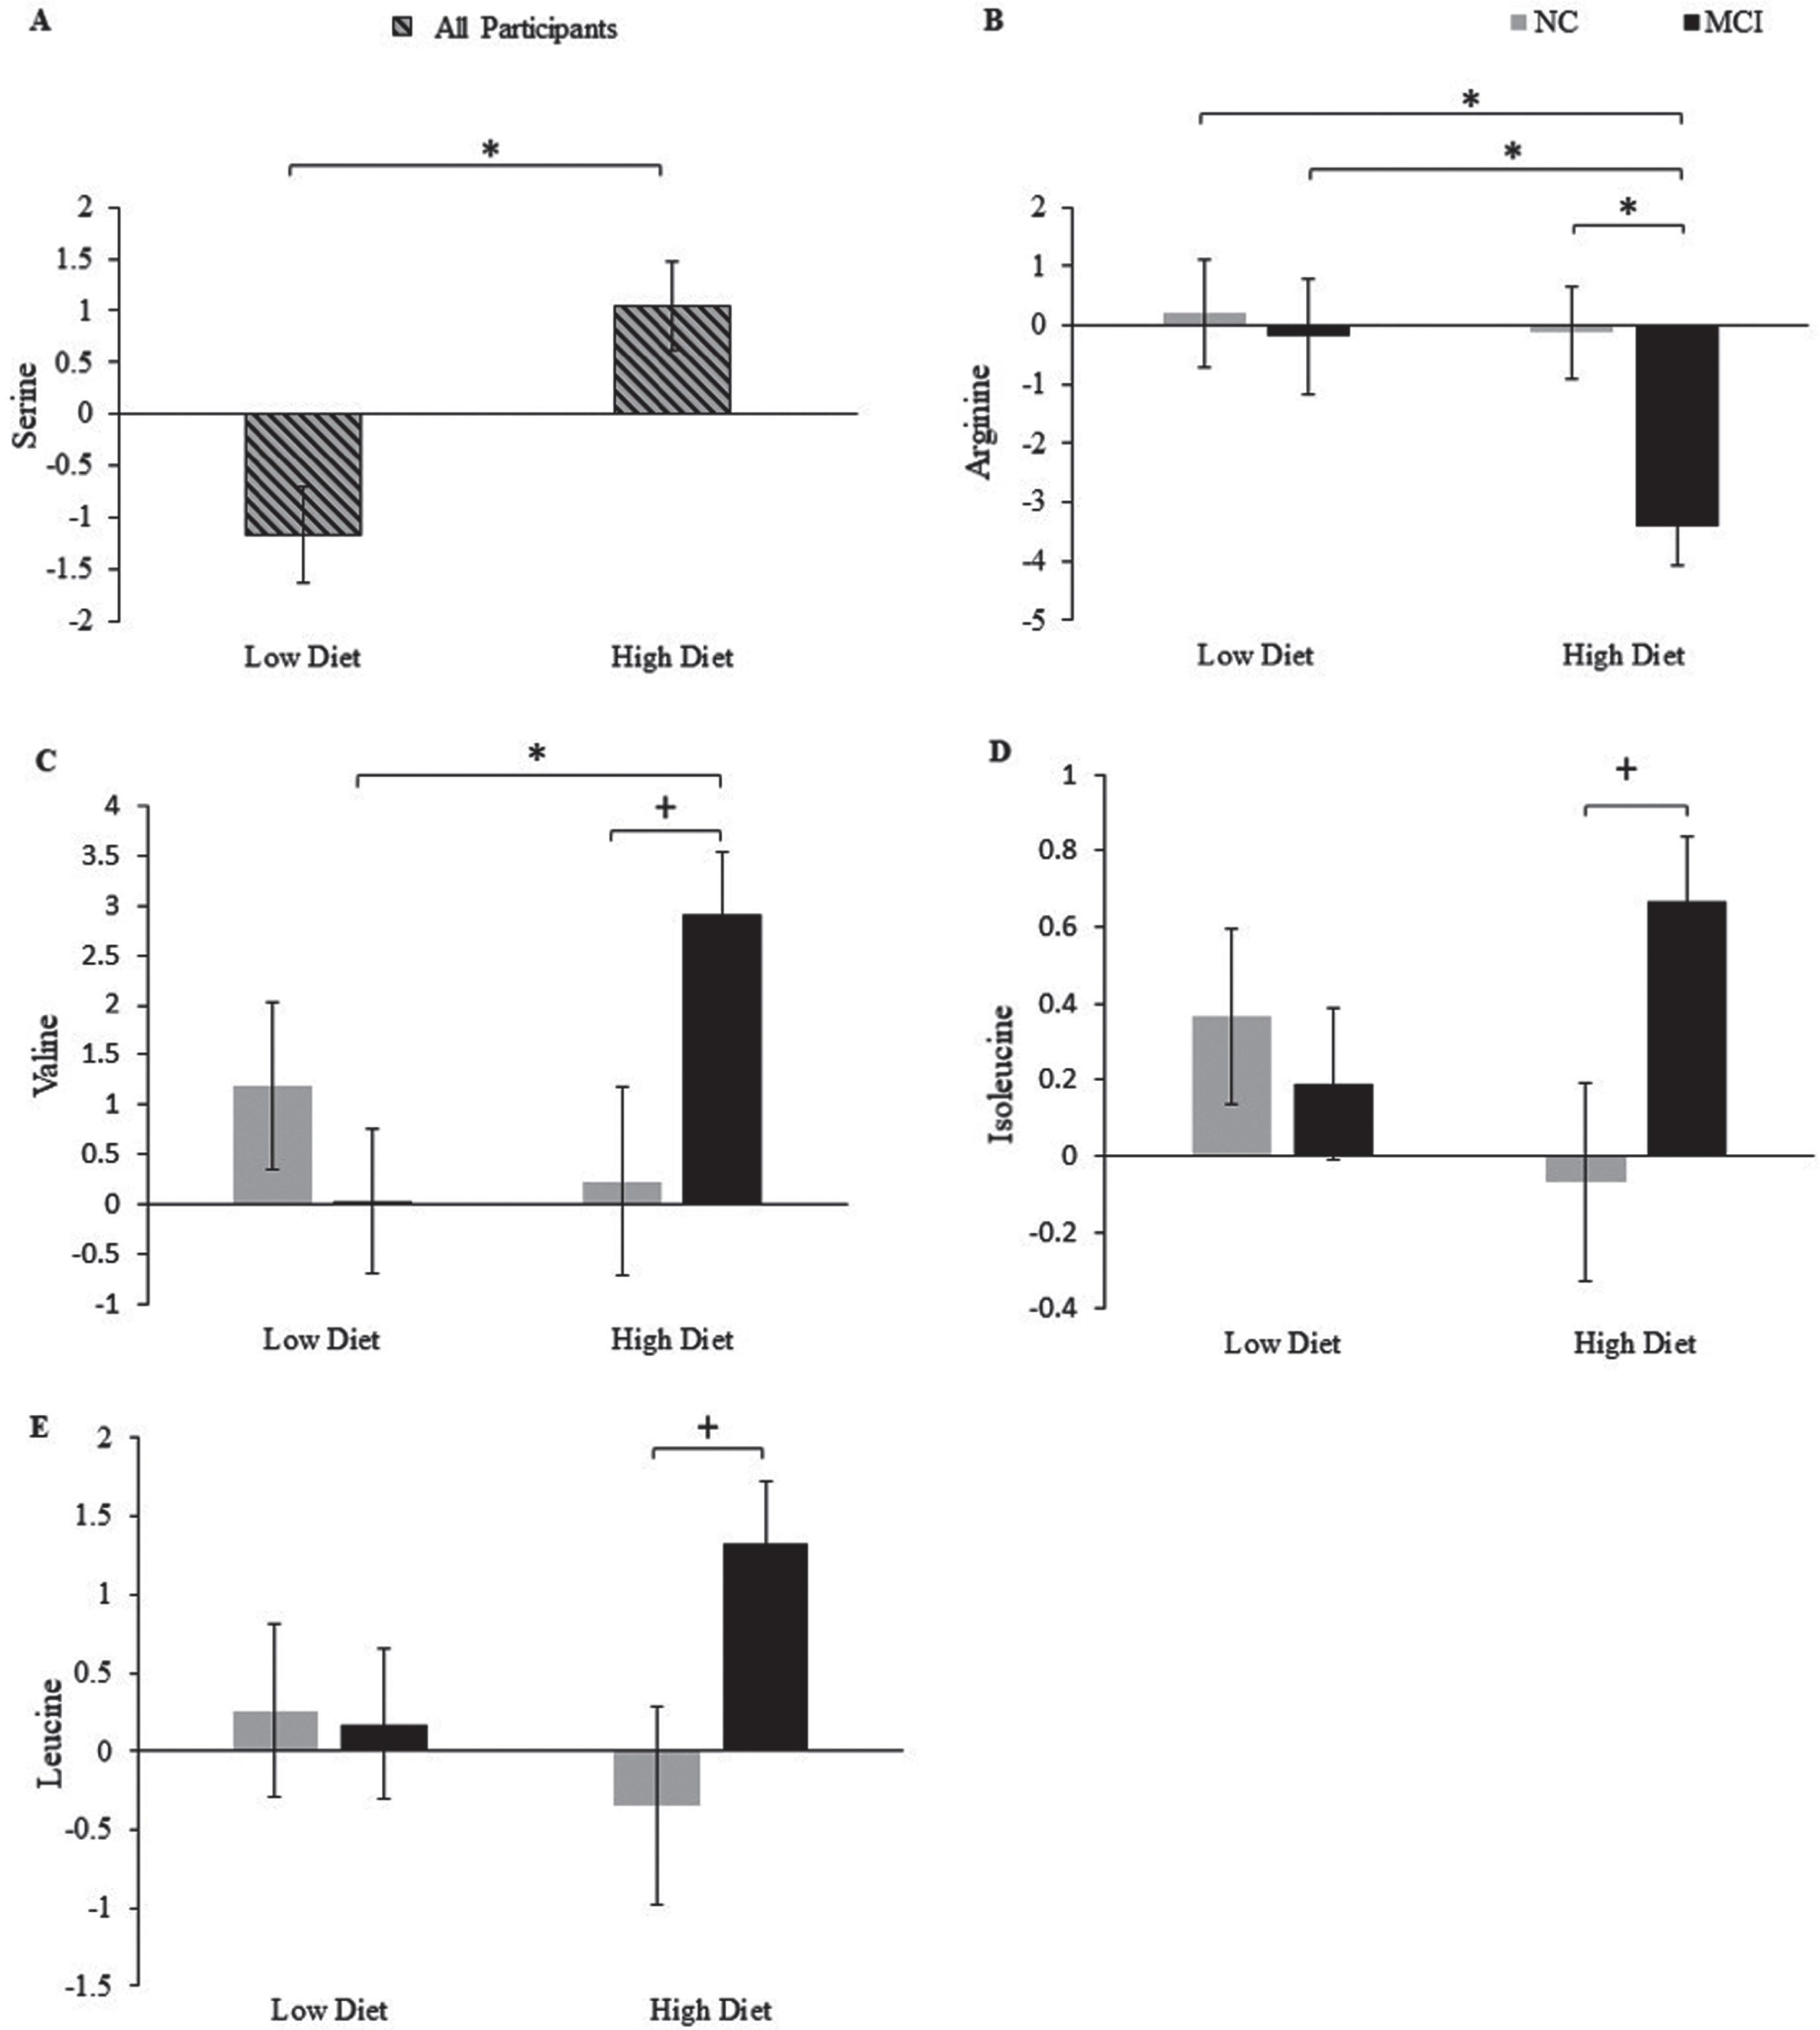
Mean change scores for all CSF amino acids after four weeks of consumption of the LOW or HIGH diet by cognitive status are included in Supplementary Table 2. Figure 1 shows the significant changes in response to diet, as well as diet by cognitive status interactions. There was a diet effect on serine (p = 0.001; Fig. 1a), with an increase following the HIGH compared to the LOW diet. There was also a diet effect on CSF arginine (p = 0.04), with reductions after the HIGH compared to the LOW diet. However, this effect appeared to be driven by a trend interaction between diet and cognitive diagnosis (p = 0.09), such that participants with MCI on the HIGH diet showed a reduction in arginine compared to NC on the HIGH diet (p = 0.05; Fig. 1b) and MCI and NC on the LOW diet (p = 0.02 for both). Further, there was a diet by cognitive diagnosis interaction for the branched chain amino acids valine (p = 0.03; Fig. 1c) and isoleucine (p = 0.05; Fig 1d), with a similar pattern observed for leucine (Fig. 1e). In participants with MCI, the HIGH diet increased valine compared to the LOW Diet (p = 0.03), with a trend toward an increase compared to NC (p = 0.13). Isoleucine and leucine also increased in MCI compared to NC after the HIGH diet, although these effects did not reach significance. The diets did not yield significant effects on change in the CSF amino acid metabolites citrulline, ornithine, and α-aminoadipic acid (Supplementary Table 2).
Fig. 1
Mean change from baseline (LSM±SEM; value at week 4 – value at week 0) for serine (a) according to diet, and arginine (b), valine (c), isoleucine (d), and leucine (e) according to diet and cognitive status.+p≤0.16, *p≤0.05. MCI, mild cognitive impairment; NC, normal cognition.
Correlations between CSF amino acids, metabolites, and AD biomarkers
We have previously reported that the dietary interventions induced changes in CSF AD biomarkers [23]. Herein, we examined whether changes in CSF amino acids, as well as select amino acid metabolites, and AD biomarkers following 4 weeks of diet intervention were related using Pearson product moment correlations (Fig. 2). Heat maps were used to illustrate the correlation structure between variables within diet and cognitive status, including both significant correlations (p < 0.01–0.05) and trends (p < 0.10–0.15). Spearman rank correlations were also assessed in sensitivity analyses to confirm correlations were not due to outlier values (data not shown).
Fig. 2
Heat map of Pearson product moment correlations between the change (value at week 4 – value at week 0) in CSF amino acids and CSF AD biomarkers, stratified by diet and cognitive diagnosis. Correlations with a p-value > 0.15 are indicated in black. Correlations with a p-value≤0.15 are categorized according to degree of significance and direction of the association, indicated in red (inverse correlation) or green (direct correlation). MCI, mild cognitive impairment; NC, normal cognition.
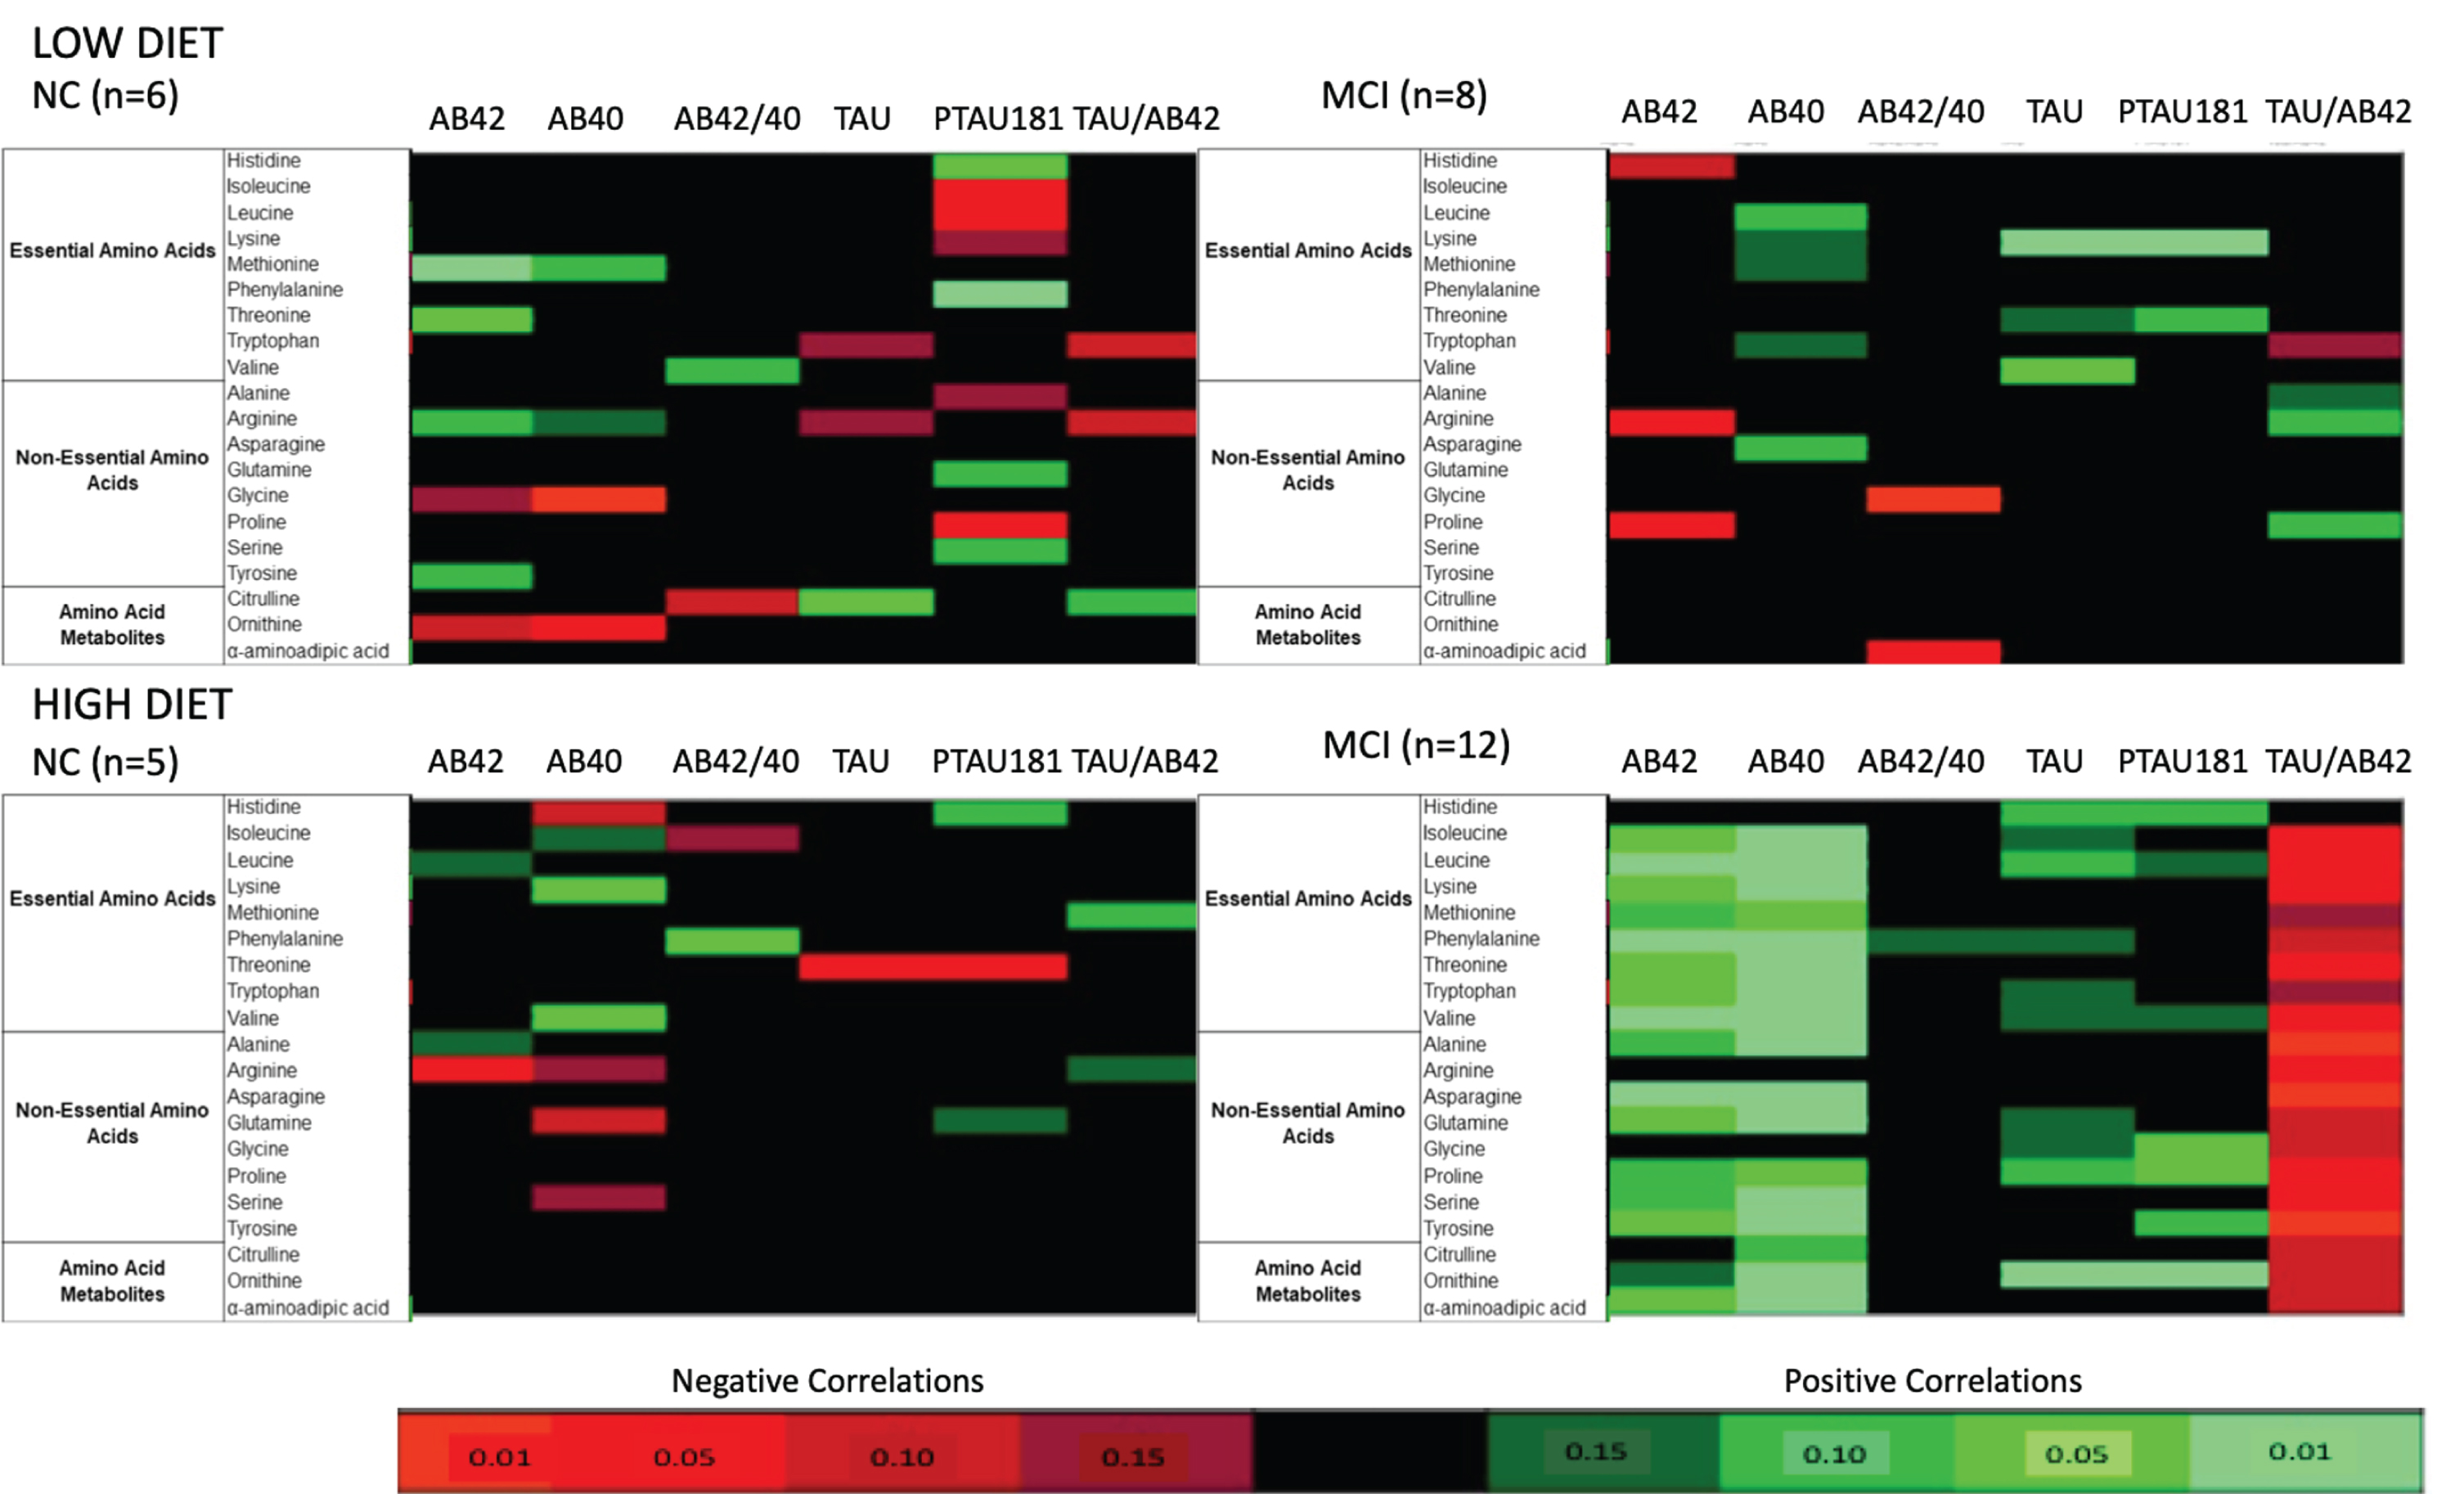
Distinct patterns were observed in the relationships between amyloid biomarkers and amino acids, driven by both cognitive status and dietary intake. In MCI following the HIGH diet, changes in Aβ42 and Aβ40 were positively correlated with nearly all amino acids and amino acid metabolites assessed. These correlations reached statistical significance for Aβ42 with 12 amino acids and 1 metabolite, as well as Aβ40 with 14 amino acids and 2 metabolites. Such patterns were not present in NC following the HIGH diet; significant statistics were observed for the negative association between Aβ42 with arginine and the positive association between Aβ40 with lysine and valine. A slightly different pattern emerged in MCI on the LOW diet compared to MCI on the HIGH diet. Aβ40 tended to have positive relationships with amino acids, although they did not reach significance. However, Aβ42 was negatively correlated with the three amino acids arginine, histidine, and proline. NC on the low diet exhibited positive associations with Aβ42 and Aβ40 and select amino acids, three of which were significant (i.e., Aβ42 and methionine, threonine, and tyrosine). In contrast, glycine and ornithine were inversely related to both amyloid biomarkers.
Cognitive status and diet assignment also had unique effects on the tau biomarker and amino acid relationships. In MCI after the HIGH diet, positive associations were observed between numerous amino acids and both tau and p-Tau 181. Significant statistics were reported for tau with histidine and ornithine, as well as p-Tau 181 with glycine, proline, and ornithine. Further, the tau to Aβ42 ratio was negatively associated with many amino acids and amino acid metabolites in MCI after the HIGH diet, 13 of which reached significance. In contrast, very few associations were seen in NC on the HIGH diet; tau and p-Tau 181 were significantly negatively associated with threonine. Similar to MCI on the HIGH diet, positive associations between amino acid and tau biomarkers were seen in MCI after the LOW diet. Significant statistics were observed for tau with lysine and valine, and p-Tau 181 with lysine and threonine. Nearly all amino acids exhibited a relationship with p-Tau 181 in NC on the LOW diet, although the direction varied. Significant positive associations were observed with histidine and phenylalanine, whereas significant negative associations were observed with isoleucine, leucine, and proline.
Correlations between CSF amino acids, metabolites, and insulin
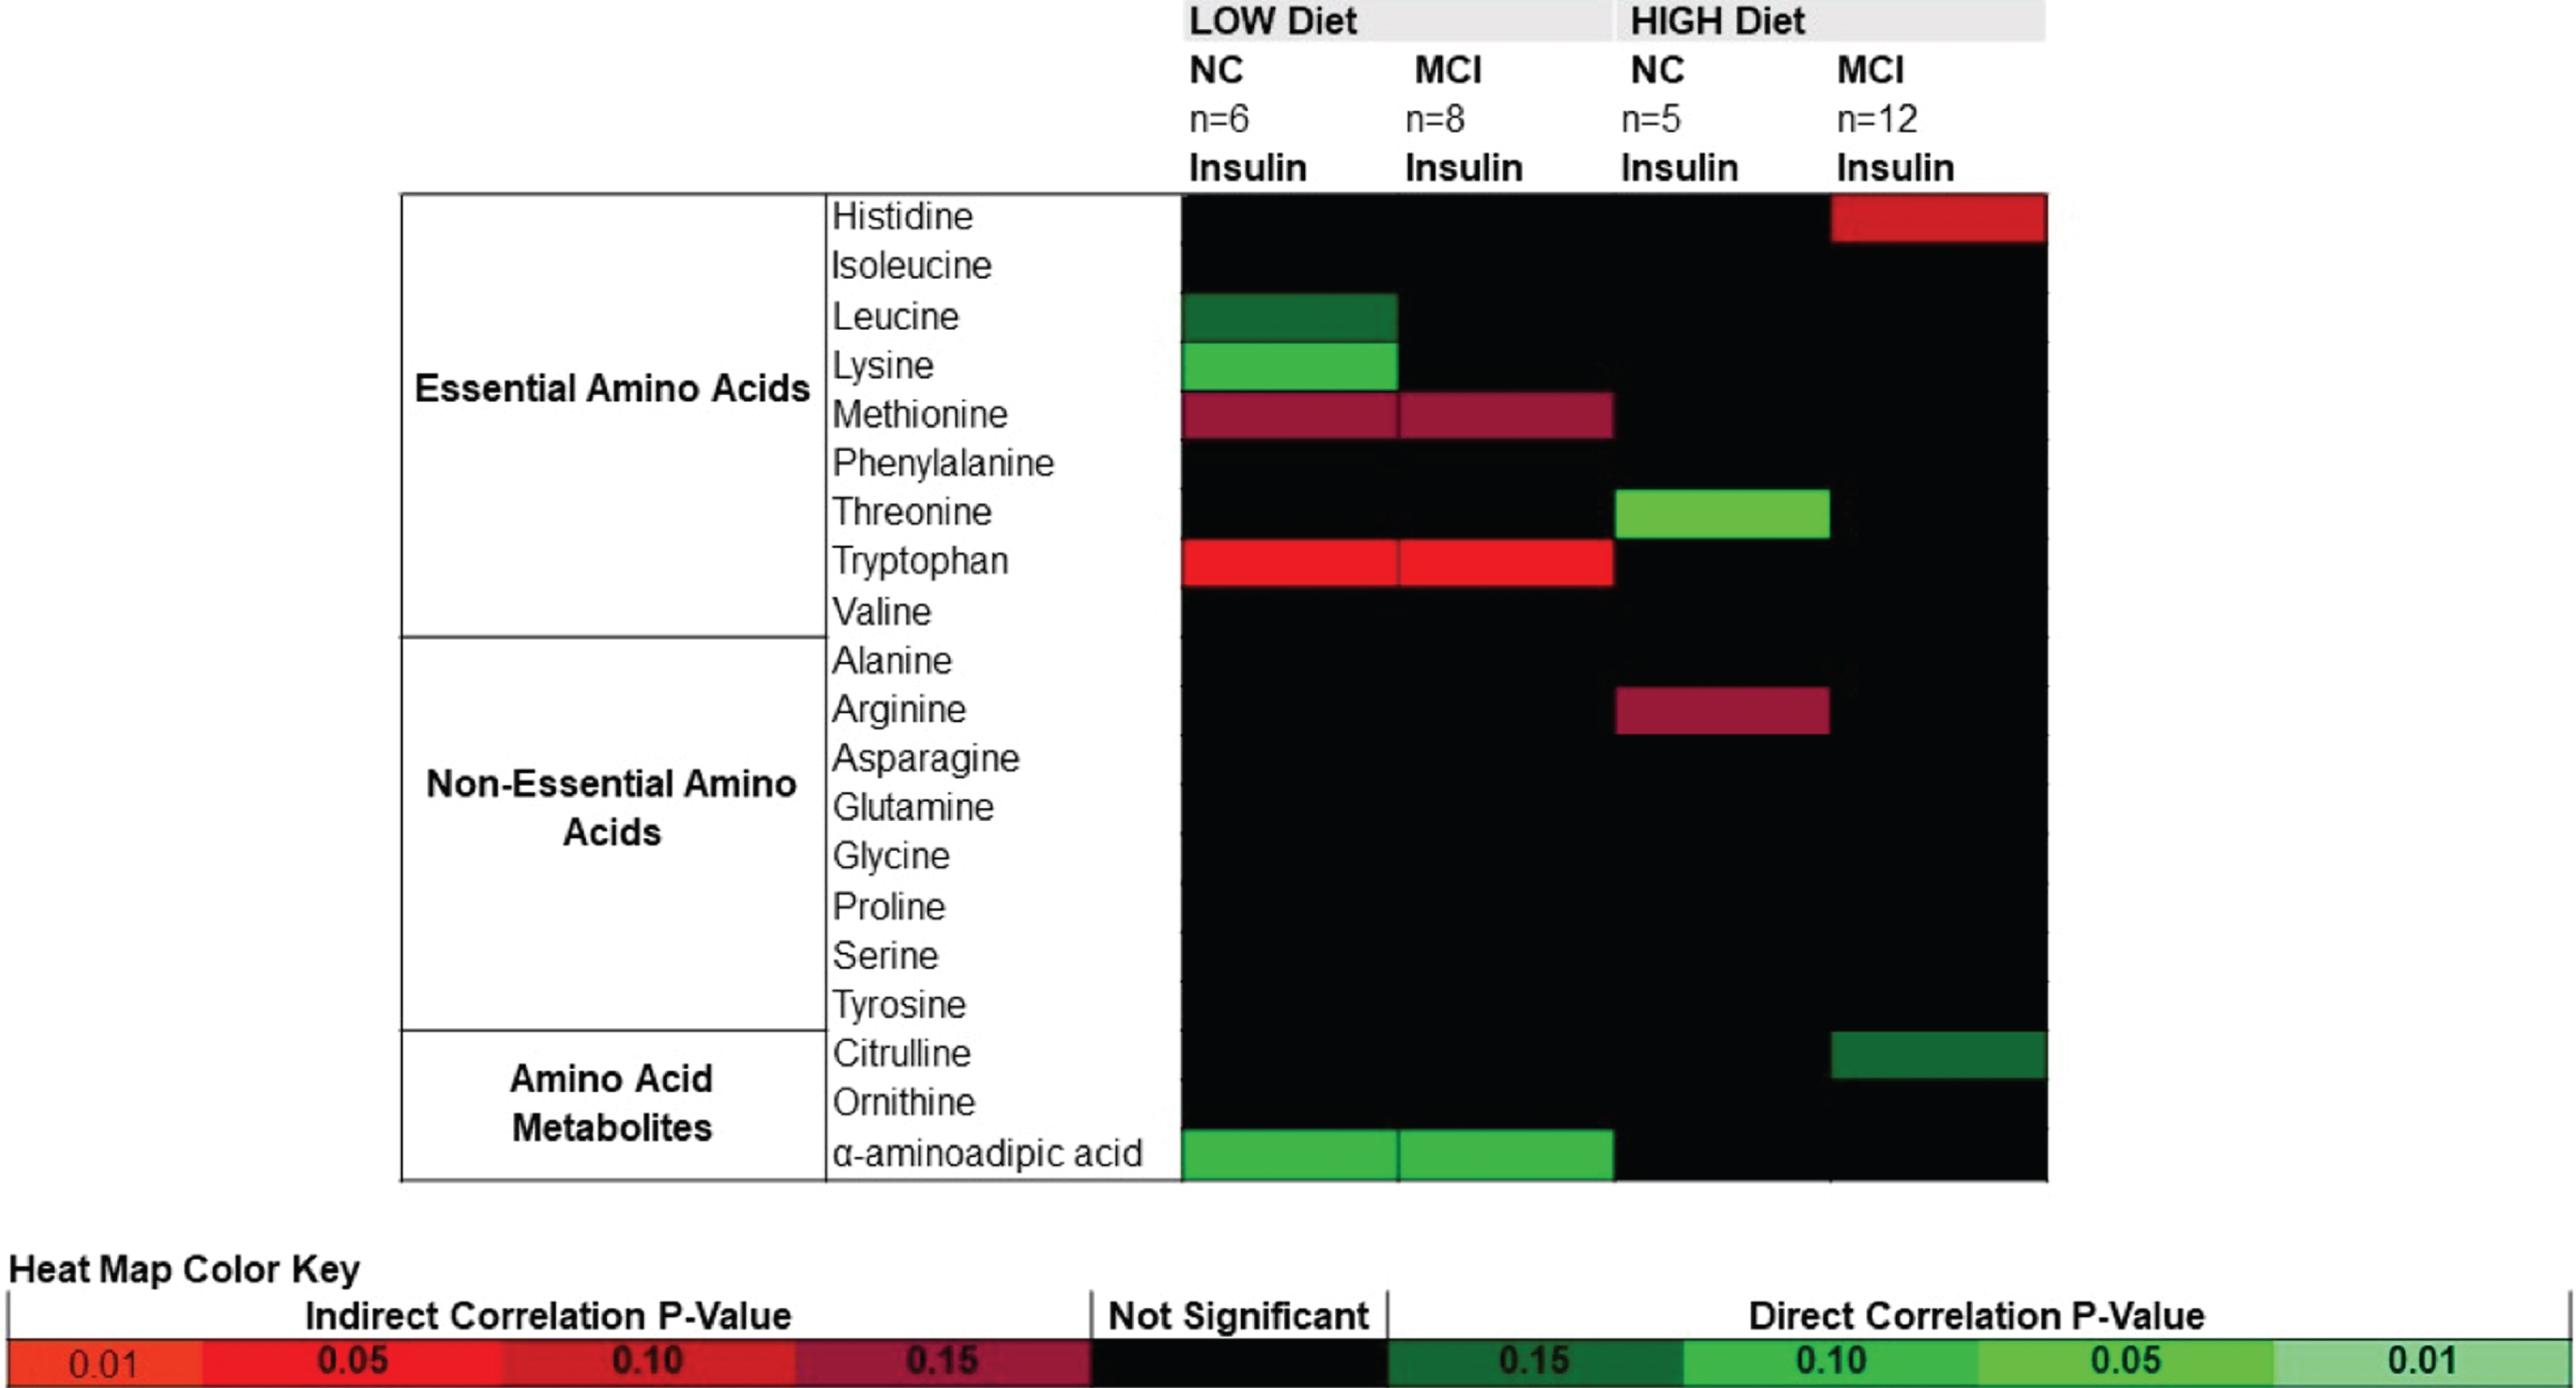
Pearson product moment correlations between CSF amino acids and CSF insulin are presented in Fig. 3. In both NC and MCI following the LOW diet, changes in insulin were negatively correlated with tryptophan, with a trend toward negative correlations with methionine and positive correlations with α-aminoadipic acid. Threonine was positively correlated with insulin in NC following the HIGH diet. Correlations between insulin and amino acids did not reach significance in MCI following the HIGH diet.
Fig. 3
Heat map of Pearson product moment correlations between the change (value at week 4 – value at week 0) in CSF amino acids and CSF insulin, stratified by diet and cognitive diagnosis. Correlations with a p-value > 0.15 are indicated in black. Correlations with a p-value≤0.15 are categorized according to degree of significance and direction of the association, indicated in red (inverse correlation) or green (direct correlation). MCI, mild cognitive impairment; NC, normal cognition.
DISCUSSION
In this randomized, parallel, controlled feeding trial, we demonstrated that dietary intake modulates CSF amino acid concentrations in adults with NC or MCI. The amino acid diet response is differentially affected by cognitive status, particularly for the amino acids arginine, isoleucine, leucine, and valine. Furthermore, changes in CSF amino acids correspond with changes in established AD CSF biomarkers, with distinct patterns in the relationships by diet intervention and cognitive status.
To our knowledge, this is the first dietary intervention study to report that diet effects on CSF levels of amino acids vary based on cognitive status in humans. A consistent pattern of results was seen across isoleucine, leucine, and valine, with an increase in MCI, but not NC, following four weeks of the HIGH diet. This pattern indicates that a high-fat/high-glycemic load diet alone did not elicit an increase in the three amino acids, but rather, caused an increase in the context of a cognitively impaired state. Isoleucine, leucine, and valine are BCAAs, essential amino acids that cannot be endogenously synthesized and are obtained solely through the diet [28]. We assessed protein consumption and found that the change in protein intake did not differ between the two diets and there was not a significant diet by cognitive status interaction, eliminating the possibility the reported CSF BCAA increase was a reflection of a parallel increase in total protein intake in the MCI HIGH diet group. Notably, BCAAs have recently been implicated in the metabolic dysfunction characteristic of AD [1]. Several human observational analyses have reported peripheral metabolic shifts in blood BCAA concentration in MCI, dementia, and AD, although the direction of the relationships across studies is inconsistent [7–12]. Numerous studies have characterized the amino acid profile in CSF by cognitive state and results also vary widely. Ibanez et al. compared the CSF metabolome in patients with different cognitive status and reported higher levels of valine in AD compared with non-AD and MCI who later progressed to AD [17]. In contrast, Basun et al. reported a reduction in leucine and valine in AD compared to healthy controls [15], whereas Fonteh et al. reported no differences in CSF BCAAs between probable AD and controls [16]. Given the relationships between the amino acid signature and IR [13], as well as cognition and IR [14], we explored markers of insulin sensitivity and found that CSF insulin was not significantly correlated with CSF amino acids in those with MCI on the HIGH diet. We also evaluated the diet and cognitive status effects on α-aminoadipic acid, an amino acid metabolite with a purported role in insulin resistance but did not report a significant effect. However, α-aminoadipic acid was positively correlated with insulin in both NC and MCI on the LOW diet.
There are numerous hypotheses of the purported role of BCAAs in AD pathogenesis; excess BCAAs may lead to an imbalance of neurotransmitters (i.e., glutamate, aromatic amino acid derivatives), induce neural oxidative stress and apoptosis, and hyperactivate mammalian target of rapamycin (mTOR) and downstream signaling pathways [28]. In this study, we hypothesize that early changes in cerebral metabolism in MCI include a disruption in central BCAA catabolism, and the high-fat/high-glycemic load diet further exacerbated disrupted energy homeostasis resulting in BCAA accumulation in the CSF. It has been speculated that, when faced with dysfunctional glucose metabolism, the AD brain may attempt to maintain energy homeostasis through compensatory neuronal changes, including increased amino acid catabolism for an alternative fuel source [6], a process that may be linked to the pathological products of excess BCAA metabolism described above and that may potentiate AD pathogenesis; however, there is no evidence in cognitively impaired populations to date to support this hypothesis. Indeed, healthy adults do not utilize amino acids for the brain’s oxidative metabolism in hypoglycemic and/or euglycemic conditions [29]. Additional human studies are needed to evaluate BCAA levels in the CSF of individuals with MCI at baseline and in response to dietary intervention.
We also reported that the amino acid arginine decreased on the HIGH diet, driven by the substantial reduction in the MCI group, compared to the three other diet/cognitive status groups. Aberrations in arginine metabolism have been implicated in the pathogenesis of AD, with evidence indicating arginine metabolism is altered in various regions of AD brains [30] and CSF arginine is reduced in AD [16, 17]. Reductions in urinary arginine levels have been reported in amnestic MCI compared to normal controls, reflecting systemic arginine dysregulation in early cognitive impairment [31]. Arginine is a semi-essential amino acid with numerous biological functions including protein synthesis and formation of vital metabolites (i.e., urea, nitric oxide) [32]. Arginine is a key player in the urea cycle for the disposal of nitrogenous waste [30]; an increase in arginine degradation (and subsequently lower peripheral and central levels) can be a consequence of a greater demand for nitrogen detoxification from increased amino acid metabolism [17]. Further, nitric oxide deficiency from reduced conversion of arginine to nitric oxide has emerging roles in the central nervous system and AD, with deficiency adversely effecting endothelial function, amyloid formation and accumulation, synaptic plasticity, microglia status, and inflammation [33, 34]. A high-fat diet impairs nitric oxide bioavailability [35]; therefore, the HIGH diet in combination with the lowered availability of substrate within the arginine-citrulline pathway for nitric oxide production, a pivotal vasodilator, may have unique effects on AD pathophysiology in this at-risk group. We further explored arginine through assessment of amino acid metabolites, citrulline and ornithine, but did not identify a significant effect of dietary intake and cognitive status on these downstream metabolites. As the case with the BCAAs, the arginine decrease was not a reflection of a reduction in total protein intake because this variable did not differ between diets and cognitive groups.
We also explored the relationships between change in CSF biomarkers of AD pathology with change in amino acids and select metabolites following 4 weeks of intervention and reported unique patterns by cognitive status and dietary intake. Both significant correlations and trends were assessed due to the small sample size within each cognitive status and diet grouping. The strongest pattern emerged within the MCI/HIGH diet group, with direct relationships between amino acids and Aβ42, Aβ40, Tau, and pTau-181, and inverse relationships with the tau/Aβ42 ratio. To our knowledge, this is the first study to assess correlations between a panel of CSF AD biomarkers and amino acids and metabolites in humans. Kavanaugh et al. analyzed CSF Aβ42 in relation to CSF amino acids in control, pre-diabetic, and type II diabetic aging vervet monkeys to elucidate the interaction between early metabolic changes in diabetes with early alterations in AD biomarkers [36]. CSF Aβ42 was positively correlated with CSF BCAAs (values normalized to control monkeys), suggesting alterations in cerebral metabolism vary together with amyloid pathology. The authors proposed a hypermetabolic/hyperactive brain model in both diabetes and AD, characterized by cerebral overconsumption of energy substrates leading to increased Aβ42 aggregation in the brain (thus, a decrease in the CSF) and a decrease of amino acids in the CSF. The HIGH diet in our study was composed to mimic a nutrient composition that induces type II diabetes and insulin resistance [23] and our amyloid-related findings following this diet in MCI are in support of the Kavanaugh et al. hypermetabolic model. A pattern of multiple positive associations between change in amino acids (including BCAAs) and Aβ42 and Aβ40 were seen in MCI after the HIGH diet, indicating lowered CSF amino acids were associated with worsened amyloid biomarkers. Moreover, amino acids were inversely associated with the tau/Aβ42 ratio, suggesting that lowered CSF amino acids are associated with a worsened biomarker. A corollary to this observation, however, is that the net effect of the HIGH diet was to raise levels of BCAAs for the MCI group, implying that participants with diet-induced increased BCAAs showed improved biomarker profiles. Additionally, our tau-related results after the HIGH diet in MCI are paradoxical within the context of this hypermetabolic model. We reported that reductions in amino acids were directly associated with reductions in tau and ptau-181, considered a beneficial AD biomarker shift. Additional human studies are needed to confirm the reported associations between AD biomarkers and amino acids and should include both tau and amyloid for a comprehensive analysis.
Strengths of this study included successful manipulation of nutrient intake and adherence to the 4-week dietary intervention. In addition to a shift in self-reported nutrient intake (assessed by 3-day food records), the diets achieved the anticipated effect on key metabolic markers, including insulin, insulin resistance, and lipids [23]. A limitation of this study is that we cannot attribute the diet response to a specific dietary component, as multiple nutrients were manipulated. The HIGH diet was designed to reflect a Western, American-style diet, with respective shifts in total fat, saturated fat, carbohydrates, and the glycemic index. Because nutrients and foods are not consumed in isolation, manipulating multiple nutrients provided insight into the effects of the totality of a dietary pattern. Assessment of the individual amino acid profiles of controlled feeding diets in future trials would be beneficial. Our trial included participants with NC or MCI; therefore, we cannot conclude the diet effect on CSF amino acids in individuals with AD. However, our findings may provide insight into mechanisms and indicators of early phase disease progression. An obvious limitation is the small sample size and brief study duration; the results from our exploratory study should be replicated in a longer, larger study for a more robust evaluation. Future studies of CSF amino acids are necessary to determine if changes in amino acid metabolism are a precursor to and/or a biomarker of neurodegeneration.
In conclusion, the data presented herein demonstrate that dietary intake modulates CSF levels of amino acids and the response to diet varies by cognitive status. Specifically, a Western dietary pattern high in fat, saturated fat, and simple carbohydrates increases CSF levels of BCAAs and decreases arginine in individuals with MCI. Changes in CSF amino acids in response to diet correspond with changes in established AD biomarkers, and the unique patterns of associations differ by cognitive status. These findings provide additional insights into the metabolic shifts that occur in cognitive impairment, beyond that described for glucose, generating a more comprehensive knowledgebase of cerebral metabolism in early cognitive decline. Notably, these data provide further evidence of the powerful impact of diet, extending beyond the periphery to the central nervous system to modify the composition of the CSF. Nutritional strategies aimed at reducing and/or preventing AD pathology are vital, and unique dietary recommendations based on cognitive vulnerability may be necessary.
ACKNOWLEDGMENTS
This research was supported by grants R37 AG-10880 and P30 AG-043698 (S. Craft) and by T32 AG-033534 (K. Russin) from the National Institute on Aging).
Authors’ disclosures available online (https://www.j-alz.com/manuscript-disclosures/21-0471r1).
SUPPLEMENTARY MATERIAL
[1] The supplementary material is available in the electronic version of this article: https://dx.doi.org/10.3233/JAD-210471.
REFERENCES
[1] | Polis B , Samson AO ((2020) ) Role of the metabolism of branched-chain amino acids in the development of Alzheimer’s disease and other metabolic disorders. Neural Regen Res 15: , 1460–1470. |
[2] | Chen Z , Zhong C ((2013) ) Decoding Alzheimer’s disease from perturbed cerebral glucose metabolism: Implications for diagnostic and therapeutic strategies. Prog Neurobiol 108: , 21–43. |
[3] | Croteau E , Castellano CA , Fortier M , Bocti C , Fulop T , Paquet N , Cunnane SC ((2018) ) A cross-sectional comparison of brain glucose and ketone metabolism in cognitively healthy older adults, mild cognitive impairment and early Alzheimer’s disease. Exp Gerontol 107: , 18–26. |
[4] | Mosconi L , Tsui WH , De Santi S , Li J , Rusinek H , Convit A , Li Y , Boppana M , de Leon MJ ((2005) ) Reduced hippocampal metabolism in MCI and AD: Automated FDG-PET image analysis. Neurology 64: , 1860–1867. |
[5] | Pagani M , De Carli F , Morbelli S , Oberg J , Chincarini A , Frisoni GB , Galluzzi S , Perneczky R , Drzezga A , van Berckel BN , Ossenkoppele R , Didic M , Guedj E , Brugnolo A , Picco A , Arnaldi D , Ferrara M , Buschiazzo A , Sambuceti G , Nobili F ((2015) ) Volume of interest-based [18F]fluorodeoxyglucose PET discriminates MCI converting to Alzheimer’s disease from healthy controls. A European Alzheimer’s Disease Consortium (EADC) study. Neuroimage Clin 7: , 34–42. |
[6] | Griffin JW , Bradshaw PC ((2017) ) Amino acid catabolism in Alzheimer’s disease brain: Friend or foe? Oxid Med Cell Longev 2017: , 5472792. |
[7] | Tynkkynen J , Chouraki V , van der Lee SJ , Hernesniemi J , Yang Q , Li S , Beiser A , Larson MG , Saaksjarvi K , Shipley MJ , Singh-Manoux A , Gerszten RE , Wang TJ , Havulinna AS , Wurtz P , Fischer K , Demirkan A , Ikram MA , Amin N , Lehtimaki T , Kahonen M , Perola M , Metspalu A , Kangas AJ , Soininen P , Ala-Korpela M , Vasan RS , Kivimaki M , van Duijn CM , Seshadri S , Salomaa V ((2018) ) Association of branched-chain amino acids and other circulating metabolites with risk of incident dementia and Alzheimer’s disease: A prospective study in eight cohorts. Alzheimers Dement 14: , 723–733. |
[8] | Toledo JB , Arnold M , Kastenmuller G , Chang R , Baillie RA , Han X , Thambisetty M , Tenenbaum JD , Suhre K , Thompson JW , John-Williams LS , MahmoudianDehkordi S , Rotroff DM , Jack JR , Motsinger-Reif A , Risacher SL , Blach C , Lucas JE , Massaro T , Louie G , Zhu H , Dallmann G , Klavins K , Koal T , Kim S , Nho K , Shen L , Casanova R , Varma S , Legido-Quigley C , Moseley MA , Zhu K , Henrion MYR , van der Lee SJ , Harms AC , Demirkan A , Hankemeier T , van Duijn CM , Trojanowski JQ , Shaw LM , Saykin AJ , Weiner MW , Doraiswamy PM , Kaddurah-Daouk R ((2017) ) Metabolic network failures in Alzheimer’s disease: A biochemical road map. Alzheimers Dement 13: , 965–984. |
[9] | Gonzalez-Dominguez R , Garcia-Barrera T , Gomez-Ariza JL ((2015) ) Metabolite profiling for the identification of altered metabolic pathways in Alzheimer’s disease. J Pharm Biomed Anal 107: , 75–81. |
[10] | Larsson SC , Markus HS ((2017) ) Branched-chain amino acids and Alzheimer’s disease: A Mendelian randomization analysis. Sci Rep 7: , 13604. |
[11] | Li H , Ye D , Xie W , Hua F , Yang Y , Wu J , Gu A , Ren Y , Mao K ((2018) ) Defect of branched-chain amino acid metabolism promotes the development of Alzheimer’s disease by targeting the mTOR signaling. Biosci Rep 38: , BSR20180127. |
[12] | Hudd F , Shiel A , Harris M , Bowdler P , McCann B , Tsivos D , Wearn A , Knight M , Kauppinen R , Coulthard E , White P , Conway ME ((2019) ) Novel blood biomarkers that correlate with cognitive performance and hippocampal volumetry: Potential for early diagnosis of Alzheimer’s disease. J Alzheimers Dis 67: , 931–947. |
[13] | Newgard CB , An J , Bain JR , Muehlbauer MJ , Stevens RD , Lien LF , Haqq AM , Shah SH , Arlotto M , Slentz CA , Rochon J , Gallup D , Ilkayeva O , Wenner BR , Yancy WS Jr. , Eisenson H , Musante G , Surwit RS , Millington DS , Butler MD , Svetkey LP ((2009) ) A branched-chain amino acid-related metabolic signature that differentiates obese and lean humans and contributes to insulin resistance. Cell Metab 9: , 311–326. |
[14] | Janson J , Laedtke T , Parisi JE , O’Brien P , Petersen RC , Butler PC ((2004) ) Increased risk of type 2 diabetes in Alzheimer disease. Diabetes 53: , 474–481. |
[15] | Basun H , Forssell LG , Almkvist O , Cowburn RF , Eklof R , Winblad B , Wetterberg L ((1990) ) Amino acid concentrations in cerebrospinal fluid and plasma in Alzheimer’s disease and healthy control subjects. J Neural Transm Park Dis Dement Sect 2: , 295–304. |
[16] | Fonteh AN , Harrington RJ , Tsai A , Liao P , Harrington MG ((2007) ) Free amino acid and dipeptide changes in the body fluids from Alzheimer’s disease subjects. Amino Acids 32: , 213–224. |
[17] | Ibanez C , Simo C , Martin-Alvarez PJ , Kivipelto M , Winblad B , Cedazo-Minguez A , Cifuentes A ((2012) ) Toward a predictive model of Alzheimer’s disease progression using capillary electrophoresis-mass spectrometry metabolomics. Anal Chem 84: , 8532–8540. |
[18] | Yu E , Malik VS , Hu FB ((2018) ) Cardiovascular disease prevention by diet modification: JACC Health Promotion Series. J Am Coll Cardiol 72: , 914–926. |
[19] | Gorelick PB , Furie KL , Iadecola C , Smith EE , Waddy SP , Lloyd-Jones DM , Bae HJ , Bauman MA , Dichgans M , Duncan PW , Girgus M , Howard VJ , Lazar RM , Seshadri S , Testai FD , van Gaal S , Yaffe K , Wasiak H , Zerna C ((2017) ) Defining optimal brain health in adults: A presidential advisory from the American Heart Association/American Stroke Association. Stroke 48: , e284–e303. |
[20] | Morris MC , Tangney CC , Wang Y , Sacks FM , Bennett DA , Aggarwal NT ((2015) ) MIND diet associated with reduced incidence of Alzheimer’s disease. Alzheimers Dement 11: , 1007–1014. |
[21] | Morris MC , Tangney CC , Wang Y , Sacks FM , Barnes LL , Bennett DA , Aggarwal NT ((2015) ) MIND diet slows cognitive decline with aging. Alzheimers Dement 11: , 1015–1022. |
[22] | Berti V , Walters M , Sterling J , Quinn CG , Logue M , Andrews R , Matthews DC , Osorio RS , Pupi A , Vallabhajosula S , Isaacson RS , de Leon MJ , Mosconi L ((2018) ) Mediterranean diet and 3-year Alzheimer brain biomarker changes in middle-aged adults. Neurology 90: , e1789–e1798. |
[23] | Bayer-Carter JL , Green PS , Montine TJ , VanFossen B , Baker LD , Watson GS , Bonner LM , Callaghan M , Leverenz JB , Walter BK , Tsai E , Plymate SR , Postupna N , Wilkinson CW , Zhang J , Lampe J , Kahn SE , Craft S ((2011) ) Diet intervention and cerebrospinal fluid biomarkers in amnestic mild cognitive impairment. Arch Neurol 68: , 743–752. |
[24] | Lanza IR , Zhang S , Ward LE , Karakelides H , Raftery D , Nair KS ((2010) ) Quantitative metabolomics by H-NMR and LC-MS/MS confirms altered metabolic pathways in diabetes. PLoS One 5: , e10538. |
[25] | Irving BA , Carter RE , Soop M , Weymiller A , Syed H , Karakelides H , Bhagra S , Short KR , Tatpati L , Barazzoni R , Nair KS ((2015) ) Effect of insulin sensitizer therapy on amino acids and their metabolites. Metabolism 64: , 720–728. |
[26] | Konopka AR , Esponda RR , Robinson MM , Johnson ML , Carter RE , Schiavon M , Cobelli C , Wondisford FE , Lanza IR , Nair KS ((2016) ) Hyperglucagonemia mitigates the effect of metformin on glucose production in prediabetes. Cell Rep 15: , 1394–1400. |
[27] | Fishel MA , Watson GS , Montine TJ , Wang Q , Green PS , Kulstad JJ , Cook DG , Peskind ER , Baker LD , Goldgaber D , Nie W , Asthana S , Plymate SR , Schwartz MW , Craft S ((2005) ) Hyperinsulinemia provokes synchronous increases in central inflammation and beta-amyloid in normal adults. Arch Neurol 62: , 1539–1544. |
[28] | Siddik MAB , Shin AC ((2019) ) Recent progress on branched-chain amino acids in obesity, diabetes, and beyond. Endocrinol Metab (Seoul) 34: , 234–246. |
[29] | Wahren J , Ekberg K , Fernqvist-Forbes E , Nair S ((1999) ) Brain substrate utilisation during acute hypoglycaemia. Diabetologia 42: , 812–818. |
[30] | Liu P , Fleete MS , Jing Y , Collie ND , Curtis MA , Waldvogel HJ , Faull RL , Abraham WC , Zhang H ((2014) ) Altered arginine metabolism in Alzheimer’s disease brains. Neurobiol Aging 35: , 1992–2003. |
[31] | Zhang YQ , Tang YB , Dammer E , Liu JR , Zhao YW , Zhu L , Ren RJ , Chen HZ , Wang G , Cheng Q ((2019) ) Dysregulated urinary arginine metabolism in older adults with amnestic mild cognitive impairment. Front Aging Neurosci 11: , 90. |
[32] | Fonar G , Polis B , Meirson T , Maltsev A , Elliott E , Samson AO ((2018) ) Intracerebroventricular administration of l-arginine improves spatial memory acquisition in triple transgenic mice via reduction of oxidative stress and apoptosis. Transl Neurosci 9: , 43–53. |
[33] | Fleszar MG , Wiśniewski J , Zboch M , Diakowska D , Gamian A , Krzystek-Korpacka M ((2019) ) Targeted metabolomic analysis of nitric oxide/L-arginine pathway metabolites in dementia: Association with pathology, severity, and structural brain changes. Sci Rep 9: , 13764. |
[34] | Katusic ZS , Austin SA ((2014) ) Endothelial nitric oxide: Protector of a healthy mind. Eur Heart J 35: , 888–894. |
[35] | Razny U , Kiec-Wilk B , Wator L , Polus A , Dyduch G , Solnica B , Malecki M , Tomaszewska R , Cooke JP , Dembinska-Kiec A ((2011) ) Increased nitric oxide availability attenuates high fat diet metabolic alterations and gene expression associated with insulin resistance. Cardiovasc Diabetol 10: , 68. |
[36] | Kavanagh K , Day SM , Pait MC , Mortiz WR , Newgard CB , Ilkayeva O , McClain DA , Macauley SL ((2019) ) Type-2-diabetes alters CSF but not plasma metabolomic and AD risk profiles in vervet monkeys. Front Neurosci 13: , 843. |


