
Segmented Linear Mixed Model Analysis Reveals Association of the APOEɛ4 Allele with Faster Rate of Alzheimer’s Disease Dementia Progression
Abstract
Background:
APOE ɛ4 allele carriers present with an increased risk for late-onset Alzheimer’s disease (AD), show cognitive symptoms at an earlier age, and are more likely to transition from mild cognitive impairment (MCI) to dementia but despite this, it remains unclear whether or not the ɛ4 allele controls the rate of disease progression.
Objective:
To determine the effects of the ɛ4 allele on rates of cognitive decline and brain atrophy during MCI and dementia stages of AD.
Methods:
A segmented linear mixed model was chosen for longitudinal modeling of cognitive and brain volumetric data of 73 ɛ3/ɛ3, 99 ɛ3/ɛ4, and 39 ɛ4/ɛ4 Alzheimer’s Disease Neuroimaging Initiative participants who transitioned during the study from MCI to AD dementia.
Results:
ɛ4 carriers showed faster decline on MMSE, ADAS-11, CDR-SB, and MoCA scales, with the last two measures showing significant ɛ4 allele-dose effects after dementia transition but not during MCI. The ɛ4 effect was more prevalent in younger participants and in females. ɛ4 carriers also demonstrated faster rates of atrophy of the whole brain, the hippocampus, the entorhinal cortex, the middle temporal gyrus, and expansion of the ventricles after transitioning to dementia but not during MCI.
Conclusion:
Possession of the ɛ4 allele is associated with a faster progression of dementia due to AD. Our observations support the notion that APOE genotype not only controls AD risk but also differentially regulates mechanisms of neurodegeneration underlying disease advancement. Furthermore, our findings carry significance for AD clinical trial design.
INTRODUCTION
Alzheimer’s disease (AD) is the most prevalent form of dementia. Its early pathogenesis is linked to the accumulation of amyloid-β (Aβ) in the brain, which gives rise to neurofibrillary pathology producing neuronal and synaptic loss [1]. The burden of neurofibrillary lesions correlates with brain atrophy, disease staging, and the intensity of clinical symptoms [2, 3]. Infrequent, early-onset AD is associated with 100% penetrant, autosomal dominant mutations in genes encoding presenilin 1 and 2, or the amyloid-β protein precursor. These mutations result in either total Aβ overproduction or a shift in the Aβ40:Aβ42 ratio, with the latter Aβ species being particularly prone to self-aggregation and toxicity [4]. Far more prevalent late-onset AD is a sporadic disease, where odds ratio (OR) is largely controlled by the APOE genotype [5]. There are six APOE genotypes with unequal distribution in the general population: ɛ3/ɛ3 (59%), ɛ3/ɛ4 (24%), ɛ3/ɛ2 (12%), ɛ4/ɛ2 (2.5%), ɛ4/ɛ4 (2.0%), and ɛ2/ɛ2 (0.5%) [6, 7]. AD risk is increased by ∼3-fold among a single ɛ4 allele carriers, and by ∼15-fold in ɛ4/ɛ4 homozygotes compared to ɛ3/ɛ3 homozygotes [7]. The least common ɛ2 allele reduces the AD OR but only among ɛ4 non-carriers. The association between the ɛ4 allele and increased AD risk has been explained mainly through greater propensity of ɛ4 carriers to develop Aβ pathology [2]. Encoded by the ɛ4 allele, the apolipoprotein E4 isoform adversely affects the clearance of soluble Aβ peptides from the brain [8] and more effectively catalyzes assembly of Aβ peptides into oligomeric and fibrillar aggregates [9, 10], eventually promoting Aβ deposition and toxicity disproportionally to other isoforms. There also is evidence for a greater susceptibly of ɛ4 carriers to the loss of the blood-brain barrier integrity during aging [11], which compromises the Aβ brain to plasma clearance [12]. Despite viewing the ɛ4 allele as the main factor that controls disease risk, it remains unclear whether it is independently involved in the propagation of AD pathogenesis downstream to Aβ accumulation and therefore linked to an accelerated form of the disease. This hypothesis has been explored without satisfactory resolution. Prevailing numbers of previous studies utilizing both longitudinal and cross-sectional designs found that among individuals with AD dementia, ɛ4 carriers neither show faster rate of cognitive decline nor significantly lower cognitive scores compared to non-carriers [2, 13–21]. There are few analyses that in fact suggest accelerated tempo of cognitive decline among ɛ4 carriers [22–24], but those that do are at odds with studies proposing a more indolent disease course in ɛ4 individuals [25–28].
Mild cognitive impairment (MCI) is a clinical syndrome, which presents with an increased individual risk for AD dementia. Although possession of the ɛ4 allele has been recognized as a risk factor for the transition from MCI to dementia [29–33], there are no studies that have investigated how the ɛ4 allele affects the rate of progression of cognitive metrics during MCI. Since AD modifying therapeutics are now being widely tested in MCI subjects with underlying AD pathology, identifying this relationship bears clear significance for clinical trial design [34, 35].
There are multiple methodological reasons why previous exploits have failed to clarify the association between the ɛ4 allele and the clinical course of AD. This includes lacking precise control for dementia onset and duration, limited accuracy of clinically based AD diagnosis, cross-sectional design, limited periods of longitudinal follow up, and not considering variabilities in the individual trajectories of cognitive decline that may obfuscate the group effect specific to a given APOE genotype. Therefore, in this study we decided to interrogate the Alzheimer’s Disease Neuroimaging Initiative (ADNI) database, which includes longitudinal cognitive and volumetric brain data from over 1,000 individuals with MCI, AD dementia, and normal age-matched controls [36, 37]. We only analyzed data from participants who during ADNI transitioned from MCI to dementia and were given AD diagnosis, and who did not revert the diagnosis to MCI or normal at any point. There was a three-fold justification for this prerequisite: firstly, it increases the validity of clinically based AD diagnoses, secondly it allows us to precisely control for dementia onset, and thirdly it permits separate comparisons between MCI and AD dementia stages, which may differ in the rate of cognitive decline and brain atrophy. All comparisons were made across ɛ3/ɛ3, ɛ3/ɛ4, and ɛ4/ɛ4 genotypes as the prevalence of the ɛ2 allele among MCI to AD converters in the ADNI cohort was limited, hence its potentially protective effect could not be properly ascertained [38]. Multilevel statistical modeling of longitudinal data was used as both cognitive and brain volumetric measures were assumed to vary at individual and group levels.
MATERIALS AND METHODS
ADNI participant selection
To date the ADNI has included four successive studies: ADNI-1 (October 2004-August 2009), ADNI-GO (September 2009-August 2011), ADNI-2 (September 2011-August 2016), and ADNI-3 (September 2016-ongoing) [36, 37]. ADNI emphasizes rollover of participant between the studies with additional recruitment goals separately set for each study. Complete information regarding the ADNI inclusion and exclusion criteria can be accessed at: https://adni.loni.usc.edu/methods/documents/ while the information about type of data collected, data collection schedule, and methodology of collection is available at: http://adni.loni.usc.edu/data-samples/clinical-data/. Data analyzed in this study were retrieved from the ADNI database on September 3, 2020. The following selection criteria for participants were used: 1) at least three consecutive ADNI evaluations during, which participants received diagnosis of AD; 2) transition from MCI to AD dementia during ADNI; and 3) no reversion of the diagnosis from AD dementia to MCI or cognitively normal at any point. 223 participants from ADNI-1, ADNI-GO, and ADNI-2 were identified using these criteria. There were 73 ɛ3/ɛ3 homozygotes, 99 ɛ3/ɛ4 heterozygotes, and 39 ɛ4/ɛ4 homozygotes (total = 211) (Table 1). The remaining 12 participants who transitioned from MCI to AD dementia were either of ɛ2/ɛ3 or ɛ2/ɛ4 genotype and were excluded because the low incidence of the ɛ2 allele precluded a reliable analysis of its possible protective effect [24, 38]. All ADNI studies were approved by the Institutional Review Boards of all of the participating institutions. Informed written consent was obtained from all participants at each site.
Table 1
Demographic and clinical data by APOE genotype in analyzed ADNI participants
| Parameter | All (n = 211) | ɛ3/ɛ3 (n = 73) | ɛ3/ɛ4 (n = 99) | ɛ4/ɛ4 (n = 39) |
| Years followed | 5.58 (2.74) | 5.68 (2.87) | 5.51 (2.67) | 5.58 (2.71) |
| Number of visits | 11.20 (5.47) | 11.37 (5.74) | 11.01 (5.34) | 11.15 (5.43) |
| Baseline age | 73.84 (6.99) | 75.63 (7.42)* | 73.25 (6.46) | 71.89 (6.66)* |
| Transition age | 76.07 (7.20) | 78.08 (8.25)* | 75.44 (6.13) | 73.88 (6.85)* |
| Years of education | 15.82 (2.77) | 16.14 (2.89) | 15.76 (2.63) | 15.41 (2.88) |
| % Male | 58.8% | 58.9% | 57.6% | 61.5% |
| % White | 95.7% | 95.9% | 94.9% | 97.4% |
| % Black | 2.4% | 1.4% | 3.0% | 2.6% |
| % Asian | 1.4% | 1.4% | 2.0% | 0% |
| % Hispanic/Latino | 3.3% | 5.5% | 2.0% | 2.6% |
Data are presented as mean values or total counts and standard deviation in parentheses or as a percentage. “Baseline age” denotes the age the participants were initially enrolled in the ADNI with MCI diagnosis while the “Transition age” is the age they transitioned from MCI to AD dementia. p < 0.0001 (one-way analysis of variance) for differences in the Baseline age and Transition age across the genotypes; *p<0.05 ɛ3/ɛ3 versus ɛ4/ɛ4 (Least Significant Difference post-hoc test).
Cognitive measures
In the ADNI, participants receive diagnostic and cognitive assessments during their baseline visit, 6 and 12 months after the baseline visit, and then annually. The effect of the ɛ4 allele on the rate of cognitive decline quantified by the following neuropsychological scales was analyzed: Mini-Mental State Examination (MMSE) (ranges from 0 to 30, decreased score indicating worse cognition) [39], Clinical Dementia Rating Scale Sum of Boxes (CDR-SB) (ranges from 0 to 18, increased score indicating worse cognition) [40], Alzheimer’s Disease Assessment Scale-Cognitive Subscale (ADAS-Cog a.k.a. ADAS-11) (ranges from 0 to 70, increased score indicating worse cognition) [41], and the Montreal Cognitive Assessment (MoCA) (ranges from 0 to 30, decreased scores indicating worse cognition) [42]. MoCA was administered only during the ADNI-2 study.
Brain volumetric measures
Longitudinal brain volumetric data from the selected participants were retrieved from the ADNI database. Each ADNI participant received a brain MRI scan yielding volumetric analysis along the same schedule as cognitive testing. To analyze the effect of the ɛ4 allele on the atrophy rate during MCI and AD, raw volumetric data were converted to percentages using the data set from the baseline visit MRI scan as 100%. In addition to the whole brain volume, longitudinal volumetric data of the hippocampus, the entorhinal cortex, the fusiform gyrus, the middle temporal gyrus, and the ventricles were subjected to multilevel statistical modeling.
Statistical analyses
All cross-sectional and longitudinal data were analyzed across the ɛ3/ɛ3, ɛ3/ɛ4, and ɛ4/ɛ4 genotypes. One-way analysis of variance (ANOVA) followed by Least Significant Difference (LSD) test were used to test between-group differences of clinical and demographic data presented in Table 1.
Locally estimated scatterplot smoothing (LOESS) regression, traced with 70% smoothing and uniform distribution as pre-set parameters, was used for nonparametric, graphical representation of time and the ɛ4 allele dependent trends in analyzed serial cognitive and volumetric measures. They also motivated the segmented linear mixed model (LMM) analysis [43] on the data taken before participants transitioned to AD dementia (i.e., when they carried an MCI diagnosis) and on the data taken on and after the transition to explicitly adjust for AD-dementia onset and account for the overall nonlinearity in time. All serial pre and post transition data sets were assessed for linearity (Supplementary Tables 1 and 2). The majority of volumetric and cognitive data sets revealed a linear relationship with time during each of the MCI and AD dementia segments, justifying the selection of LMM. Segmented LMM analysis exemplifies a multilevel modeling approach, and considers the data collected during repeated visits of each subject as a cluster allowing for comparison between rates of change even if subjects had different numbers of visits or were missing individual data points. Within each segment, the LMM also reduces non-random attrition bias and models random intercepts, and thus values of the dependent variable for each individual measure are predicted by the fixed effects including the intercept that varies across groups. A significant main effect of time in the LMM analysis would indicate that a given cognitive or volumetric measure changed significantly over time in all participants adjusted for demographics: sex, ADNI baseline visit age (for pre-transition analysis; MCI), transition age (for post-transition analysis; AD), and years of education. A significant main effect of the ɛ4 allele would indicate that a baseline data set for a given measure varied significantly across ɛ3/ɛ3, ɛ3/ɛ4, and ɛ4/ɛ4 genotypes. The baseline data sets used for the pre-transition analysis were the data collected during the ADNI baseline visit, while the baseline data sets used for post-transition analysis were the data collected during the visit when a participant was diagnosed with AD dementia. A significant interaction between time and the ɛ4 allele would indicate that the rate of cognitive decline or brain atrophy varied as a function of the ɛ4 allele. This interaction would determine not only the overall magnitude of an ɛ4 effect but also the allele-specific dose dependency pattern by directly comparing ɛ3/ɛ4 and ɛ4/ɛ4 genotypes. Additionally, stratified LMM analyses of cognitive measures were conducted on data collected after AD transition by stratifying the participants by median age of the transition (<76.1 years versus≥76.1 years), sex, education (<16 years versus≥16 years), and the ADNI study they were originally enrolled (ADNI-1 versus ADNI-GO/2). Race and ethnicity were excluded from the stratified analysis because of the low number of non-Whites (n < 10). These stratified LMM analyses tested interactions between the main effect of time and ɛ4 allele separately for ɛ3/ɛ4 and ɛ4/ɛ4 genotypes with ɛ3/ɛ3 as the reference group. For each LMM analysis the p value and the regression coefficient (β)±standard error (SE) were calculated.
A multiple linear regression model was used to compute yearly rates of change for all analyzed cognitive and volumetric measures in each genotype. Parameter estimates from LMM analysis were used as the dependent regression variables and time as the independent variable. Separate analyses were performed for all measures pre and post transition to AD dementia.
All statistical analyses were performed using IBM® SPSS® Statistics 25 (IBM Corp., Armonk, NY).
RESULTS
Descriptive statistics
Participants included in our analysis were in ADNI for an average of 5.6 ± 2.7 years (mean±standard deviation) during which they had an average of 11±5 visits (Table 1). 58.8% were males, 95.7% were whites and the average length of education was 15.8±2.8 years. ANOVA analysis revealed no significant differences in the length of follow up, years of education, and sex and ethnic composition across ɛ3/ɛ3, ɛ3/ɛ4, and ɛ4/ɛ4 genotype groups. However, statistically significant differences were found in respect to the baseline visit age (F = 46.42, p = 0.000, df = 2, mean square = 2176.37) and the age of MCI to AD dementia transition (F = 76.62, p = 0.000, df = 2, mean square = 3913.97). In the ɛ3/ɛ3 group the baseline visit age and the transition age were on average 75.6 years (±7.4 years) and 78.1 years (±8.3 years), respectively; while in the ɛ4/ɛ4 group they were 71.9 years (±6.7 years) (p < 0.05; LSD post-hoc test versus ɛ3/ɛ3) and 73.9 years (±6.9 years) (p < 0.05), respectively. In the ɛ3/ɛ4 group the baseline visit age and the transition age were 73.3 years (±6.5 years) and 75.4 years (±6.1 years), respectively; and although they fell between the values for ɛ3/ɛ3 and ɛ4/ɛ4 groups, they did not demonstrate statistically significant differences in the post-hoc analysis.
APOE ɛ4 shows allele-dose effect on the rate of cognitive decline in AD dementia
From inspection of the LOESS regression and the graphical representation of data in Figs. 1 and 2, it appears that decline in both serial cognitive and volumetric measures is progressive and shows ɛ4 allele-dependent trends. The nonparametric LOESS curves also indicated piecewise linear patterns pre- and post-AD transition for each of the analyzed APOE genotype, which was further confirmed by piecewise linearity analysis. These initial observations provided us with motivation and rationale to conduct segmented LMM analysis. All LMM modeled cognitive measures evidenced progressive decline pre- and post-AD dementia transition (statistically significant main effect of time), with the exception of pre-transition MoCA scores (Table 2, Fig. 1). There was no significant main effect of the ɛ4 allele on the baseline data sets for either pre- or post-transition analyses. Segmented LMM analysis showed no statistically significant interaction between main effects of time and ɛ4 allele for any cognitive measure before transition to AD dementia, i.e., during the MCI stage (Table 2). In stark contrast, post-transition analyses revealed a robust effect of the ɛ4 allele on the rate of cognitive decline. Highly significant interactions between main effects of time and ɛ4 allele were noted for all cognitive measures: MMSE (ɛ3/ɛ3 versus ɛ3/ɛ4 p = 0.000; ɛ3/ɛ3 versus ɛ4/ɛ4 p = 0.000), CDR-SB (ɛ3/ɛ3 versus ɛ4/ɛ4 p = 0.000; ɛ3/ɛ4 versus ɛ4/ɛ4 p = 0.000), ADAS-11 (ɛ3/ɛ3 versus ɛ4/ɛ4 p = 0.000; ɛ3/ɛ4 versus ɛ4/ɛ4 p = 0.000), and MoCA (ɛ3/ɛ3 versus ɛ4/ɛ4 p = 0.000; ɛ3/ɛ4 versus ɛ4/ɛ4 p = 0.000). A significant ɛ4 allele-dose effect was appreciated for CDR-SB (ɛ3/ɛ4 versus ɛ4/ɛ4 p = 0.001) and MoCA (ɛ3/ɛ4 versus ɛ4/ɛ4 p = 0.008). The yearly decline rate in MMSE scores as computed from a segmented multiple linear regression model was 2.5 and 2.9-fold higher in ɛ3/ɛ4 and ɛ4/ɛ4 participants than that in ɛ3/ɛ3 participants, respectively (Table 3). The yearly increase in CDR-SB scores was 2.6 and 3.0-fold higher in ɛ3/ɛ4 and ɛ4/ɛ4 participants than that in ɛ3/ɛ3 participants, respectively; while the increase in ADAS-11 scores was 2.6-fold higher for both comparisons. Finally, the yearly rate of decline in MoCA scores was 2.0 and 3.0 times higher in participants with ɛ3/ɛ4 and ɛ4/ɛ4 genotypes than in participants with ɛ3/ɛ3 genotype, respectively.
Fig. 1
The effect of the APOE genotype on decline in cognitive measures before and after transition to AD dementia. Shown are individual data points and locally estimated scatterplot smoothing (LOESS) regression with 70% smoothing and uniform distribution for the following cognitive measures: Mini-Mental State Examination (MMSE) (A), Clinical Dementia Rating Sum of Boxes (CDR-SB) (B), Alzheimer’s Disease Assessment Scale-Cognitive Subscale (ADAS-11) (C), and Montreal Cognitive Assessment (MoCA) (D). Negative and positive values on the abscissa depict number of years before and after transition from MCI to AD dementia.
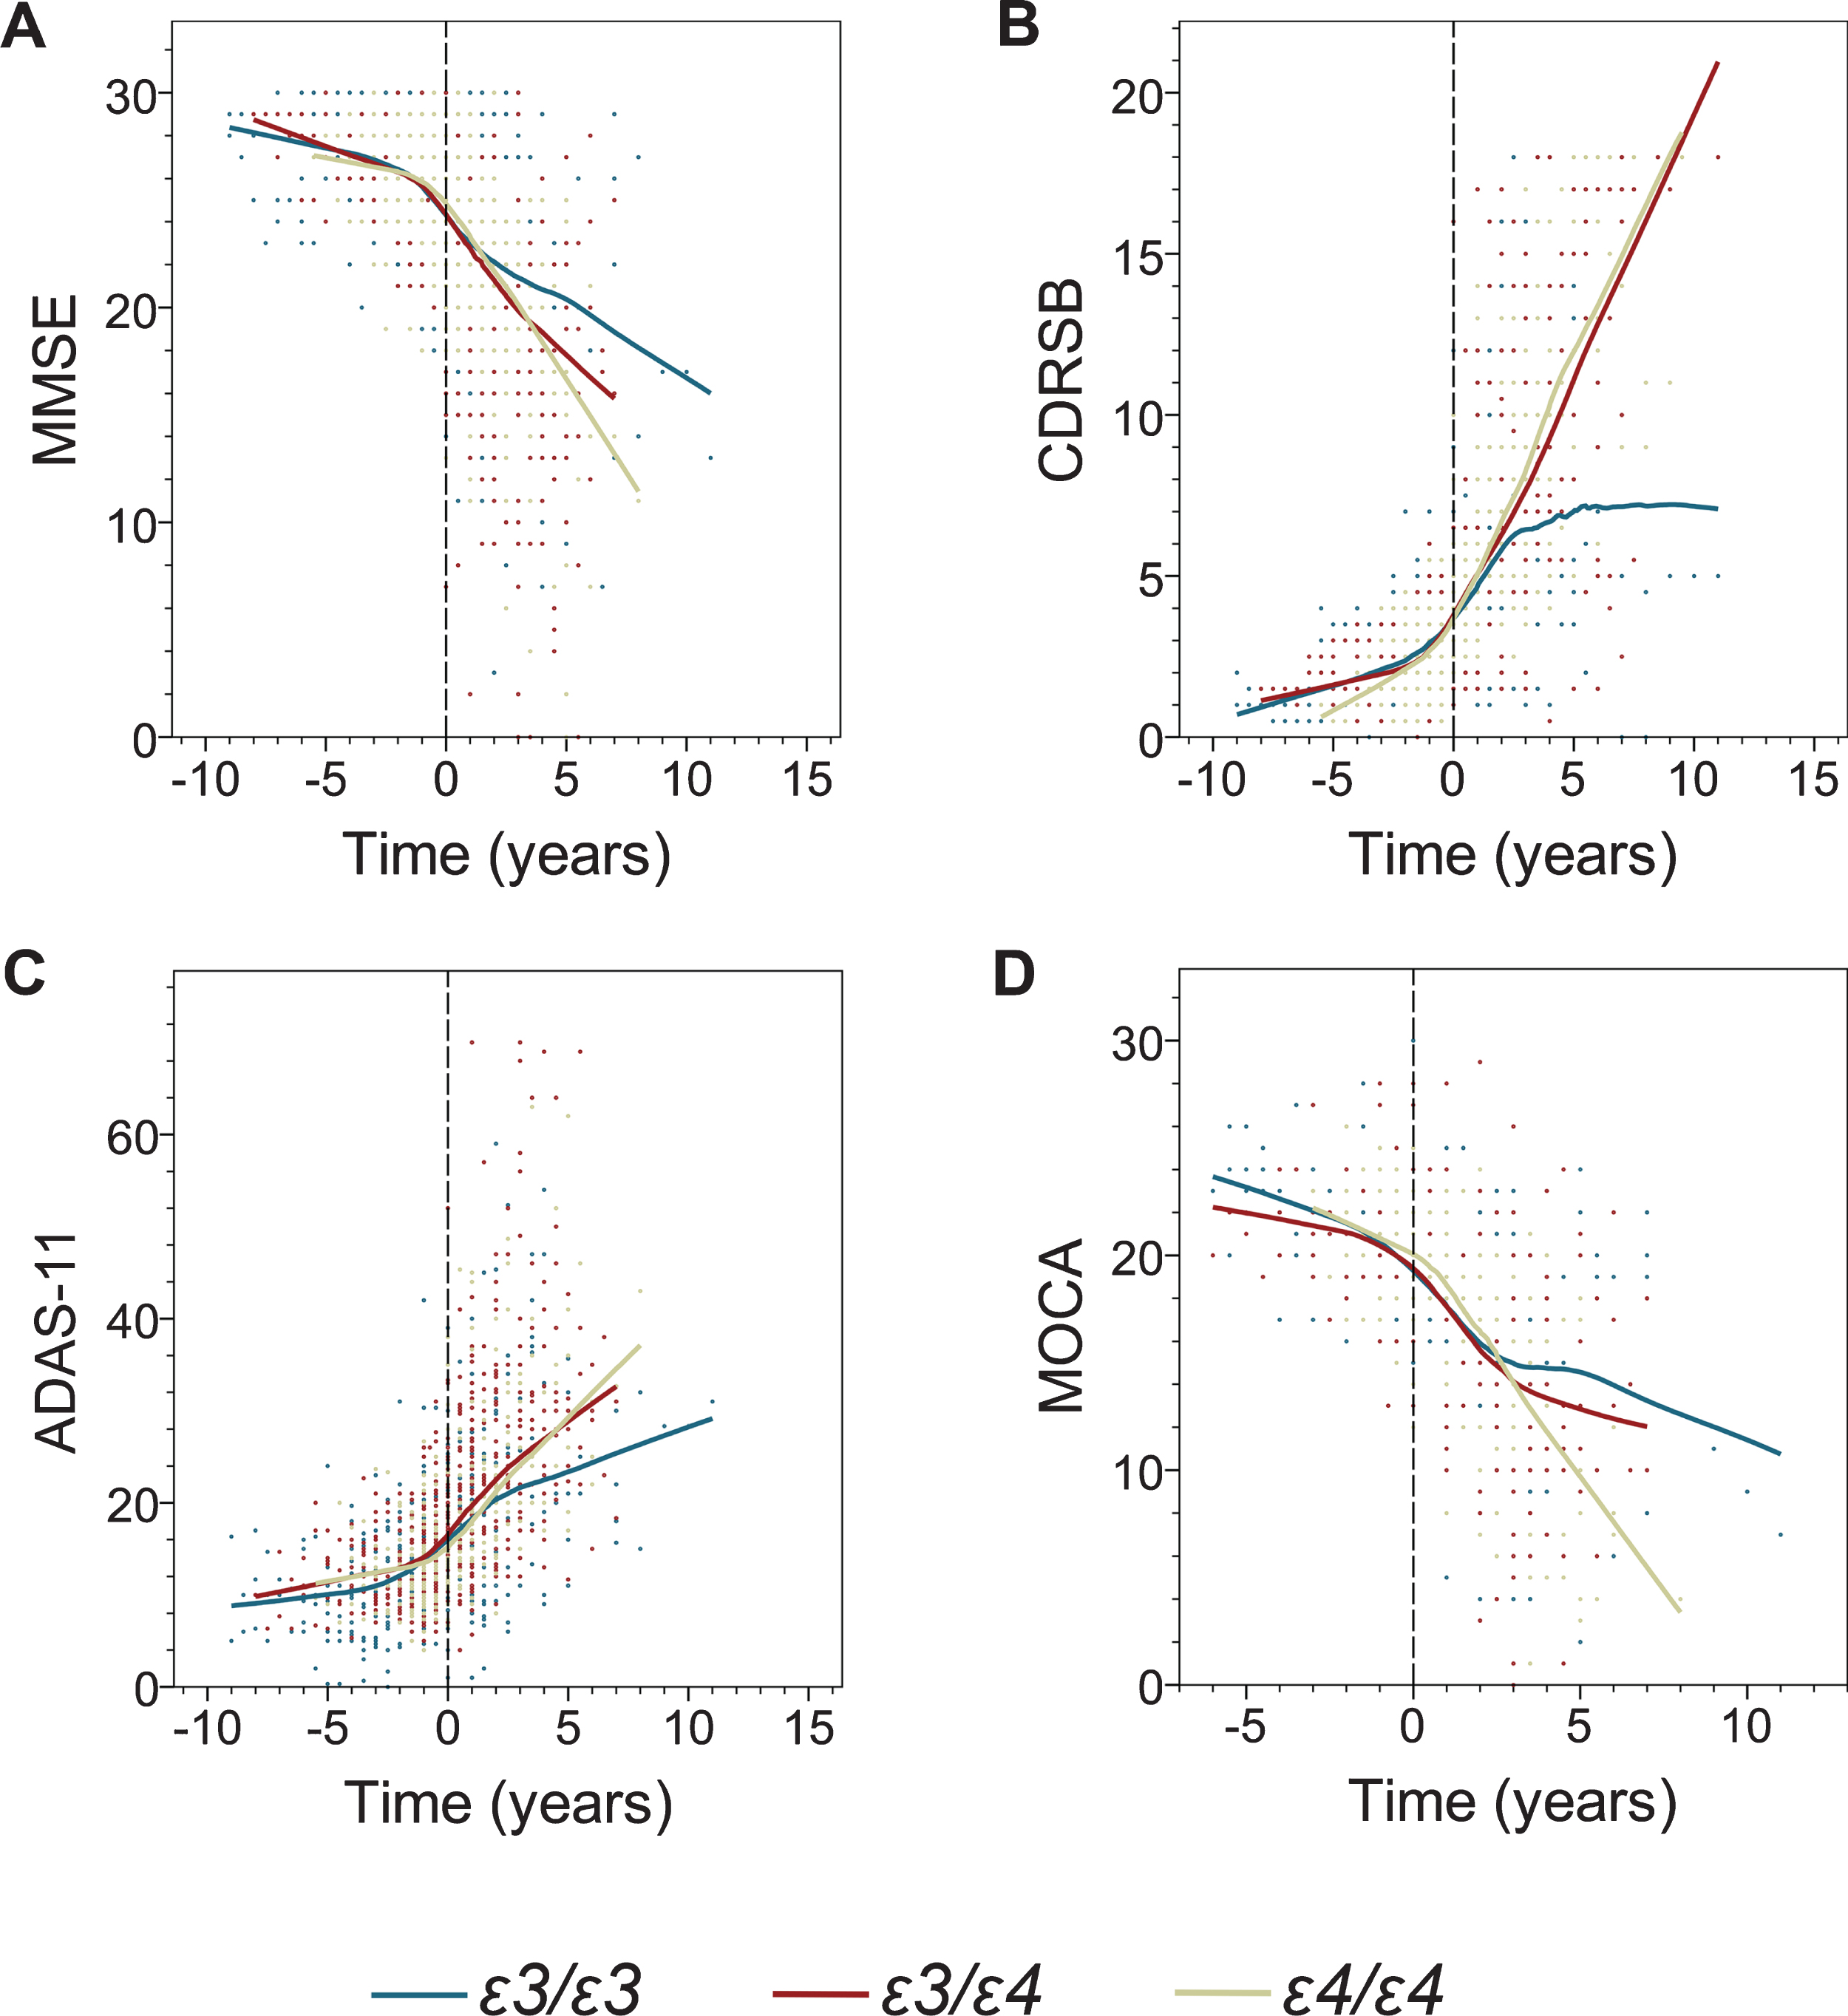
Fig. 2
The effect of the APOE genotype on brain volumetric measures before and after transition to AD dementia. Shown are individual data points and locally estimated scatterplot smoothing (LOESS) regression with 70% smoothing and uniform distribution for the following volumetric measures: the whole brain (A), the ventricular system (B), the hippocampus (C), the entorhinal cortex (D), the middle temporal gyrus (E), and the fusiform gyrus (F). Negative and positive values on the abscissa depict number of years before and after transition from MCI to AD dementia. Values on the ordinate represent percent of the baseline volume calculated at the initial ADNI enrolment visit.
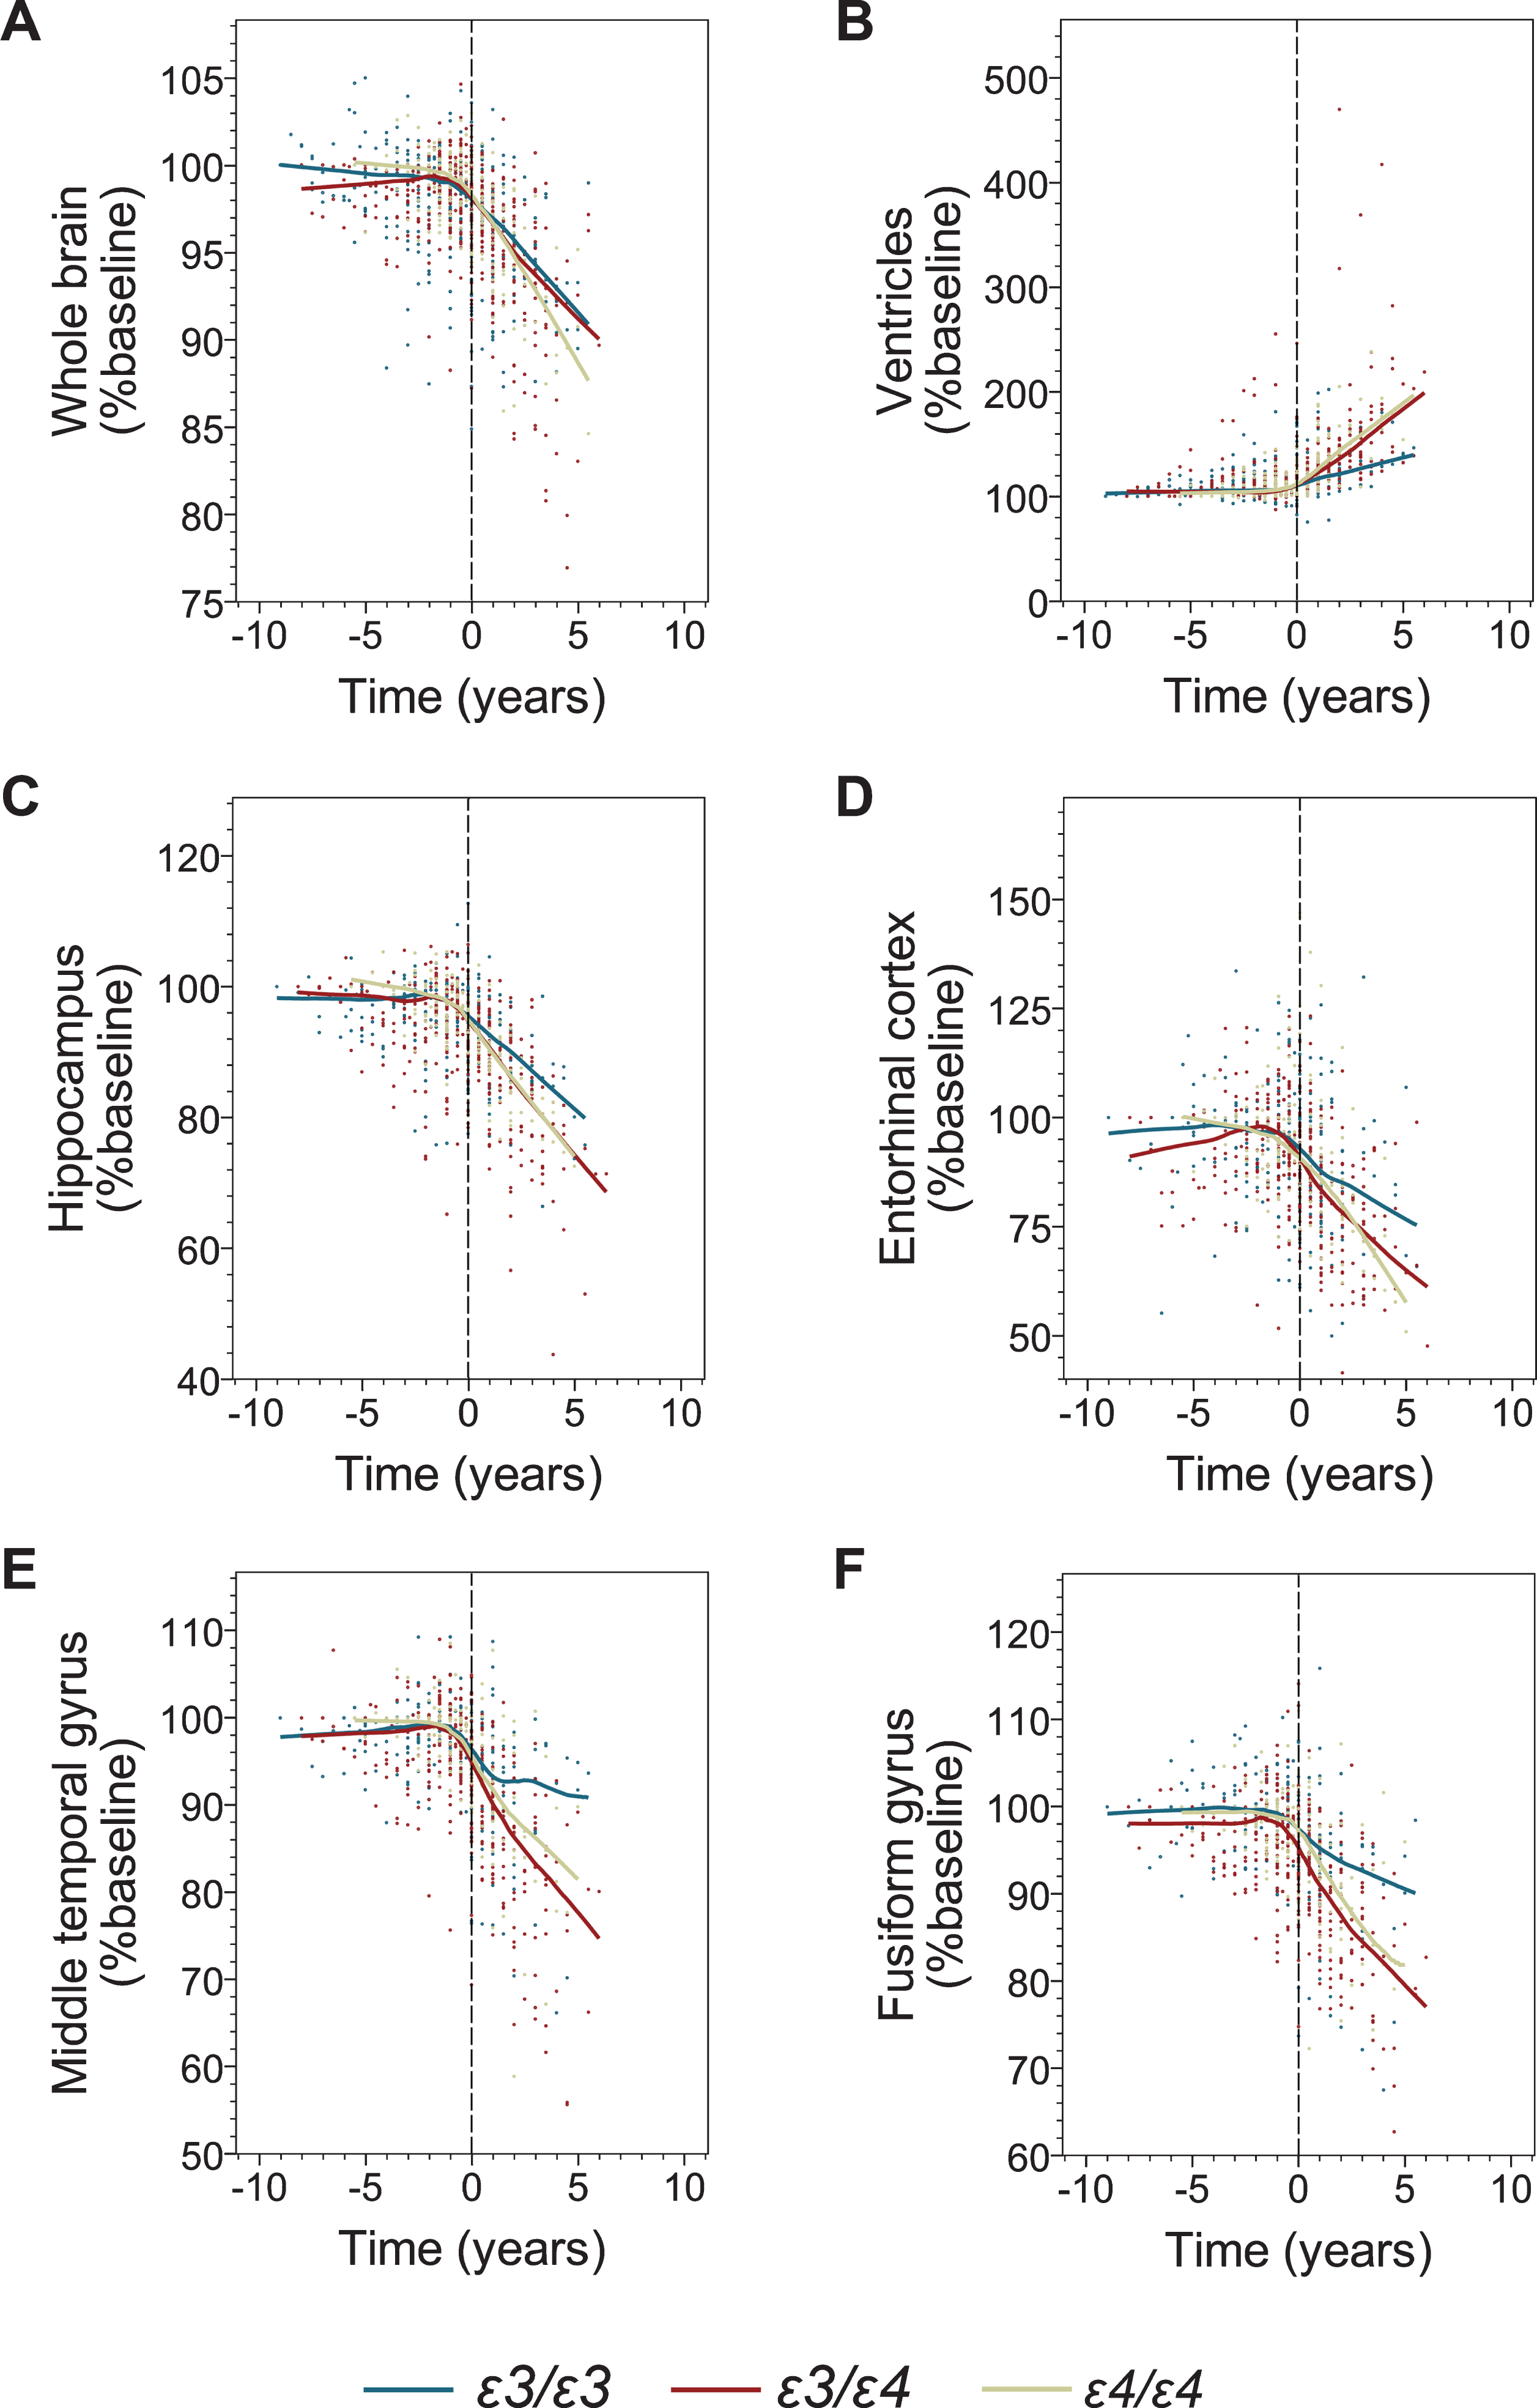
Table 2
Segmented linear mixed models examining the predictive value of the ɛ4 allele for the yearly rate of cognitive decline in ADNI participants before and after transition from MCI to AD dementia (adjusted for time and demographics: sex, age at baseline, and years of education)
| MCI | AD dementia | ||||
| Cognitive Measure | Factor | β (SE) | p | β (SE) | p |
| MMSE | Time (y) | –0.454 (0.193) | 0.019 | –2.021 (0.009) | 0.000 |
| ɛ3/ɛ4 versus ɛ3/ɛ3 | –0.244 (0.331) | 0.461 | –0.079 (0.658) | 0.904 | |
| ɛ4/ɛ4 versus ɛ3/ɛ3 | –0.178 (0.462) | 0.701 | –1.253 (0.850) | 0.142 | |
| ɛ4/ɛ4 versus ɛ3/ɛ4 | –0.066 (0.447) | 0.882 | –1.174 (0.798) | 0.142 | |
| ɛ3/ɛ4 versus ɛ3/ɛ3 x Time | –0.192 (0.115) | 0.093 | –0.914 (0.165) | 0.000 | |
| ɛ4/ɛ4 versus ɛ3/ɛ3 x Time | –0.140 (0.204) | 0.493 | –1.222 (0.203) | 0.000 | |
| ɛ4/ɛ4 versus ɛ3/ɛ4 x Time | –0.052 (0.214) | 0.807 | –0.309 (0.193) | 0.111 | |
| CDR-SB | Time (y) | 0.466 (0.095) | 0.000 | 1.676 (0.089) | 0.000 |
| ɛ3/ɛ4 versus ɛ3/ɛ3 | 0.075 (0.174) | 0.668 | 0.366 (0.407) | 0.370 | |
| ɛ4/ɛ4 versus ɛ3/ɛ3 | 0.035 (0.241) | 0.884 | 0.562 (0.524) | 0.285 | |
| ɛ4/ɛ4 versus ɛ3/ɛ4 | –0.040 (0.232) | 0.864 | 0.196 (0.490) | 0.690 | |
| ɛ3/ɛ4 versus ɛ3/ɛ3 x Time | –0.044 (0.056) | 0.428 | 0.633 (0.099) | 0.000 | |
| ɛ4/ɛ4 versus ɛ3/ɛ3 x Time | –0.167 (0.100) | 0.095 | 0.914 (0.119) | 0.000 | |
| ɛ4/ɛ4 versus ɛ3/ɛ4 x Time | –0.123 (0.105) | 0.243 | 0.281 (0.107) | 0.009 | |
| ADAS-11 | Time (y) | 0.924 (0.422) | 0.029 | –4.053 (0.321) | 0.000 |
| ɛ3/ɛ4 versus ɛ3/ɛ3 | –1.351 (0.763) | 0.078 | –0.248 (1.373) | 0.857 | |
| ɛ4/ɛ4 versus ɛ3/ɛ3 | 0.924 (1.058) | 0.390 | –1.301 (1.773) | 0.464 | |
| ɛ4/ɛ4 versus ɛ3/ɛ4 | 0.441 (1.022) | 0.666 | –1.053 (1.664) | 0.527 | |
| ɛ3/ɛ4 versus ɛ3/ɛ3 x Time | –0.432 (0.248) | 0.082 | 2.159 (0.325) | 0.000 | |
| ɛ4/ɛ4 versus ɛ3/ɛ3 x Time | –0.247 (0.445) | 0.579 | 2.408 (0.404) | 0.000 | |
| ɛ4/ɛ4 versus ɛ3/ɛ4 x Time | 0.184 (0.468) | 0.694 | 0.249 (0.385) | 0.518 | |
| MoCA | Time (y) | –0.708 (0.677) | 0.298 | –2.432 (0.233) | 0.000 |
| ɛ3/ɛ4 versus ɛ3/ɛ3 | –0.476 (0.862) | 0.582 | –0.483 (1.030) | 0.639 | |
| ɛ4/ɛ4 versus ɛ3/ɛ3 | 0.273 (1.199) | 0.821 | –2.153 (1.289) | 0.097 | |
| ɛ4/ɛ4 versus ɛ3/ɛ4 | –0.204 (1.148) | 0.859 | –1.669 (1.230) | 0.176 | |
| ɛ3/ɛ4 versus ɛ3/ɛ3 x Time | –0.157 (0.308) | 0.611 | –0.844 (0.234) | 0.000 | |
| ɛ4/ɛ4 versus ɛ3/ɛ3 x Time | 0.412 (0.702) | 0.559 | –1.543 (0.288) | 0.000 | |
| ɛ4/ɛ4 versus ɛ3/ɛ4 x Time | 0.255 (0.717) | 0.723 | –0.699 (0.283) | 0.014 | |
(SE), standard error. MoCA scores were available only for 136 participants.
Table 3
Rates of yearly cognitive decline per APOE genotype before and after transition from MCI to AD dementia. Values are derived from a segmented multiple linear regression model and represent an average change in a given cognitive measure per year
| Cognitive Measure | MCI | AD dementia | ||||
| ɛ3/ɛ3 | ɛ3/ɛ4 | ɛ4/ɛ4 | ɛ3/ɛ3 | ɛ3/ɛ4 | ɛ4/ɛ4 | |
| MMSE | –0.268 (0.042) | –0.342 (0.043) | –0.147 (0.110) | –0.656 (0.084) | –1.636 (0.074) | –1.899 (0.092) |
| CDR-SB | +0.236 (0.021) | +0.192 (0.025) | +0.315 (0.059) | +0.493 (0.053) | +1.301 (0.043) | +1.464 (0.059) |
| ADAS-11 | +0.713 (0.096) | +0.625 (0.105) | +0.624 (0.255) | +1.333 (0.178) | +3.467 (0.163) | +3.420 (0.211) |
| MoCA | –0.271 (0.067) | –0.139 (0.084) | –0.405 (0.409) | –0.755 (0.126) | –1.523 (0.095) | –2.274 (0.117) |
Values in parentheses indicate standard error.
Demographically stratified analysis suggests that APOE ɛ4 allele effect is more prevalent in younger and in female participants
Demographically stratified analyses were conducted on cognitive data taken after transition from MCI to AD dementia. Table 4 details the interaction between main effect of time and ɛ4 allele (separately for ɛ3/ɛ4 heterozygotes and ɛ4/ɛ4 homozygotes) in participants stratified by age, sex, education level, and the ADNI study they originally enrolled. For age stratification we arbitrarily used the average transition age of the entire analyzed cohort, to separate younger and older participants. For participants who were younger than 76.1 years at the transition to AD dementia there was a strong significant interaction between time and both ɛ3/ɛ4 and ɛ4/ɛ4 genotypes for all analyzed cognitive measures. In contrast, in participants who were older than 76.1 years at the age of dementia transition, no significant interaction between the main effects for any of cognitive measures was observed. Also, a strongly significant main effect interaction for all analyzed cognitive measures was detected in female ɛ3/ɛ4 and ɛ4/ɛ4 participants, while in male participants the significant interaction between time and both ɛ3/ɛ4 and ɛ4/ɛ4 genotypes was seen only for MMSE. In males, there also was a significant interaction between time and the ɛ3/ɛ4 genotype for ADAS-11 and between time and the ɛ4/ɛ4 genotype for CDR-SB and MoCA. Stratification by the number of years of education showed no fundamental differences in ɛ4 allele-associated effects. Both in participants with less than 16 years of education and those with 16 years or more, all analyzed cognitive measures showed a significant interaction between time and ɛ4 allele, except for the ɛ3/ɛ4 genotype on the MoCA scores in the latter group. The ɛ4 allele-associated effect were somewhat more prevalent among participants recruited during ADNI-1 than ADNI-GO/2 studies. In the former, a highly significant interaction between time and both ɛ3/ɛ4 and ɛ4/ɛ4 genotypes was appreciated for all cognitive measures, while in the latter it was not significant on the MMSE scores for the ɛ3/ɛ4 genotype and on the MoCA scores for both genotypes.
Table 4
Stratified linear mixed models examining the effect of a single and double ɛ4 allele for the rate of yearly cognitive decline after transition from MCI to AD dementia. For all comparisons the reference group was ɛ3/ɛ3
| MMSE | CDR-SB | ADAS-11 | MoCA | |||||||
| Stratification | n | β (SE) | p | β (SE) | p | β (SE) | p | β (SE) | p | |
| Age ≤76.1 y | 106 | ɛ3/ɛ4 | –0.914 (0.165) | 0.000 | 0.633 (0.099) | 0.000 | 2.159 (0.325) | 0.000 | –0.844 (0.234) | 0.002 |
| ɛ4/ɛ4 | –1.222 (0.203) | 0.000 | 0.914 (0.119) | 0.000 | 2.408 (0.404) | 0.000 | –1.543 (0.288) | 0.000 | ||
| Age > 76.1 y | 105 | ɛ3/ɛ4 | –0.150 (0.240) | 0.532 | 0.120 (0.140) | 0.391 | 0.640 (0.438) | 0.145 | –0.108 (0.329) | 0.745 |
| ɛ4/ɛ4 | 0.187 (0.365) | 0.608 | 0.272 (0.242) | 0.262 | 0.355 (0.646) | 0.583 | 0.035 (0.490) | 0.943 | ||
| Female | 87 | ɛ3/ɛ4 | –1.070 (0.241) | 0.000 | 0.972 (0.139) | 0.000 | 2.576 (0.441) | 0.000 | –1.191 (0.311) | 0.000 |
| ɛ4/ɛ4 | –2.306 (0.353) | 0.000 | 1.655 (0.223) | 0.000 | 5.121 (0.702) | 0.000 | –2.410 (0.478) | 0.000 | ||
| Male | 124 | ɛ3/ɛ4 | –0.757 (0.225) | 0.001 | 0.253 (0.141) | 0.073 | 1.684 (0.466) | 0.000 | –0.478 (0.349) | 0.173 |
| ɛ4/ɛ4 | –0.603 (0.249) | 0.016 | 0.496 (0.146) | 0.001 | 0.967 (0.514) | 0.061 | –0.961 (0.379) | 0.012 | ||
| < 16 y of | 76 | ɛ3/ɛ4 | –1.061 (0.225) | 0.000 | 0.849 (0.142) | 0.000 | 2.718 (0.423) | 0.000 | –0.719 (0.329) | 0.031 |
| education | ɛ4/ɛ4 | –1.211 (0.298) | 0.000 | 1.228 (0.186) | 0.000 | 3.222 (0.565) | 0.000 | –1.154 (0.465) | 0.014 | |
| ≥16 y of | 135 | ɛ3/ɛ4 | –0.684 (0.240) | 0.005 | 0.318 (0.143) | 0.026 | 1.396 (0.473) | 0.003 | –0.675 (0.349) | 0.054 |
| education | ɛ4/ɛ4 | –1.088 (0.280) | 0.000 | 0.545 (0.160) | 0.001 | 1.450 (0.559) | 0.010 | –1.395 (0.392) | 0.000 | |
| ADNI-1 | 152 | ɛ3/ɛ4 | –0.982 (0.180) | 0.000 | 0.688 (0.108) | 0.000 | 2.287 (0.360) | 0.000 | –1.414 (0.327) | 0.000 |
| ɛ4/ɛ4 | –0.191 (0.214) | 0.000 | 0.791 (0.128) | 0.000 | 2.324 (0.436) | 0.000 | –2.034 (0.358) | 0.000 | ||
| ADNI-GO/2 | 59 | ɛ3/ɛ4 | –0.741 (0.376) | 0.050 | 0.459 (0.228) | 0.046 | 1.841 (0.732) | 0.013 | –0.134 (0.355) | 0.708 |
| ɛ4/ɛ4 | –1.366 (0.513) | 0.008 | 1.427 (0.286) | 0.000 | 2.832 (1.014) | 0.006 | –0.777 (0.482) | 0.109 | ||
(SE), standard error; y, years.
APOE ɛ4 allele is associated with higher rates of brain atrophy after transition to AD dementia
Modeling of longitudinal volumetric data before transition to AD did not reveal a consistently significant atrophy pattern across the APOE genotypes. In contrast, modeling of the data collected on and after the AD transition showed a statistically significant main effect of time on the atrophy of all analyzed brain structures (Fig. 2, Table 5), while the main effect of the ɛ4 allele on the baseline data set for the post-transition analysis was not significant. A significant interaction between main effects of time and ɛ4 allele indicating increased atrophy rates among ɛ4 carriers was detected for the serial volumetric data of the whole brain (ɛ3/ɛ3 versus ɛ3/ɛ4, p = 0.000; ɛ3/ɛ3 versus ɛ4/ɛ4, p = 0.001), the hippocampus (ɛ3/ɛ3 versus ɛ3/ɛ4, p = 0.000; ɛ3/ɛ3 versus ɛ4/ɛ4, p = 0.042), the middle temporal gyrus (ɛ3/ɛ3 versus ɛ3/ɛ4, p = 0.000; ɛ3/ɛ3 versus ɛ4/ɛ4, p = 0.027), and the ventricles (ɛ3/ɛ3 versus ɛ3/ɛ4, p = 0.000; ɛ3/ɛ3 versus ɛ4/ɛ4, p = 0.000) (Table 5). The yearly rate of whole brain atrophy determined from the multiple regression model was 1.8-fold greater among ɛ3/ɛ4 participants and 1.9-fold greater among ɛ4/ɛ4 participants compared to ɛ3/ɛ3 participants (Table 6). Atrophy rates of the hippocampus were 1.7-fold and 1.5-fold greater in ɛ3/ɛ4 and ɛ4/ɛ4 participants than in ɛ3/ɛ3 participants, respectively. For the middle temporal gyrus, the yearly atrophy rate was increased 3.1-fold in ɛ3/ɛ4 participants and 2.3-fold in ɛ4/ɛ4 participants compared to ɛ3/ɛ3 participants, while the yearly rate of the ventricular system expansion was 2.4-fold greater in ɛ3/ɛ4 participant and 2.3-fold greater in ɛ4/ɛ4 participants than in ɛ3/ɛ3 participants. There was no significant interaction between the main effect of time and the number of ɛ4 allele copies indicating no added effects of the second ɛ4 allele on the brain atrophy progression. The only analyzed brain structure where a significant interaction between main effects of time and ɛ4 allele was not detected was the fusiform gyrus.
Table 5
Segmented linear mixed models examining the predictive value of the ɛ4 allele for the yearly rate of change in brain volume in ADNI participants before and after their transition from MCI to AD dementia (adjusted for time and demographics: sex, age at baseline, and years of education)
| Volumetric measure | MCI | AD dementia | |||
| Factor | β (SE) | p | β (SE) | p | |
| Whole Brain | Time (y) | –0.565 (0.198) | 0.004 | –1.869 (0.170) | 0.000 |
| ɛ3/ɛ4 versus ɛ3/ɛ3 | 0.664 (0.351) | 0.060 | 0.779 (0.517) | 0.133 | |
| ɛ4/ɛ4 versus ɛ3/ɛ3 | –1.307 (0.485) | 0.007 | –1.127 (0.662) | 0.090 | |
| ɛ4/ɛ4 versus ɛ3/ɛ4 | –0.643 (0.467) | 0.170 | –0.348 (0.607) | 0.566 | |
| ɛ3/ɛ4 versus ɛ3/ɛ3 x Time | 0.062 (0.119) | 0.604 | –0.650 (0.177) | 0.000 | |
| ɛ4/ɛ4 versus ɛ3/ɛ3 x Time | –0.248 (0.211) | 0.240 | –0.711 (0.222) | 0.001 | |
| ɛ4/ɛ4 versus ɛ3/ɛ4 x Time | –0.186 (0.220) | 0.399 | 0.062 (0.200) | 0.758 | |
| Hippocampus | Time (y) | –2.549 (0.504) | 0.000 | –3.783 (0.357) | 0.000 |
| ɛ3/ɛ4 versus ɛ3/ɛ3 | –1.184 (1.122) | 0.293 | –1.294 (1.270) | 0.309 | |
| ɛ4/ɛ4 versus ɛ3/ɛ3 | –1.351 (1.487) | 0.365 | 0.257 (1.598) | 0.872 | |
| ɛ4/ɛ4 versus ɛ3/ɛ4 | –2.535 (1.385) | 0.069 | –1.037 (1.420) | 0.466 | |
| ɛ3/ɛ4 versus ɛ3/ɛ3 x Time | –1.310 (0.310) | 0.000 | –1.529 (0.372) | 0.000 | |
| ɛ4/ɛ4 versus ɛ3/ɛ3 x Time | 0.224 (0.546) | 0.682 | –0.966 (0.472) | 0.042 | |
| ɛ4/ɛ4 versus ɛ3/ɛ4 x Time | –1.087 (0.554) | 0.050 | –0.563 (0.414) | 0.175 | |
| Fusiform Gyrus | Time (y) | –0.646 (0.425) | 0.129 | –2.815 (0.443) | 0.000 |
| ɛ3/ɛ4 versus ɛ3/ɛ3 | –2.743 (0.740) | 0.000 | –2.193 (1.263) | 0.084 | |
| ɛ4/ɛ4 versus ɛ3/ɛ3 | 1.031 (1.004) | 0.306 | –0.047 (1.645) | 0.977 | |
| ɛ4/ɛ4 versus ɛ3/ɛ4 | –1.713 (0.928) | 0.066 | –2.241 (1.445) | 0.123 | |
| ɛ3/ɛ4 versus ɛ3/ɛ3 x Time | –0.930 (0.279) | 0.001 | –1.178 (0.470) | 0.013 | |
| ɛ4/ɛ4 versus ɛ3/ɛ3 x Time | 0.416 (0.469) | 0.375 | –0.629 (0.587) | 0.285 | |
| ɛ4/ɛ4 versus ɛ3/ɛ4 x Time | –0.514 (0.469) | 0.274 | –0.549 (0.519) | 0.291 | |
| Entorhinal Cortex | Time (y) | –0.915 (1.118) | 0.413 | –5.163 (1.016) | 0.000 |
| ɛ3/ɛ4 versus ɛ3/ɛ3 | –1.226 (1.919) | 0.524 | –2.442 (2.655) | 0.359 | |
| ɛ4/ɛ4 versus ɛ3/ɛ3 | 0.278 (2.609) | 0.915 | –3.455 (3.448) | 0.318 | |
| ɛ4/ɛ4 versus ɛ3/ɛ4 | –0.948 (2.414) | 0.695 | –5.898 (3.034) | 0.053 | |
| ɛ3/ɛ4 versus ɛ3/ɛ3 x Time | –0.534 (.733) | 0.467 | –2.551 (1.074) | 0.018 | |
| ɛ4/ɛ4 versus ɛ3/ɛ3 x Time | 0.211 (1.233) | 0.865 | –3.079 (1.346) | 0.023 | |
| ɛ4/ɛ4 versus ɛ3/ɛ4 x Time | –0.324 (1.233) | 0.793 | –0.528 (1.188) | 0.657 | |
| Middle Temporal Gyrus | Time (y) | –0.671 (0.403) | 0.097 | –3.331 (0.431) | 0.000 |
| ɛ3/ɛ4 versus ɛ3/ɛ3 | –1.648 (0.700) | 0.019 | 0.358 (1.393) | 0.797 | |
| ɛ4/ɛ4 versus ɛ3/ɛ3 | –0.185 (0.950) | 0.846 | –2.239 (1.820) | 0.220 | |
| ɛ4/ɛ4 versus ɛ3/ɛ4 | –1.834 (0.879) | 0.038 | –1.881 (1.600) | 0.240 | |
| ɛ3/ɛ4 versus ɛ3/ɛ3 x Time | –0.934 (0.265) | 0.000 | –2.228 (0.459) | 0.000 | |
| ɛ4/ɛ4 versus ɛ3/ɛ3 x Time | 0.422 (0.445) | 0.343 | –1.269 (0.572) | 0.027 | |
| ɛ4/ɛ4 versus ɛ3/ɛ4 x Time | –0.512 (0.445) | 0.250 | –0.960 (0.506) | 0.059 | |
| Ventricles | Time (y) | 8.863 (1.090) | 0.000 | 13.276 (.985) | 0.000 |
| ɛ3/ɛ4 versus ɛ3/ɛ3 | 3.815 (2.791) | 0.173 | 2.826 (5.540) | 0.611 | |
| ɛ4/ɛ4 versus ɛ3/ɛ3 | 0.380 (3.693) | 0.918 | 4.945 (7.062) | 0.485 | |
| ɛ4/ɛ4 versus ɛ3/ɛ4 | 4.195 (3.520) | 0.234 | 2.119 (6.454) | 0.743 | |
| ɛ3/ɛ4 versus ɛ3/ɛ3 x Time | 5.024 (0.661) | 0.000 | 6.983 (1.064) | 0.000 | |
| ɛ4/ɛ4 versus ɛ3/ɛ3 x Time | 2.749 (1.156) | 0.018 | 5.470 (1.307) | 0.000 | |
| ɛ4/ɛ4 versus ɛ3/ɛ4 x Time | 2.275 (1.215) | 0.062 | 1.513 (1.169) | 0.196 | |
(SE), standard error.
Table 6
Rates of yearly volumetric changes in the entire cohort (All) and by APOE genotype before and after transition from MCI to AD dementia. Values are derived from a segmented multiple linear regression model and represent an average change in a given volumetric measure per year. Values in parentheses indicate standard error
| Volumetric Measure | MCI | AD dementia | |||||||
| All | ɛ3/ɛ3 | ɛ3/ɛ4 | ɛ4/ɛ4 | All | ɛ3/ɛ3 | ɛ3/ɛ4 | ɛ4/ɛ4 | ||
| Whole Brain | –0.083 (0.029) | –0.230 (0.045) | +0.067 (0.046) | –0.146 (0.067) | –1.643 (0.038) | –1.014 (0.068) | –1.865 (0.055) | –1.879 (.054) | |
| Hippocampus | –0.222 (0.101) | –0.245 (0.140) | –0.231 (0.184) | –0.715 (0.213) | –3.960 (0.094) | –2.706 (0.152) | –4.483 (0.135) | –4.052 (0.105) | |
| Fusiform Gyrus | –0.102 (0.049) | +0.048 (0.065) | –0.060 (0.079) | –0.433 (0.105) | –2.909 (0.090) | –1.687 (0.184) | –3.476 (0.098) | –2.850 (0.167) | |
| Entorhinal Cortex | +0.363 (0.111) | +0.207 (0.168) | +0.694 (0.185) | –0.091 (0.293) | –4.135 (0.158) | –1.173 (0.323) | –4.703 (0.161) | –5.981 (0.314) | |
| Middle Temporal Gyrus | +0.048 (0.047) | +0.175 (0.056) | –0.024 (0.084) | –0.343 (0.104) | –3.374 (0.113) | –1.417 (0.188) | –4.348 (0.141) | –3.190 (0.184) | |
| Ventricles | 0.472 (0.292) | +0.866 (0.308) | –0.219 (0.649) | +1.487 (0.641) | +12.091 (0.466) | +6.060 (0.557) | +14.336 (0.794) | +13.688 (0.585) | |
DISCUSSION
Though the ɛ4 allele is the foremost recognized factor controlling the risk of late onset AD and conversion from MCI to AD dementia, it remains unclear whether it also independently affects the rate of disease progression. Our segmented LMM modeling of the longitudinal cognitive data from ADNI participants who during the study transitioned from MCI to dementia and received an AD diagnosis, revealed significant associations between the ɛ4 allele and accelerated rates of decline in MMSE, CDR-SB, ADAS-11 and MoCA scales during the dementia stage of AD, with CDR-SB and MoCA showing ɛ4 allele-dose dependency. These ɛ4 allele-associated effects were verified to be stable and reproducible through bootstrap-based stability analysis performed on all segmented LMM analyses yielding p < 0.05. As indicated in the Introduction, previous analyses examining the effect of the ɛ4 allele on clinical progression of AD have yielded widely inconsistent findings. These past studies varied in their selection of cognitive metrics, cross-sectional versus longitudinal designs, and in their choice of statistical approaches [2, 11–26]. They also recruited participants with previously established AD diagnoses, which disallowed controlling for disease onset and over-relied on clinical criteria for AD diagnosis without biomarker aid. Only recently, an LMM analysis of 10-year CDR-SB longitudinal data in 592 CSF biomarker-confirmed AD subjects was published demonstrating a significant effect of the ɛ4 allele but not that of ɛ4 allele-dose on the rate of CDR-SB decline [23]. As CSF biomarkers were available only for some ADNI participants, we used the absence of diagnostic reversion as an additional criterion to validate AD diagnosis. Our segmented LMM modeling of longitudinal cognitive data explicitly adjusted for disease onset showed the effect of the ɛ4 allele on the decline rate in four common cognitive scales, providing the most robust evidence to date that possession of the ɛ4 allele is associated with a more aggressive clinical outcome during the dementia stage of AD. In the presence of a large sample size, it would be desirable to model and compute the precise progression rates of cognitive decline using a “Time-Index” as developed in Ashford and Schmitt [44, 45], or fit more flexible nonlinear mixed effect models. We selected the segmented LMM analysis based on our detailed check of piecewise linearity and consideration of model stability given the available sample size for the study population.
The stratified analyses revealed that the ɛ4 allele effect was more prevalent in younger participants and in females. The former observation is suggestive of a more aggressive disease course in these ɛ4 carriers in whom the disease starts at an earlier age. This finding remains consistent with previously reported observations of accelerated rates of brain atrophy in regions particularly susceptible to deposition of neurofibrillary tangles and neuronal loss in younger AD patients who possess the ɛ4 allele [46]. In addition, ɛ4 carriers are known to experience greater degrees of middle-age cognitive decline, hence by virtue of diminished brain reserve they are more susceptible to the clinical manifestations of AD pathology [47–51]. On the other hand, we found that a sub-cohort of ɛ4 carriers, who develop AD at an older age feature a more indolent disease course. One can hypothesize these individuals may benefit from the presence of genetic covariates attenuating the deleterious effects of ɛ4 allele. A recently identified example of such a genetic covariate with protective properties against the ɛ4 effect is Klotho VS heterozygosity [52]. For the purpose of our analysis, we separated younger and older participants using the mean age of AD transition for the entire analyzed cohort, which was 76.1 years. As this was an arbitrary assumption, we do not intend to imply that the interaction between age and the ɛ4 allele ceases at this particular age. Whether this interaction, as most biological processes do, transitions gradually or in fact changes at a sharply demarcated time point would require exploration of a larger cohort. While women are recognized as having a greater chance of developing AD than men [53], there are recent imaging data that female AD patients also experience a more aggressive disease course underscored by faster progression of brain atrophy [54], greater tau accumulation [55], and lower resilience to tau pathology suggested by reduced fluorodeoxyglucose uptake within the entorhinal cortex [56]. There also are clinical cross-sectional studies comparing cognitive scores of men and women carrying MCI diagnosis, which showed the cognitive scores to be significantly lower in females [57–59]. Biological reasons for increased susceptibility of women to AD, and more aggressive disease course, are yet unclear but likely multifactorial. Recently published results of multimodal brain imaging studies interrogating sex differences in the development of the AD endophenotype imply that the preclinical AD phase starts in women earlier than in men and coincides with the perimenopausal endocrine transition [60]. The perimenopausal endocrine transition is also associated with metabolic changes including an increased dependence of the brain metabolism on fatty acid, which has been linked to an increased susceptibility to neurodegeneration particularly among ɛ4 carriers [61]. In fact, our longitudinal modeling of ADNI data reveals more robust effect of the ɛ4 allele on the tempo of cognitive decline in female participants than in male participants. Since women live statistically longer than men one can suggest older age as the main factor underlying increased disease risk and greater susceptibility to AD pathology in females. To probe this notion, we compared the average age of MCI to AD transition between female and male participants, which was 74.7±8.2 years and 77.0±6.3 years (t(209) = 2.2, p = 0.03), respectively. This observation suggests that the association between female sex and higher AD risk is not simply from greater longevity in females. There was no meaningful differences when the participants were stratified by median education level, which in this study was 16 years. Although higher education level is considered protective against AD symptoms, in ADNI most of the enrollees appear to hold undergraduate or graduate degrees, which likely provides similar levels of protection against the disease. Lastly, we found the ɛ4 effect to be more prevalent among the participants enrolled in ADNI-1 than among those enrolled during ADNI-GO/2. This difference can be explained by a significantly higher number of participants and associated data points selected to this analysis from the former than from the latter study (1,649 ADNI-1 visits versus 536 ADNI-GO/2 visits).
APOE ɛ4 carriers who present with MCI symptoms are at increased risk of conversion to AD dementia compared to non-carriers [29–33]. Despite this well-established fact, an association between the ɛ4 allele and the rate of decline in cognitive metrics during MCI was not found by this study on any of the analyzed cognitive measures. It is possible that the diminutive effect of the ɛ4 allele in MCI is from a smaller number of data points (859 MCI visits versus 1,326 AD dementia visits), a shorter period of follow up, and generally slower rates of cognitive decline during the MCI stage compared to the AD dementia stage. Relative insensitivity of psychometric scales to track progression of cognitive decline during MCI also may play a role here and likewise constitute a recognized concern in the design of clinical trials focused on MCI population [34]. Thus, new cognitive measures providing more reliable and precise quantification of cognitive decline rate during MCI are being developed and validated [62, 63]. As the ADNI study progresses and accumulates more data in MCI participants, the analysis of ɛ4 effect on the rate of cognitive decline during MCI shall be reexamined.
Consistent with a steeper decline in longitudinal cognitive data, our segmented LMM analyses also revealed that ɛ4 carriers experience faster tempo of brain atrophy after the transition to AD dementia. Although differences in the brain volume between ɛ4 carriers and non-carriers have been shown before, cross-sectional designs utilized by most of the past studies precluded drawing direct conclusions about the relationship between the ɛ4 allele and the tempo of atrophy progression. Previous cross-sectional analyses found particularly strong differences in the degree of atrophy concerning the mesial temporal lobe [64] and discrete areas of the neocortex [65] when comparing ɛ4 allele carriers to non-carriers. Our segmented LMM modeling of ADNI longitudinal volumetric data additionally revealed significant associations between the possession of the ɛ4 allele and the atrophy rate of the hippocampus, the entorhinal cortex, and the middle temporal gyrus. However, the strongest predictors of the ɛ4 effect in our study were found to be the atrophy of the whole brain and the volume of the ventricular system. Interestingly, we found that although possession of the ɛ4 allele predicts accelerated atrophy in most of the analyzed brain structures, this effect did not differ between carriers of a single versus two ɛ4 alleles. Like the segmented LMM analysis of cognitive metrics, the segmented LMM analysis of longitudinal volumetric data during MCI did not demonstrate a consistent effect of the ɛ4 allele on the rate of atrophy in either of the analyzed structures. However, the main effect of time on the volumetric changes in the pre-transition analyses was less conspicuous than that in the post-transition analyses, with some structures even presenting temporal increase in volume before they reverted to atrophy. This transient volume increase during MCI has been reported before and its reversion to atrophy coincides with the timing of massive tau deposition [66].
Overall results of our study support a hypothesis that the ɛ4 allele may promote AD pathogenic mechanisms downstream to Aβ deposition, which include tauopathy, neuroinflammation, and the adaptive plasticity response of neuronal networks. There have been recent clinical reports implicating the ɛ4 allele in propagating development of neurofibrillary pathology. Several positron emission tomography studies utilizing tau specific ligands have directly correlated the ɛ4 allele with an increased ligand retention [67, 68], and this effect was shown to be further potentiated by the interaction between the ɛ4 allele and female sex [69]. Likewise, neuropathological analysis of primary tauopathies have suggested that possession of an ɛ4 allele exacerbates regional neurodegeneration [23]. Recently, the promoting effect of the ɛ4 allele on neurofibrillary pathology was experimentally reproduced in a PS19 transgenic tauopathy model mice, where targeted replacement of the murine Apoe gene for the human ɛ4 allele increased tau accumulation compared to mice expressing ɛ2 or ɛ3 alleles [23]. Interestingly, PS19 mice expressing the ɛ4 allele also exhibit pronounced atrophy of the whole brain, the hippocampus, and expansion of the ventricular system akin to the findings reported by this study. Further evidence from these animal models have shown that the ɛ4 allele promotes inflammatory microglia activation [23, 70], and that hyperactive microglia contribute importantly to tissue damage and exacerbates tau mediated neurodegeneration [71]. While in homeostatic microglia APOE expression is dormant, the transcriptomic profile of neurodegenerative phenotype microglia, isolated from the brains of AD subjects and AD transgenic model mice, evidences greatly elevated APOE expression [72-74]. The APOE genotype was shown to differentially regulate the microglial neurodegenerative phenotype, and the ɛ4 allele was found to exert a strong proinflammatory effect [23, 71, 75]. Furthermore, the contribution of chronic, low-grade peripheral inflammation to the risk of AD through the interaction with inflammation-prone, aging microglia has been proposed [76–78] and particularly strong clinical evidence for this association has been found among ɛ4 allele carriers [79]. In addition, there is a well-recognized involvement of apoE in the mechanisms underlying the long-term plasticity of neuronal circuits. This effect also is differentially modulated by the APOE genotype and carriers of the ɛ4 allele show diminished adaptive plasticity during normal aging and AD [7, 47]. The interplay between neuroplasticity and neurodegeneration appears to be critical during the transition from MCI to AD dementia. The two negative findings of this study, i.e., the lack of a significant ɛ4 effect on the rate of cognitive decline and brain atrophy during the MCI stage seem to support this notion. During MCI, the neuroplasticity response in ɛ4 carriers may still operate within an acceptable range, but it easily decompensates when challenged by ɛ4-driven neurodegeneration during the late MCI phase. The relative contribution of various ɛ4-related mechanisms to AD progression shall be elucidated by further studies taking into account the disease stage and the ɛ4 allele-dose dependency. Transgenic mouse models, which express human apoE isoforms can be used to study ɛ4-dependent effects on Aβ deposition, tauopathy, neuroinflammation, and neuroplasticity [23]. Findings of our study also suggest that the APOE genotype should be taken into consideration when designing AD research studies and especially clinical trials of disease modifying therapeutics.
ACKNOWLEDGMENTS
This work was supported by grants from the National Institute on Aging of the National Institutes of Health: R01 AG031221 (to Sadowski, MJ), R01 AG067478 (to Sadowski, MJ), T35 AG050998 (to Blaum, C), P30 AG066512 (to Shao, Y), and P01 AG060882 (to Shao, Y).
M.J.S. is the site PI for ADNI-3 study at the NYU Grossman School of Medicine.
Data collection and sharing for this project was funded by the Alzheimer’s Disease Neuroimaging Initiative (ADNI) (National Institutes of Health Grant U01 AG024904) and DOD ADNI (Department of Defense award number W81XWH-12-2-0012). ADNI is funded by the National Institute on Aging, the National Institute of Biomedical Imaging and Bioengineering, and through generous contributions from the following: AbbVie, Alzheimer’s Association; Alzheimer’s Drug Discovery Foundation; Araclon Biotech; BioClinica, Inc.; Biogen; Bristol-Myers Squibb Company; CereSpir, Inc.; Cogstate; Eisai Inc.; Elan Pharmaceuticals, Inc.; Eli Lilly and Company; EuroImmun; F. Hoffmann-La Roche Ltd and its affiliated company Genentech, Inc.; Fujirebio; GE Healthcare; IXICO Ltd.; Janssen Alzheimer Immunotherapy Research & Development, LLC.; Johnson & Johnson Pharmaceutical Research & Development LLC.; Lumosity; Lundbeck; Merck & Co., Inc.;Meso Scale Diagnostics, LLC.; NeuroRx Research; Neurotrack Technologies; Novartis Pharmaceuticals Corporation; Pfizer Inc.; Piramal Imaging; Servier; Takeda Pharmaceutical Company; and Transition Therapeutics. The Canadian Institutes of Health Research is providing funds to support ADNI clinical sites in Canada. Private sector contributions are facilitated by the Foundation for the National Institutes of Health (http://www.fnih.org). The grantee organization is the Northern California Institute for Research and Education, and the study is coordinated by the Alzheimer’s Therapeutic Research Institute at the University of Southern California. ADNI data are disseminated by the Laboratory for Neuro Imaging at the University of Southern California.
Authors’ disclosures available online (https://www.j-alz.com/manuscript-disclosures/21-0434r1).
SUPPLEMENTARY MATERIAL
[1] The supplementary material is available in the electronic version of this article: https://dx.doi.org/10.3233/JAD-210434.
REFERENCES
[1] | Busche MA , Hyman BT ((2020) ) Synergy between amyloid-beta and tau in Alzheimer’s disease. Nat Neurosci 23: , 1183–1193. |
[2] | Gomez-Isla T , West HL , Rebeck GW , Harr SD , Growdon JH , Locascio JJ , Perls TT , Lipsitz LA , Hyman BT ((1996) ) Clinical and pathological correlates of apolipoprotein E e4 in Alzheimer’s disease. Ann Neurol 39: , 62–70. |
[3] | Braak H , Braak E ((1991) ) Neuropathological staging of Alzheimer-related changes. Acta Neuropathol 82: , 239–259. |
[4] | Selkoe DJ , Hardy J ((2016) ) The amyloid hypothesis of Alzheimer’s disease at 25 years. EMBO Mol Med 8: , 595–608. |
[5] | Corder EH , Saunders AM , Strittmatter WJ , Schmechel DE , Gaskell PC , Small GW , Roses AD , Haines JL , Pericak-Vance MA ((1993) ) Gene dose of apolipoprotein E type 4 allele and the risk of Alzheimer’s disease in late onset families. Science 261: , 921–923. |
[6] | Ordovas JM , Litwack-Klein L , Wilson PW , Schaefer MM , Schaefer EJ ((1987) ) Apolipoprotein E isoform phenotyping methodology and population frequency with identification of apoE1 and apoE5 isoforms. J Lipid Res 28: , 371–380. |
[7] | Yamazaki Y , Zhao N , Caulfield TR , Liu CC , Bu G ((2019) ) Apolipoprotein E and Alzheimer disease: Pathobiology and targeting strategies. Nat Rev Neurol 15: , 501–518. |
[8] | Castellano JM , Kim J , Stewart FR , Jiang H , DeMattos RB , Patterson BW , Fagan AM , Morris JC , Mawuenyega KG , Cruchaga C , Goate AM , Bales KR , Paul SM , Bateman RJ , Holtzman DM ((2011) ) Human apoE isoforms differentially regulate brain amyloid-β peptide clearance. Sci Transl Med 3: , 89ra57. |
[9] | Hashimoto T , Serrano-Pozo A , Hori Y , Adams KW , Takeda S , Banerji AO , Mitani A , Joyner D , Thyssen DH , Bacskai BJ , Frosch MP , Spires-Jones TL , Finn MB , Holtzman DM , Hyman BT ((2012) ) Apolipoprotein E, especially apolipoprotein E4, increases the oligomerization of amyloid beta peptide. J Neurosci 32: , 15181–15192. |
[10] | Ma J , Yee A , Brewer HB Jr. , Das S , Potter H ((1994) ) Amyloid-associated proteins alpha 1-antichymotrypsin and apolipoprotein E promote assembly of Alzheimer beta-protein into filaments. Nature 372: , 92–94. |
[11] | Montagne A , Nation DA , Sagare AP , Barisano G , Sweeney MD , Chakhoyan A , Pachicano M , Joe E , Nelson AR , D’Orazio LM , Buennagel DP , Harrington MG , Benzinger TLS , Fagan AM , Ringman JM , Schneider LS , Morris JC , Reiman EM , Caselli RJ , Chui HC , Tcw J , Chen Y , Pa J , Conti PS , Law M , Toga AW , Zlokovic BV ((2020) ) APOE4 leads to blood-brain barrier dysfunction predicting cognitive decline. Nature 581: , 71–76. |
[12] | DeMattos RB , Bales KR , Cummins DJ , Paul SM , Holtzman DM ((2002) ) Brain to plasma amyloid-beta efflux: A measure of brain amyloid burden in a mouse model of Alzheimer’s disease. Science 295: , 2264–2267. |
[13] | Growdon JH , Locascio JJ , Corkin S , Gomez-Isla T , Hyman BT ((1996) ) Apolipoprotein E genotype does not influence rates of cognitive decline in Alzheimer’s disease. Neurology 47: , 444–448. |
[14] | Murphy GM Jr. , Sullivan EV , Gallagher-Thompson D , Thompson LW , Duijn v, CM , Forno LS , Ellis WG , Jagust WJ , Yesavage J , Tinklenberg JR ((1997) ) No association between the alpha 1-antichymotrypsin A allele and Alzheimer’s disease. Neurology 48: , 1313–1316. |
[15] | Holmes C , Levy R , McLoughlin DM , Powell JF , Lovestone S ((1996) ) Apolipoprotein E: Non-cognitive symptoms and cognitive decline in late onset Alzheimer’s disease. J Neurol Neurosurg Psychiatry 61: , 580–583. |
[16] | Kurz A , Egensperger R , Haupt M , Lautenschlager N , Romero B , Graeber MB , Muller U ((1996) ) Apolipoprotein E epsilon 4 allele, cognitive decline, and deterioration of everyday performance in Alzheimer’s disease. Neurology 47: , 440–443. |
[17] | Basun H , Grut M , Winblad B , Lannfelt L ((1995) ) Apolipoprotein epsilon 4 allele and disease progression in patients with late-onset Alzheimer’s disease. Neurosci Lett 183: , 32–34. |
[18] | Kleiman T , Zdanys K , Black B , Rightmer T , Grey M , Garman K , Macavoy M , Gelernter J , van Dyck C ((2006) ) Apolipoprotein E epsilon4 allele is unrelated to cognitive or functional decline in Alzheimer’s disease: Retrospective and prospective analysis. Dement Geriatr Cogn Disord 22: , 73–82. |
[19] | Asada T , Kariya T , Yamagata Z , Kinoshita T , Asaka A ((1996) ) ApoE e4 allele and cognitive decline in patients with Alzheimer’s disease. Neurology 47: , 603–603. |
[20] | Farlow MR , Cyrus PA , Nadel A , Lahiri DK , Brashear A , Gulanski B ((1999) ) Metrifonate treatment of AD: Influence of APOE genotype. Neurology 53: , 2010–2016. |
[21] | Slooter AJ , Houwing-Duistermaat JJ , van Harskamp F , Cruts M , Van Broeckhoven C , Breteler MM , Hofman A , Stijnen T , van Duijn CM ((1999) ) Apolipoprotein E genotype and progression of Alzheimer’s disease: The Rotterdam Study. J Neurol 246: , 304–308. |
[22] | Cosentino S , Scarmeas N , Helzner E , Glymour MM , Brandt J , Albert M , Blacker D , Stern Y ((2008) ) APOE epsilon 4 allele predicts faster cognitive decline in mild Alzheimer disease. Neurology 70: , 1842–1849. |
[23] | Shi Y , Yamada K , Liddelow SA , Smith ST , Zhao L , Luo W , Tsai RM , Spina S , Grinberg LT , Rojas JC , Gallardo G , Wang K , Roh J , Robinson G , Finn MB , Jiang H , Sullivan PM , Baufeld C , Wood MW , Sutphen C , McCue L , Xiong C , Del-Aguila JL , Morris JC , Cruchaga C , Alzheimer’s Disease Neuroimaging Initiative, Fagan AM , Miller BL , Boxer AL , Seeley WW , Butovsky O , Barres BA , Paul SM , Holtzman DM ((2017) ) ApoE4 markedly exacerbates tau-mediated neurodegeneration in a mouse model of tauopathy. Nature 549: , 523–527. |
[24] | Martins CA , Oulhaj A , de Jager CA , Williams JH ((2005) ) APOE alleles predict the rate of cognitive decline in Alzheimer disease: A nonlinear model. Neurology 65: , 1888–1893. |
[25] | van der Vlies AE , Koedam EL , Pijnenburg YA , Twisk JW , Scheltens P , van der Flier WM ((2009) ) Most rapid cognitive decline in APOE epsilon4 negative Alzheimer’s disease with early onset. Psychol Med 39: , 1907–1911. |
[26] | Hoyt BD , Massman PJ , Schatschneider C , Cooke N , Doody RS ((2005) ) Individual growth curve analysis of APOE epsilon 4-associated cognitive decline in Alzheimer disease. Arch Neurol 62: , 454–459. |
[27] | Frisoni GB , Govoni S , Geroldi C , Bianchetti A , Calabresi L , Franceschini G , Trabucchi M ((1995) ) Gene dose of the epsilon 4 allele of apolipoprotein E and disease progression in sporadic late-onset Alzheimer’s disease. Ann Neurol 37: , 596–604. |
[28] | Stern Y , Brandt J , Albert M , Jacobs DM , Liu X , Bell K , Marder K , Sano M , Albert S , Del-Castillo Castenada C , Bylsma F , Tycko B , Mayeux R ((1997) ) The absence of an apolipoprotein epsilon4 allele is associated with a more aggressive form of Alzheimer’s disease. Ann Neurol 41: , 615–620. |
[29] | Petersen RC , Smith GE , Ivnik RJ , Tangalos EG , Schaid DJ , Thibodeau SN , Kokmen E , Waring SC , Kurland LT ((1995) ) Apolipoprotein E status as a predictor of the development of Alzheimer’s disease in memory-impaired individuals. JAMA 273: , 1274–1278. |
[30] | Bondi MW , Salmon DP , Monsch AU , Galasko D , Butters N , Klauber MR , Thal LJ , Saitoh T ((1995) ) Episodic memory changes are associated with the APOE-epsilon 4 allele in nondemented older adults. Neurology 45: , 2203–2206. |
[31] | Tierney MC , Szalai JP , Snow WG , Fisher RH , Nores A , Nadon G , Dunn E , St George-Hyslop PH ((1996) ) Prediction of probable Alzheimer’s disease in memory-impaired patients: A prospective longitudinal study. Neurology 46: , 661–665. |
[32] | Tierney MC , Szalai JP , Snow WG , Fisher RH , Tsuda T , Chi H , McLachlan DR , St George-Hyslop PH ((1996) ) A prospective study of the clinical utility of ApoE genotype in the prediction of outcome in patients with memory impairment. Neurology 46: , 149–154. |
[33] | Devanand DP , Pelton GH , Zamora D , Liu X , Tabert MH , Goodkind M , Scarmeas N , Braun I , Stern Y , Mayeux R ((2005) ) Predictive utility of apolipoprotein E genotype for Alzheimer disease in outpatients with mild cognitive impairment. Arch Neurol 62: , 975–980. |
[34] | Kueper JK , Speechley M , Montero-Odasso M ((2018) ) The Alzheimer’s Disease Assessment Scale-Cognitive Subscale (ADAS-Cog): Modifications and responsiveness in pre-dementia populations. A narrative review. J Alzheimers Dis 63: , 423–444. |
[35] | Sevigny J , Chiao P , Bussiere T , Weinreb PH , Williams L , Maier M , Dunstan R , Salloway S , Chen T , Ling Y , O’Gorman J , Qian F , Arastu M , Li M , Chollate S , Brennan MS , Quintero-Monzon O , Scannevin RH , Arnold HM , Engber T , Rhodes K , Ferrero J , Hang Y , Mikulskis A , Grimm J , Hock C , Nitsch RM , Sandrock A ((2016) ) The antibody aducanumab reduces Abeta plaques in Alzheimer’s disease. Nature 537: , 50–56. |
[36] | Weiner MW , Aisen PS , Jack CR Jr. , Jagust WJ , Trojanowski JQ , Shaw L , Saykin AJ , Morris JC , Cairns N , Beckett LA , Toga A , Green R , Walter S , Soares H , Snyder P , Siemers E , Potter W , Cole PE , Schmidt M , Alzheimer’s Disease Neuroimaging Initiative ((2010) ) The Alzheimer’s disease neuroimaging initiative: Progress report and future plans. Alzheimers Dement 6: , 202–211 e207. |
[37] | Weiner MW , Veitch DP , Aisen PS , Beckett LA , Cairns NJ , Green RC , Harvey D , Jack CR Jr. , Jagust W , Morris JC , Petersen RC , Salazar J , Saykin AJ , Shaw LM , Toga AW , Trojanowski JQ , Alzheimer’s Disease Neuroimaging Initiative ((2017) ) The Alzheimer’s Disease Neuroimaging Initiative 3: Continued innovation for clinical trial improvement. Alzheimers Dement 13: , 561–571. |
[38] | Reiman EM , Arboleda-Velasquez JF , Quiroz YT , Huentelman MJ , Beach TG , Caselli RJ , Chen Y , Su Y , Myers AJ , Hardy J , Paul Vonsattel J , Younkin SG , Bennett DA , De Jager PL , Larson EB , Crane PK , Keene CD , Kamboh MI , Kofler JK , Duque L , Gilbert JR , Gwirtsman HE , Buxbaum JD , Dickson DW , Frosch MP , Ghetti BF , Lunetta KL , Wang LS , Hyman BT , Kukull WA , Foroud T , Haines JL , Mayeux RP , Pericak-Vance MA , Schneider JA , Trojanowski JQ , Farrer LA , Schellenberg GD , Beecham GW , Montine TJ , Jun GR , Alzheimer’s Disease Genetics Consortium ((2020) ) Exceptionally low likelihood of Alzheimer’s dementia in APOE2 homozygotes from a 5,000-person neuropathological study. Nat Commun 11: , 667. |
[39] | Cockrell JR , Folstein MF ((1988) ) Mini-Mental State Examination (MMSE). Psychopharmacol Bull 24: , 689–692. |
[40] | O’Bryant SE , Waring SC , Cullum CM , Hall J , Lacritz L , Massman PJ , Lupo PJ , Reisch JS , Doody R , Texas Alzheimer’s Research Consortium ((2008) ) Staging dementia using Clinical Dementia Rating Scale Sum of Boxes scores: A Texas Alzheimer’s research consortium study. Arch Neurol 65: , 1091–1095. |
[41] | Mohs RC , Cohen L ((1988) ) Alzheimer’s Disease Assessment Scale (ADAS). Psychopharmacol Bull 24: , 627–628. |
[42] | Nasreddine ZS , Phillips NA , Bedirian V , Charbonneau S , Whitehead V , Collin I , Cummings JL , Chertkow H ((2005) ) The Montreal Cognitive Assessment, MoCA: A brief screening tool for mild cognitive impairment. J Am Geriatr Soc 53: , 695–699. |
[43] | Cnaan A , Laird NM , Slasor P ((1997) ) Using the general linear mixed model to analyse unbalanced repeated measures and longitudinal data. Stat Med 16: , 2349–2380. |
[44] | Ashford JW , Shan M , Butler S , Rajasekar A , Schmitt FA ((1995) ) Temporal quantification of Alzheimer’s disease severity: ‘time index’ model. Dementia 6: , 269–280. |
[45] | Ashford JW , Schmitt FA ((2001) ) Modeling the time-course of Alzheimer dementia. Curr Psychiatry Rep 3: , 20–28. |
[46] | Chang YL , Fennema-Notestine C , Holland D , McEvoy LK , Stricker NH , Salmon DP , Dale AM , Bondi MW , Alzheimer’s Disease Neuroimaging Initiative ((2014) ) APOE interacts with age to modify rate of decline in cognitive and brain changes in Alzheimer’s disease. Alzheimers Dement 10: , 336–348. |
[47] | Di Battista AM , Heinsinger NM , Rebeck GW ((2016) ) Alzheimer’s disease genetic risk factor APOE-epsilon4 also affects normal brain function. Curr Alzheimer Res 13: , 1200–1207. |
[48] | Greenwood PM , Sunderland T , Friz JL , Parasuraman R ((2000) ) Genetics and visual attention: Selective deficits in healthy adult carriers of the epsilon 4 allele of the apolipoprotein E gene. Proc Natl Acad Sci U S A 97: , 11661–11666. |
[49] | Caselli RJ , Dueck AC , Locke DE , Hoffman-Snyder CR , Woodruff BK , Rapcsak SZ , Reiman EM ((2011) ) Longitudinal modeling of frontal cognition in APOE epsilon4 homozygotes, heterozygotes, and noncarriers. Neurology 76: , 1383–1388. |
[50] | Caselli RJ , Dueck AC , Osborne D , Sabbagh MN , Connor DJ , Ahern GL , Baxter LC , Rapcsak SZ , Shi J , Woodruff BK , Locke DE , Snyder CH , Alexander GE , Rademakers R , Reiman EM ((2009) ) Longitudinal modeling of age-related memory decline and the APOE epsilon4 effect. N Engl J Med 361: , 255–263. |
[51] | Caselli RJ , Reiman EM , Locke DE , Hutton ML , Hentz JG , Hoffman-Snyder C , Woodruff BK , Alexander GE , Osborne D ((2007) ) Cognitive domain decline in healthy apolipoprotein E epsilon4 homozygotes before the diagnosis of mild cognitive impairment. Arch Neurol 64: , 1306–1311. |
[52] | Belloy ME , Napolioni V , Han SS , Le Guen Y , Greicius MD , Alzheimer’s Disease Neuroimaging Initiative ((2020) ) Association of Klotho-VS heterozygosity with risk of Alzheimer disease in individuals who carry APOE4. JAMA Neurol 77: , 849–862. |
[53] | Vina J , Lloret A ((2010) ) Why women have more Alzheimer’s disease than men: Gender and mitochondrial toxicity of amyloid-beta peptide.S. J Alzheimers Dis 20 Suppl 2: , 527–533. |
[54] | Holland D , Desikan RS , Dale AM , McEvoy LK , Alzheimer’s Disease Neuroimaging I ((2013) ) Higher rates of decline for women and apolipoprotein E epsilon4 carriers. Am J Neuroradiol 34: , 2287–2293. |
[55] | Buckley RF , Mormino EC , Rabin JS , Hohman TJ , Landau S , Hanseeuw BJ , Jacobs HIL , Papp KV , Amariglio RE , Properzi MJ , Schultz AP , Kirn D , Scott MR , Hedden T , Farrell M , Price J , Chhatwal J , Rentz DM , Villemagne VL , Johnson KA , Sperling RA ((2019) ) Sex differences in the association of global amyloid and regional tau deposition measured by positron emission tomography in clinically normal older adults. JAMA Neurol 76: , 542–551. |
[56] | Ramanan VK , Castillo AM , Knopman DS , Graff-Radford J , Lowe VJ , Petersen RC , Jack CR Jr. , Mielke MM , Vemuri P ((2019) ) Association of apolipoprotein E varepsilon4, educational level, and sex with tau deposition and tau-mediated metabolic dysfunction in older adults. JAMA Netw Open 2: , e1913909. |
[57] | Fleisher A , Grundman M , Jack CR Jr. , Petersen RC , Taylor C , Kim HT , Schiller DH , Bagwell V , Sencakova D , Weiner MF , DeCarli C , DeKosky ST , van Dyck CH , Thal LJ , Alzheimer’s Disease Cooperative Study ((2005) ) Sex, apolipoprotein E epsilon 4 status, and hippocampal volume in mild cognitive impairment. Arch Neurol 62: , 953–957. |
[58] | Hobel Z , Isenberg AL , Raghupathy D , Mack W , Pa J , Alzheimer’s Disease Neuroimaging Initiative and the Australian Imaging Biomarkers and Lifestyle flagship study of ageing ((2019) ) APOEvarepsilon4 gene dose and sex effects on Alzheimer’s disease MRI biomarkers in older adults with mild cognitive impairment. J Alzheimers Dis 71: , 647–658. |
[59] | Farlow MR , He Y , Tekin S , Xu J , Lane R , Charles HC ((2004) ) Impact of APOE in mild cognitive impairment. Neurology 63: , 1898–1901. |
[60] | Mosconi L , Berti V , Quinn C , McHugh P , Petrongolo G , Varsavsky I , Osorio RS , Pupi A , Vallabhajosula S , Isaacson RS , de Leon MJ , Brinton RD ((2017) ) Sex differences in Alzheimer risk: Brain imaging of endocrine vs chronologic aging. Neurology 89: , 1382–1390. |
[61] | Yassine HN , Finch CE ((2020) ) APOE alleles and diet in brain aging and Alzheimer’s disease. Front Aging Neurosci 12: , 150. |
[62] | Wang J , Logovinsky V , Hendrix SB , Stanworth SH , Perdomo C , Xu L , Dhadda S , Do I , Rabe M , Luthman J , Cummings J , Satlin A ((2016) ) ADCOMS: A composite clinical outcome for prodromal Alzheimer’s disease trials. J Neurol Neurosurg Psychiatry 87: , 993–999. |
[63] | Wessels AM , Siemers ER , Yu P , Andersen SW , Holdridge KC , Sims JR , Sundell K , Stern Y , Rentz DM , Dubois B , Jones RW , Cummings J , Aisen PS ((2015) ) A combined measure of cognition and function for clinical trials: The Integrated Alzheimer’s Disease Rating Scale (iADRS). J Prev Alzheimers Dis 2: , 227–241. |
[64] | Hashimoto M , Yasuda M , Tanimukai S , Matsui M , Hirono N , Kazui H , Mori E ((2001) ) Apolipoprotein E epsilon 4 and the pattern of regional brain atrophy in Alzheimer’s disease. Neurology 57: , 1461–1466. |
[65] | Agosta F , Vossel KA , Miller BL , Migliaccio R , Bonasera SJ , Filippi M , Boxer AL , Karydas A , Possin KL , Gorno-Tempini ML ((2009) ) Apolipoprotein E epsilon4 is associated with disease-specific effects on brain atrophy in Alzheimer’s disease and frontotemporal dementia. Proc Natl Acad Sci U S A 106: , 2018–2022. |
[66] | Gispert JD , Rami L , Sanchez-Benavides G , Falcon C , Tucholka A , Rojas S , Molinuevo JL ((2015) ) Nonlinear cerebral atrophy patterns across the Alzheimer’s disease continuum: Impact of APOE4 genotype. Neurobiol Aging 36: , 2687–2701. |
[67] | Therriault J , Benedet AL , Pascoal TA , Mathotaarachchi S , Savard M , Chamoun M , Thomas E , Kang MS , Lussier F , Tissot C , Soucy JP , Massarweh G , Rej S , Saha-Chaudhuri P , Poirier J , Gauthier S , Rosa-Neto P , Alzheimer’s Disease Neuroimaging Initiative ((2020) ) APOEepsilon4 potentiates the relationship between amyloid-beta and tau pathologies. Mol Psychiatry, doi: 10.1038/s41380-020-0688-6. |
[68] | Therriault J , Benedet AL , Pascoal TA , Mathotaarachchi S , Chamoun M , Savard M , Thomas E , Kang MS , Lussier F , Tissot C , Parsons M , Qureshi MNI , Vitali P , Massarweh G , Soucy JP , Rej S , Saha-Chaudhuri P , Gauthier S , Rosa-Neto P ((2020) ) Association of Apolipoprotein E epsilon4 with medial temporal tau independent of amyloid-beta. JAMA Neurol 77: , 470–479. |
[69] | Liu M , Paranjpe MD , Zhou X , Duy PQ , Goyal MS , Benzinger TLS , Lu J , Wang R , Zhou Y ((2019) ) Sex modulates the ApoE epsilon4 effect on brain tau deposition measured by (18)F-AV-1451 PET in individuals with mild cognitive impairment. Theranostics 9: , 4959–4970. |
[70] | Shi Y , Manis M , Long J , Wang K , Sullivan PM , Remolina Serrano J , Hoyle R , Holtzman DM ((2019) ) Microglia drive APOE-dependent neurodegeneration in a tauopathy mouse model. J Exp Med 216: , 2546–2561. |
[71] | Shi Y , Holtzman DM ((2018) ) Interplay between innate immunity and Alzheimer disease: APOE and TREM2 in the spotlight. Nat Rev Immunol 18: , 759–772. |
[72] | Krasemann S , Madore C , Cialic R , Baufeld C , Calcagno N , El Fatimy R , Beckers L , O’Loughlin E , Xu Y , Fanek Z , Greco DJ , Smith ST , Tweet G , Humulock Z , Zrzavy T , Conde-Sanroman P , Gacias M , Weng Z , Chen H , Tjon E , Mazaheri F , Hartmann K , Madi A , Ulrich JD , Glatzel M , Worthmann A , Heeren J , Budnik B , Lemere C , Ikezu T , Heppner FL , Litvak V , Holtzman DM , Lassmann H , Weiner HL , Ochando J , Haass C , Butovsky O ((2017) ) The TREM2-APOE pathway drives the transcriptional phenotype of dysfunctional microglia in neurodegenerative diseases. Immunity 47: , 566–581 e569. |
[73] | Keren-Shaul H , Spinrad A , Weiner A , Matcovitch-Natan O , Dvir-Szternfeld R , Ulland TK , David E , Baruch K , Lara-Astaiso D , Toth B , Itzkovitz S , Colonna M , Schwartz M , Amit I ((2017) ) A unique microglia type associated with restricting development of Alzheimer’s disease. Cell 169: , 1276–1290 e1217. |
[74] | Pimenova AA , Marcora E , Goate AM ((2017) ) A tale of two genes: Microglial Apoe and Trem2. Immunity 47: , 398–400. |
[75] | Vitek MP , Brown CM , Colton CA ((2009) ) APOE genotype-specific differences in the innate immune response. Neurobiol Aging 30: , 1350–1360. |
[76] | Kamer AR , Craig RG , Niederman R , Fortea J , de Leon MJ ((2020) ) Periodontal disease as a possible cause for Alzheimer’s disease. Periodontol 2000 83: , 242–271. |
[77] | Akiyama H , Barger S , Barnum S , Bradt B , Bauer J , Cole GM , Cooper NR , Eikelenboom P , Emmerling M , Fiebich BL , Finch CE , Frautschy S , Griffin WS , Hampel H , Hull M , Landreth G , Lue L , Mrak R , Mackenzie IR , McGeer PL , O’Banion MK , Pachter J , Pasinetti G , Plata-Salaman C , Rogers J , Rydel R , Shen Y , Streit W , Strohmeyer R , Tooyoma I , Van Muiswinkel FL , Veerhuis R , Walker D , Webster S , Wegrzyniak B , Wenk G , Wyss-Coray T ((2000) ) Inflammation and Alzheimer’s disease. Neurobiol Aging 21: , 383–421. |
[78] | Newcombe EA , Camats-Perna J , Silva ML , Valmas N , Huat TJ , Medeiros R ((2018) ) Inflammation: The link between comorbidities, genetics, and Alzheimer’s disease. J Neuroinflammation 15: , 276. |
[79] | Tao Q , Ang TFA , DeCarli C , Auerbach SH , Devine S , Stein TD , Zhang X , Massaro J , Au R , Qiu WQ ((2018) ) Association of chronic low-grade inflammation with risk of Alzheimer disease in ApoE4 carriers. JAMA Netw Open 1: , e183597. |

