
Grey Matter Loss at Different Stages of Cognitive Decline: A Role for the Thalamus in Developing Alzheimer’s Disease
Abstract
Background:
Alzheimer’s disease (AD) is characterized by cognitive impairment and large loss of grey matter volume and is the most prevalent form of dementia worldwide. Mild cognitive impairment (MCI) is the stage that precedes the AD dementia stage, but individuals with MCI do not always convert to the AD dementia stage, and it remains unclear why.
Objective:
We aimed to assess grey matter loss across the brain at different stages of the clinical continuum of AD to gain a better understanding of disease progression.
Methods:
In this large-cohort study (N = 1,386) using neuroimaging data from the Alzheimer’s Disease Neuroimaging Initiative, voxel-based morphometry analyses were performed between healthy controls, individuals with early and late and AD dementia stage.
Results:
Clear patterns of grey matter loss in mostly hippocampal and temporal regions were found across clinical stages, though not yet in early MCI. In contrast, thalamic volume loss seems one of the first signs of cognitive decline already during early MCI, whereas this volume loss does not further progress from late MCI to AD dementia stage. AD dementia stage converters already show grey matter loss in hippocampal and mid-temporal areas as well as the posterior thalamus (pulvinar) and angular gyrus at baseline.
Conclusion:
This study confirms the role of temporal brain regions in AD development and suggests additional involvement of the thalamus/pulvinar and angular gyrus that may be linked to visuospatial, attentional, and memory related problems in both early MCI and AD dementia stage conversion.
INTRODUCTION
Alzheimer’s disease (AD) is the most prevalent form of dementia worldwide, accounting for 60–80%of all dementia cases, and affects an estimated 17%of individuals above the age of 75 [1]. With a global increase in life expectancy, up to 16 million people in the US may suffer from AD by 2050 [2]. Besides the sociological burden, economic numbers indicate annual health care cost of 818 billion USD, which is expected to rise to 2 trillion by 2030 in the US alone [3]. This makes AD a global health crisis on multiple levels.
AD is characterized by moderate to severe cognitive difficulties (memory loss, attention impairments, executive function deficits), a loss of independency in daily activities, and personality changes, and is associated with a dramatic, irreversible loss of brain cells and neuronal function [4]. Risk factors for developing AD include low educational level, depression, cardiovascular disease, obesity, and smoking [5]. Furthermore, certain alleles of the APOE gene such as APOE4 pose a higher risk in developing AD later in life, possibly due to its involvement in the synthesis of neurotoxic proteins such as amyloid-β (Aβ) and tau [6] and promoting detrimental neuroinflammatory responses [7].
Shortly after the accumulation of neuronal damage on the microscopic level, substantial changes to brain structure and function occur on the macroscopic level. AD patients in the late stages of the disease continuum that undergo structural T1-weighted magnetic resonance imaging (MRI) scans show widespread loss of grey matter in the bilateral hippocampus, temporal pole, medial- and inferior temporal cortex, precuneus, parietal lobe, and cerebellum [8–11]. This loss greatly affects cognitive performance. Longitudinal studies show that the spread of Aβ protein depositions is present in many different brain areas early on in the disease (subsequently causing the formation of neurotoxic tau and further brain volume loss), and that these levels slightly fluctuate across time in different regions. However, the amount of tau and Aβ in the hippocampus and middle/inferior temporal cortex (and thus subsequent grey matter loss), linearly increase over time and seems a large contributor to the progressive decrease in cognitive function [9, 12].
A considerable amount of damage, and thus cognitive dysfunction, often occurs years before a clinical diagnosis of AD is made. This is supported by findings where changes in soluble Aβ and tau protein levels are seen in the brain and cerebrospinal fluid (CSF) of individuals long before a confirmed diagnosis of AD, and even before the onset of cognitive symptoms [13]. This mild cognitive impairment (MCI) can be present years before an individual is eventually diagnosed with AD, and while the clinical presentation of AD is often associated with the characteristics present in late(r) stages of the disease such as personality changes and extensive memory loss, MCI individuals already experience difficulties in memory, emotional regulation, speech, executive function, and attention earlier on in the disease process and is thus an earlier stage of the AD clinical continuum [14, 15]. However, not every individual that is diagnosed with MCI will convert to the severe stage of the AD continuum (AD dementia).
Current numbers indicate that annually, around 15%of people with MCI convert to AD dementia [16], and that in total, about 50%of individuals with MCI eventually end up converting to AD dementia [17].
Individuals with mild cognitive symptoms are usually diagnosed with early MCI (EMCI), whereas individuals with more severe symptoms, but not as severe as AD dementia, are labeled as late MCI (LMCI). Diagnosis is often performed after using a battery of cognitive tests, such as the Mini-Mental State Exam (MMSE) that investigates attention, short-term memory, language, and math, with scores ranging between 0–30, and the Wechsler Memory Scale’s Logical Memory II subscale investigating different components such as immediate recall (ImRec) and delayed recall (DelRec) memory performance [18, 19].
The cognitive symptoms occurring in MCI seem to be attributed to grey matter atrophy and decrease in the entorhinal cortex, inferior frontal lobe, hippocampus, amygdala, striatum, parahippocampal gyrus, and insula [20–22]. Furthermore, MCI patients seem to have higher CSF tau levels than cognitively normal (CN) individuals, but lower levels than AD dementia patients [23]. Longitudinal studies indicate that the level of atrophy in the entorhinal cortex and parahippocampal gyrus might predict whether an individual with MCI eventually develops to AD dementia, as well as CSF tau levels [23, 24]. However, cognitive domains such as attention, memory, and executive function are not dependent on hippocampal and temporal functioning alone. Surprisingly, other regions involved in these domains such as the thalamus (attention and executive function) and angular gyrus (attention and memory retrieval) are rarely mentioned in the findings of neuroimaging studies in MCI patients [25–29], despite thalamic function being of crucial importance to cognitive function in the elderly population [30]. The research focus on the medial temporal lobe has contributed to the confirmation of the role of the hippocampus. However, this focus may also have hampered the identification of other brain regions involved in the disease process. It therefore remains unclear whether the absence of findings in areas such as the thalamus is due to certain methodological issues in many of these studies (e.g., focused analysis or small sample size) or a biological phenomenon.
In this study, we aimed to identify brain-wide changes in grey matter over the course of AD progression using a large cohort of individuals in AD dementia, LMCI, EMCI, and CN stages. Using T1-weighted MRI scans, we assessed grey matter volume differences between CN/AD dementia, EMCI/LMCI, LMCI/AD dementia and AD dementia-converters/non-converters to improve the understanding of disease progression in MCI and AD dementia and pinpoint key brain regions in the deterioration of cognitive functioning.
MATERIALS AND METHODS
Participants
Data used in the preparation of this article were obtained from the Alzheimer’s Disease Neuroimaging Initiative (ADNI) database (http://adni.loni.usc.edu). ADNI is currently the biggest longitudinal databank consisting of demographics, multi-modal neuroimaging scans, cognitive battery scores, genetic data, and blood sample data from individuals with AD dementia, MCI types, or CN. Individuals were included in absence of any other neurological disorders than (possible) AD, history of substance use disorder (within the past two years), major depression or bipolar disorder (within the past year), history of schizophrenia, history of cancer (past five years), devices incompatible with MRI scanners, and current use of specific psychoactive medication(s).
Individuals were diagnosed based on several cognitive score components: subjective memory reporting (CN: no memory concerns, EMCI/LMCI/AD dementia: subjective memory concern reported by the individual, individual’s partner, and/or clinician), performance on the Wechsler Memory Scale’s Logical Memory II subscale (of which ImRec and DelRec ability are subsets) with a maximum performance of 25 (CN: > 9 for > 16 years of education, > 5 for 8–15 years of education, > 3 for 0–7 years of education, EMCI: 9–11 for > 16 years of education, 5–9 for > 8–15 years of education, 3–6 for 0–7 years of education, LMCI/AD dementia: < 8 for > 16 years of education, < 4 for 8–15 years of education, < 2 for 0–7 years of education), MMSE performance (CN/EMCI/LMCI: > 24–30, AD dementia: < 20–26, exceptions for these criteria were made for individuals with < 8 years of education at the discretion of an ADNI project director), and a Clinical Dementia Rating (CDR) and its Memory Box (MB) subscore (CN: CDR&MB of 0, EMCI/LMCI: CDR&MB of 0.5, AD dementia: CDR of 0.5–1.0), and lastly the absence of (significant) impairment in cognition and/or daily functioning (for CN diagnosis), general preservation of cognition and daily functioning (for EMCI/LMCI diagnosis) and a National Institute of Neurological and Communicative Disorders and Stroke and the Alzheimer’s Disease and Related Disorders Association (NINCDS/ADRDA) [31] criterium for probable AD (for AD dementia diagnosis).
Due to the size of the ADNI cohort, the full list of inclusion/exclusion criteria and/or diagnostic criteria cannot be described here. For additional exclusion criteria and diagnosis specifics, see ADNI’s procedure manual (https://adni.loni.usc.edu/wp-content/uploads/2008/07/adni2-procedures-manual.pdf). For more up-to-date information, see http://www.adni-info.org. In this study, we included a total of 1,386 individuals which underwent a 3-Tesla T1-weighted magnetic resonance imaging (MRI) structural brain scan at first visit. Statistical differences in individual demographics (age, sex, education level, MMSE, ImRec, and DelRec scores) between groups were assessed in R [32] using a non-parametric Kruskal-Wallis test with an alpha set to < 0.05 and a Benjamini-Hochberg procedure to correct for multiple testing using the false-discovery rate.
Imaging data
T1-weighted structural MRI brain scans of 1386 participants at baseline were used for this project. For information regarding ADNI’s image acquisition protocol (which are different for the many MRI scanner types used in ADNI), see (http://adni.loni.usc.edu/methods/documents/mri-protocols/). The scans were downloaded from (http://adni.loni.usc.edu/data-samples/access-data/) and were already preprocessed with gradwarp correction (correcting for gradient non-linearity), B1 correction (correcting for image intensity non-uniformity), and N3 correction (correcting for additional image intensity deviations) prior to downloading.
For each subject, the image orientations of every T1-weighted MRI scan were normalized to standard AP/SI/LR orientations. Skull-stripping and brain extraction was performed using HD-BET, a GPU-based brain-extraction tool [33]. To extract grey matter maps from the structural data, the voxel-based-morphometry (VBM) pipeline from the Computational Anatomy Toolbox (CAT12 version 12.7: http://www.neuro.uni-jena.de/cat/) for SPM12 (Statistical Parametric Mapping software, Wellcome Trust Centre for Neuroimaging, London, UK) was used in Matlab R2017a (MATLAB and Statistics Toolbox Release 2017a, The MathWorks, Inc., Natick, MA, US). Extracted brains were segmented into grey matter, white matter, and CSF. Total intracranial volume (TIV) of each participant was calculated after segmentation. Extracted grey matter maps were normalized to a 1.5mm Montreal Neurological Institute (MNI) template using DARTEL registration and smoothed with an 8x8x8 full-width at half-maximum (FWHM) Gaussian kernel to enhance the signal to noise ratio.
Statistical analysis of differences in grey matter volume between the different groups was conducted using a two-sample t-test in SPM12 with TIV, age, sex, and education level added as covariates. Since earlier research shows that MMSE scores correlate with brain volume regardless of diagnosis [34], MMSE scores were included as an additional covariate in the analysis. Whole brain voxel-wise statistical comparisons were corrected for multiple comparisons using family-wise-error (FWE) rate correction and are reported at an alpha level of 0.05 and additional 0.01 to account for testing five group comparisons. Results were visualized with bspmviewer (available at https://www.bobspunt.com/software/bspmview/) and FreeSurfer [35].
RESULTS
All demographics of the participants are presented in Table 1. At baseline, there was a significant difference in age between CN (M = 75.0, SD = 5.76) and EMCI (M = 71.0, SD = 7.47), EMCI and LMCI (M = 74.0, SD = 7.43), EMCI and AD dementia (M = 75.6, SD = 7.50), and LMCI and AD dementia (H(3) = 65.86, p < 0.001). A significant difference in education level of CN (M = 16.3, SD = 2.68), EMCI (M = 15.9, SD = 2.64), LMCI (M = 15.9, SD = 2.95), and AD dementia (M = 15.2, SD = 2.95) was found between all groups except for EMCI and LMCI (H(3) = 22.6, p < 0.001). No significant differences were found in sex (H(3) = 3.81, p = 0.28) between the four subgroups.
Table 1
Demographics of 4 diagnosis groups at baseline. Numbers are indicated as means±standard deviations
| AD dementia (n = 239, 122 f) | LMCI (n = 501, 205 f) | EMCI (n = 295, 127 f) | CN (n = 351, 189 f) | |
| Age (y) | 75.4±7.65 | 74.0±6.43 | 71.0±7.47 | 75.0±5.79 |
| Education (y) | 15.1±3.04 | 15.9±2.95 | 15.9±2.64 | 16.3±2.70 |
| MMSE | 23.1±2.02 | 27.1±1.80 | 28.3±1.55 | 29.1±1.13 |
| ImRec | 3.98±2.71 | 7.09±3.14 | 10.9±2.72 | 14.1±3.24 |
| DelRec | 1.35±1.88 | 3.82±2.69 | 8.92±1.74 | 13.3±3.30 |
Statistically significant differences in respectively MMSE, ImRec, and DelRec scores of CN (M = 29.1, SD = 1.13/M = 14.1, SD = 3.24/M = 13.3, SD = 3.30), EMCI (M = 28.3, SD = 1.55/M = 10.9, SD = 2.72/M = 8.92, SD = 1.74), LMCI (M = 27.1, SD = 1.80/M = 7.09, SD = 3.14/M = 3.82, SD = 2.69), and AD dementia (M = 23.1, SD = 2.02/M = 3.98, SD = 2.71/M = 1.35, SD = 1.88) were found between all groups (H(3) = 703.01, p < 0.001/H(3) = 837.66, p < 0.001/H(3) = 1071.10, p < 0.001). In the MCI participant sample, 596 of the initial 796 individuals had a 2-year follow-up label of either AD dementia or MCI. We found no significant differences between patients that converted to AD dementia (n = 171) or not (n = 425) in age (H(1) = 3.88, p =0.05), sex (H(1) < 0.01, p = 0.93) or education level (H(1) = 3.68, p = 0.06). Respective MMSE, ImRec, and DelRec scores of non-converters (M = 28.0, SD =1.69/M = 9.30, SD = 3.10/M = 6.69, SD = 3.16) and AD dementia-converters (M = 26.70, SD = 1.65/M = 6.54, SD = 3.24/M = 3.20, SD = 2.76) already differed significantly at baseline (H(1) = 70.4, p < 0.001/H(1) = 79.27, p < 0.001/H(1) = 123.12, p < 0.001).
Neuroimaging
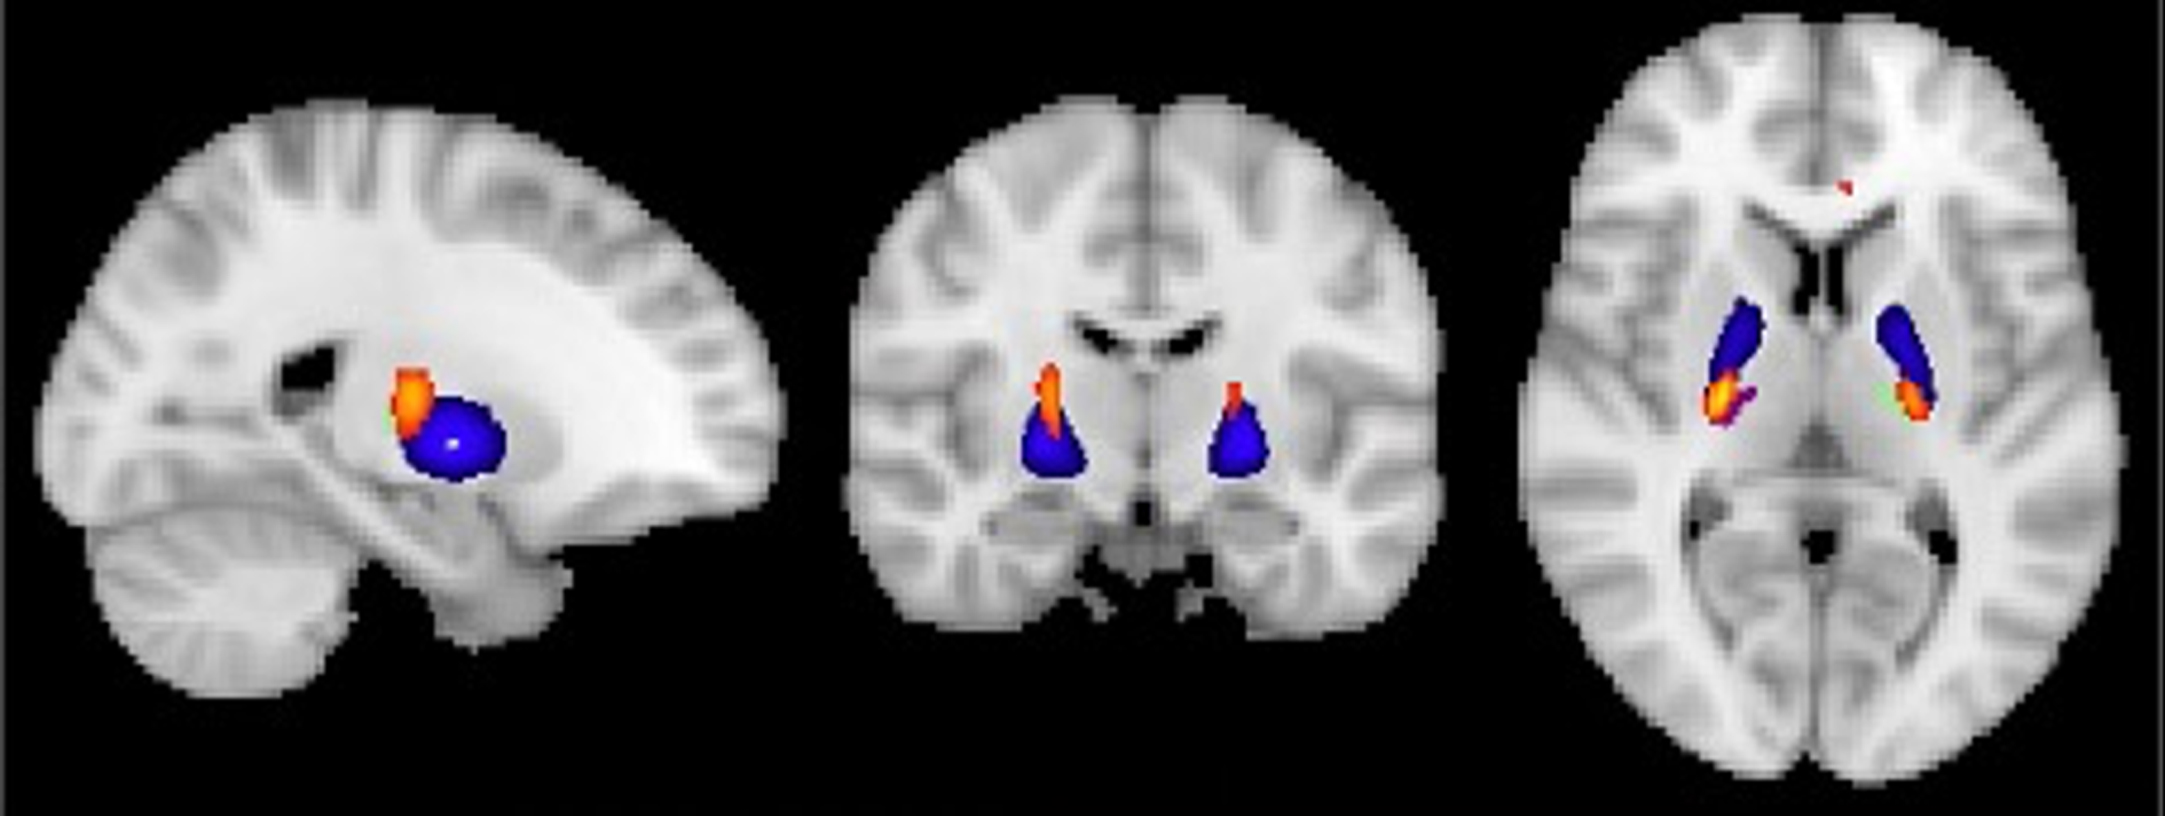
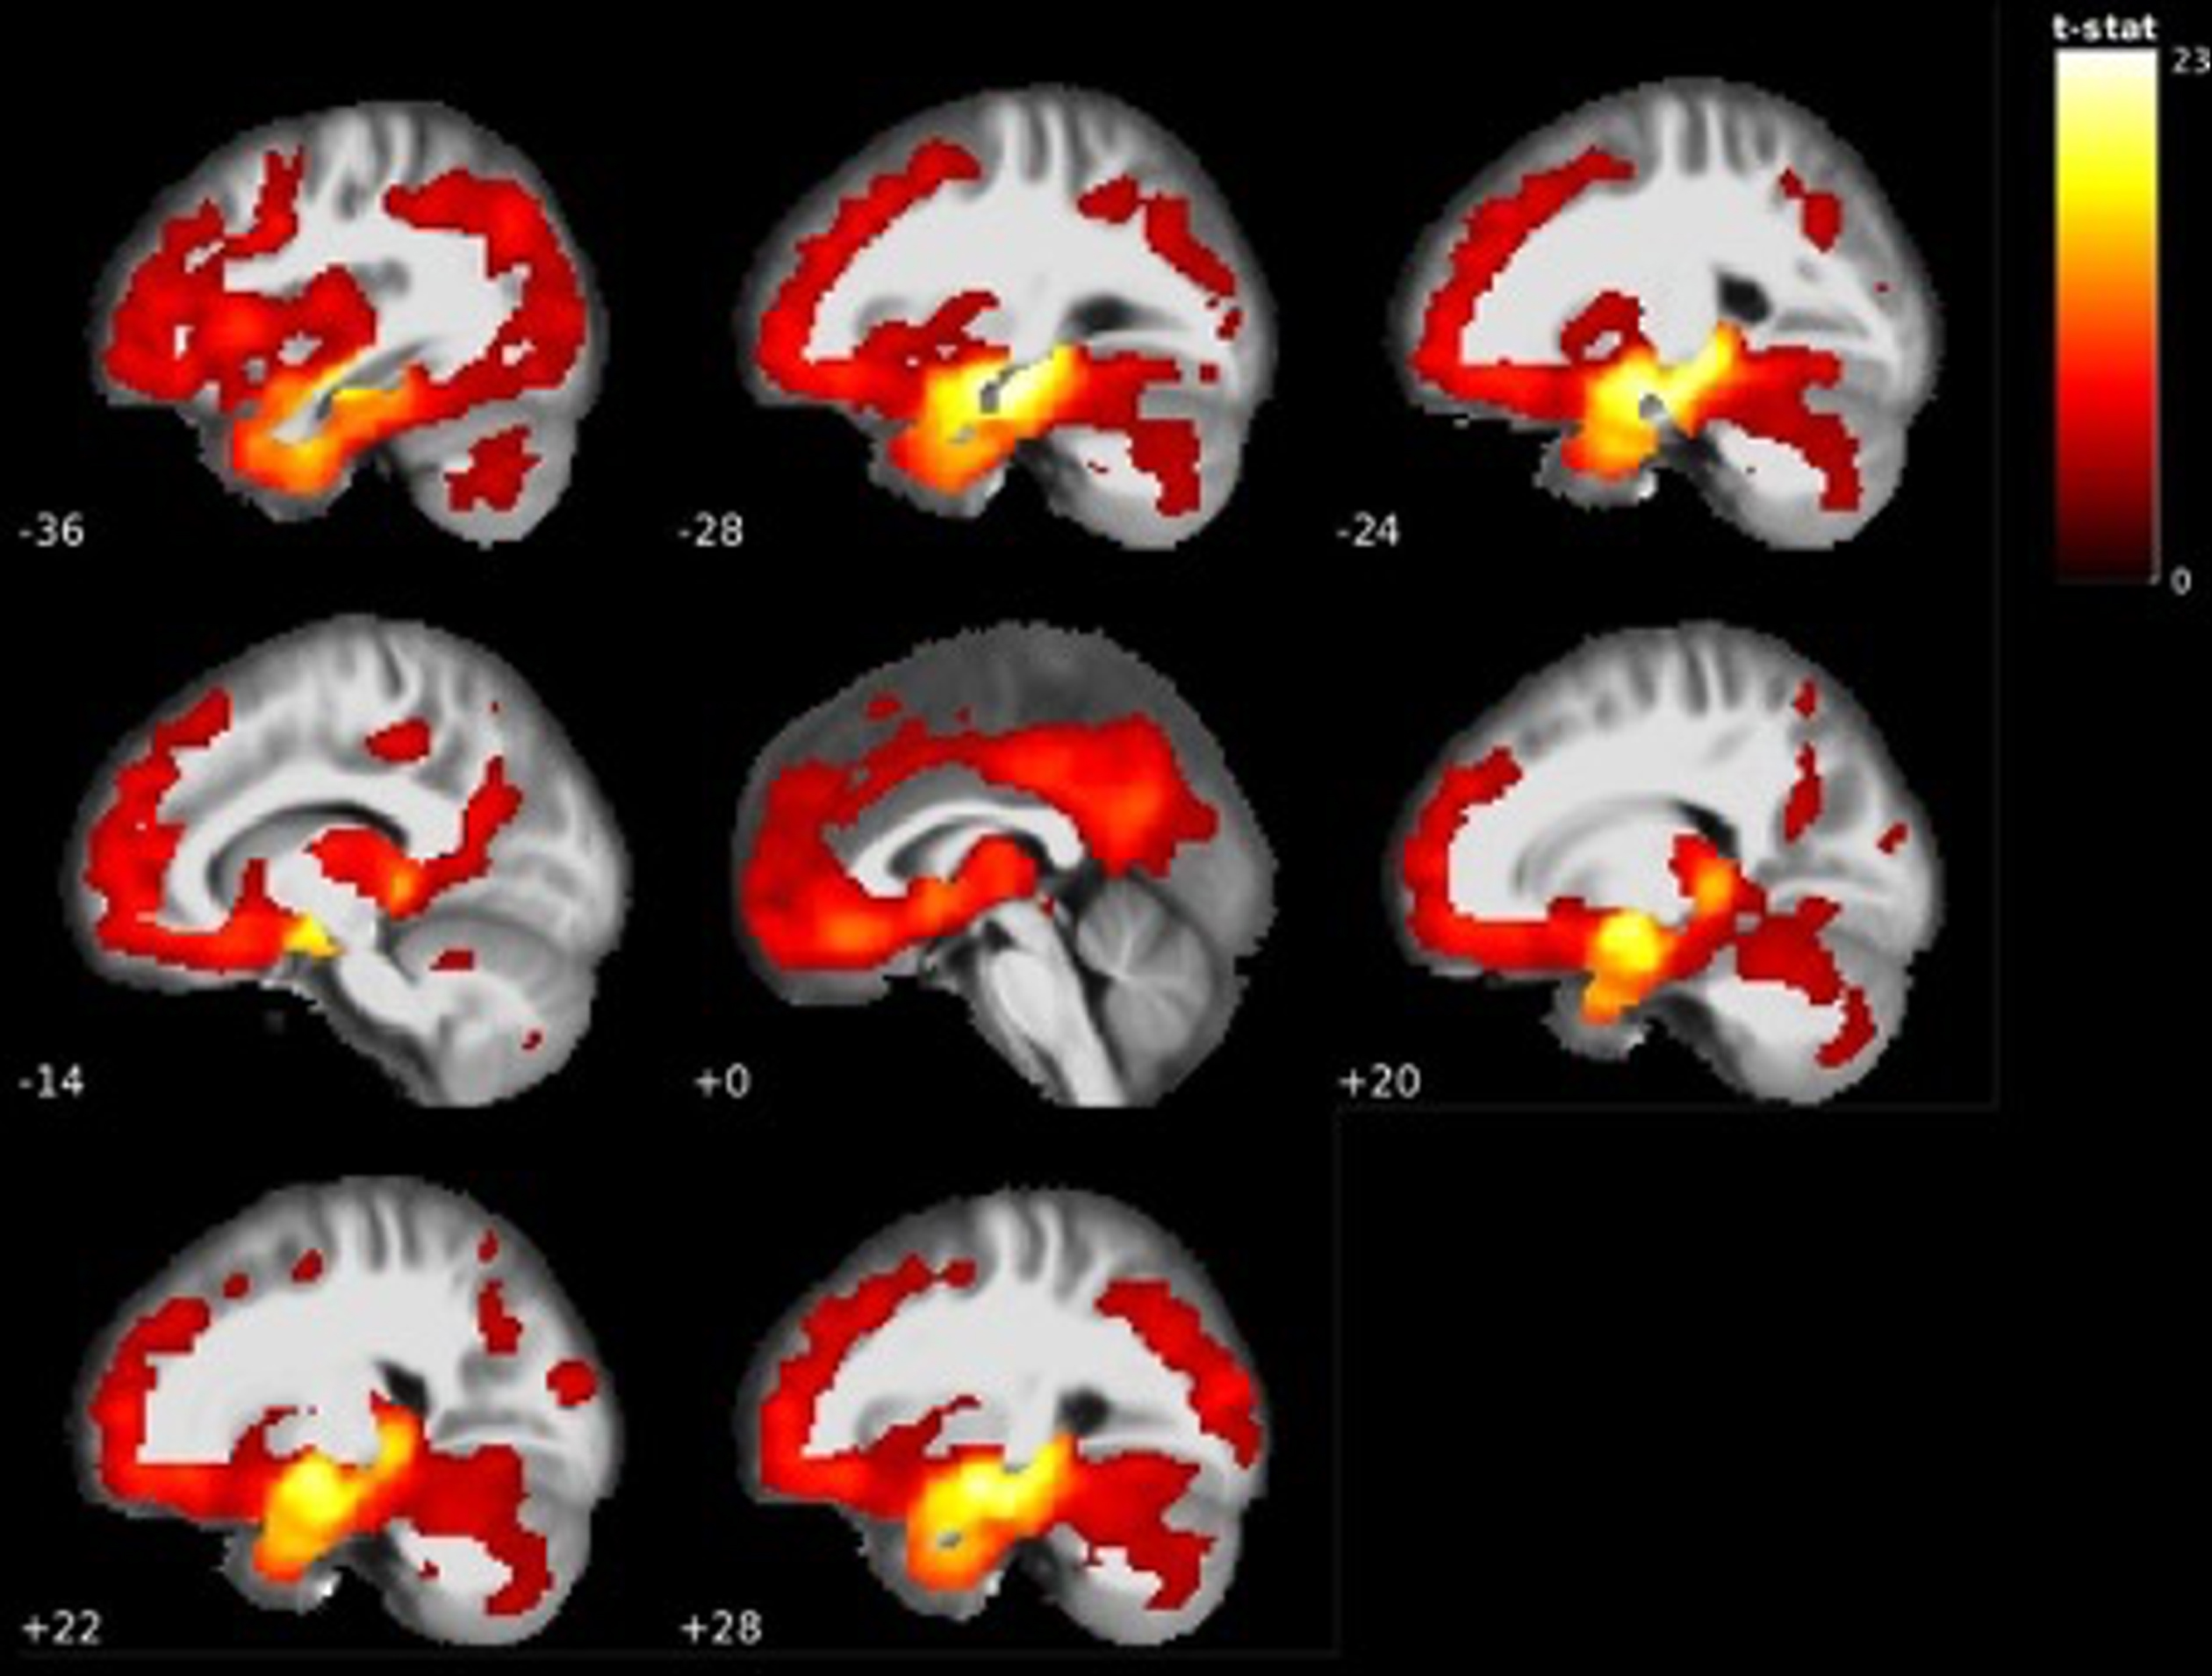
In the VBM analysis between CN and the earliest clinical stage of the AD continuum (EMCI), individuals with EMCI showed significantly reduced grey matter volume in two moderately large clusters compared to the CN group. One cluster surrounded the grey matter in the bilateral ventrolateral thalamus extending to the bilateral globus pallidus, with another cluster in the orbitofrontal cortex extending to the cingulate cortex. An additional smaller cluster was found in the cerebellum (see Fig. 1 and Table 2). Thalamic results in EMCI < CN were visualized using the Talairach structural atlas [36–38] and FreeSurfer (see Fig. 2).
Fig. 1
Visualization of grey matter volume reductions in EMCI < CN. Reductions centered around the bilateral ventrolateral thalamus, orbitofrontal cortex, anterior cingulate cortex and cerebellum. MNI coordinate along the x-axis indicated in white. Lighter colors indicate higher t-values (see Table 2).
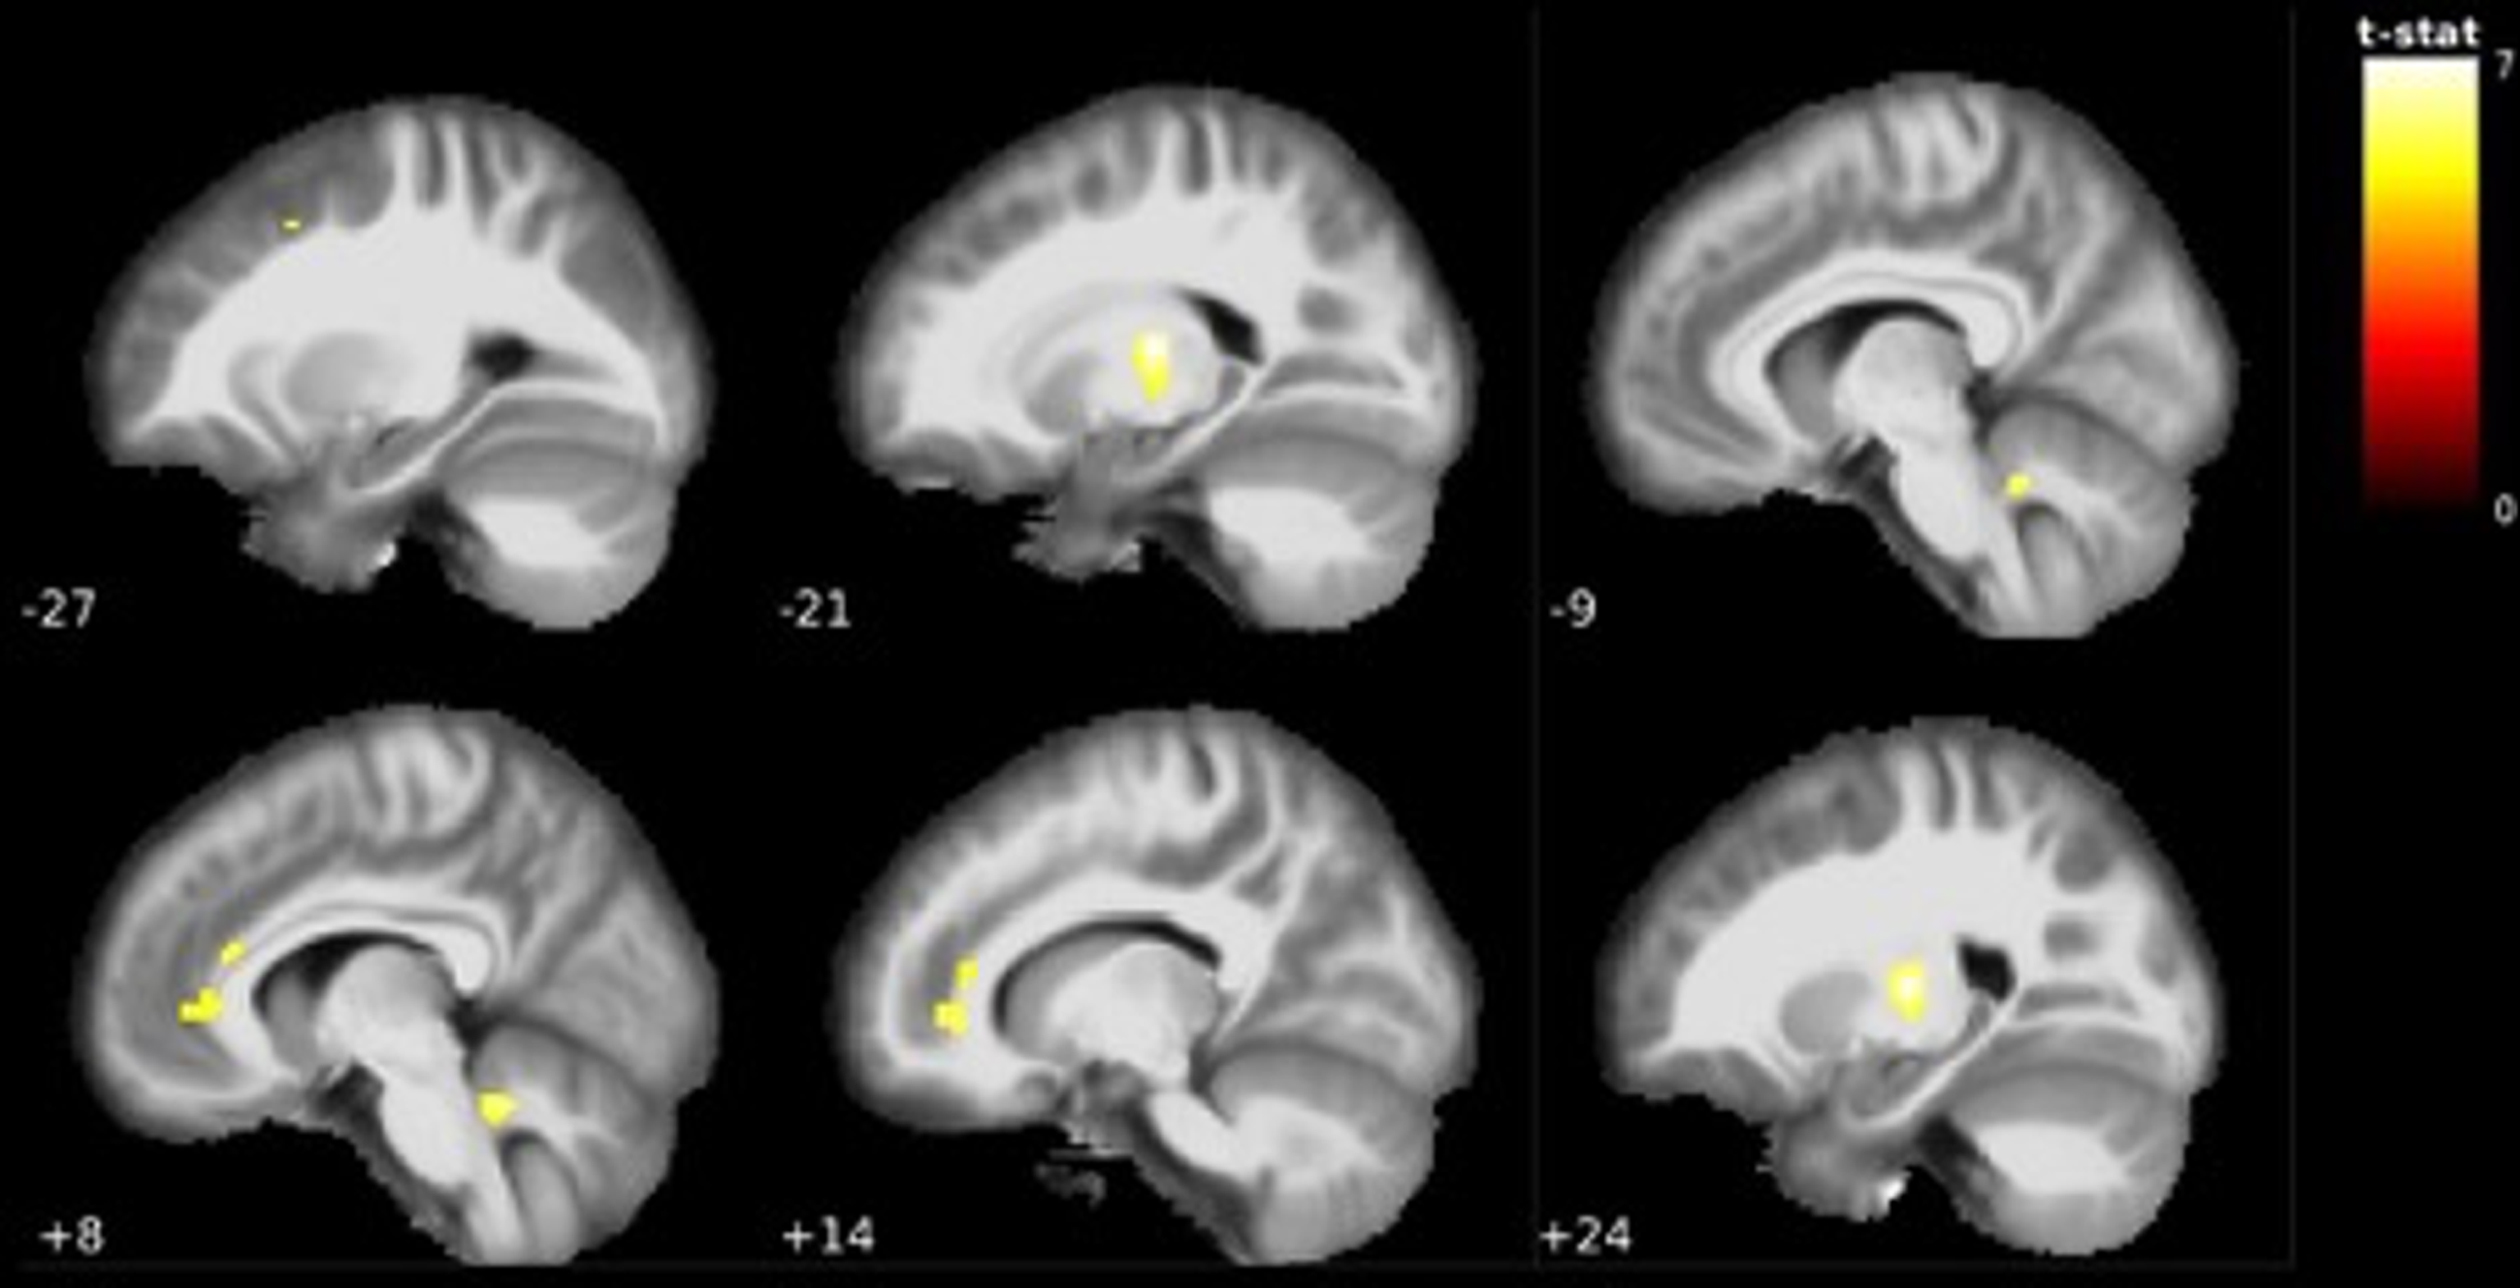
Table 2
Regions with reduced grey matter volume in EMCI < CN. Table includes corresponding brain regions according to Automated Anatomical Labeling (AAL), FWE-corrected p-value, extent (cluster size in number of voxels), statistical t-value, and MNI-coordinates. Brain regions with or without additional Bonferroni correction for five tests are reported
| MNI coordinates (mm) | ||||||
| Brain region (AAL) | p (FWE-corr) | Extent | t-value | x | y | z |
| Thalamus_R | < 0.001 | 267 | 7.14 | 24 | –16 | 8 |
| Thalamus_L | < 0.001 | 274 | 7.11 | –21 | –16 | 10 |
| Thalamus_L | 0.005 | 5.45 | –15 | –14 | –4 | |
| Vermis_10 | < 0.001 | 115 | 6.43 | 8 | –46 | –27 |
| Cerebelum_9_L | < 0.001 | 84 | 6.42 | –9 | –48 | –27 |
| Frontal_Med_Orb_R | < 0.001 | 549 | 6.18 | 14 | 39 | –2 |
| Cingulum_Ant_L | < 0.001 | 5.98 | 0 | 36 | 3 | |
| Cingulum_Ant_R | 0.001 | 5.88 | 10 | 33 | 14 | |
| Frontal_Mid_L | 0.005 | 7 | 5.44 | –27 | 12 | 45 |
| Thalamus_L | 0.014 | 228 | 6.63 | –21 | –16 | 9 |
Fig. 2
Visualization of GM volume reduction cluster (yellow/orange) in EMCI < CN located in the bilateral ventrolateral thalamus (green/purple) and globus pallidus (blue) according to the Talairach and Harvard-Oxford structural atlas.
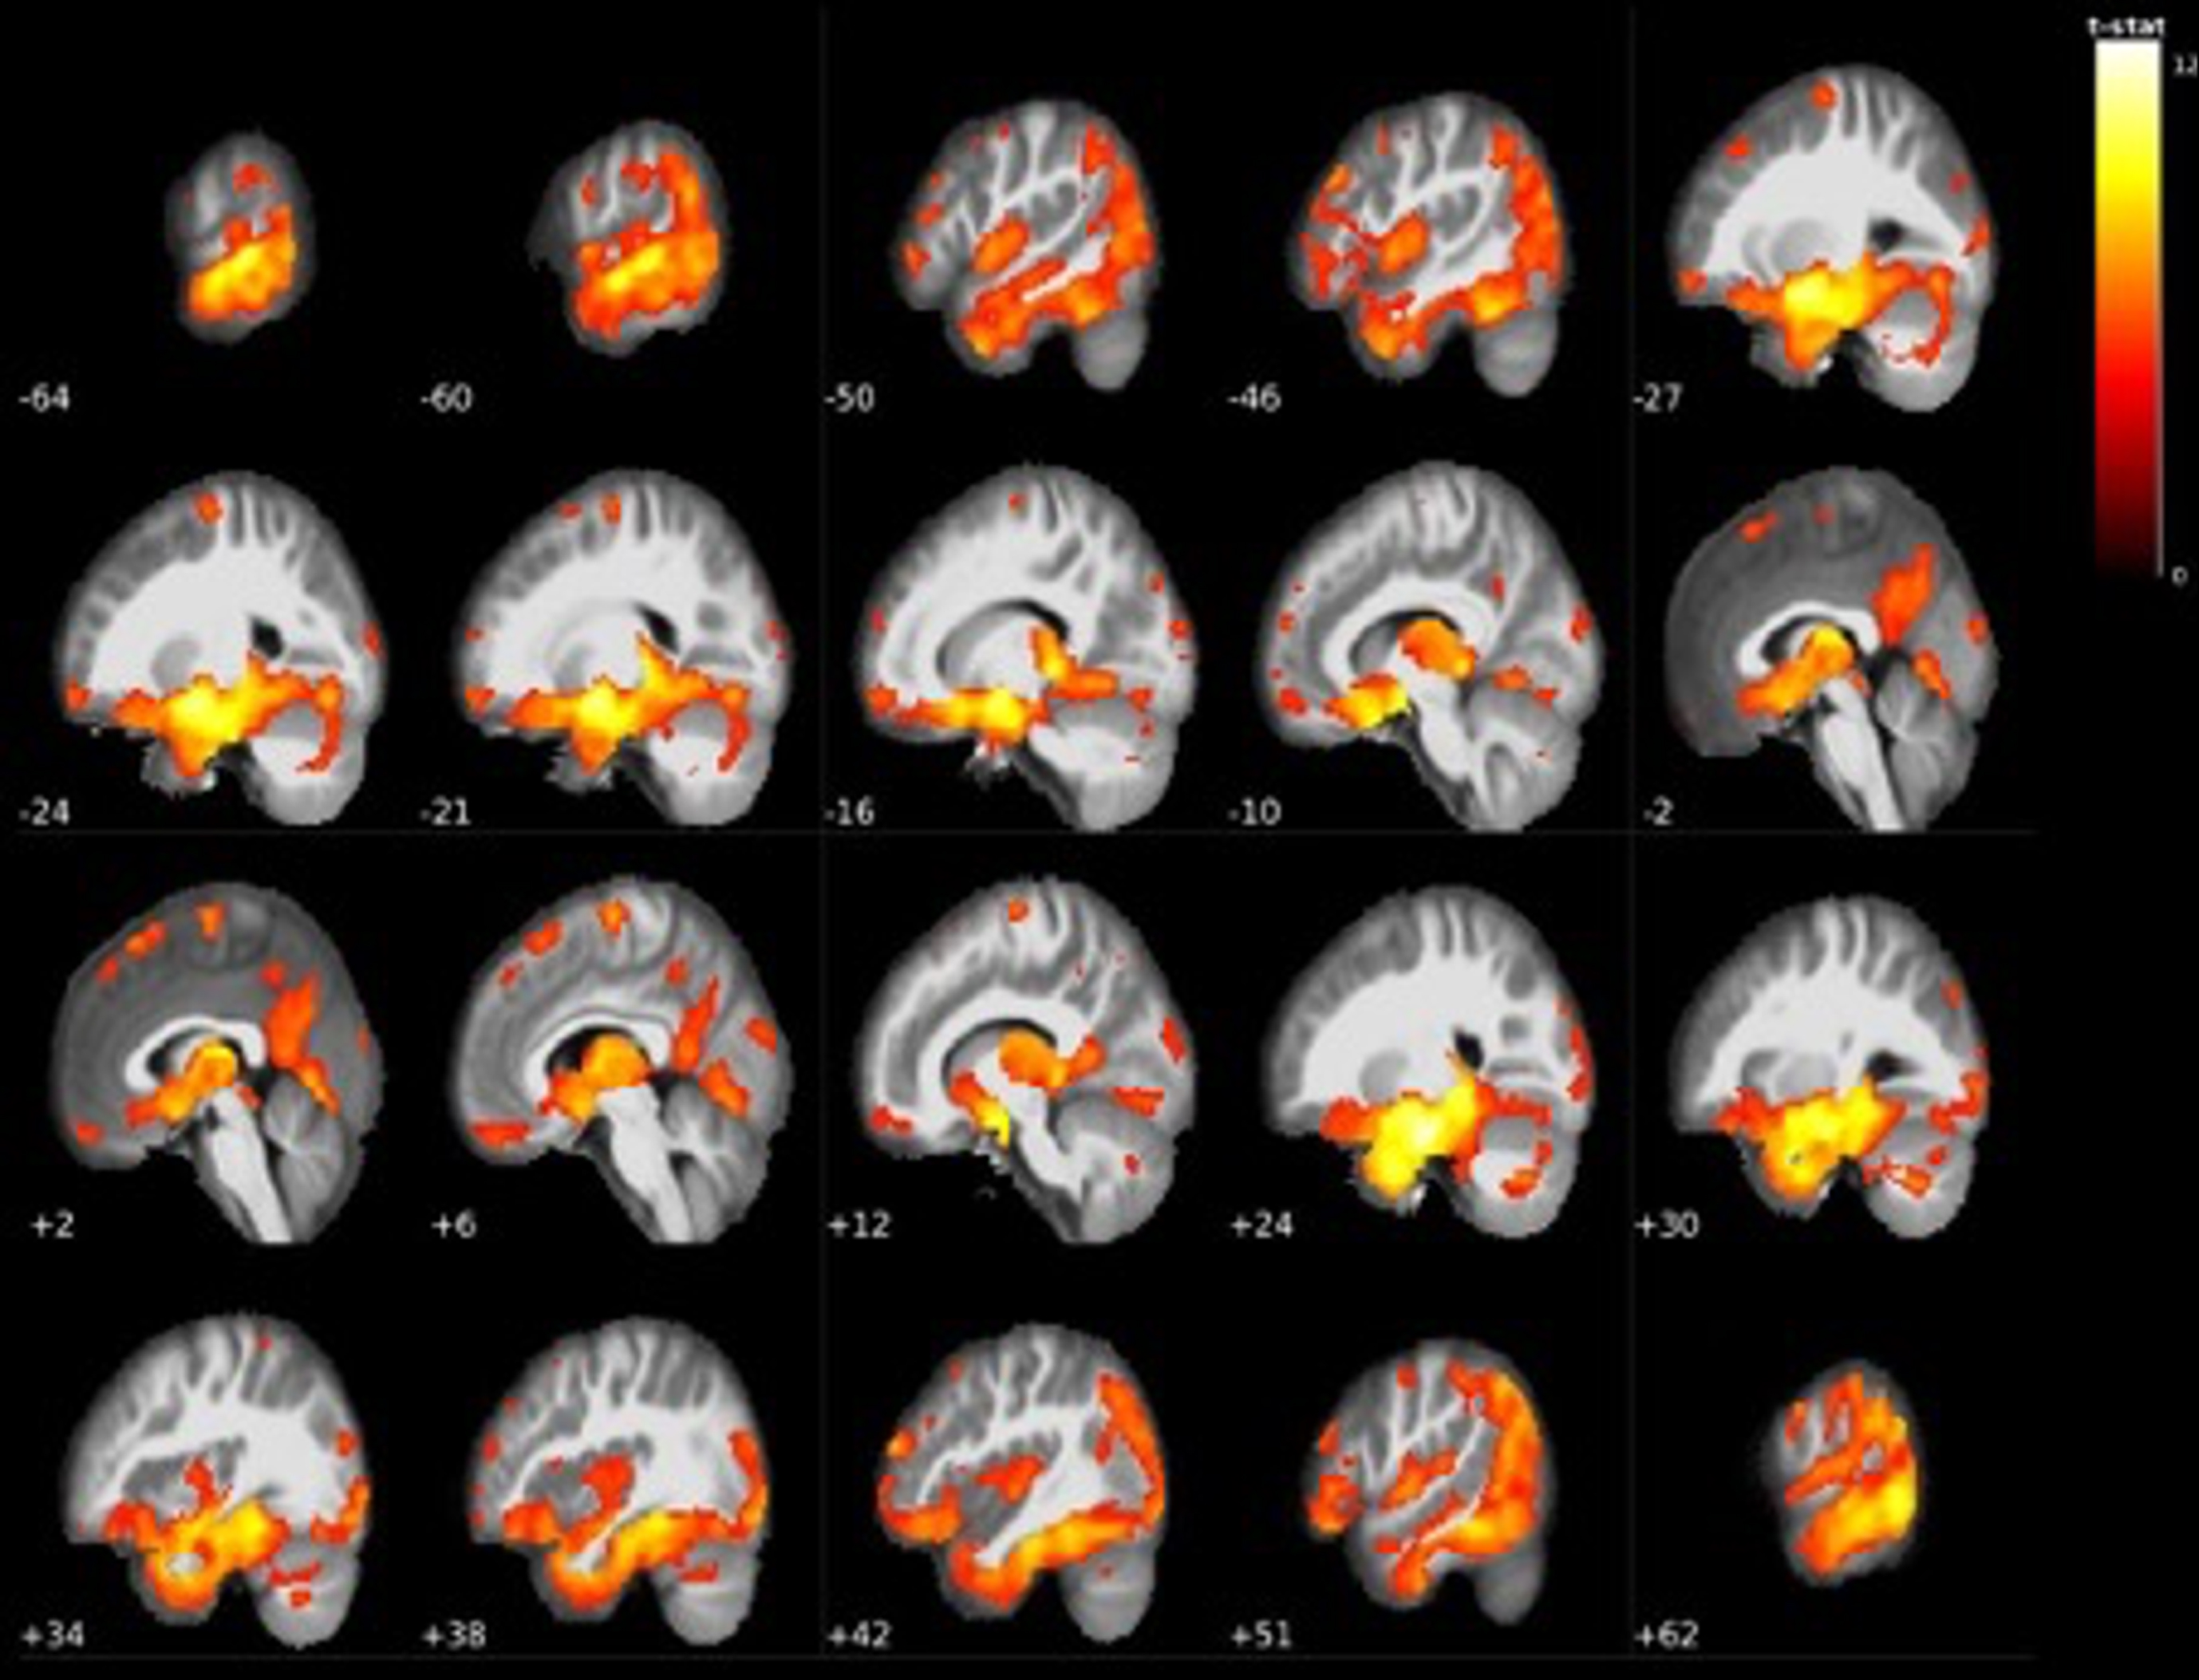
Further along the continuum of cognitive decline, the VBM analysis between EMCI and LMCI groups showed significant grey matter volume reductions in many areas throughout the brain in the LMCI group. The largest cluster contained 123546 voxels of grey matter in the right parahippocampal gyrus, left amygdala, and left medial temporal lobe, which extended to the entire bilateral thalamic region. Other widespread grey matter reductions were found in superior and inferior frontal areas such as the bilateral midfrontal gyrus, supplementary motor area, precentral gyrus and the orbitofrontal cortex, with additional findings in the cerebellum and occipital cortex (see Table 3 and Fig. 3 for all findings).
Table 3
Regions with reduced grey matter volume in LMCI < EMCI.
| MNI coordinates (mm) | ||||||
| Brain region (AAL) | p (FWE-corr) | Extent | t-value | x | y | z |
| ParaHippocampal_R | < 0.001 | 123546 | 12.54 | 24 | –15 | –26 |
| Amygdala_L | 11.2 | –24 | –2 | –16 | ||
| Temporal_Mid_L | 11.12 | –64 | –32 | –2 | ||
| Frontal_Mid_R | < 0.001 | 710 | 8.34 | 44 | 52 | 20 |
| Frontal_Mid_R | 7.43 | 50 | 42 | 24 | ||
| Supp_Motor_Area_R | < 0.001 | 620 | 7.7 | 6 | –14 | 72 |
| Postcentral_R | < 0.001 | 576 | 6.98 | 62 | –2 | 39 |
| Precentral_R | 5.79 | 56 | –6 | 48 | ||
| Precentral_R | 5.79 | 62 | 3 | 26 | ||
| Frontal_Sup_Medial_R | < 0.001 | 832 | 6.72 | 2 | 27 | 60 |
| Supp_Motor_Area_R | 6.09 | 2 | 16 | 64 | ||
| Frontal_Sup_Medial_R | 5.54 | 3 | 42 | 48 | ||
| Precentral_L | < 0.001 | 429 | 6.67 | –26 | –15 | 68 |
| Precentral_L | < 0.001 | 65 | 6.15 | –46 | 8 | 51 |
| Vermis_3 | 0.002 | 84 | 6.09 | –2 | –28 | –6 |
| Vermis_3 | 5.87 | 0 | –36 | –9 | ||
| Frontal_Mid_R | 0.002 | 55 | 6.06 | 42 | 21 | 54 |
| Precentral_L | < 0.001 | 146 | 5.88 | –60 | 0 | 26 |
| Postcentral_L | 5.04 | –60 | –3 | 36 | ||
| Frontal_Mid_L | < 0.001 | 276 | 5.87 | –27 | 33 | 44 |
| Frontal_Mid_L | 5.54 | –36 | 27 | 46 | ||
| Occipital_Sup_R | 0.001 | 62 | 5.81 | 30 | –82 | 39 |
| Frontal_Sup_Medial_L | < 0.001 | 212 | 5.74 | –10 | 60 | 18 |
| Frontal_Sup_L | 5.44 | –18 | 62 | 21 | ||
| Occipital_Sup_L | 0.001 | 48 | 5.73 | –16 | –88 | 38 |
| Postcentral_R | 0.002 | 29 | 5.64 | 34 | –39 | 68 |
| Frontal_Inf_Tri_R | 0.001 | 54 | 5.57 | 51 | 26 | 14 |
| Frontal_Sup_L | 0.002 | 45 | 5.5 | –21 | 10 | 69 |
| Frontal_Inf_Oper_R | 0.001 | 52 | 5.36 | 39 | 18 | 12 |
| Frontal_Med_Orb_L | 0.002 | 55 | 5.33 | –9 | 64 | –3 |
| Frontal_Mid_R | 0.005 | 14 | 5.22 | 38 | 44 | 38 |
| Precentral_L | 0.002 | 40 | 5.2 | –50 | –4 | 52 |
| Frontal_Sup_Medial_L | 0.003 | 28 | 5.16 | –9 | 54 | 33 |
| Postcentral_L | 0.006 | 8 | 5.08 | –63 | –16 | 24 |
| Parietal_Sup_R | 0.006 | 6 | 5.07 | 12 | –69 | 52 |
| Cerebelum_6_L | 0.009 | 2 | 4.99 | –27 | –46 | –36 |
| Rolandic_Oper_R | 0.009 | 1 | 4.97 | 39 | –18 | 26 |
| Rolandic_Oper_R | 0.024 | 38 | 4.97 | 39 | –18 | 26 |
| Frontal_Sup_R | 0.022 | 15 | 4.95 | 21 | 3 | 66 |
| Frontal_Mid_L | 0.026 | 13 | 4.91 | –36 | 42 | 38 |
| Postcentral_L | 0.029 | 13 | 4.86 | –40 | –34 | 64 |
| Hippocampus_R | 0.046 | 1 | 4.79 | 42 | –24 | –8 |
| Precentral_L | 0.036 | 5 | 4.78 | –28 | –24 | 74 |
| Frontal_Sup_R | 0.034 | 6 | 4.75 | 26 | 68 | 9 |
| Paracentral_Lobule_R | 0.03 | 11 | 4.75 | 0 | –34 | 60 |
| Caudate_R | 0.042 | 18 | 4.69 | 18 | 2 | 20 |
| Frontal_Mid_L | 0.047 | 1 | 4.67 | –38 | 20 | 57 |
| Calcarine_L | 0.029 | 11 | 4.64 | –2 | –94 | 2 |
| Calcarine_L | 0.044 | 2 | 4.63 | 3 | –78 | 16 |
| Cerebelum_3_L | 0.043 | 1 | 4.62 | –6 | –36 | –10 |
| Paracentral_Lobule_R | 0.042 | 4 | 4.62 | 15 | –30 | 50 |
| Caudate_R | 0.048 | 1 | 4.62 | 22 | 9 | 16 |
Fig. 3
Widespread grey matter volume reductions in LMCI < EMCI. The largest cluster centered around the bilateral mediotemporal gyri, hippocampus, and entire thalamus (see Table 3).
Comparing these LMCI individuals to AD dementia revealed that AD dementia individuals had further reductions in grey matter volumes compared to LMCI. Reductions were again mostly centered around the right amygdala and surrounding areas (with a very minor cluster extending to the most ventral part of the posterior thalamus), as well as the left hippocampus. bilateral inferior temporal gyri, while also showing reductions in the left rectal gyrus, left precuneus, left angular gyrus, inferior parietal lobule, and inferior occipital regions (see Table 4 and Fig. 4).
Table 4
Regions with reduced grey matter volume in AD dementia < LMCI
| MNI coordinates (mm) | ||||||
| Brain region (AAL) | p (FWE-corr) | Extent | t-value | x | y | z |
| Amygdala_R | < 0.001 | 13392 | 8.32 | 24 | –6 | –12 |
| Fusiform_R | < 0.001 | 7.98 | 34 | –3 | –36 | |
| Temporal_Inf_R | < 0.001 | 7.76 | 46 | –4 | –40 | |
| Hippocampus_L | < 0.001 | 7199 | 7.54 | –30 | –9 | –16 |
| Hippocampus_L | < 0.001 | 7.5 | –33 | –24 | –12 | |
| Hippocampus_L | < 0.001 | 7.47 | –27 | –30 | –9 | |
| Parietal_Inf_R | < 0.001 | 206 | 6.37 | 39 | –44 | 39 |
| Precuneus_L | < 0.001 | 846 | 6.29 | –6 | –57 | 18 |
| Occipital_Inf_L | < 0.001 | 1753 | 6.06 | –50 | –62 | –14 |
| Temporal_Inf_L | < 0.001 | 5.96 | –57 | –38 | –20 | |
| Fusiform_L | < 0.001 | 5.76 | –42 | –58 | –15 | |
| Rectus_L | < 0.001 | 749 | 5.92 | 0 | 34 | –15 |
| Parietal_Inf_L | 0.001 | 310 | 5.53 | –40 | –46 | 48 |
| Angular_L | 0.001 | 119 | 5.48 | –45 | –54 | 24 |
| Temporal_Inf_R | 0.001 | 42 | 5.41 | 48 | –66 | –6 |
| Temporal_Mid_L | 0.002 | 98 | 5.36 | –52 | 2 | –24 |
| Occipital_Mid_R | 0.002 | 42 | 5.29 | 33 | –87 | 8 |
| Occipital_Inf_R | 0.003 | 48 | 5.21 | 44 | –81 | –4 |
| Occipital_Mid_R | 0.004 | 37 | 5.16 | 46 | –72 | 30 |
| Temporal_Mid_L | 0.005 | 11 | 5.09 | –58 | –6 | –14 |
| Precuneus_R | 0.005 | 16 | 5.08 | 10 | –54 | 50 |
| Precuneus_R | 0.009 | 4.98 | 8 | –50 | 40 | |
| Cingulum_Mid_R | 0.006 | 10 | 5.07 | 6 | –34 | 42 |
| Frontal_Mid_R | 0.007 | 8 | 5.04 | 33 | 42 | 22 |
| Frontal_Mid_R | 0.008 | 7 | 5 | 27 | 54 | 8 |
| Occipital_Inf_L | 0.009 | 2 | 4.97 | –44 | –78 | –3 |
| Pallidum_R | 0.01 | 1 | 4.96 | 8 | 3 | –3 |
| Angular_L | 0.01 | 2 | 4.96 | –44 | –70 | 33 |
| Frontal_Mid_R | 0.012 | 48 | 5.04 | 33 | 42 | 22 |
| Frontal_Mid_R | 0.01 | 109 | 5 | 27 | 54 | 8 |
| Occipital_Inf_L | 0.015 | 44 | 4.97 | –44 | –78 | –3 |
| Pallidum_R | 0.018 | 52 | 4.96 | 8 | 3 | –3 |
| Frontal_Sup_R | 0.025 | 12 | 4.88 | 16 | 50 | 36 |
| Frontal_Sup_Orb_R | 0.029 | 43 | 4.88 | 21 | 39 | –12 |
| Frontal_Mid_L | 0.019 | 29 | 4.84 | –24 | 36 | 30 |
| Precentral_R | 0.022 | 30 | 4.8 | 39 | 4 | 38 |
| Heschl_R | 0.021 | 29 | 4.78 | 52 | –16 | 9 |
| SupraMarginal_L | 0.019 | 26 | 4.77 | –52 | –21 | 26 |
| Cingulum_Ant_R | 0.03 | 19 | 4.72 | 9 | 46 | 3 |
| Frontal_Mid_Orb_L | 0.034 | 25 | 4.7 | –27 | 36 | –12 |
| Cerebelum_Crus2_L | 0.042 | 5 | 4.64 | –36 | –74 | –42 |
| Temporal_Mid_L | 0.041 | 4 | 4.59 | –48 | –63 | 14 |
Fig. 4
Additional grey matter volume reductions centered mostly around temporal areas in AD dementia < LMCI (see Table 4).
The largest grey matter differences were found in the baseline scans of AD dementia patients compared to CN. Grey matter in a large cluster of 228892 voxels surrounding the bilateral hippocampus, temporal lobes, entire thalamus, and extending to many areas in frontal, temporal, and parietal areas was significantly reduced in AD dementia. Besides this cluster, an additional moderately large cluster in the right superior parietal lobe and a minor cluster in the cerebellum was reduced. Results are presented in Table 5 and Fig. 5.
Table 5
Regions with reduced grey matter volume in AD dementia < CN
| MNI coordinates (mm) | ||||||
| Brain Region (AAL) | p (FWE-corr) | Extent | t-value | x | y | z |
| Hippocampus_R | < 0.001 | 228892 | 23.47 | –28 | –10 | –16 |
| ParaHippocampal_L | 22.68 | –27 | –21 | –20 | ||
| Hippocampus_R | 22.2 | 28 | –9 | –16 | ||
| Parietal_Sup_R | < 0.001 | 108 | 6.02 | 20 | –63 | 62 |
| Vermis_3 | 0.009 | 18 | 5.5 | 0 | –30 | –6 |
| Pallidum_R | 0.009 | 1 | 5.06 | 22 | –6 | 8 |
| Parietal_Sup_R | 0.007 | 4 | 5.05 | –14 | –66 | 60 |
| Cerebelum_8_L | 0.009 | 1 | 5.03 | –24 | –46 | –44 |
| Cerebelum_Crus1_L | 0.009 | 1 | 5.01 | –27 | –75 | –22 |
| Vermis_3 | 0.044 | 18 | 5.5 | 0 | –30 | –6 |
| Parietal_Sup_L | 0.016 | 23 | 4.99 | –22 | –56 | 70 |
| Precentral_R | 0.03 | 12 | 4.83 | 36 | –21 | 52 |
| Vermis_3 | 0.043 | 2 | 4.74 | 0 | –38 | –10 |
| Occipital_Mid_L | 0.045 | 1 | 4.63 | –21 | –96 | 10 |
Fig. 5
GM volume reductions in temporal, frontal, parietal and cerebellar areas in AD dementia < CN (see Table 5).
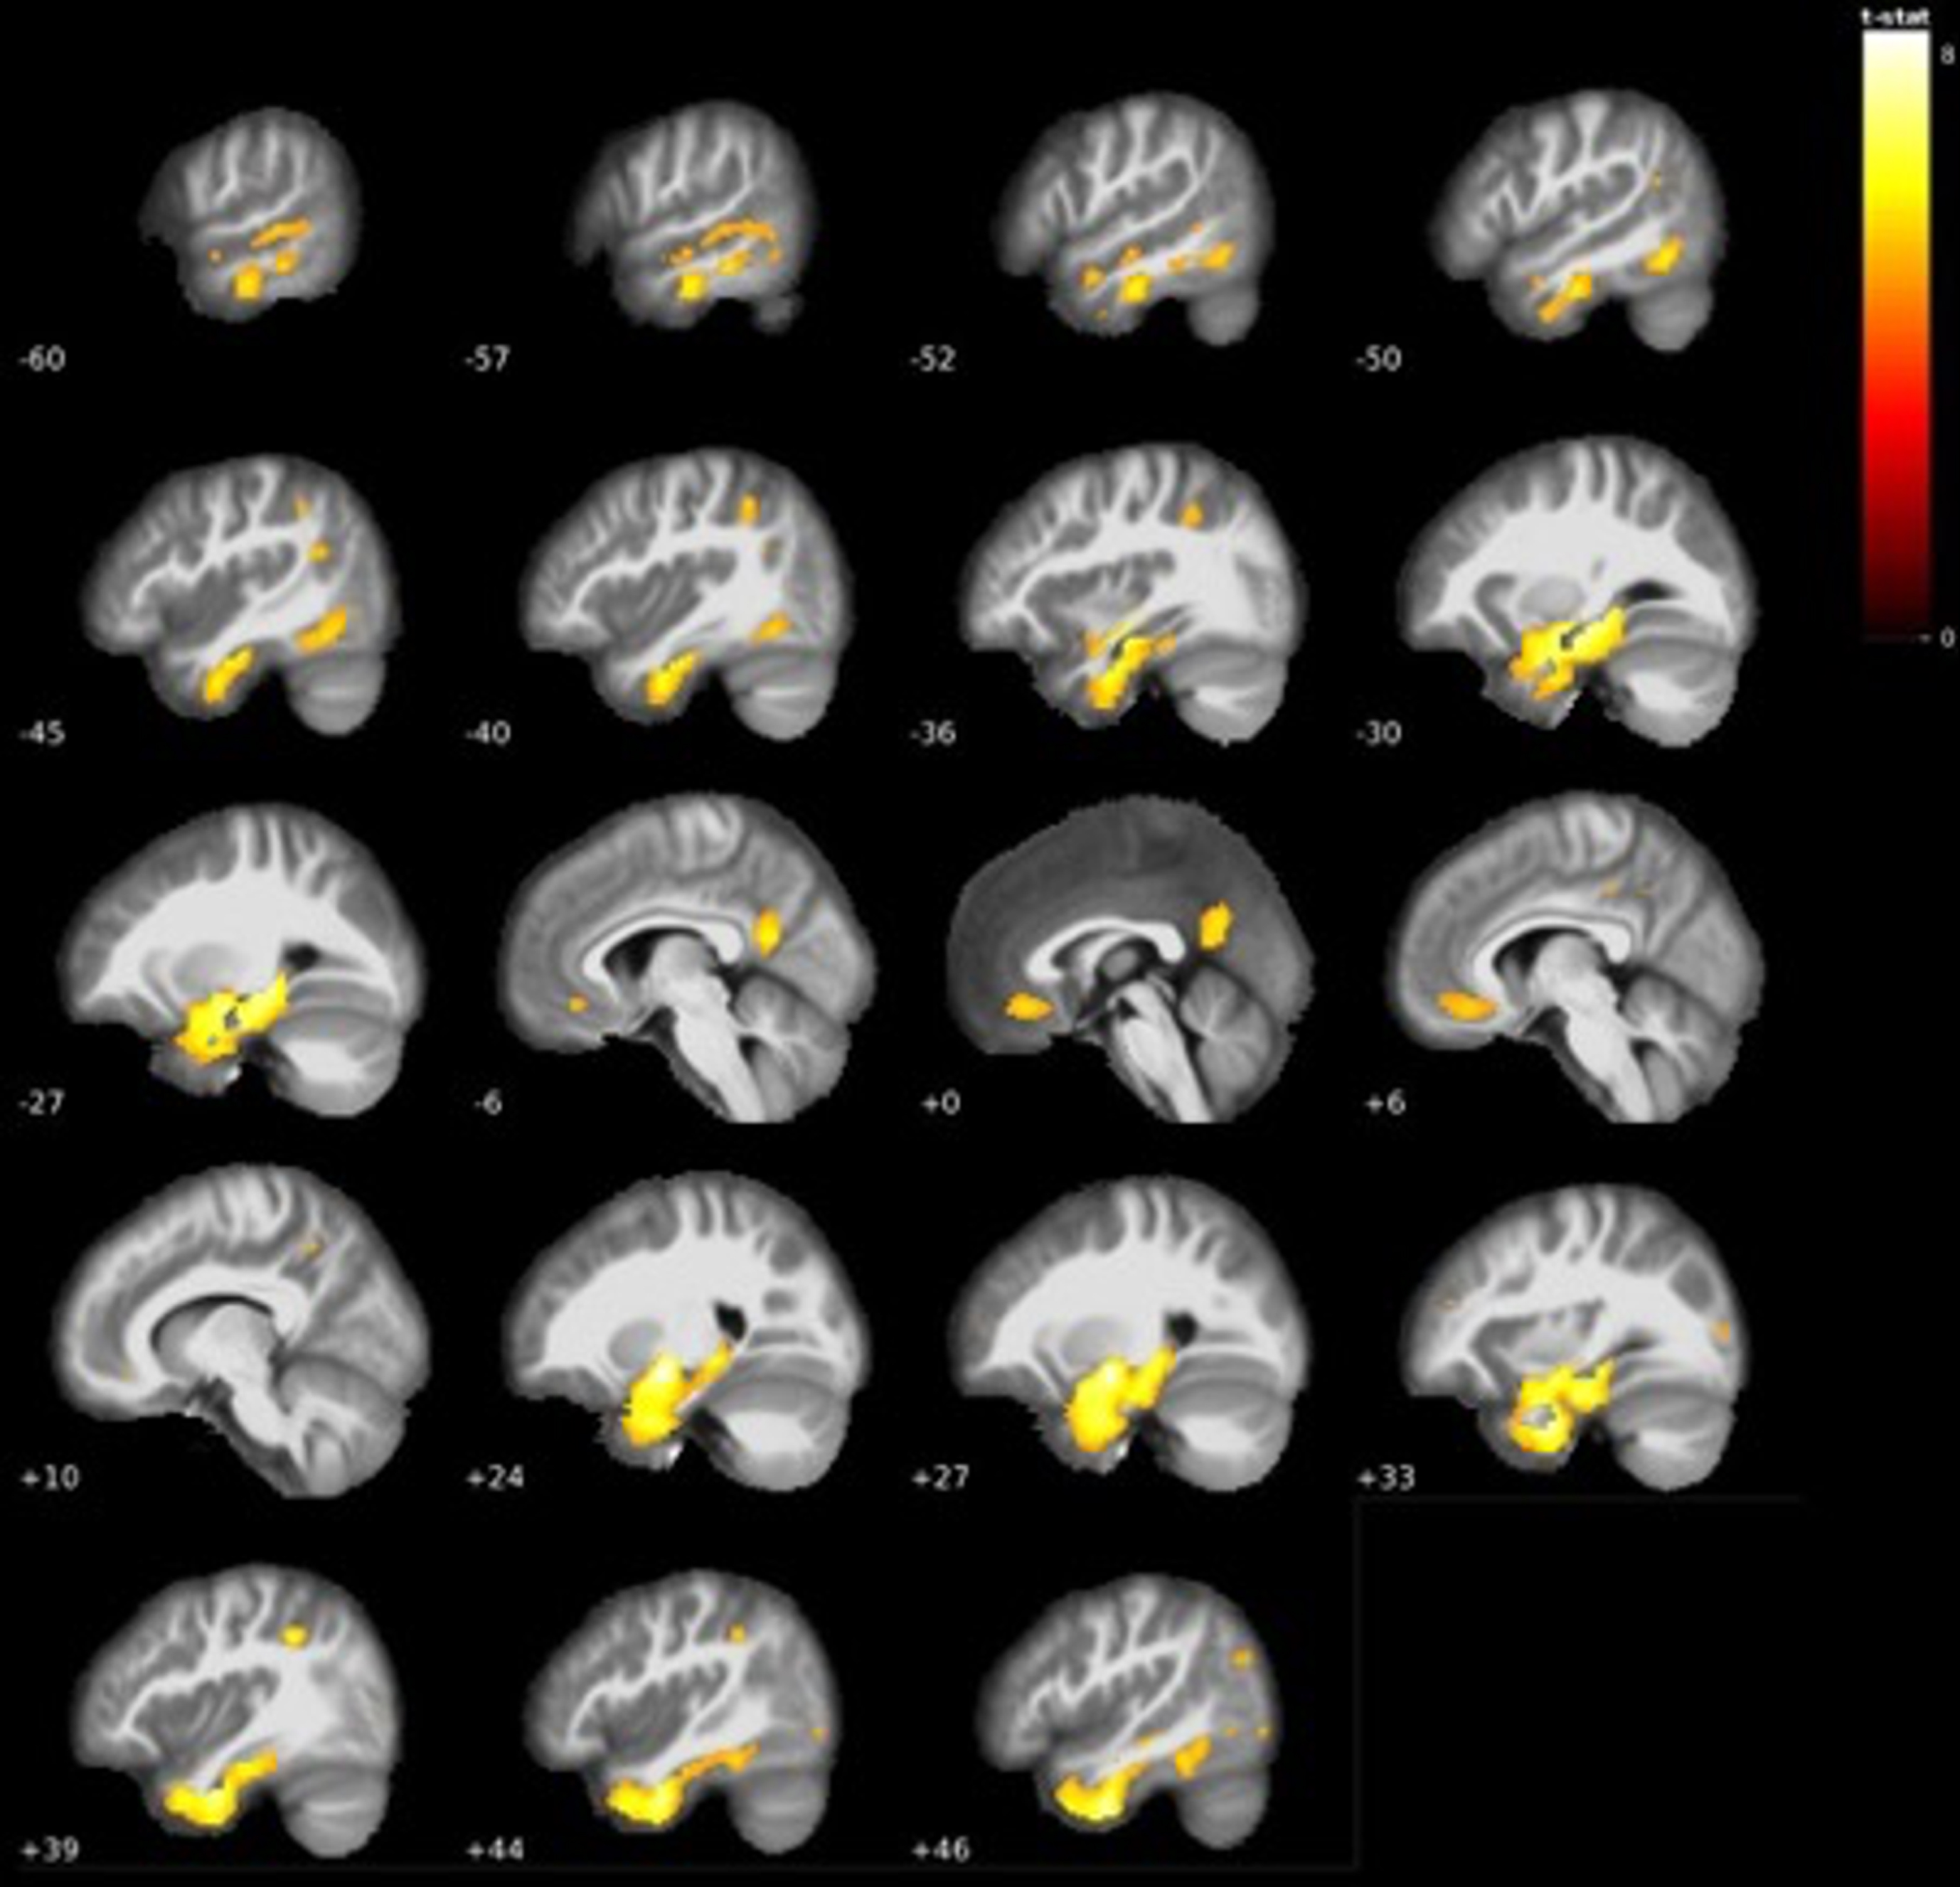
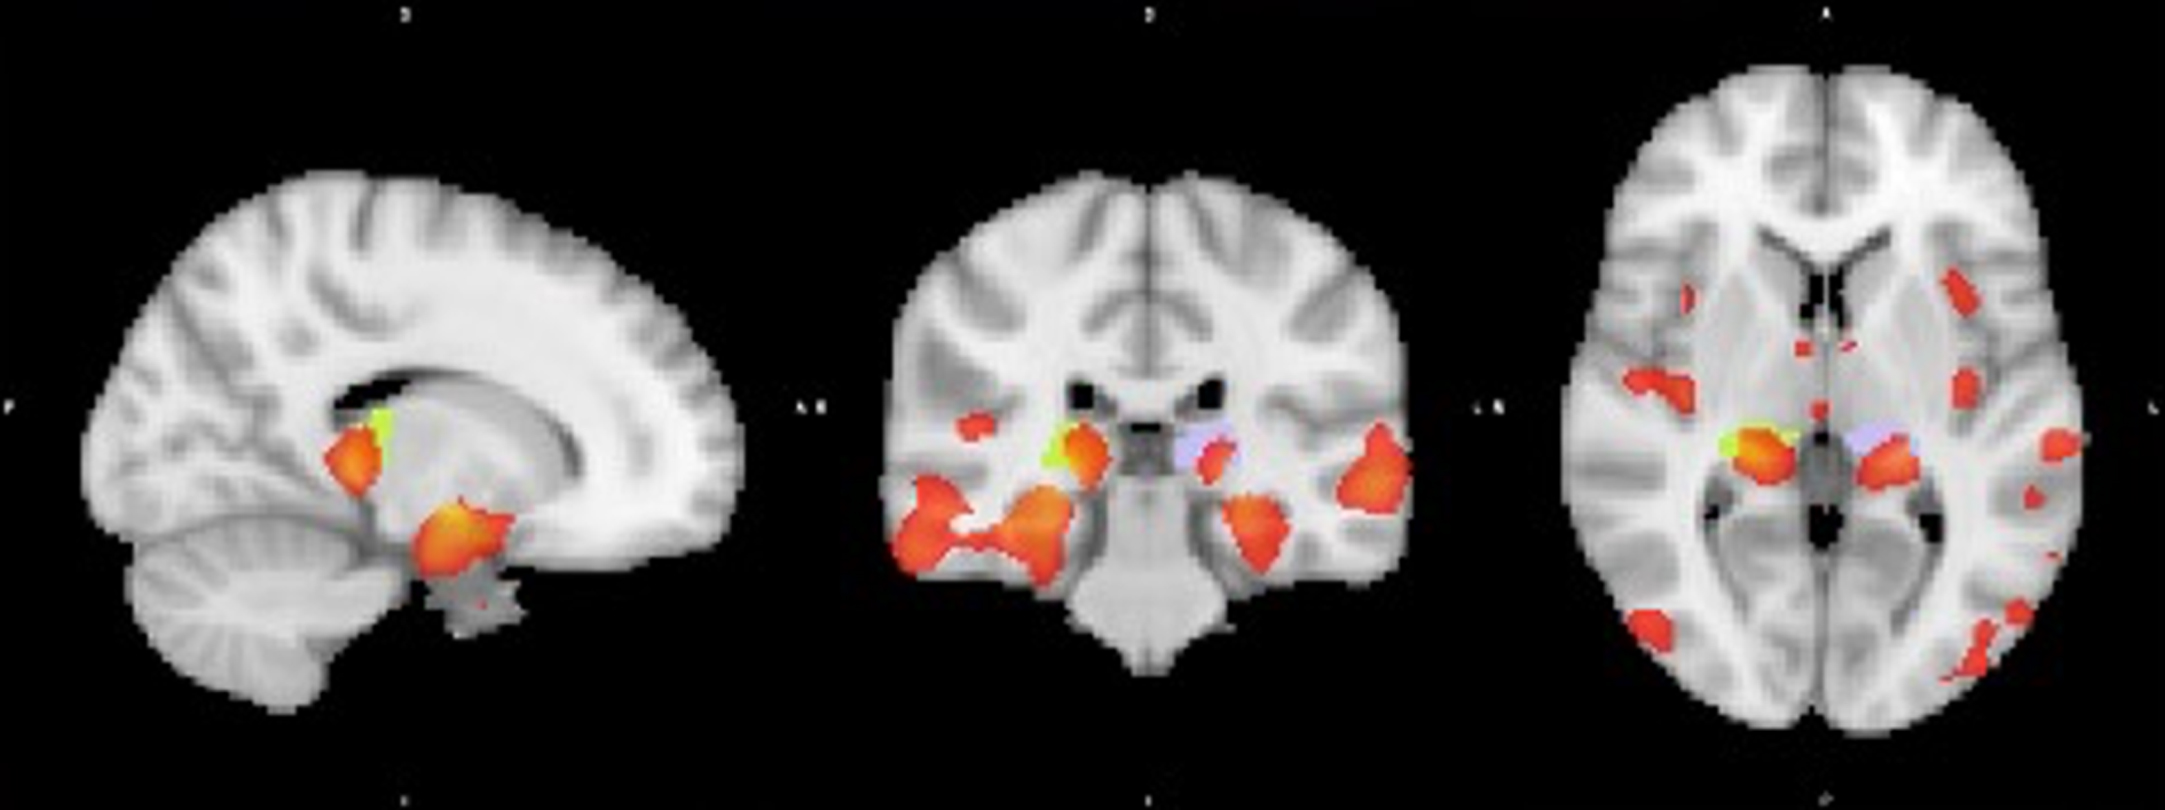
The comparison between MCI participants that did and did not convert to AD dementia showed that MCI participants that converted to AD dementia within 2 years had significant grey matter volume reductions at baseline with the largest cluster centered around the right amygdala, right posterior thalamus, and bilateral hippocampal regions. Surrounding areas, such as the mid and inferiotemporal lobe regions also displayed several clusters of decreased grey matter volume and extended to the same regions in the left hemisphere. Besides these regions, large clusters were found in the angular gyrus, right precuneus, and insula. Furthermore, substantial clusters were also found in the midoccipital region, orbitofrontal cortex, and cerebellum. The full results are presented in Table 6 and Fig. 6. Visualization of the thalamic results in AD dementia converters using the Talairach structural atlas and Freesurfer showed that the volume reductions were confined to the posterior thalamus/pulvinar (see Fig. 7).
Table 6
Regions with reduced grey matter volume in AD dementia-converters < AD dementia non-converters
| MNI coordinates (mm) | ||||||
| Brain region (AAL) | p (FWE-corr) | Extent | t value | x | y | z |
| Amygdala_R | < 0.001 | 24473 | 9.49 | 24 | –6 | –10 |
| Hippocampus_L | < 0.001 | 8.48 | –28 | –9 | –14 | |
| Thalamus_R | < 0.001 | 7.96 | 21 | –30 | 2 | |
| Angular_R | < 0.001 | 3352 | 6.57 | 46 | –66 | 44 |
| Angular_R | < 0.001 | 6.23 | 51 | –64 | 30 | |
| Occipital_Mid_R | < 0.001 | 5.87 | 44 | –75 | 26 | |
| Insula_R | < 0.001 | 559 | 5.84 | 39 | –15 | 10 |
| Temporal_Sup_R | 0.008 | 5.04 | 51 | –12 | 4 | |
| Precuneus_R | < 0.001 | 1378 | 5.66 | 2 | –56 | 26 |
| Precuneus_R | < 0.001 | 5.63 | 8 | –48 | 20 | |
| Cingulum_Post_L | 0.001 | 5.49 | –3 | –44 | 27 | |
| Frontal_Mid_Orb_L | 0.001 | 380 | 5.58 | –21 | 57 | –15 |
| Temporal_Inf_L | 0.001 | 171 | 5.49 | –39 | 8 | –34 |
| Insula_L | 0.002 | 255 | 5.39 | –36 | 12 | 8 |
| Temporal_Sup_R | 0.002 | 84 | 5.34 | 46 | –28 | 12 |
| Insula_L | 0.002 | 212 | 5.31 | –36 | –12 | 8 |
| Frontal_Sup_Medial_R | 0.002 | 206 | 5.3 | 10 | 39 | 44 |
| Fusiform_L | 0.002 | 410 | 5.29 | –32 | –6 | –45 |
| Temporal_Inf_L | 0.006 | 5.11 | –39 | –4 | –40 | |
| Fusiform_L | 0.011 | 4.96 | –24 | –9 | –40 | |
| Temporal_Inf_R | 0.004 | 229 | 5.21 | 44 | 6 | –46 |
| Angular_L | 0.005 | 220 | 5.15 | –52 | –57 | 36 |
| Temporal_Mid_L | 0.006 | 110 | 5.12 | –54 | 4 | –21 |
| Occipital_Mid_L | 0.007 | 153 | 5.06 | –32 | –80 | 36 |
| Occipital_Mid_L | 0.011 | 4.96 | –28 | –70 | 39 | |
| Parietal_Inf_L | 0.012 | 11 | 4.95 | –34 | –69 | 51 |
| Fusiform_L | 0.013 | 60 | 4.94 | –24 | –51 | –14 |
| Precuneus_R | 0.014 | 41 | 4.91 | 10 | –45 | 45 |
| Insula_R | 0.016 | 28 | 4.88 | 34 | 20 | –15 |
| Insula_R | 0.023 | 16 | 4.79 | 38 | 10 | 4 |
| Temporal_Mid_R | 0.031 | 11 | 4.72 | 54 | –51 | 8 |
| Temporal_Mid_L | 0.034 | 13 | 4.7 | –60 | –60 | 6 |
| Cerebelum_8_R | 0.034 | 8 | 4.7 | 27 | –64 | –45 |
| Frontal_Sup_Medial_L | 0.037 | 1 | 4.68 | –9 | 38 | 48 |
| Cerebelum_Crus1_L | 0.038 | 3 | 4.67 | –26 | –80 | –30 |
| Frontal_Sup_Medial_R | 0.046 | 1 | 4.62 | 14 | 30 | 62 |
| Parietal_Inf_L | 0.02 | 11 | 4.95 | –34 | –69 | 51 |
| Fusiform_L | 0.011 | 60 | 4.94 | –24 | –51 | –14 |
| Precuneus_R | 0.014 | 41 | 4.91 | 10 | –45 | 45 |
| Insula_R | 0.019 | 28 | 4.88 | 34 | 20 | –15 |
| Insula_R | 0.031 | 16 | 4.79 | 38 | 10 | 4 |
| Temporal_Mid_R | 0.028 | 11 | 4.72 | 54 | –51 | 8 |
| Temporal_Mid_L | 0.031 | 13 | 4.7 | –60 | –60 | 6 |
| Cerebelum_8_R | 0.033 | 8 | 4.7 | 27 | –64 | –45 |
| Frontal_Sup_Medial_L | 0.045 | 1 | 4.68 | –9 | 38 | 48 |
| Cerebelum_Crus1_L | 0.041 | 3 | 4.67 | –26 | –80 | –30 |
| Frontal_Sup_Medial_R | 0.046 | 1 | 4.62 | 14 | 30 | 62 |
Fig. 6
GM volume reductions in temporal areas, posterior thalamus, left angular gyrus and more in 2-year AD dementia converters < AD dementia non converters (see Table 6).
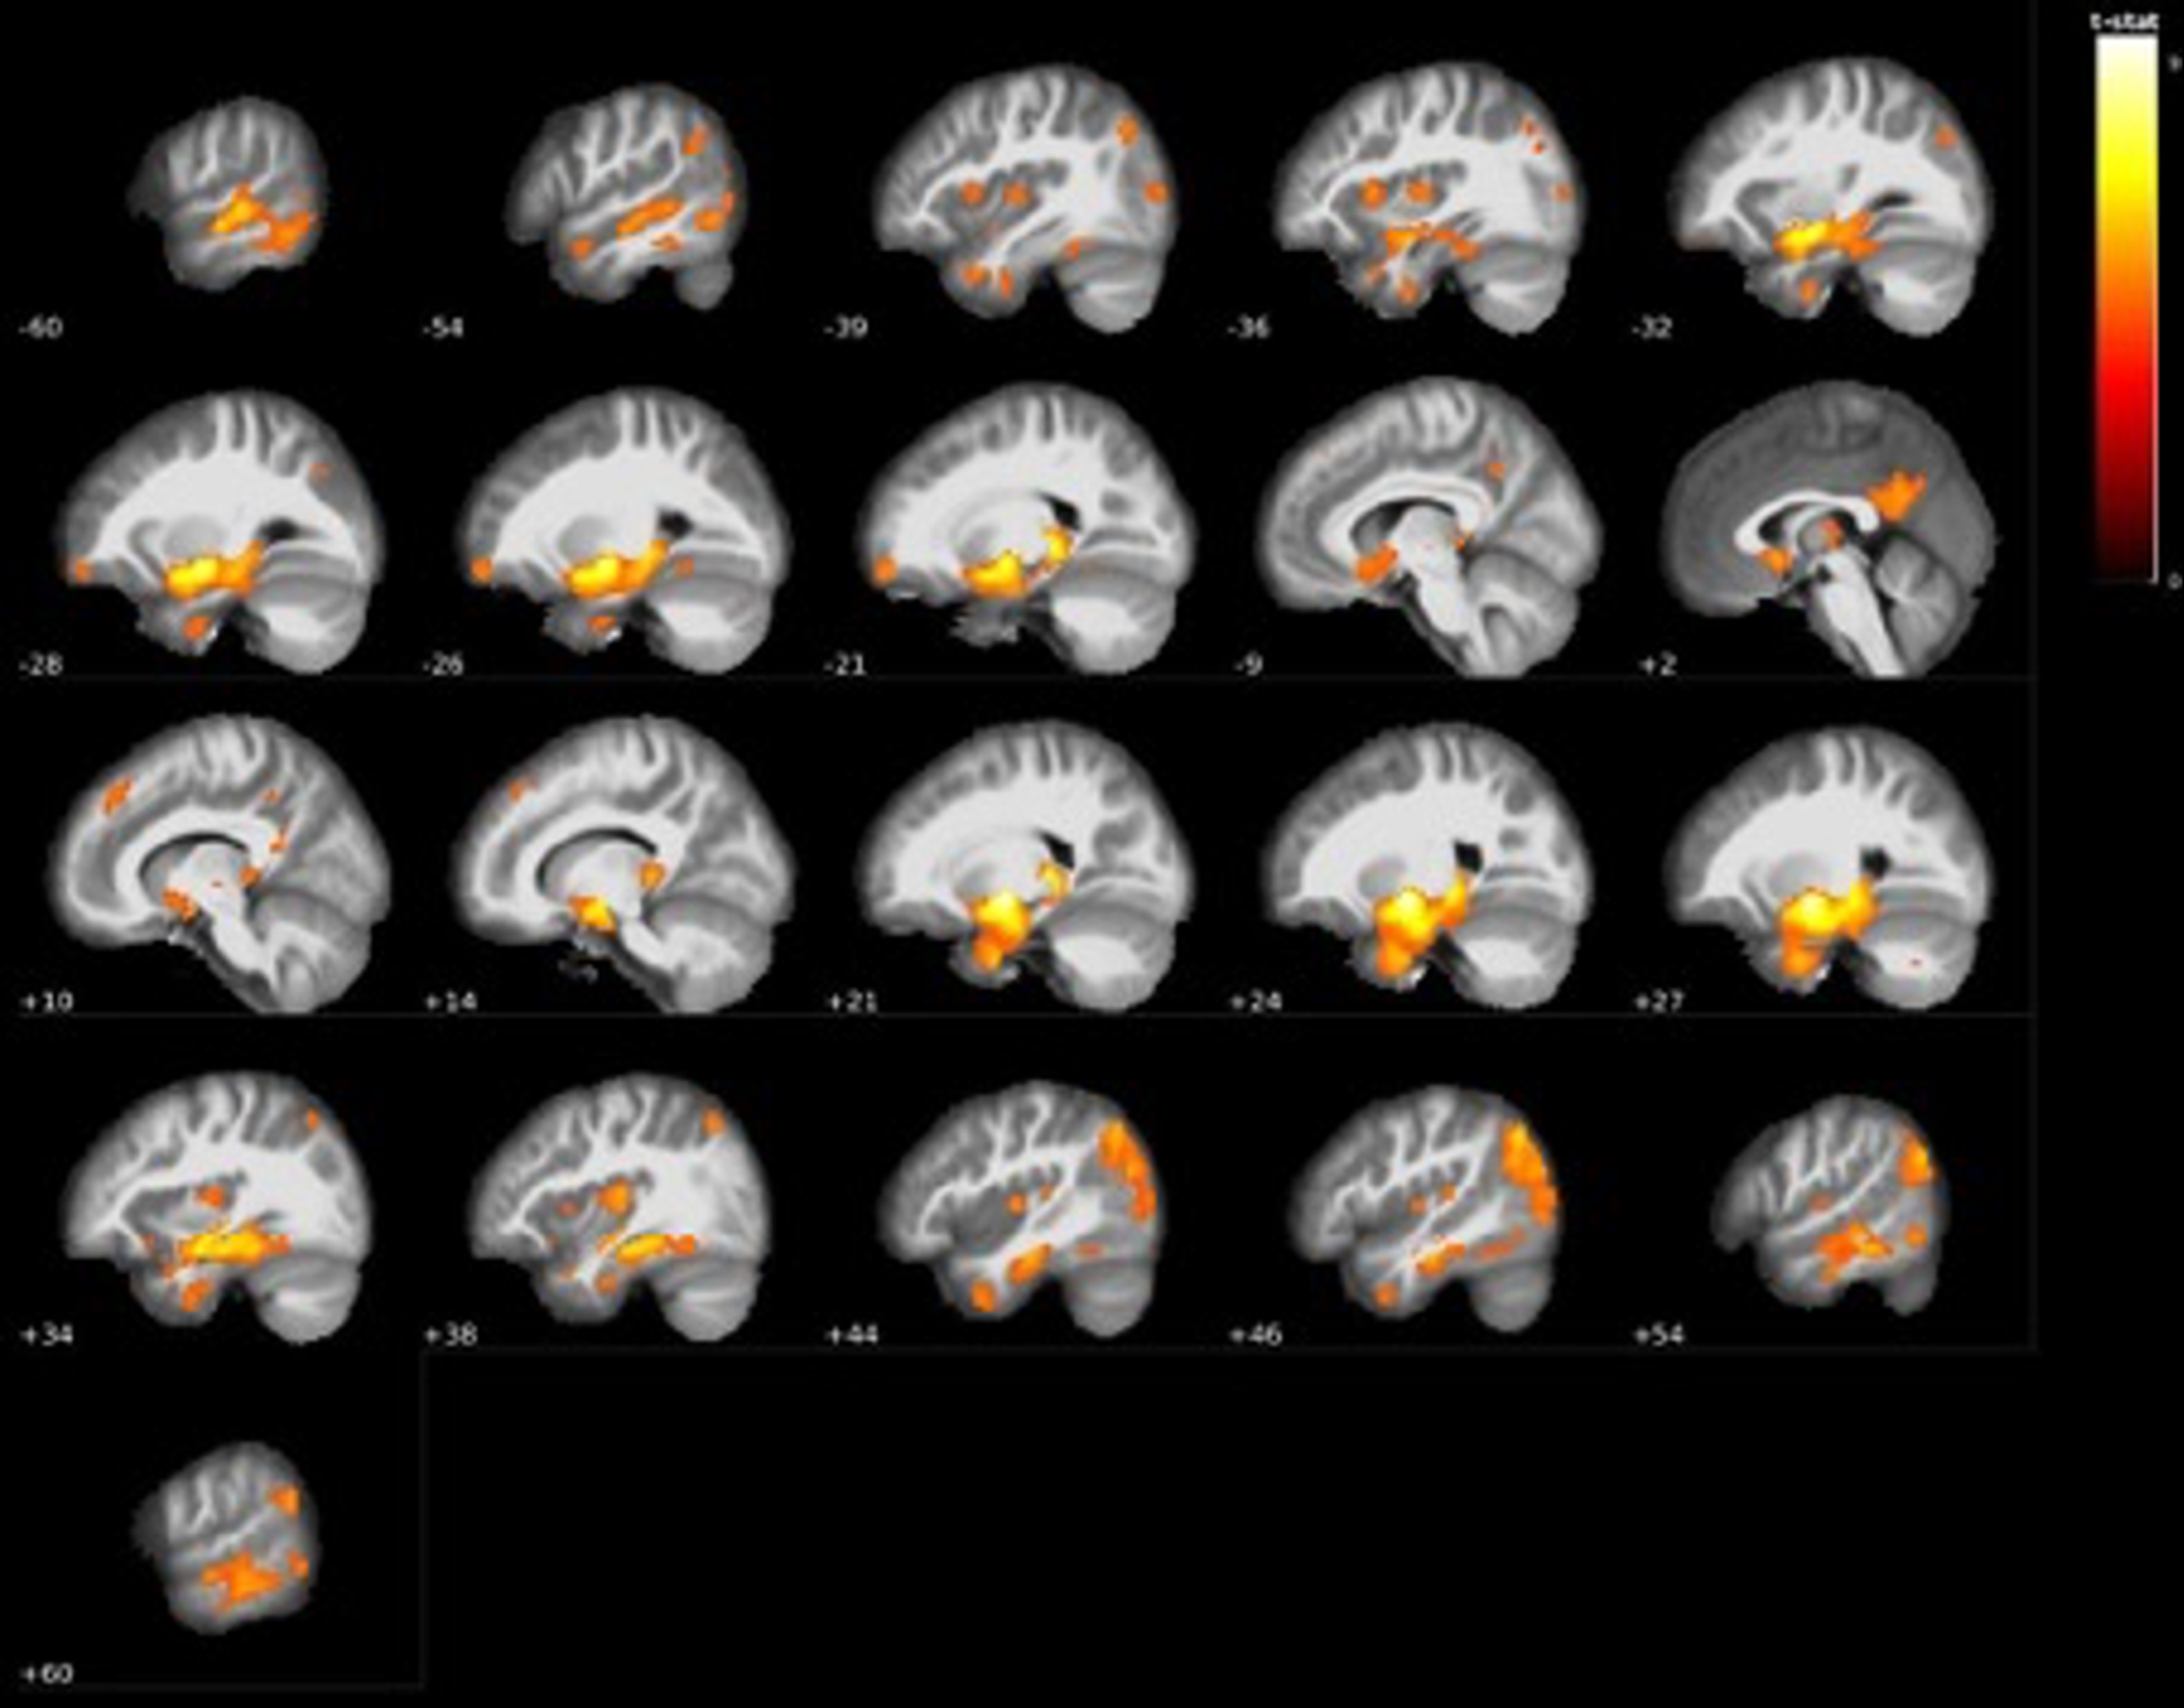
Fig. 7
Visualization of GM volume reduction cluster (red) in AD dementia converters located in the bilateral hippocampus and left (purple) and right (yellow) posterior thalamus/pulvinar according to the Talairach structural atlas.
Since 42%of the LMCI sample converted to AD dementia after 2 years and only 6%of the EMCI sample, we performed another VBM analysis for the LMCI sample only (N = 378) to assess grey matter differences in converters versus non-converters. With a significance level of 0.05 FWE-corrected, the largest cluster of 359 voxels centered around the right amygdala, while moderately large clusters in the bilateral hippocampi and right thalamus were also found. At the 0.01 FWE-corrected level, the region around the right amygdala remained the largest cluster with 214 voxels. An additional smaller cluster was found in the left hippocampus (see Table 7).
Table 7
Regions with reduced grey matter volume of AD dementia converters < non-converters within the LMCI group
| MNI coordinates (mm) | ||||||
| Brain region (AAL) | p (FWE-corr) | Extent | t value | x | y | z |
| Amygdala_R | < 0.001 | 214 | 6.5 | 22 | –6 | –9 |
| Hippocampus_L | 0.005 | 17 | 5.52 | –30 | –9 | –14 |
| Hippocampus_L | 0.004 | 20 | 5.48 | –21 | –33 | –2 |
| Thalamus_R | 0.019 | 33 | 5.3 | 22 | –28 | 0 |
| Occipital_Inf_R | 0.017 | 1 | 5.01 | 54 | –86 | –4 |
DISCUSSION
This study aimed to assess grey matter volume differences across the brain in a large cohort of individuals with a range of cognitive difficulties to gain further insight in the progression of grey matter atrophy along the clinical trajectory in AD.
The VBM analysis showed large differences in grey matter volume between groups. At the start of cognitive decline, we found grey matter loss in the bilateral ventrolateral regions of the thalamus extending to the pallidum, orbitofrontal cortex extending to the anterior cingulate cortex, and cerebellum. Many studies focus on hippocampal atrophy as first signs of cognitive decline [39–41] and assume Braak’s neurodegenerative model of entorhinal cortical atrophy as the start of developing dementia in both amyloid/tau accumulation and grey matter degeneration. Both longitudinal studies and Braak’s model state that the thalamus and cerebellum are one of the last regions affected by amyloid and tau, but those were actually amongst the regions already affected in our comparison between CN and EMCI [42–44].
As seen in the comparison between CN and AD dementia, it is clear that the largest volume decrease over time occurs in hippocampal and entorhinal regions extending to the thalamus. Our findings from the CN and EMCI comparison indicate that this large volume decrease may not have its origin in hippocampal or entorhinal regions, but rather seems to have a thalamic origin.
Regarding our cerebellar findings, increasing evidence for cerebellar contribution to cognitive function has emerged. The cerebellar vermis, found to have decreased grey matter volume in EMCI compared to CN, may also be the cause of various neuropsychiatric symptoms [45, 46]. The last cluster found to be reduced in the earliest signs of cognitive decline was that of the orbitofrontal cortex/anterior cingulate cortex. The anterior cingulate cortex has been found to be affected in mild cognitive impairment stages, especially in an individual’s subjective experience of declining cognition, and seems involved in resilience to cognitive decline [47]. Additionally, both the orbitofrontal cortex and anterior cingulate cortex are involved in emotional regulation and processing, which altogether may (partially) cause the first symptoms of cognitive decline in EMCI [48, 49].
Altogether, our findings of grey matter atrophy in the most (ventro)lateral regions of the thalamus, orbitofrontal cortex and cerebellum do not fully correspond with earlier findings regarding the first signs of cognitive decline which mostly point to hippocampal influence. Rather, hippocampal atrophy does not seem to become present until the MCI progresses in our study, as seen in many large and small grey matter volume clusters found to be reduced in LMCI compared to EMCI. Besides large clusters centered around the hippocampus, almost the entire thalamic region showed reduced grey matter in the LMCI group. Additional widespread large grey matter volume reductions were also found in many frontal and prefrontal areas, (mid)temporal areas, occipital lobe, as well as the cerebellum. This indicates even more widespread grey matter alterations than most previous studies have shown that have mostly focused on hippocampal and temporal areas [22, 50–52], although a few studies have found similar results and related frontal grey matter volume reductions to the specific cognitive difficulties that individuals with MCI face [11, 53]. The fact that these more widespread grey matter volume reduction findings in the majority of studies are scarce could possibly be explained by the larger sample size in this study, or the distinction between EMCI and LMCI.
While LMCI individuals already showed significantly decreased grey matter volume reductions compared to EMCI and CN, the AD dementia group showed even further reductions in grey matter volume compared to LMCI. The largest reductions are mostly found around the hippocampal and temporal regions (with some additional regions surrounding the parietal and occipital regions). Interestingly, thalamic grey matter differences are almost entirely absent between these groups, which could mean that the magnitude to which further thalamic loss occurs decreases in the AD dementia stage of the AD continuum, while large grey matter volume loss continues to occur in areas such as the (para)hippocampal gyrus.
In this study, we found that the conversion from MCI to AD dementia was associated with reduced grey matter volume in several brain regions, namely the thalamus, amygdala, bilateral hippocampus, parahippocampal gyri and medial/inferior temporal gyri, with additional roles for the angular gyrus, precuneus, insula, midfrontal regions, and midoccipital cortex. It is important to note that AD dementia converters already showed worse cognitive performance at baseline compared to AD dementia non-converters, and that it may be difficult to pinpoint which regional volume decreases are related to worse cognitive performance, and which regions are specifically involved in conversion. However, the (para)hippocampal and temporal findings are in line with earlier studies investigating grey matter volume differences in AD dementia converters, that also found grey matter volume reductions in hippocampal and midtemporal areas [21, 54–56]. Also the importance of the insula and precuneus in AD dementia risk has been reported previously [57, 58].
One of the findings in our study are the grey matter volume reductions in the posterior thalamus and angular gyrus at baseline in AD dementia converters. To our knowledge, no other studies have previously tried to explain how the posterior thalamus and/or angular gyrus could contribute to AD dementia conversion, which could be key players in this conversion in addition to (para)hippocampal regions.
The largest volume reductions centered around the pulvinar in the posterior thalamus. Studies suggest that it is mainly involved in (visual) attention processes, executive function, and updating working memory [59–62]. Pulvinar abnormalities are linked to dementia with Lewy bodies, which is associated with initial problems with attention and visuospatial abilities and only with later problems with memory [63]. Our results suggest that pulvinar abnormalities are also associated with AD (and specifically with AD dementia), which together with the angular gyrus may contribute to previously mentioned symptoms such as memory, attentional and executive deficits associated with the disease. Since we did not find clear thalamic volume differences between LMCI and AD dementia, an explanation could be that thalamic function may be crucial for an individual to remain in moderate MCI stages, after which conversion to AD dementia occurs when hippocampal volume has degenerated to the same extent as the thalamus.
It is important to note that the finding of thalamic volume loss in AD dementia converters within the LMCI group only remained significant at the < 0.05 FWE level and bordered on statistical significance at the < 0.01 FWE level with a significance of p = 0.019. It is possible that the inclusion of individuals with EMCI in the initial analysis may have slightly skewed the results. However, the non-converter group consisted of more than half of the LMCI group, and the fact that the thalamic finding barely missed statistical significance at < 0.01 FWE level could also be the result of the decreased statistical power due to a decrease in sample size.
Additional evidence for an important role of the thalamus in dementia progression is highlighted in our findings of grey matter loss in bilateral ventrolateral thalamic/pallidal regions in EMCI compared to CN groups. Since EMCI individuals displayed a statistically significant difference in MMSE, ImRec, and DelRec scores compared to CN groups, this decline in cognitive performance can also be attributed to early thalamic grey matter loss, especially since lateral portions of the thalamus also seem involved in memory and attention processes [64, 65]. Since we did not find any structural hippocampal changes between CN and EMCI, this could mean that the thalamus is more important in causing cognitive decline in dementia than previously thought, and seems to occur before any hippocampal/entorhinal cortex volume loss, which was always assumed to be the origin of brain volume loss in the clinical continuum of AD.
While most studies have suggested that (para)hippocampal grey matter volume is the largest predictor for AD dementia conversion and overall disease progression, Aggleton et al. (2016) previously highlighted the importance of anterior thalamic grey matter atrophy in cognitive decline and AD dementia conversion. While this study did not find atrophy specifically in the anterior thalamus, our findings of pulvinar grey matter loss in AD dementia converters and grey matter loss in ventrolateral portions of the thalamus in EMCI provide additional support for a role of thalamic atrophy in the progression of cognitive decline, and specifically as an early warning sign of dementia and of conversion from MCI into AD dementia. Since the thalamus and hippocampus have shown to be important for cognitive functioning in the elderly population, the thalamic volume reduction found in this study might therefore (partially) pose as an explanation for the cognitive deterioration occurring in AD dementia converters compared to non-converters [66, 67], while the decreased grey matter volume in the right angular gyrus may be an additional detrimental factor in memory difficulties, both of which were found in our sample with a statistically significant difference in MMSE, ImRec, and DelRec scores at baseline between groups. The advantages of this study include a larger sample size than most other studies, which increases the power to detect differences and generalizability of the results. This study also used a voxel-wise approach for comparing grey matter differences, where several other studies used a segmentational ROI approach which may decrease regional sensitivity if the effect is focal [68], which could explain why the thalamus has rarely been reported in AD dementia conversion studies.
In summary, this study aimed to assess cross-sectional grey matter volume changes in AD and found grey matter volume reductions at different stages of the clinical continuum of AD that corroborate previous smaller studies on this subject. Furthermore, we found grey matter volume differences in individuals that convert to AD dementia compared to individuals that do not convert, with the most important regions being the posterior thalamus, angular gyrus, bilateral hippocampal areas and mid/inferio-temporal areas, where the bilateral hippocampus, right thalamus, and amygdala remained significantly affected regions in an additional subdivision of AD dementia-converters within the LMCI group at < 0.05 FWE. This thalamic volume reduction is one of the first signs of cognitive decline, as shown in our comparison between individuals with CN and EMCI, and may therefore be a key player in dementia besides hippocampal regions, which did not show any alterations in the earliest stages of cognitive impairment. This study provides additional insight into the structural deterioration occurring at multiple levels of AD severity and proposes an additional role of the (posterior) thalamus in the cognitive deterioration that characterizes AD. Hopefully, this could eventually aid in the prognosis of disease progression.
ACKNOWLEDGMENTS
Data collection and sharing for this project was funded by the Alzheimer’s Disease Neuroimaging Initiative (ADNI) (National Institutes of Health Grant U01 AG024904) and DOD ADNI (Department of Defense award number W81XWH-12-2-0012). ADNI is funded by the National Institute on Aging, the National Institute of Biomedical Imaging and Bioengineering, and through generous contributions from the following: AbbVie, Alzheimer’s Association; Alzheimer’s Drug Discovery Foundation; Araclon Biotech; BioClinica, Inc.; Biogen; Bristol-Myers Squibb Company; CereSpir, Inc.; Cogstate; Eisai Inc.; Elan Pharmaceuticals, Inc.; Eli Lilly and Company; EuroImmun; F. Hoffmann-La Roche Ltd and its affiliated company Genentech, Inc.; Fujirebio; GE Healthcare; IXICO Ltd.; Janssen Alzheimer Immunotherapy Research & Development, LLC.; Johnson & Johnson Pharmaceutical Research & Development LLC.; Lumosity; Lundbeck; Merck & Co., Inc.; Meso Scale Diagnostics, LLC.; NeuroRx Research; Neurotrack Technologies; Novartis Pharmaceuticals Corporation; Pfizer Inc.; Piramal Imaging; Servier; Takeda Pharmaceutical Company; and Transition Therapeutics. The Canadian Institutes of Health Research is providing funds to support ADNI clinical sites in Canada. Private sector contributions are facilitated by the Foundation for the National Institutes of Health (http://www.fnih.org). The grantee organization is the Northern California Institute for Research and Education, and the study is coordinated by the Alzheimer’s Therapeutic Research Institute at the University of Southern California. ADNI data are disseminated by the Laboratory for Neuro Imaging at the University of Southern California.
Authors’ disclosures available online (https://www.j-alz.com/manuscript-disclosures/21-0173r3).
REFERENCES
[1] | Alzheimer’s Association ((2018) ) 2018 Alzheimer’s disease facts and figures. Alzheimers Dement 14: , 367–429. |
[2] | Hassan F . ((2009) ) Alzheimer’s disease: Our biggest long-term health challenge. World Hosp Health Serv 45: , 4–5. |
[3] | El-Hayek YH , Wiley RE , Khoury CP , Daya RP , Ballard C , Evans AR , Karran M , Molinuevo JL , Norton M , Atri A ((2019) ) Tip of the iceberg: Assessing the global socioeconomic costs of Alzheimer’s disease and related dementias and strategic implications for stakeholders. J Alzheimers Dis 70: , 323–341. |
[4] | Henstridge CM , Hyman BT , Spires-Jones TL ((2019) ) Beyond the neuron-cellular interactions early in Alzheimer disease pathogenesis. Nat Rev Neurosci 20: , 94–108. |
[5] | Crous-Bou M , Minguillon C , Gramunt N , Molinuevo JL ((2017) ) Alzheimer’s disease prevention: From risk factors to early intervention. Alzheimers Res Ther 9: , 71. |
[6] | Theendakara V , Peters-Libeu CA , Bredesen DE , Rao RV ((2018) ) Transcriptional effects of ApoE4: Relevance to Alzheimer’s disease. Mol Neurobiol 55: , 5243–5254. |
[7] | Dorey E , Chang N , Liu QY , Yang Z , Zhang W ((2014) ) Apolipoprotein E, amyloid-beta, and neuroinflammation in Alzheimer’s disease. Neurosci Bull 30: , 317–330. |
[8] | Chapleau M , Aldebert J , Montembeault M , Brambati SM ((2016) ) Atrophy in Alzheimer’s disease and semantic dementia: An ALE meta-analysis of voxel-based morphometry studies. J Alzheimers Dis 54: , 941–955. |
[9] | Dicks E , Vermunt L , van der Flier WM , Visser PJ , Barkhof F , Scheltens P , Tijms BM , Alzheimer’s Disease Neuroimaging Initiative ((2019) ) Modeling grey matter atrophy as a function of time, aging or cognitive decline show different anatomical patterns in Alzheimer’s disease. Neuroimage Clin 22: , 101786. |
[10] | Kang SW , Jeon S , Yoo HS , Chung SJ , Lee PH , Sohn YH , Yun M , Evans AC , Ye BS ((2019) ) Effects of Lewy body disease and Alzheimer disease on brain atrophy and cognitive dysfunction. Neurology 92: , e2015–e2026. |
[11] | Kunst J , Marecek R , Klobusiakova P , Balazova Z , Anderkova L , Nemcova-Elfmarkova N , Rektorova I ((2019) ) Patterns of grey matter atrophy at different stages of Parkinson’s and Alzheimer’s diseases and relation to cognition. Brain Topogr 32: , 142–160. |
[12] | Insel PS , Mormino EC , Aisen PS , Thompson WK , Donohue MC ((2020) ) Neuroanatomical spread of amyloid beta and tau in Alzheimer’s disease: Implications for primary prevention. Brain Commun 2: , fcaa007. |
[13] | Mormino EC , Papp KV ((2018) ) Amyloid accumulation and cognitive decline in clinically normal older individuals: Implications for aging and early Alzheimer’s disease. J Alzheimers Dis 64: , S633–S646. |
[14] | Arevalo-Rodriguez I , Smailagic N , Roque IFM , Ciapponi A , Sanchez-Perez E , Giannakou A , Pedraza OL , Bonfill Cosp X , Cullum S (2015) Mini-Mental State Examination (MMSE) for the detection of Alzheimer’s disease and other dementias in people with mild cognitive impairment (MCI). Cochrane Database Syst Rev, CD010783. |
[15] | Ismail Z , Smith EE , Geda Y , Sultzer D , Brodaty H , Smith G , Aguera-Ortiz L , Sweet R , Miller D , Lyketsos CG , ISTAART Neuropsychiatric Symptoms Professional Interest Area ((2016) ) Neuropsychiatric symptoms as early manifestations of emergent dementia: Provisional diagnostic criteria for mild behavioral impairment. Alzheimers Dement 12: , 195–202. |
[16] | Christensen KD , Karlawish J , Roberts JS , Uhlmann WR , Harkins K , Wood EM , Obisesan TO , Le LQ , Cupples LA , Zoltick ES , Johnson MS , Bradbury MK , Waterston LB , Chen CA , Feldman S , Perry DL , Green RC , REVEAL Study Group ((2020) ) Disclosing genetic risk for Alzheimer’s dementia to individuals with mild cognitive impairment. Alzheimers Dement (N Y) 6: , e12002. |
[17] | Cornutiu G ((2015) ) The epidemiological scale of Alzheimer’s disease. J Clin Med Res 7: , 657–666. |
[18] | Creavin ST , Wisniewski S , Noel-Storr AH , Trevelyan CM , Hampton T , Rayment D , Thom VM , Nash KJ , Elhamoui H , Milligan R , Patel AS , Tsivos DV , Wing T , Phillips E , Kellman SM , Shackleton HL , Singleton GF , Neale BE , Watton ME , Cullum S (2016) Mini-Mental State Examination (MMSE) for the detection of dementia in clinically unevaluated people aged 65 and over in community and primary care populations. Cochrane Database Syst Rev, CD011145. |
[19] | Miller JB , Axelrod BN , Rapport LJ , Millis SR , Vandyke S , Schutte C , Hanks RA ((2012) ) Parsimonious prediction of Wechsler Memory Scale, Fourth Edition scores: Immediate and delayed memory indexes. J Clin Exp Neuropsychol 34: , 531–542. |
[20] | Zhang H , Trollor JN , Wen W , Zhu W , Crawford JD , Kochan NA , Slavin MJ , Brodaty H , Reppermund S , Kang K , Mather KA , Sachdev PS ((2011) ) Grey matter atrophy of basal forebrain and hippocampus in mild cognitive impairment. J Neurol Neurosurg Psychiatry 82: , 487–493. |
[21] | Spulber G , Niskanen E , Macdonald S , Kivipelto M , Padilla DF , Julkunen V , Hallikainen M , Vanninen R , Wahlund LO , Soininen H ((2012) ) Evolution of global and local grey matter atrophy on serial MRI scans during the progression from MCI to AD. Curr Alzheimer Res 9: , 516–524. |
[22] | Valdes Hernandez MC , Clark R , Wang SH , Guazzo F , Calia C , Pattan V , Starr J , Della Sala S , Parra MA ((2020) ) The striatum, the hippocampus, and short-term memory binding: Volumetric analysis of the subcortical grey matter’s role in mild cognitive impairment. Neuroimage Clin 25: , 102158. |
[23] | Chen TB , Lai YH , Ke TL , Chen JP , Lee YJ , Lin SY , Lin PC , Wang PN , Cheng IH ((2019) ) Changes in plasma amyloid and tau in a longitudinal study of normal aging, mild cognitive impairment, and Alzheimer’s disease. Dement Geriatr Cogn Disord 48: , 180–195. |
[24] | Traschutz A , Enkirch SJ , Polomac N , Widmann CN , Schild HH , Heneka MT , Hattingen E ((2020) ) The entorhinal cortex atrophy score is diagnostic and prognostic in mild cognitive impairment. J Alzheimers Dis 75: , 99–108. |
[25] | Seghier ML ((2013) ) The angular gyrus: Multiple functions and multiple subdivisions. Neuroscientist 19: , 43–61. |
[26] | Hutchinson JB , Uncapher MR , Weiner KS , Bressler DW , Silver MA , Preston AR , Wagner AD ((2014) ) Functional heterogeneity in posterior parietal cortex across attention and episodic memory retrieval. Cereb Cortex 24: , 49–66. |
[27] | Tang X , Holland D , Dale AM , Younes L , Miller MI , Alzheimer’s Disease Neuroimaging Initiative ((2014) ) Shape abnormalities of subcortical and ventricular structures in mild cognitive impairment and Alzheimer’s disease: Detecting, quantifying, and predicting. Hum Brain Mapp 35: , 3701–3725. |
[28] | Rugg MD , King DR ((2018) ) Ventral lateral parietal cortex and episodic memory retrieval. Cortex 107: , 238–250. |
[29] | Sheremata SL , Somers DC , Shomstein S ((2018) ) Visual short-term memory activity in parietal lobe reflects cognitive processes beyond attentional selection. J Neurosci 38: , 1511–1519. |
[30] | Aggleton JP , Pralus A , Nelson AJ , Hornberger M ((2016) ) Thalamic pathology and memory loss in early Alzheimer’s disease: Moving the focus from the medial temporal lobe to Papez circuit. Brain 139: , 1877–1890. |
[31] | McKhann G , Drachman D , Folstein M , Katzman R , Price D , Stadlan EM ((1984) ) Clinical diagnosis of Alzheimer’s disease: Report of the NINCDS-ADRDA Work Group under the auspices of Department of Health and Human Services Task Force on Alzheimer’s Disease. Neurology 34: , 939–944. |
[32] | RStudio Team (2021). RStudio: Integrated Development for R http://www.rstudio.com/, Last updated January 21, 2012, Accessed on July 11, 2021. |
[33] | Isensee F , Schell M , Pflueger I , Brugnara G , Bonekamp D , Neuberger U , Wick A , Schlemmer HP , Heiland S , Wick W , Bendszus M , Maier-Hein KH , Kickingereder P ((2019) ) Automated brain extraction of multisequence MRI using artificial neural networks. Hum Brain Mapp 40: , 4952–4964. |
[34] | Dinomais M , Celle S , Duval GT , Roche F , Henni S , Bartha R , Beauchet O , Annweiler C ((2016) ) Anatomic correlation of the Mini-Mental State Examination: A voxel-based morphometric study in older adults. PLoS One 11: , e0162889. |
[35] | Fischl B ((2012) ) FreeSurfer. Neuroimage 62: , 774–781. |
[36] | Talairach J , Rayport M , Tournoux P ((1997) ) Co-planar stereotaxic atlas of the human brain, Thieme, Stuttgart. |
[37] | Lancaster JL , Tordesillas-Gutierrez D , Martinez M , Salinas F , Evans A , Zilles K , Mazziotta JC , Fox PT ((2007) ) Bias between MNI and Talairach coordinates analyzed using the ICBM-152 brain template. Hum Brain Mapp 28: , 1194–1205. |
[38] | Lancaster JL , Woldorff MG , Parsons LM , Liotti M , Freitas CS , Rainey L , Kochunov PV , Nickerson D , Mikiten SA , Fox PT ((2000) ) Automated Talairach atlas labels for functional brain mapping. Hum Brain Mapp 10: , 120–131. |
[39] | Perrotin A , de Flores R , Lamberton F , Poisnel G , La Joie R , de la Sayette V , Mezenge F , Tomadesso C , Landeau B , Desgranges B , Chetelat G ((2015) ) Hippocampal subfield volumetry and 3D surface mapping in subjective cognitive decline. J Alzheimers Dis 48: (Suppl 1), S141–150. |
[40] | Cantero JL , Iglesias JE , Van Leemput K , Atienza M ((2016) ) Regional hippocampal atrophy and higher levels of plasma amyloid-beta are associated with subjective memory complaints in nondemented elderly subjects. J Gerontol A Biol Sci Med Sci 71: , 1210–1215. |
[41] | Yue L , Wang T , Wang J , Li G , Wang J , Li X , Li W , Hu M , Xiao S ((2018) ) Asymmetry of hippocampus and amygdala defect in subjective cognitive decline among the community dwelling Chinese. Front Psychiatry 9: , 226. |
[42] | Braak H , Del Tredici K ((2015) ) The preclinical phase of the pathological process underlying sporadic Alzheimer’s disease. Brain 138: , 2814–2833. |
[43] | Scholl M , Maass A , Mattsson N , Ashton NJ , Blennow K , Zetterberg H , Jagust W ((2019) ) Biomarkers for tau pathology. Mol Cell Neurosci 97: , 18–33. |
[44] | Fernandez-Cabello S , Kronbichler M , Van Dijk KRA , Goodman JA , Spreng RN , Schmitz TW , Alzheimer’s Disease Neuroimaging Initiative ((2020) ) Basal forebrain volume reliably predicts the cortical spread of Alzheimer’s degeneration. Brain 143: , 993–1009. |
[45] | Schmahmann JD , Weilburg JB , Sherman JC ((2007) ) The neuropsychiatry of the cerebellum - insights from the clinic. Cerebellum 6: , 254–267. |
[46] | Stoodley CJ , Schmahmann JD ((2010) ) Evidence for topographic organization in the cerebellum of motor control versus cognitive and affective processing. Cortex 46: , 831–844. |
[47] | Colangeli S , Boccia M , Verde P , Guariglia P , Bianchini F , Piccardi L ((2016) ) Cognitive reserve in healthy aging and Alzheimer’s disease: A meta-analysis of fMRI studies. Am J Alzheimers Dis Other Demen 31: , 443–449. |
[48] | Garcia-Cabezas MA , Barbas H ((2017) ) Anterior cingulate pathways may affect emotions through orbitofrontal cortex. Cereb Cortex 27: , 4891–4910. |
[49] | Sambuchi N , Geda YE , Michel BF ((2019) ) Cingulate cortex in pre-MCI cognition. Handb Clin Neurol 166: , 281–295. |
[50] | Ma X , Li Z , Jing B , Liu H , Li D , Li H , Alzheimer’s Disease Neuroimaging Initiative ((2016) ) Identify the atrophy of Alzheimer’s disease, mild cognitive impairment and normal aging using morphometric MRI analysis. Front Aging Neurosci 8: , 243. |
[51] | Wirth M , Pichet Binette A , Brunecker P , Kobe T , Witte AV , Floel A ((2017) ) Divergent regional patterns of cerebral hypoperfusion and gray matter atrophy in mild cognitive impairment patients. J Cereb Blood Flow Metab 37: , 814–824. |
[52] | Qin R , Li M , Luo R , Ye Q , Luo C , Chen H , Qian L , Zhu X , Bai F , Zhang B , Liu R , Zhao H , Xu Y (2020) The efficacy of gray matter atrophy and cognitive assessment in differentiation of aMCI and naMCI. Appl Neuropsychol Adult. doi: 10.1080/23279095.2019.1710509 |
[53] | Benavides-Varela S , Burgio F , Meneghello F , De Marco M , Arcara G , Rigon J , Pilosio C , Butterworth B , Venneri A , Semenza C ((2015) ) Anatomical substrates and neurocognitive predictors of daily numerical abilities in mild cognitive impairment. Cortex 71: , 58–67. |
[54] | Vemuri P , Weigand SD , Knopman DS , Kantarci K , Boeve BF , Petersen RC , Jack CR Jr. ((2011) ) Time-to-event voxel-based techniques to assess regional atrophy associated with MCI risk of progression to AD. Neuroimage 54: , 985–991. |
[55] | Deters KD , Risacher SL , Kim S , Nho K , West JD , Blennow K , Zetterberg H , Shaw LM , Trojanowski JQ , Weiner MW , Saykin AJ , Alzheimer Disease Neuroimaging Initiative ((2017) ) Plasma tau association with brain atrophy in mild cognitive impairment and Alzheimer’s disease. J Alzheimers Dis 58: , 1245–1254. |
[56] | Long X , Jiang C , Zhang L ((2018) ) Morphological biomarker differentiating MCI converters from nonconverters: Longitudinal evidence based on hemispheric asymmetry. Behav Neurol 2018: , 3954101. |
[57] | Davatzikos C , Bhatt P , Shaw LM , Batmanghelich KN , Trojanowski JQ ((2011) ) Prediction of MCI to AD conversion, via MRI, CSF biomarkers, and pattern classification. Neurobiol Aging 32: , 2322 e2319–2327. |
[58] | Lin F , Ren P , Lo RY , Chapman BP , Jacobs A , Baran TM , Porsteinsson AP , Foxe JJ , Alzheimer’s Disease Neuroimaging Initiative ((2017) ) Insula and inferior frontal gyrus’ activities protect memory performance against Alzheimer’s disease pathology in old age. J Alzheimers Dis 55: , 669–678. |
[59] | Saalmann YB , Kastner S ((2011) ) Cognitive and perceptual functions of the visual thalamus. Neuron 71: , 209–223. |
[60] | Arend I , Henik A , Okon-Singer H ((2015) ) Dissociating emotion and attention functions in the pulvinar nucleus of the thalamus. Neuropsychology 29: , 191–196. |
[61] | Halassa MM , Kastner S ((2017) ) Thalamic functions in distributed cognitive control. Nat Neurosci 20: , 1669–1679. |
[62] | Homman-Ludiye J , Bourne JA ((2019) ) The medial pulvinar: Function, origin and association with neurodevelopmental disorders. J Anat 235: , 507–520. |
[63] | Benarroch EE ((2015) ) Pulvinar: Associative role in cortical function and clinical correlations. Neurology 84: , 738–747. |
[64] | de Bourbon-Teles J , Bentley P , Koshino S , Shah K , Dutta A , Malhotra P , Egner T , Husain M , Soto D ((2014) ) Thalamic control of human attention driven by memory and learning. Curr Biol 24: , 993–999. |
[65] | Wagner IC , van Buuren M , Fernandez G ((2019) ) Thalamo-cortical coupling during encoding and consolidation is linked to durable memory formation. Neuroimage 197: , 80–92. |
[66] | Tuokkola T , Karrasch M , Koikkalainen J , Parkkola R , Lotjonen J , Loyttyniemi E , Hurme S , Rinne JO ((2019) ) Association between deep gray matter changes and neurocognitive function in mild cognitive impairment and Alzheimer’s disease: A tensor-based morphometric MRI study. Dement Geriatr Cogn Disord 48: , 68–78. |
[67] | Zidan M , Boban J , Bjelan M , Todorovic A , Stankov Vujanic T , Semnic M , Boban N , Kozic D ((2019) ) Thalamic volume loss as an early sign of amnestic mild cognitive impairment. J Clin Neurosci 68: , 168–173. |
[68] | Voormolen EH , Wei C , Chow EW , Bassett AS , Mikulis DJ , Crawley AP ((2010) ) Voxel-based morphometry and automated lobar volumetry: The trade-off between spatial scale and statistical correction. Neuroimage 49: , 587–596. |


