
Economic Burden of Alzheimer’s Disease Dementia in Japan
Abstract
Background:
Alzheimer’s disease dementia (ADD) is the leading cause of long-term care in Japan.
Objective:
This study estimates the annual healthcare and long-term care costs in fiscal year 2018 for adults over 65 years of age with ADD in Japan and the informal care costs and productivity loss for their families.
Methods:
Healthcare and long-term care costs for ADD were estimated according to the disease severity classified by the clinical dementia rating (CDR) score, using reports from a literature review. For the costs of time spent on caregiving activities, productivity loss for ADD family caregivers aged 20–69 and informal care costs for all ADD family caregivers were estimated.
Results:
The total healthcare cost of ADD was JPY 1,073 billion, of which 86% (JPY 923 billion) was attributed to healthcare costs other than ADD drug costs (JPY 151 billion). The healthcare costs other than ADD drug costs by severity were less than JPY 200 billion for CDR 0.5, CDR 1, and CDR 2, respectively, but increased to JPY 447 billion (48%) for CDR 3. The public long-term care costs were estimated to be JPY 4,783 billion, which increased according to the severity. Total productivity loss for ADD family caregivers aged 20–69 was JPY 1,547 billion and the informal care cost for all ADD family caregivers was JPY 6,772 billion.
Conclusion:
ADD costs have a significant impact on public-funded healthcare, long-term care systems, and families in Japan. To minimize the economic burden of ADD, prolonging healthy life expectancy is the key factor to address.
INTRODUCTION
The World Alzheimer’s Report 2015 estimated the global number of people with dementia and the global cost of the disease to be 46.8 million and USD 817.9 billion, respectively. This figure revealed an increase of 35.4% from USD 604.0 billion in 2010. Furthermore, the global number of people with dementia is expected to reach 74.7 million by 2030 and 131.5 million by 2050. In a comparison of the prevalence of dementia in 2009 and 2015 in each area of the world, there were decreases in Europe and North America, whereas marked increases were reported in East Asia, Southeast Asia, and Africa [1].
In Japan, the number of older adults aged 65 years or over living with dementia was estimated to be 4,620,000 in 2012 [2]. In a projection using data from a dementia study in Hisayama Town, the numbers of people living with dementia in 2025 and 2060 were estimated to be approximately 6.5 to 7 million and 8.5 to 11.5 million, respectively [3]. In the Comprehensive Survey of Living Conditions by the Ministry of Health, Labour and Welfare (MHLW) (2016), dementia was ranked as the leading cause of long-term care in 18.0% of all cases [4]. Considering this situation, the government of Japan proceeded with the New Orange Plan and other measures for dementia as a challenge to be urgently addressed. To provide a basis for these measures, Sado et al. estimated the societal cost of dementia to be JPY 14.5 trillion, including JPY 1.9 trillion for healthcare, JPY 6.4 trillion for long-term care, and JPY 6.2 trillion for informal care costs in 2014 [5].
Alzheimer’s disease dementia (ADD) accounts for 50–75% of all dementia cases [6]. According to a national survey conducted in Japan in the early 2010s, the most frequent type of dementia is ADD (67.6%), followed by vascular dementia (19.5%) and dementia with Lewy bodies/Parkinson’s disease with dementia (4.3%) [2]. The number of people living with ADD began to increase from the mid-1990s, with the incidence growing from 14.6 per 1,000 person-years in the 1988 Cohort (1988–1998) to 28.2 per 1,000 person-years in the 2002 Cohort (2002–2012), while the incidence of vascular dementia increased slightly from 9.3 to 10.6 per 1,000 person-years [7]. Additionally, some studies have reported that the economic burden of dementia, including healthcare, social care, and unpaid care, varied according to disease severity [8, 9]. Thus, it is necessary to estimate the number of people living with dementia by disease severity, and then to clarify the magnitude of the economic burden that ADD places on society, in order to understand the current situation and to plan and implement future measures for dementia. In estimating the economic burden, several sources can be used, such as literature data, statistics published by governments, and real-world data including patient records or claims data on healthcare and long-term care.
Therefore, this study estimated the overall economic burden of ADD in Japan in 2018 using data from a targeted literature review (TLR).
MATERIAL AND METHODS
Targeted literature review
A TLR was conducted to estimate the annual healthcare costs and long-term care costs for ADD, productivity loss, and informal care costs for the family caregivers of people living with ADD using MEDLINE, Ichushi-Web, the MHLW Grants system [10], and MHLW Statistical Surveys [11]. Search items were categorized as follows: 1) epidemiological data; 2) activities of daily living (ADL); 3) cost; 4) care need level; 5) residential care rate; 6) productivity loss; 7) burden on caregivers; 8) burden of illness (BOI); and 9) informal care time. A wide target disease area and population range were set for the literature review, including Japanese people living with mild cognitive impairment, dementia, or ADD. The TLR was conducted in the following three steps: (i) title/abstract review, (ii) full-text review, and (iii) data extraction. Each step was independently conducted by two reviewers [12].
Economic burden analysis
Types of costs
The economic burden of ADD in Japan was defined through healthcare costs, public long-term care costs (i.e., social care costs), and the costs of time spent on caregiving activities (i.e., unpaid care costs), including two types of costs, namely, productivity loss for ADD family caregivers aged 20–69, and informal care costs for all ADD family caregivers. These types of costs were estimated in the following ways. The healthcare and long-term care costs were covered by the National Health Insurance System and Long-Term Care Insurance System, respectively. The productivity loss was summed with income loss based on overall work impairment (OWI), turnover, and activity impairment of ADD family caregivers aged 20–69 years due to informal care for ADD. Informal care costs were estimated by using the time spent providing support from all ADD family caregivers.
Estimation of the number of people living with ADD by severity level
We estimated the number of people living with ADD with disease severity classified by clinical dementia rating (CDR) score in the 2018 population. People with mild cognitive impairment were not included in the estimation. Using the population aged 65 and over reported in the national statistics [13], we applied epidemiological information reported by Asada et al., who conducted their own survey in eight areas of Japan (n = 5,386) between 2009 and 2011 [2]: the prevalence of dementia defined through multiple diagnostic assessments, the proportions of ADD among them, prevalence rate of each disease severity classified by CDR score level of CDR 0.5, CDR 1, CDR 2, and CDR 3 among people living with ADD.
The number of people living with ADD was estimated through the following equations:
NADD: people living with ADD
N⩾65y: population aged over 65 years
PDEM: prevalence of dementia in the population aged over 65 years (%)
PADD: percentage of people living with ADD in those with dementia (%)
PCDRi*: proportion of people living with ADD with CDR level i (%)
PDRi*: diagnostic rate of people living with ADD with CDR level i (%)
*CDR levels ranging from 1 to 4 represent CDR levels 0.5, 1, 2, and 3, respectively.
Healthcare cost
The annual direct healthcare cost other than ADD drug cost was calculated by multiplying the estimated numbers of people living with ADD and healthcare costs with disease severity classified by CDR score [2, 13–15]. The actual number of people living with ADD incurring healthcare costs would be less than the prevalence of the disease; therefore, we applied the proportion presenting to physicians across the disease severity group [15]. We used the healthcare costs reported by Kitamura et al. based on a questionnaire survey of clinical physicians who examined people living with ADD in practice [14]. According to this literature, the annual healthcare costs other than the drug treatments for people with ADD by disease severity were JPY 127,974 for CDR 1, JPY 199,914 for CDR 2, and JPY 270,018 for CDR 3 (modified to the reimbursement scores as of April 2018). The healthcare costs for CDR 0.5 were not reported. Therefore, we assumed that they were the same as those for CDR 1. The annual ADD drug cost was calculated as the total cost of four drugs (donepezil, rivastigmine, galantamine, and memantine) estimated by multiplying prescription quantities for people living with ADD aged over 65 and drug prices [16].
The healthcare cost was estimated by the following equations:
TCHC: total annual healthcare cost (JPY/year)
HCMC: annual medical cost (other than ADD drug cost) (JPY/year)
HCDC: annual ADD drug cost (JPY/year)
NADDi*: people living with ADD with CDR level i
MCi*: annual medical cost per diagnosed ADD with CDR level i (other than ADD drug cost) (JPY/year)
PQj**: prescription quantity of product j of ADD drugs (donepezil, rivastigmine, galantamine, and memantine) (dose per day×day/year).
DPj**: drug price of product j of ADD drugs (JPY).
*CDR levels ranging from 1 to 4 represent CDR levels 0.5, 1, 2, and 3, respectively.
**Only products with the top 100 prescription quantities were used in the estimation.
Public long-term care costs
In the long-term care insurance system in Japan, the levels of long-term care needed were divided into seven levels: two support levels and five care need levels. Services under the long-term care insurance system were categorized into facility services and home services. The upper limit of benefits paid for home services was determined by care need levels. Long-term care costs by care need level were reported in national statistics, which were based on the public long-term care insurance service users’ claim data throughout Japan [17] and the distribution of care need level with severity level classified by CDR was reported by Asada et al. [2]. The annual public long-term care costs related to ADD by severity level were calculated by multiplying the estimated numbers of people living with ADD and public long-term care costs [2, 13].
The public long-term care cost was estimated by the following equations:
NADDi* people living with ADD with CDR level i
LCi: annual public long-term care cost per diagnosed ADD with CDR level i (JPY/year)
*CDR levels ranging from 1 to 4 represent CDR levels 0.5, 1, 2, and 3, respectively.
Productivity loss
Assumption for the estimation of the number of ADD family caregivers aged 20–69. It was reported that 71.7% of the people living with ADD were living with their family [2]; therefore, we estimated productivity loss as those family members who have a full-time or part-time job and aged 20–69 caregiving for people living with ADD at home while they work. The number of ADD family caregivers for the above people living with ADD was assumed to be one person for each. The productivity loss due to OWI and turnover due to long-term care was included in the case of family members with full-time or part-time employment. Activity impairment was considered for ADD family caregivers. The number of ADD family caregivers in each sex/age group (in 5-year increments; ages 20–69) was estimated by multiplying the number of people living with ADD, the rate of people with dementia living with their families at home, and the rate of each sex/age group among dementia family caregivers. The rate of people with dementia living with their families at home was based on data from a study by Asada et al. [2] and a questionnaire survey conducted in 2013 involving 500 randomized family caregivers for older adults with dementia in a single community [18]. Although education level can affect wages differently for various individuals, we have used average wages by sex and age group, as reported by the MHLW, and have thus not taken education level into account as it does not affect the results of this analysis.
Overall work impairment. The number of ADD family caregivers continuing to work was estimated by multiplying the number of ADD family caregivers in each sex/age group, the rate of those working, rates of full-time and part-time employees, and rate of family caregivers continuing to work. OWI was the score indicated for the percentage of work time missed or impairment while working due to caregiver’s health and was surveyed using the Work Productivity and Activity Impairment questionnaire [19]. The percent OWI for their family caregiving in respondents of the survey conducted for Japanese ADD family caregivers was used for the estimation [20]. The productivity loss of OWI was estimated by multiplying the estimated number of family caregivers aged 20–69 who continued working, percent OWI per caregiver (25.69%), and annual income [2, 13, 18, 20–23].
Turnover due to long-term care. The number of ADD family caregivers who left their jobs was estimated by multiplying the number of ADD family caregivers in each sex/age group, the rate of those working, rates of full-time and part-time employees, rate of family caregivers who left their jobs (1-the rate of continuing to work), and the rate of those who left their jobs for care-related reasons. The productivity loss of turnover due to long-term care was estimated by multiplying the estimated number of family caregivers who left their jobs and annual income [2, 13, 18, 21–23].
Activity impairment. The number of ADD family caregivers engaged in housework was estimated by multiplying the number of ADD family caregivers in each age group by the rate of the labor force engaged in housework in each age group. The productivity loss due to activity impairment was estimated by multiplying the number of ADD family caregivers engaged in housework, percent activity impairment per caregiver (25.43%), and value of unpaid work by unemployed spouses [2, 13, 18, 20, 24, 25].
The productivity loss was estimated by the following equations:
TCPL: total annual cost of productivity loss (JPY/year)
PLOWI: annual productivity loss of OWI (JPY/year)
PLTO: annual productivity loss of turnover due to long-term care (JPY/year)
PLAI: annual productivity loss of activity impairment (JPY/year)
NCGs,t: the number of family caregivers of people living with ADD at the sex and age strata of s, t
PERs,t: employment rate at sex and age strata of s, t (%)
PESn,s,t: proportion of employment status of n at sex and age strata of s, t (%)
PCRn,s,t: continuation rate of employment with employment status of n at sex and age strata of s, t (%)
OWI: overall work impairment (%)
INn,s,t: annual income of employment status of n at sex and age strata of s,t (JPY/year)
PTRn,s,t: turnover rate due to long-term care in employment status of n at sex and age strata of s, t (%)
PHWs,t: percentage of housework by working ADD family caregivers at sex and age strata of s, t (%)
AI: activity impairment (%)
UWs,t: value of unpaid work by unemployed ADD family caregivers at sex and age strata of s, t (JPY)
n: employment status (1 = full-time, 2 = part-time)
s: sex (1 = male, 2 = female)
t: 10 age groups divided into 5 years from to 20–69 years old
Informal care cost
The number of all ADD family caregivers was estimated in the same way as the estimation of productivity loss. The informal care time of all ADD family caregivers was based on a survey report of Japanese ADD family caregivers by Montgomery et al. [26]. The informal care time was divided into time spent providing support with activities of daily living (ADL), instrumental activities of daily living (IADL), and supervision time by the care need level in long-term care for people living with ADD [5]. ADL and IADL time were used as the time for estimating informal care costs. The cost corresponding to ADL time was set to the unit cost (577 points / hour) of caregiving service of long-term care insurance [27], and the cost corresponding to IADL time was set to the average wage by sex/age group.
The informal care cost was estimated by the following equations:
TCIC: total informal care cost of ADD
NCGs,t: the number of family caregivers of people living with ADD at the sex and age strata of s, t
TADL: informal care time for ADL of people living with ADD (hours/day)
UCADL: unit cost of informal care for ADL (JPY/hour)
TIADL: informal care time for IADL of people living with ADD (hours/day)
WAs,t: hourly wage at sex and age strata of s, t (JPY/year)
PERs,t: employment rate at sex and age strata of s, t (%)
TADLu: informal care time for ADL of people living with ADD with care needed level u (hours/day)
TIADLu: informal care time for IADL of people living with ADD with care needed level u (hours/day)
PNEu: percentage of people living with ADD with care needed level u
INn,s,t: annual income of employment status of n at sex and age strata of s, t (JPY/year)
HWn,s,t: annual hours worked of n at sex and age strata of s, t (hours/year)
Rn,s,t: ratios of the number of full-time employees (n = 1) and part-time employees (n = 2) at the sex and age strata of s, t (JPY/year)
n: employment status (1 = full-time, 2 = part-time)
s: sex (1 = male, 2 = female)
t: 10 age groups divided into 5 years from to 20–69 years old
u: care needed level (1 = no long-term nursing care insurance, support levels 1 or 2, or level unknown, 2 = nursing care levels 1, 2, or 3, 3 = nursing care levels 4 or 5)
Sensitivity analysis
Considering that the prevalence data were old, as they were from a 2009–2011 survey, and the diagnosis rates may be uncertain, sensitivity analyses were performed on prevalence and diagnostic rates. The prevalence based on the 2009–2011 survey [2] was adjusted to the value in 2018 using the slope of a regression curve derived from prevalence at four time points (1992, 1998, 2005, and 2012) reported by Ohara et al. [7]. The range of prevalence was set as the 95% confidence interval of the adjusted prevalence. The range of diagnostic rates was set to±20%.
RESULTS
Targeted literature review
For the literature review, 3,364 papers were collected in total: 1,351 from MEDLINE, 2,001 from Ichushi Web, and 12 through a hand search. Among these papers, 145 articles were finally included for qualitative integration (Fig. 1). The following study items were included: epidemiological data (35), quality of life (29), costs (16), care need levels (14), residential care rates (8), productivity loss (2), burden on caregivers (5), BOI (46), and informal care (14).
Fig. 1
Flowchart of Paper Selection.
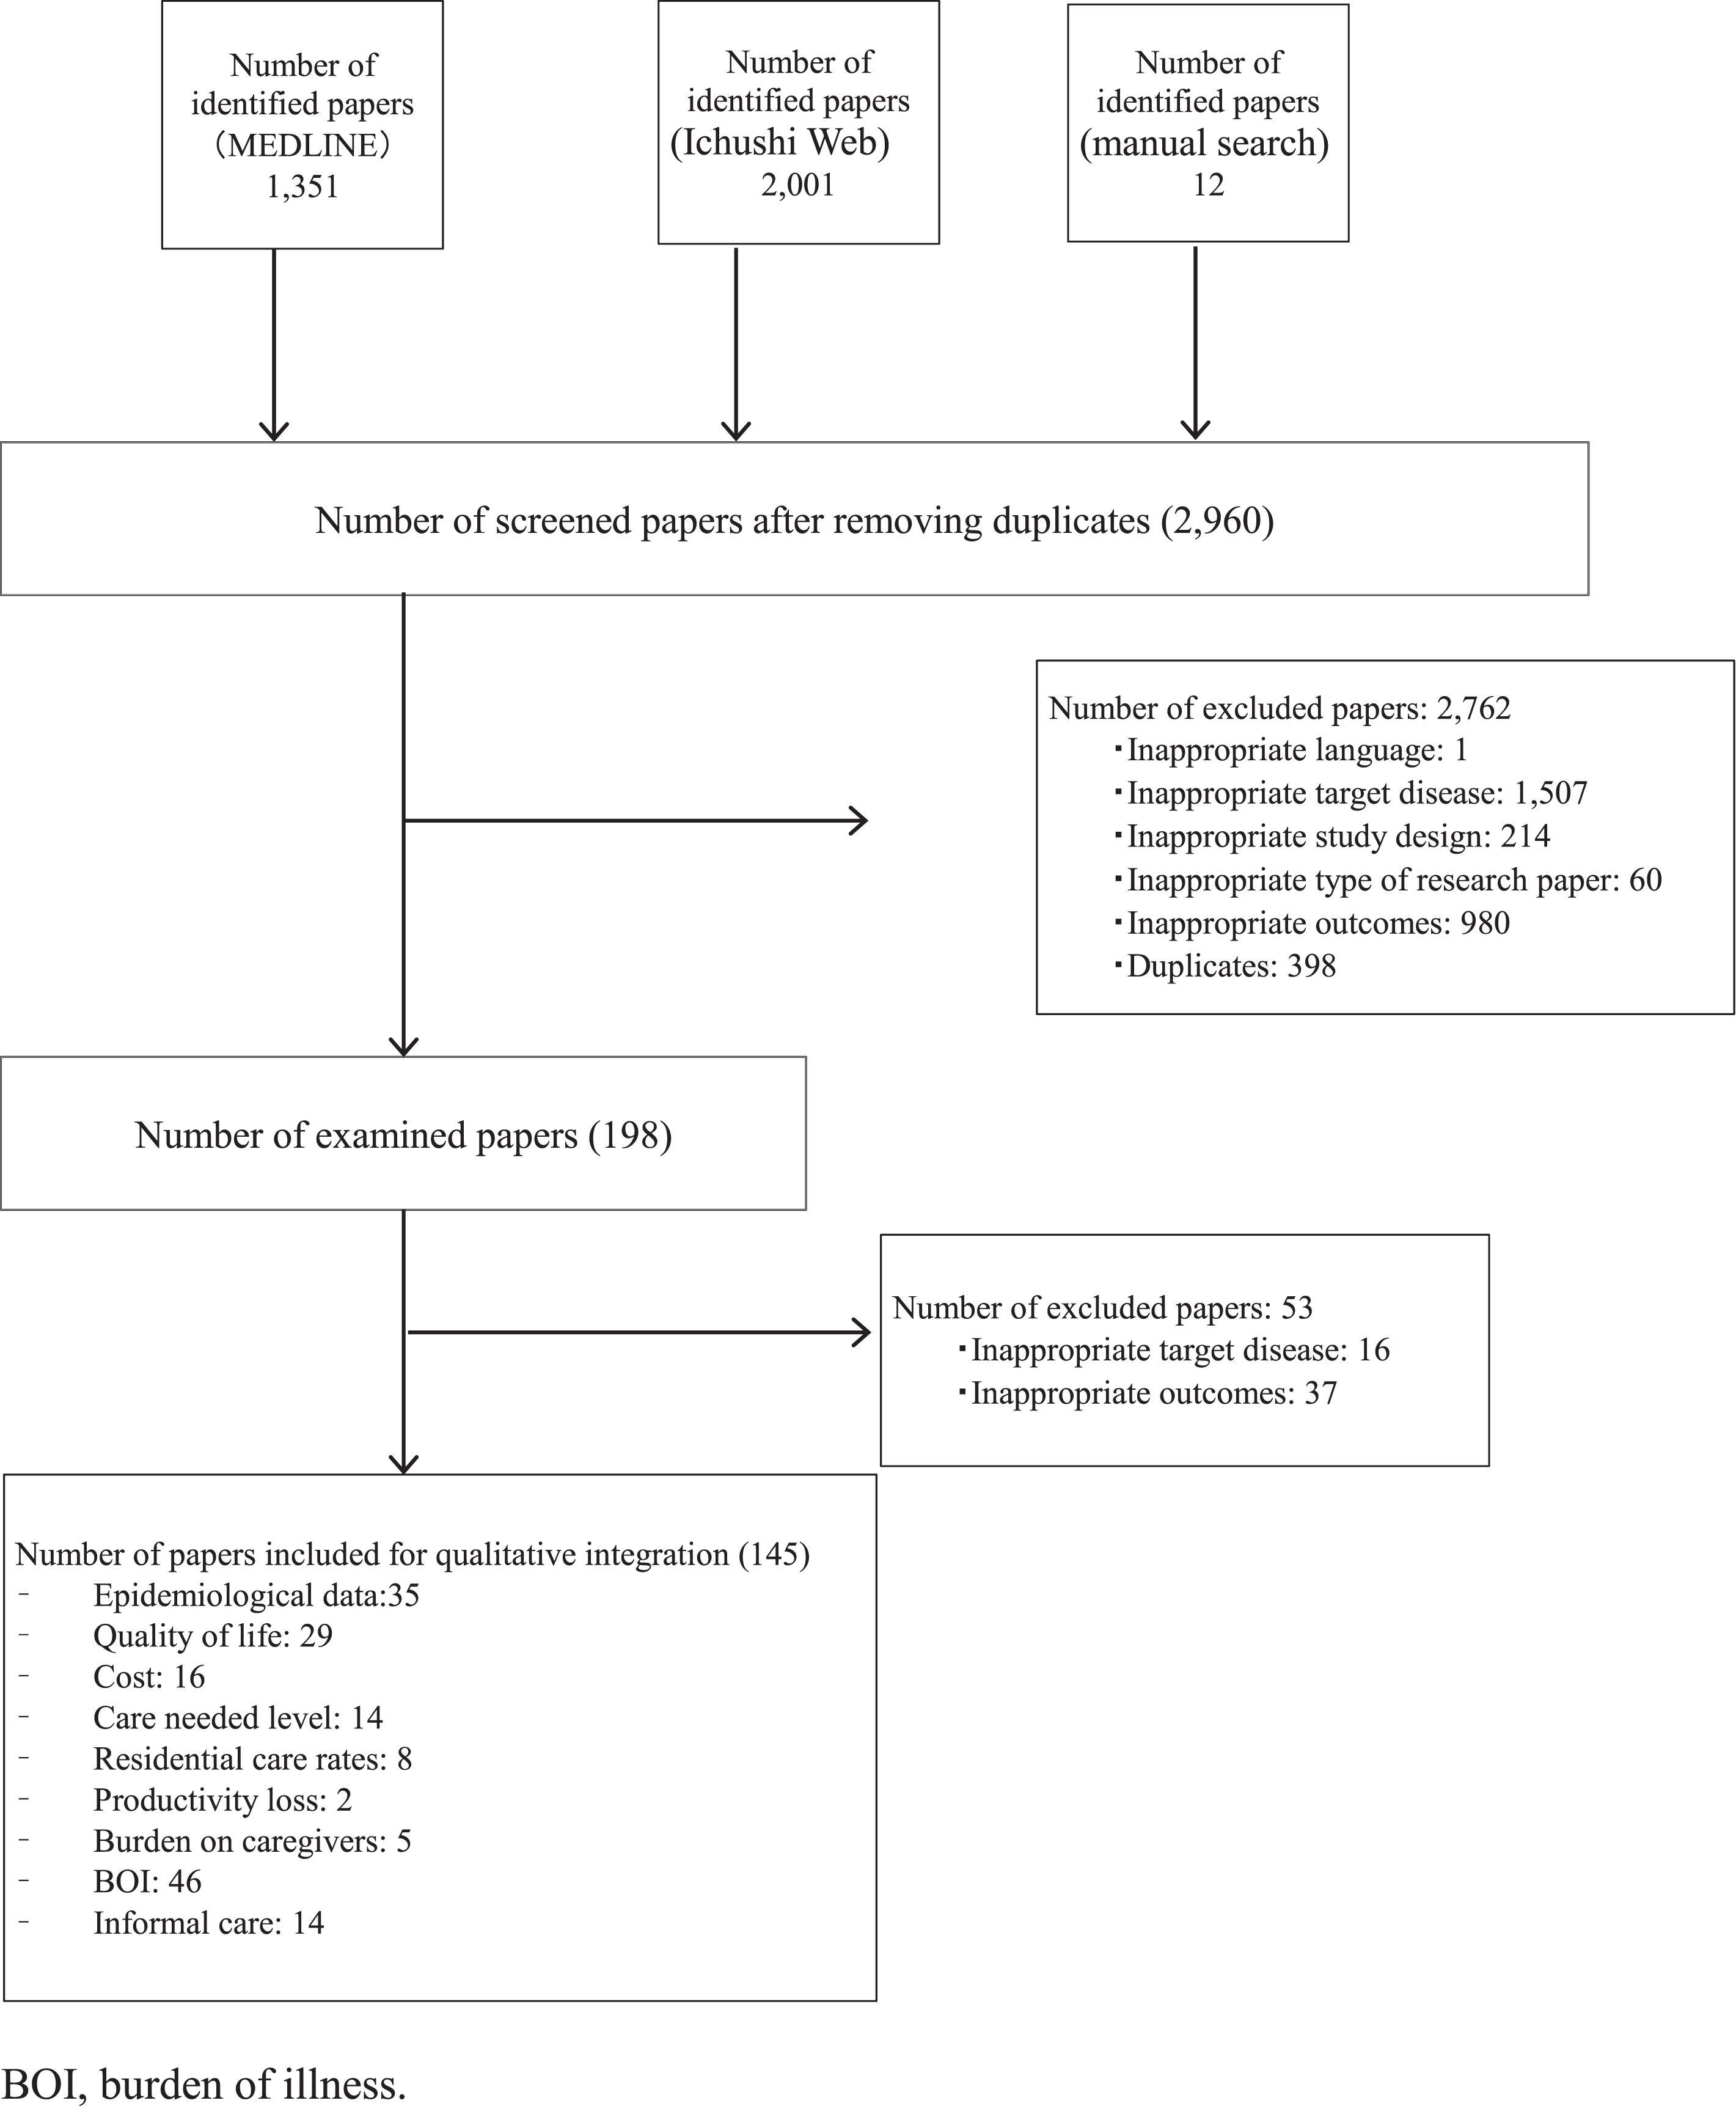
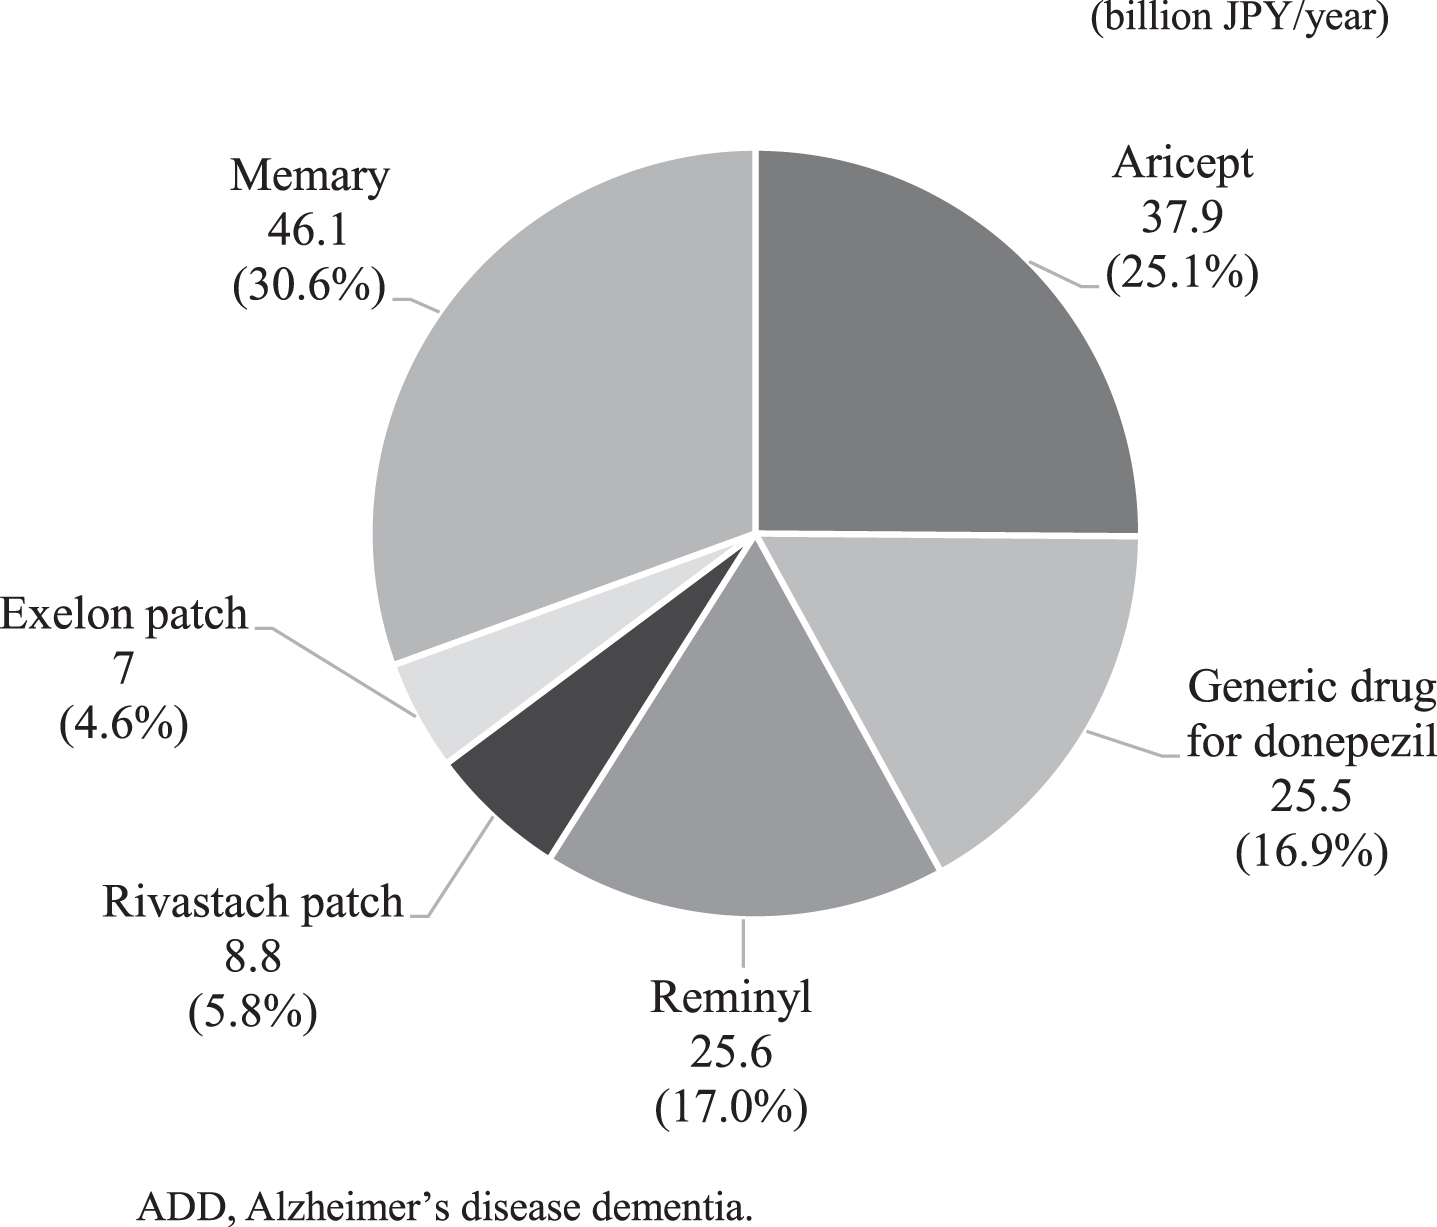
Fig. 2
Breakdown of ADD drug costs.
People living with ADD and caregiver estimation
There are approximately 3.6 million people with ADD in Japan, which accounts for 10% of the population over 65 years old. Similarly, the number of ADD family caregivers aged 20–69 and all ADD family caregivers were estimated at 1.925 (male: 0.481; female: 1.444) million, 2.588 (male: 0.721; female: 1.866) million, respectively.
Economic burden of ADD
The total annual healthcare costs of ADD were JPY 1,073 billion, of which 86% (JPY 923 billion) were attributed to healthcare costs other than ADD drug costs, and 14% (JPY 151 billion) were for ADD drug costs (Table 1). The annual healthcare costs other than ADD drug costs by severity were less than JPY 200 billion for people living with ADD with CDR 0.5, CDR 1, and CDR 2, respectively, but increased to JPY 447 billion (48%) for people living with ADD with CDR 3. The expected cost per people living with ADD was JPY 297,524/year.
Table 1
Healthcare and long-term care costs
| Healthcare costs (/year) | Public long-term care costs (/year) | ||||||
| Number of people living with ADD (n) | Other than ADD drug costs | ADD drug costs | |||||
| Total (billion JPY) | Per people living with ADD (JPY) | Total (billion JPY) | Total (billion JPY) | Total (billion JPY) | Per people living with ADD (JPY) | ||
| Total | 3,607,609 | 922.5 | 255,714 | 150.8 | 1073.4 | 4,783.2 | 1,325,862 |
| CDR 0.5 | 954,125 | 127.3 | 275,148 | – | – | 242.3 | 253,919 |
| CDR 1 | 1,151,725 | 153.7 | 275,148 | – | – | 1,059.4 | 919,814 |
| CDR 2 | 660,548 | 194.6 | 419,028 | – | – | 1,182.5 | 1,790,152 |
| CDR 3 | 841,211 | 446.9 | 559,236 | – | – | 2,299.1 | 2,733,045 |
ADD, Alzheimer’s disease dementia; CDR, clinical dementia rating.
The annual public long-term care costs were estimated to be JPY 4,783 billion, which increased according to severity from JPY 242 billion for CDR 0.5 (5%), JPY 1,059 billion for CDR 1 (22%), JPY 1,183 billion for CDR 2 (25%) to JPY 2,299 billion for CDR 3 (48%) (Table 1). The expected cost per people living with ADD was JPY 1,325,862/year.
The productivity loss among ADD family caregivers due to each cause was as follows: OWI: JPY 968 billion; leaving a job for a care-related reason: JPY 253.5 billion; and activity impairment: JPY 325.5 billion. The total productivity loss was estimated to be JPY 1,547 billion (Table 2). The cost per people living with ADD was JPY 428,827/year.
Table 2
Productivity loss (/year)
| Male | Female | Total | |||||||||||||
| Productivity loss (billion JPY) | Productivity loss (billion JPY) | ||||||||||||||
| Age range (y) | Number of ADD family caregivers (n) | OWI | Turnover due to long-term care | AI | Total | Number of ADD family caregivers (n) | OWI | Turnover due to long-term care | AI | Total | Productivity loss (billion JPY) | ||||
| Full-time | Part-time | Full-time | Part-time | Full-time | Part-time | Full-time | Part-time | ||||||||
| Total | 481,222 | 329.4 | 66.7 | 30.4 | 17.7 | 3.7 | 447.8 | 1,443,897 | 292.2 | 279.8 | 90.2 | 115.2 | 321.9 | 1,099.2 | 1,547.0 |
| 20–24 | 6,853 | 2.4 | 1.2 | 0.2 | 0.3 | 0.00 | 4.1 | 6,404 | 1.8 | 1.1 | 0.6 | 0.4 | 0.2 | 4.1 | 8.2 |
| 25–29 | 6,706 | 5.1 | 0.7 | 0.5 | 0.2 | 0.001 | 6.4 | 6,327 | 2.9 | 0.9 | 0.9 | 0.4 | 0.8 | 5.9 | 12.3 |
| 30–34 | 7,418 | 7.0 | 0.5 | 0.6 | 0.1 | 0.01 | 8.4 | 7,110 | 2.7 | 1.2 | 0.8 | 0.5 | 1.7 | 7.0 | 15.4 |
| 35–39 | 8,188 | 8.5 | 0.5 | 0.8 | 0.1 | 0.01 | 10.0 | 7,925 | 2.7 | 1.5 | 0.8 | 0.6 | 2.1 | 7.7 | 17.7 |
| 40–44 | 14,160 | 16.1 | 0.7 | 1.5 | 0.2 | 0.02 | 18.5 | 96,929 | 32.7 | 21.9 | 10.1 | 9.0 | 22.1 | 95.8 | 114.3 |
| 45–49 | 15,005 | 18.0 | 0.8 | 1.7 | 0.2 | 0.04 | 20.7 | 103,392 | 33.7 | 24.7 | 10.4 | 10.2 | 19.4 | 98.4 | 119.1 |
| 50–54 | 95,704 | 121.0 | 4.9 | 11.2 | 1.3 | 0.3 | 138.5 | 313,737 | 99.4 | 72.0 | 30.7 | 29.6 | 60.0 | 291.6 | 430.2 |
| 55–59 | 86,960 | 99.1 | 5.4 | 9.1 | 1.4 | 0.4 | 115.4 | 289,209 | 77.2 | 62.5 | 23.8 | 25.7 | 64.6 | 253.9 | 369.3 |
| 60–64 | 108,706 | 38.5 | 29.1 | 3.5 | 7.7 | 1.0 | 79.9 | 271,497 | 26.9 | 55.6 | 8.3 | 22.9 | 67.0 | 180.6 | 260.5 |
| 65–69 | 131,521 | 13.8 | 22.9 | 1.3 | 6.1 | 1.9 | 45.9 | 341,365 | 12.2 | 38.4 | 3.8 | 15.8 | 83.9 | 154.1 | 200.0 |
ADD, Alzheimer’s disease dementia; AI, activity impairment; OWI, overall work impairment.
The total annual cost of ADD (per person) was estimated to be JPY 7,404 billion (JPY 2,052,213/year) when productivity loss was treated as a cost of time spent on family caregiving activities, and 12,628 billion (3,500,463/year) when informal care cost was treated likewise (Table 3).
Table 3
Total estimated costs (/year)
| Total estimated costs (billion JPY) | Total estimated costs per people living with ADD (JPY) | ||
| Healthcare costs | Healthcare costs other than ADD drug costs | 922.5 | 255,714 |
| ADD drug costs | 150.8 | 41,811 | |
| Total | 1,073.4 | 297,524 | |
| Public long-term care costs | 4,783.2 | 1,325,862 | |
| Productivity loss | OWI | 968.0 | 268,331 |
| Turnover due to long-term care | 253.5 | 70,260 | |
| AI | 325.5 | 90,235 | |
| Total | 1,547.0 | 428,827 | |
| Informal care costs | 6,771.8 | 1,877,077 | |
| Total (when productivity loss was treated as cost of time spent on family caregiving activities) | 7,403.6 | 2,052,213 | |
| Total (when informal care cost was treated as cost of time spent on family caregiving activities) | 12,628.3 | 3,500,463 | |
ADD, Alzheimer’s disease dementia; AI, activity impairment; OWI, overall work impairment.
Sensitivity analysis
Based on the sensitivity analyses of prevalence and diagnostic rates, the total annual costs were estimated to be JPY 7,273–9,767 billion/year and JPY 7,314–7,442 billion/year, respectively, when productivity loss was treated as the cost of time spent on family caregiving activities (Table 4). Similarly, when the informal care cost was treated as the cost of time spent on family caregiving activities, the costs were estimated to be JPY 12,403–16,695 billion/year and JPY 12,539–12,667 billion/year, respectively.
Table 4
Results of sensitivity analyses
| Item | Base-case | Setting range | Total estimated costs (billion JPY) | ||
| when productivity loss was treated as cost of time spent on family caregiving activities | when informal care cost was treated as cost of time spent on family caregiving activities | ||||
| Base-case | – | – | 7,403.6 | 12,628.3 | |
| Sensitivity Analysis | |||||
| Prevalence | 15% | 14.7% –19.9% | 7,272.7 –9,767.3 | 12,403.1 –16,694.7 | |
| Diagnostic rate | CDR 0.5 | 48.5% | 38.8% –58.2% | 7,378.1 –7,429.0 | 12,602.8 –12,653.8 |
| CDR 1 | 48.5% | 38.8% –58.2% | 7,372.8 –7,434.3 | 12,597.6 –12,659.0 | |
| CDR 2 | 70.3% | 56.2% –84.4% | 7,364.7 –7,442.5 | 12,589.4 –12,667.2 | |
| CDR 3 | 95.0% | 76.0% –100% | 7,314.2 –7,427.1 | 12,538.9 –12,651.8 | |
CDR, clinical dementia rating.
DISCUSSION
The annual economic burden of ADD in Japan was estimated at JPY 7.4036 trillion or JPY 12.6283 trillion, and the expected cost per people living with ADD was estimated at JPY 2,052,213 or JPY 3,500,463. All healthcare costs other than those of ADD drugs and public long-term care were higher in CDR 3 than in CDR 2 or milder cases. Public long-term care costs accounted for most of the overall economic burden at 65%. The prevalence data [2] used in the present study were from surveys conducted in 2009–2011 in eight areas, and the prevalence of dementia was considered to increase over time in a study reporting chronological changes (1992–2012) in the rate in a single area [7]. Therefore, the annual economic burden in 2018 was estimated to be from JPY 7.2727 to 9.7673 trillion or from JPY 12.4031 to 16.6947 trillion by adjusting the prevalence in 2018 using this chronological tendency. In another sensitivity analysis with a diagnosis rate of±20%, it was estimated to be from JPY 7.3142 to 7.4425 trillion or from JPY 12.5389 to 12.6672 trillion. Based on these findings, the annual economic burden of ADD in Japan was estimated at JPY 7.4036 trillion when productivity loss was treated as the cost of time spent on family caregiving activities, and JPY 12.6283 trillion when informal care cost was treated likewise. Both costs are unpaid care costs of caregivers [28], but the scope of time considered as societal loss is different, and the method is also different. The former was estimated by the opportunity cost method and the latter was estimated by the replacement cost method. Therefore, the economic burden of the two definitions were not added together but were listed together.
The costs per people living with ADD in three European countries (France, Germany, and the UK) were reported in a previous study [28], where monthly direct and indirect costs among people aged 55 or over with probable Alzheimer’s disease and their caregivers registered by specialist secondary care clinics (“memory clinics”) between 2010 and 2011 were calculated. The sum of caregiver informal care, healthcare, and social care costs was EUR 1,779/year (JPY 2,561,760/year) in France, EUR 2,205/year (JPY 3,175,200/year) in Germany, and EUR 1,922/year (JPY 2,767,680) in the UK (1 EUR = 120 JPY). Moreover, as a meta-analysis-based estimate of ADD prevalence in Europe was 5.05% [29], the nationwide costs of sum of caregiver informal care, healthcare, and social care in the three European countries may be JPY 1,574 billion, JPY 2,783 billion, and JPY 1,655 billion, respectively (when using the population data of each country in 2015) [30], and the to Gross Domestic Product (GDP) ratios 0.59%, 0.71%, and 0.60%, respectively. The to-GDP ratio of 1.31% found in Japan is higher than these values (when using the GDP data of the three European countries in 2015 and those of Japan in 2018) [31]. It is not appropriate to simply compare these values, as the population distribution, prevalence, target year, and healthcare system vary among countries, but the economic burden of ADD may be higher in Japan, with a great impact on its national finances.
In Japan, the public long-term care insurance system was introduced in 2001 and covered up to a maximum number of benefits according to the level of care required. The government compiled a new policy program for dementia called Comprehensive Strategy to Accelerate Dementia Measures (hereinafter “Dementia Outline”) with the aim of strengthening dementia-related measures in 2019 after formulating the dementia policies called Orange Plan in 2012 and 2015. This national dementia strategy positions “living together” to create a livable society for people who may develop dementia, and “prevention” to delay the onset or progression of dementia as the two wheels of the vehicle, with the following five pillars: 1) public awareness; 2) prevention; 3) support for medical care, nursing care services, and caregivers; 4) promotion of barrier-free services for people with dementia, support for people with juvenile dementia, and support for social participation; 5) research and development, industry promotion, and international development. The Dementia Outline set the goal to “one year delay of the disease onset in one’s 70’s in 10 years,” by encouraging exercise, preventing lifestyle diseases such as diabetes and hypertension, and reducing social isolation and retaining the role of social participation, which may help delay the onset of dementia [32]. As one of the reforms of the long-term care insurance system, Dementia Outline included the expansion of “commuting” to places in the community where older adults can casually take part in physical exercises and other activities, as well as the increase in the number of participants in training programs to improve the skills of professionals in dementia care, such as physicians and medical workers.
The recent COVID-19 pandemic has led to the relaxation of some national healthcare insurance coverage for online medical treatment including the first consultation with family doctors throughout lifestyle change in whole Japan. There are also high expectations for the use of digital health in dementia control as well as the other chronic diseases. In addition to practical initiatives at the municipal level, efforts at the private sector level will be important to implement these measures. For instance, the development of a digital health tool that enables people to be aware of their own brain performance in daily life from a healthier state can contribute to delayed onset or progression of disease by easily self-examining brain performance and recording daily health status (called Life Log data). If the development and support in the field of digital health can delay the onset and progression of dementia, this may help to reduce the economic burden of ADD, together with the effort of practical activities such as enriching communication opportunities and preventing social isolation, as well as further improvement of the care system and understanding of people with dementia.
The present study has several limitations. First, estimates were performed by combining data from multiple sources. Using limited data, values in each sex/age group of family caregivers in a single community were extrapolated as nationwide data. Given that the aging rate in this community was approximately 6% lower than the national average [24], the results in this study might have been underestimated. To improve the accuracy of informal care cost estimation, data regarding ADD family caregivers should be collected from throughout Japan in future studies. Second, the healthcare costs of informal family caregivers were not included in this analysis. Zhu et al. examined the overall effects of people living with dementia and caregiver characteristics on caregivers’ own medical care use and related costs and suggested that dementia comorbid conditions and dependence were associated with increased healthcare use and costs of caregivers [33]. The healthcare costs of ADD family caregivers were not included in this estimate because no reports were available that clearly showed an increase in the healthcare costs of ADD family caregivers in Japan. Future studies to quantitatively assess the impact on ADD family caregivers’ own healthcare costs are awaited. Third, because the relevant evidence required for the estimation of economic burden was not available, early onset cases with ADD were not included in this analysis. As the economic burden of younger cases might have a larger impact on both costs and family burden, this is an issue for future research.
Compared to other countries, Japan may bear a heavier economic burden of ADD, which has a great impact on its national finances and ADD family caregivers. This study showed the difference in economic burden due to ADD severity and the burden was markedly heavy in more severely affected people living with ADD. In Japan’s rapidly aging society, the number of people living with ADD is expected to reach approximately 6.5 to 7 million by 2025 and 8.5 to 11.5 million by 2060 [3]. To minimize the economic burden of ADD, prolonging healthy life expectancy is the key factor to be addressed. Efforts at the local government level in practice as well as at the private sector level will be important to realize the national dementia strategy of “living together” to create a respectful society for people with dementia, and prevention strategies to delay the onset or progression of the disease.
ACKNOWLEDGMENTS
This study was funded by Eisai.
Authors’ disclosures available online (https://www.j-alz.com/manuscript-disclosures/21-0075r1).
REFERENCES
[1] | Prince M , Wimo A , Guerchet M , Ali G , Wu Y , Prina A , Alzheimer’s Disease International ((2015) ) World Alzheimer Report 2015: The Global Impact of Dementia: An Analysis of Prevalence, Incidence, Cost and Trends, Alzheimer’s Disease International, London. |
[2] | Asada T ((2013) ) Prevalence of dementia and response to life dysfunction due to dementia in urban areas, Health Labour Sciences Research Grants, Dementia Countermeasures Comprehensive Research Project 2011-2012 Research Report. |
[3] | Ninomiya T ((2015) ) Study on future projection of the elderly population with dementia in Japan, Health and Labor Sciences Research Grants, Special Health and Labor Sciences Research Project 2014 Research Report. |
[4] | Ministry of Health, Labour and Welfare, Comprehensive Survey of Living Conditions in 2016, https://www.mhlw.go.jp/toukei/saikin/hw/k-tyosa/k-tyosa16/index.html, Accessed on August 19, 2020. |
[5] | Sado M , Ninomiya A , Shikimoto R , Ikeda B , Baba T , Yoshimura K , Mimura M ((2018) ) The estimated cost of dementia in Japan, the most aged society in the world. PLoS One 13: , e0206508. |
[6] | Prince M , Jackson J ((2009) ) World Alzheimer Report 2009: The Global Prevalence of Dementia, Alzheimer’s Disease International, London. |
[7] | Ohara T , Hata J , Yoshida D , Mukai N , Nagata M , Iwaki T , Kitazono T , Kanba S , Kiyohara Y , Ninomiya T ((2017) ) Trends in dementia prevalence, incidence, and survival rate in a Japanese community. Neurology 88: , 1925–1932. |
[8] | Prince M , Knapp M , Guerchet M , McCrone P , Prina M , Comas-Herrera A , Wittenberg R , Adelaja B , Hu B , King D , Rehill A , Salimkumar D ((2014) ) Dementia UK: Update second edition, Alzheimer’s Society, Plymouth. |
[9] | Takechi H , Kokuryu A , Kuzuya A , Matsunaga S ((2019) ) Increase in direct social care costs of Alzheimer’s disease in Japan depending on dementia severity. Geriatr Gerontol Int 19: , 1023–1029. |
[10] | Ministry of Health, Labour and Welfare, MHLW Grants system, https://mhlw-grants.niph.go.jp/, Accessed on August 19, 2020. |
[11] | Ministry of Health, Labour and Welfare, Ministry of Health, Labour and Welfare Statistical Surveys, https://www.mhlw.go.jp/toukei/itiran/index.html, Accessed on August 19, 2020. |
[12] | The GRADE Working Group, Handbook for grading the quality of evidence and the strength of recommendations using the GRADE approach, https://gdt.gradepro.org/app/handbook/handbook.html, Accessed on August 19, 2020. |
[13] | Ministry of Internal Affairs and Communications, Population Estimates (As of October 1, 2018), https://www.stat.go.jp/data/jinsui/2018np/index.html, Accessed on August 19, 2020. |
[14] | Kitamura S , Inoue S , Matsui D , Matsushita Y ((2014) ) Cost-effectiveness analysis for memantine monotherapy in patients with moderate and severe Alzheimer’s disease. Japan J Geriatr Psychiatry 25: , 1361–1373. |
[15] | Alzheimer’s Disease by Global Regions Collated by Decision Resources FOR Eisai, DRG. |
[16] | Ministry of Health, Labour and Welfare, The 3rd NDB Open Data Japan, https://www.mhlw.go.jp/stf/seisakunitsuite/bunya/0000177221_00002.html, Accessed on August 19, 2020. |
[17] | Ministry of Health, Labour and Welfare, Statistics of Long-term Care Benefit Expenditures (Cases assessed on April 2018), https://www.mhlw.go.jp/toukei/saikin/hw/kaigo/kyufu/2018/04.html, Accessed on August 19, 2020. |
[18] | Health and Welfare Department Longevity Division, Kusatsu City (2014) Questionnaire report about elderly people with dementia. |
[19] | Margaret Reilly Associates, Inc., Reilly Associates Health Outcomes Research, http://www.reillyassociates.net, Accessed on August 19, 2020. |
[20] | Goren A , Montgomery W , Kahle-Wrobleski K , Nakamura T , Ueda K ((2016) ) Impact of caring for persons with Alzheimer’s disease or dementia on caregivers’ health outcomes: Findings from a community based survey in Japan. BMC Geriatr 16: , 122. |
[21] | Ministry of Internal Affairs and Communications, Labour Force Survey in 2018, https://www.stat.go.jp/data/roudou/longtime/03roudou.html, Accessed on August 19, 2020. |
[22] | The Japan Institute for Labour Policy and Training (2016) Survey on employment and turnover of caregivers. |
[23] | Ministry of Health, Labour and Welfare, Basic Survey on Wage Structure in 2018, https://www.mhlw.go.jp/toukei/list/chinginkouzou.html, Accessed on August 19, 2020. |
[24] | Ministry of Internal Affairs and Communications, Population Census in 2015, https://www.stat.go.jp/data/kokusei/2015/kekka.html, Accessed on August 19, 2020. |
[25] | Cabinet Office, Government of Japan, The valuation of household work, https://www.esri.cao.go.jp/jp/sna/sonota/satellite/roudou/contents/kajikatsudoutou.html, Accessed on August 19, 2020. |
[26] | Montgomery W , Goren A , Kahle-Wrobleski K , Nakamura T , Ueda K ((2018) ) Detection, diagnosis, and treatment of Alzheimer’s disease dementia stratified by severity as reported by caregivers in Japan. Neuropsychiatr Dis Treat 14: , 1843–1854. |
[27] | Welfare and Medical Service Network System, Table of service codes for nursing care benefit cost units, https://www.wam.go.jp/gyoseiShiryou-files/documents/2019/0801195620839/C_20190701.pdf, Accessed on December 15, 2020. |
[28] | Dodel R , Belger M , Reed C , Wimo A , Jones RW , Happich M , Argimon JM , Bruno G , Vellas B , Haro JM ((2015) ) Determinants of societal costs in Alzheimer’s disease: GERAS study ine results. Alzheimers Dement 11: , 933–945 basel. |
[29] | Niu H , Álvarez-Álvarez I , Guillén-Grima F , Aguinaga-On-toso I ((2017) ) Prevalence and incidence of Alzheimer’s disease in Europe: A meta-analysis.a}. Neurolog’{ı 32: , 523–532. |
[30] | United Nations, World Population Prospects: The 2019 revision, https://population.un.org/wpp/Download/Standard/Population/, Accessed on August 19, 2020. |
[31] | International Monetary Fund, World Economic Outlook Database: October 2019 Edition, https://www.imf.org/external/pubs/ft/weo/2018/02/weodata/index.aspx, Accessed on August 19, 2020. |
[32] | Livingston G , Sommerlad A , Orgeta V , Costafreda SG , Huntley J , Ames D , Ballard C , Banerjee S , Burns A , Cohen-Mansfield J , Cooper C , Fox N , Gitlin LN , Howard R , Kales HC , Larson EB , Ritchie K , Rockwood K , Sampson EL , Samus Q , Schneider LS , Selbæk G , Teri L , Mukadam N ((2017) ) Dementia prevention, intervention, and care. Lancet 390: , 2673–2734. |
[33] | Zhu CW , Scarmeas N , Ornstein K , Albert M , Brandt J , Blacker D , Sano M , Stern Y ((2015) ) Health-care use and cost in dementia caregivers: Longitudinal results from the Predictors Caregiver Study. Alzheimers Dement 11: , 444–454. |

