
Different Inflammatory Signatures in Alzheimer’s Disease and Frontotemporal Dementia Cerebrospinal Fluid
Abstract
Background:
Neuroinflammatory processes are common in neurodegenerative diseases such as Alzheimer’s disease (AD) and frontotemporal dementia (FTD), but current knowledge is limited as to whether cerebrospinal fluid (CSF) levels of neuroinflammatory proteins are altered in these diseases.
Objective:
To identify and characterize neuroinflammatory signatures in CSF from patients with AD, mild cognitive impairment (MCI), and FTD.
Methods:
We used proximity extension assay and ANOVA to measure and compare levels of 92 inflammatory proteins in CSF from 42 patients with AD, 29 with MCI due to AD (MCI/AD), 22 with stable MCI, 42 with FTD, and 49 control subjects, correcting for age, gender, collection unit, and multiple testing.
Results:
Levels of matrix metalloproteinase-10 (MMP-10) were increased in AD, MCI/AD, and FTD compared with controls (AD: fold change [FC] = 1.32, 95% confidence interval [CI] 1.14–1.53, q = 0.018; MCI/AD: FC = 1.53, 95% CI 1.20–1.94, q = 0.045; and FTD: FC = 1.42, 95% CI 1.10–1.83, q = 0.020). MMP-10 and eleven additional proteins were increased in MCI/AD, compared with MCI (q < 0.05). In FTD, 36 proteins were decreased, while none was decreased in AD or MCI/AD, compared with controls (q < 0.05).
Conclusion:
In this cross-sectional multi-center study, we found distinct patterns of CSF inflammatory marker levels in FTD and in both early and established AD, suggesting differing neuroinflammatory processes in the two disorders.
INTRODUCTION
Alzheimer’s disease (AD) and frontotemporal de-mentia (FTD) are two of our most common neurodegenerative disorders. Whereas both diseases are characterized by neuroinflammatory processes, we have limited knowledge of how these are mirrored in the cerebrospinal fluid (CSF).
AD is characterized by cerebral accumulation of amyloid-β (Aβ) into plaques, aggregation of hyperphosphorylated tau into neurofibrillary tangles, and neuroinflammation associated with activation of mic-roglia and astrocytes [1]. During the disease development, patients pass through a stage of mild cognitive impairment (MCI), which may occur several years before the onset of dementia [2]. However, only about 50% of all MCI cases progress to AD dementia, whereas the other half remains cognitively stable even after several years of follow-up [3]. It is today largely unknown what molecular features, other than Aβ and tau mismetabolism, that distinguish MCI patients with incipient AD from non-progressors. Among different theories, neuroinflammation has been hypothesized to be such a disease determinant. More specifically, temporary inflammatory reactions have been proposed to be beneficial in early AD stages but may contribute to an accelerated neurode-generative process if becoming chronic [4]. Furthermore, many AD risk gene variants (e.g., TREM2, CD33, and APOE) have been associated with mic-roglia dysfunction, which in turn may be implicated in chronic inflammation [4]. However, current knowledge of inflammatory protein involvement in AD development is limited.
Several studies have evaluated neuroinflammatory features in AD CSF or plasma, with diverse findings such as decreased levels of IL-8 or increased levels of GFAP [5, 6]. A recent review described increases in eleven inflammatory proteins in AD in at least two CSF studies, whereas only one was decreased [7]. Of the studies reviewed, only two included MCI patients, none of which made distinction between MCI due to AD and stable MCI [8, 9].
As the second most common neurodegenerative disorder before the age of 65 [10], FTD includes the behavioral variant of frontotemporal dementia (bvFTD) as well as forms characterized by various degrees of language dysfunction, e.g., primary prog-ressive aphasia (PPA) and its subtypes nonfluent variant (nfvPPA), semantic variant (svPPA), and log-openic variant (lvPPA) [11, 12]. Similar to cellular changes in the AD brain, microgliosis and astrocytosis are typically seen also in the FTD brain [13]. Mixed results have been presented regarding CSF levels of inflammatory proteins in FTD. Some studies have shown increased CSF levels of the pro-inflammatory proteins TNF, MCP-1, IL-8, IL-11, and YKL-40 in FTD compared with healthy controls, as well as neuroinflammatory signaling on TSPO-PET [13–18]. In contrast, decreased CSF levels of pro-inflammatory IL-12 and increased levels of anti-inflammatory transforming growth factor-β (TGFβ) have also been reported in FTD [18, 19].
The primary aim of this study was to investigate the CSF signature of inflammatory proteins in AD and FTD, using a multiplex proximity extension assay (PEA). To that end, we quantified 92 such proteins, preselected by the manufacturer. A secondary aim was to assess if any of these proteins were altered already at an early stage of AD.
METHODS
Participants
This study included CSF samples from 135 pat-ients and 49 healthy controls from biobanks of three medical centers (Uppsala, Sweden; Ulm, Germany; Barcelona, Spain). The spinal taps were performed during 2005–2018 and the following diagnoses were represented among the patients: AD dementia (n = 42), MCI due to AD (MCI/AD, n = 29), stable MCI (MCI, n = 22), and FTD (n = 42).
Diagnostic procedures
All patients were subjected to a standardized investigation at a memory disorder unit, including clinical assessments, caregiver interviews, neuroimaging, ne-uropsychological evaluation, laboratory assessments, and CSF sampling. Diagnoses of AD dementia and MCI/AD were made according to the National Institute on Aging and Alzheimer’s Association (NIA-AA) criteria for “probable AD dementia with evidence of AD pathophysiological process” and “MCI due to AD –high likelihood”, respectively, while stable MCI patients fulfilled the NIA-AA “MCI –core clinical criteria” [20, 21]. Furthermore, stable MCI patients did not convert to AD or any other neurodegenerative disorder during the follow-up period of 4–9 years.
The FTD diagnosis was based on clinical criteria in combination with characteristic patterns in neuroimaging, resulting in an imaging supported diagnosis of svPPA or “probable bvFTD” in 39 of 42 FTD participants [12, 22]. Of the remaining three FTD patients, two were unable to undergo any imaging examination. One of them fulfilled the clinical criteria of “possible bvFTD”, while the other could not be subclassified [22]. The last FTD patient could not be subclassified despite having imaging results. In summary, 35 FTD patients were diagnosed with the bvFTD phenotype, five with svPPA, and two with non-specified FTD. The two non-specified FTD patients were classified as FTD patients rather than unspecified dementia since they showed signs and symptoms of significant frontal lobe dysfunction, such as personality and behavioral changes together with loss of insight at an early stage.
The control group consisted of individuals free from neurocognitive disorders, recruited at the three medical centers. Control subjects from Uppsala were cognitively healthy elderly recruited through advertisements in a local newspaper. The controls from Ulm were headache patients (most commonly of the tension-type) without any signs of systemic inflammation, neoplasia, or neurodegenerative disease, who obtained a lumbar puncture during the clinical work-up. The controls from Barcelona were spouses and children of patients from the Sant Pau Initiative on Neurodegeneration (SPIN) cohort with normal CSF markers, normal results on cognitive tests, and no signs of cognitive decline during a four-year follow-up period [23].
Standard protocol approvals, registrations, and patients consents
The collection and analyses of CSF samples were approved by ethical review boards at the three centers involved (Uppsala: 2005-244, Ö 48-2005, 2013/187 and 2018/168; Ulm: 20/10; Barcelona: Colección 16/2013). Written informed consent was collected from all patients or their next of kin at the time of lumbar puncture.
Sample handling and measurements
A volume of 40–50μl of each participant’s CSF was thawed, aliquoted into microtubes and refrozen at –70°C. The samples were stratified according to research site, age, sex, and diagnosis. Next, they were allocated, using the randomization generator of Microsoft Excel (v.16, Microsoft Corporation, Redmond, WA), to a position on one of three hypothetical plates with 8×11 wells.
Protein levels were measured with PEA, at Olink Proteomics’ laboratory in Uppsala, using the Olink® Inflammation panel (Olink Proteomics AB, Uppsala, Sweden; https://www.olink.com/products/inflammation/, accessed 26 September 2019) according to the manufacturer’s instructions. The PEA technology is a validated immunoassay with high sensitivity and specificity that enables 92 analytes to be measured simultaneously, using 1μL of each sample [24]. In brief, pairs of oligonucleotide-labeled antibody probes bind to their targeted protein and, if the two probes are brought in close proximity to each other, the oligonucleotides will hybridize in a pair-wise manner, enabling amplification with PCR. Data is quality controlled and normalized using internal extension and inter-plate controls, to adjust for intra- and inter-run variation. The final assay read-out is presented as a Normalized Protein eXpression (NPX) value, which is an arbitrary unit on a log2-scale where a high value corresponds to a higher protein expression (i.e., an increase with 1 NPX is a doubled value of the detectable quantity). All assay validation data (detection limits, intra- and inter-assay precision data, etc.) are available on the manufacturer’s website (http://www.olink.com).
Statistical analyses
Principal component analysis (PCA) was used to evaluate patterns of clusters related to the different patient groups, medical centers and plates. Only proteins detected in at least 75% of the samples were included in the analyses. Samples where the internal controls deviated more than 0.3 NPX from their median value were excluded at this point. Linear regression analyses were performed using ANOVA F-tests, comparing mean NPX-values of AD versus controls, MC/AD versus controls, MCI/AD versus MCI, and FTD versus controls, respectively. For the AD and FTD analyses, samples from all three centers were included, whereas for the MCI analyses only samples from the Uppsala cohort were available. Age, sex, collection site, and plate numbers were included as confounders in the analyses. The Benjamini-Hochberg method was used to control the false discovery rate (FDR) caused by multiple testing. An FDR below 5% (q-value below 0.05) was considered significant. A post hoc sample size calculation was made based on a power of 95% and a significance level of 0.05/60 (adjusting for 60 multiple tests, assuming 60 of 92 detectable analytes) in a two-sample t-test, resulting in 41 samples required per group to detect a between group difference beta of 0.4 (corresponding to a fold change [FC] of 20.4 = 1.32) with a standard deviation (SD) of 0.35. The statistical analyses were conducted using R version 3.6.3 (R Core Team, 2020) and the R-package ropls to perform the PCA analyses [25].
RESULTS
The 184 study participants consisted of 90 women (48.9%) and 94 men (51.1%) with a mean±SD age of 69.5±9.1 years (Table 1). Women were slightly overrepresented in the AD and MCI/AD group (59.5% and 58.6%, respectively), while the FTD group consisted of more men (69.0%) with a slightly lower mean±SD age of 64.6±9.0 years (Table 1). Amyloid-β42 (Aβ42) CSF levels (mean ng/L±SD) were roughly 50% lower in the AD and MCI/AD group compared with the controls (AD: 415±82, MCI/AD: 439±108, Controls: 899±289), while the total-tau (t-tau) levels (mean ng/L±SD) were approximately 55–85% higher (AD: 725±296, MCI/AD: 608±235, Controls: 392±233, Table 1). Compared with the controls, the FTD group had similar Aβ42 and t-tau levels (FTD versus Controls, Aβ42: 1025±508 versus 899±289, t-tau: 346±156 versus 392±233, Table 1), while the stable MCI group had similar Aβ42 levels but roughly one third lower t-tau levels (MCI versus Controls, Aβ42: 826±203 versus 899±392; t-tau: 265±86 versus 392±233, Table 1). Of the 92 proteins included in the assay, 56 (61%) were detected in at least 75% of the CSF samples. All proteins, their abbreviations, and their detectability are available in Supplementary Table 1, while the type and function of the detected proteins are listed in Table 2. Two of the AD samples deviated more than 0.3 NPX from the median of the internal quality control samples (supplied by the manufacturer) and were therefore excluded from further analyses.
Table 1
Demographics of the participants
| Total | AD | MCI/AD | MCI | FTD | Controls | |
| Number | 184 | 42 | 29 | 22 | 42 | 49 |
| Age, mean (SD) | 69.5 (9.1) | 71.0 (6.9) | 69.8 (5.0) | 72.0 (5.3) | 64.6 (9.0) | 71.2 (12.3) |
| Women, n (%) | 90 (48.9) | 25 (59.5) | 17 (58.6) | 11 (50) | 13 (31.0) | 24 (49) |
| T-tau (ng/L), mean (SD) | 482 (281) | 725 (296) | 608 (235) | 265 (86) | 346 (156) (n = 35) | 392 (233) (n = 48) |
| Aβ42 (ng/L), mean (SD) | 730 (389) | 415 (82) | 439 (108) | 826 (203) | 1025 (508) (n = 39) | 899 (289) (n = 48) |
| Study site, n (%) | ||||||
| Uppsala, Swe | 98 (53.3) | 21 (50.0) | 21 (72.4) | 22 (100) | 13 (31.0) | 21 (42.9) |
| Ulm, Ger | 43 (23.4) | 14 (33.3) | 0 | 0 | 15 (35.7) | 14 (28.6) |
| Barcelona, Spa | 43 (23.4) | 7 (16.7) | 8 (27.6) | 0 | 14 (33.3) | 14 (28.6) |
Aβ, amyloid-β; AD, Alzheimer’s disease; FTD, frontotemporal dementia; MCI, mild cognitive impairment, cognitively stable at the MCI level; MCI/AD, mild cognitive impairment due to Alzheimer’s disease; SD, standard deviation; T-tau, total tau.
Table 2
Type and function of cerebrospinal fluid proteins differing between groups
| Protein | Type | Function |
| ADAb | Enzyme, Deaminase | Purine metabolism, T cell differentiation. |
| Beta-NGFa,b | Growth factor | Nerve growth factor. |
| CCL4b | Chemokine | Attracts NK cells, monocytes, and other immune cells. |
| CCL19b | Chemokine | Attracts B and T cells. |
| CCL23b | Chemokine | Highly chemotactic for resting T cells and monocytes and slightly chemotactic for neutrophils. |
| CD5b | T cell receptor | Stimulation mitigate activating signals. |
| CD6b | T cell receptor | T cell activation and proliferation. |
| CD8Ab | T cell receptor | MHC receptor on cytotoxic T cells and a subset of NK cells. |
| CD40b | TNF-receptor | Stimulates Th1 cells to induce Ig-switch and ROS-production. |
| CD244b | NK-cell receptor | Mediates non-MHC-killing. |
| CDCP1a,b | Transmembrane glycoprotein, T cell receptor ligand | Involved in cell adhesion, cell matrix association, and T cell activation, migration and chemotaxis. |
| CSF-1a,b | Growth factor | Induces macrophage, monocyte, and microglia proliferation. |
| CX3CL1b | Chemokine | Involved in adhesion, migration, and synapse pruning. |
| CXCL1b | Chemokine | Involved in mitosis, inflammation, and neutrophil attraction. |
| CXCL6b | Chemokine | Attracts neutrophils. |
| CXCL10b | Chemokine | Attracts microglia, monocytes and T cells. |
| CXCL11b | Chemokine | Attracts activated T cells. |
| DNERb | Growth factor | Involved in proliferation and neurogenesis. |
| FGF-5a,b | Growth factor | Regulates cell proliferation and differentiation. |
| FGF-19b | Growth factor | Glucose regulator. |
| Flt3Lb | Growth factor | Involved in dendritic cell proliferation. |
| HGFa,b | Growth factor | Involved in angiogenesis, tumorigenesis, and tissue regeneration. |
| IL8b | Chemokine | Attracts neutrophils, basophils, and T cells. |
| IL-10RBb | Cytokine receptor | Forms a receptor with IFNLR1. Activates antiviral pathway upon stimulation. |
| IL-12Bb | Growth factor | Stimulates T and NK cells. |
| LIF-Ra,b | Polyfunctional cytokine | Induces neuronal and leukocytic differentiation. Also involved in cell survival, and proliferation. |
| MCP-2b | Chemokine | Attracts monocytes, lymphocytes, basophils, and eosinophils. |
| MMP-10a,c | Matrix metalloproteinase | Breakdown of extracellular matrix. |
| PD-L1a,b | B7 Family Ligand, Immune inhibitor | Immunoregulator. Inhibits T cell activation and induces self-tolerence. |
| SCFa,b | Growth factor | Regulates cell survival and proliferation of lymphocytes, melanocytes, mast cells and microglia. |
| SIRT2a | Sirtuin, Deacetylase | Involved in cell cycle control, microtubule regulation and autophagy. Blockage promotes inflammation by NF-κB acetylation. |
| TGF-alphab | Growth factor | Involved in cell proliferation, differentiation and mitosis. |
| TNFRSF9b | TNF-receptor | Costimulatory receptor present in T cells, NK cells, dendritic cells, eosinophils, mast cells, and endothelial cells. |
| TNFSF14b | TNF-ligand | Costimulatory ligand, activates proliferation of B and T cells. |
| TRAILb | TNF-ligand | Induces apoptosis and promotes inflammation. |
| TWEAKa,b | TNF-ligand | Induces apoptosis, angiogenesis, and proliferation of endothelial cells. |
| uPAb | Serine protease | Mediates fibrinolysis. |
| VEGFAa,b | Growth factor | Induces proliferation and migration of vascular endothelial cells. Promotes angiogenesis. |
Proteins are presented in alphabetical order. aIncreased in patients with mild cognitive impairment due to Alzheimer’s disease (MCI/AD) compared with cognitively stable patients with mild cognitive impairment (MCI); bDecreased in patients with frontotemporal dementia (FTD) compared with healthy controls; cIncreased in patients with FTD, AD dementia, and MCI/AD compared with healthy controls.
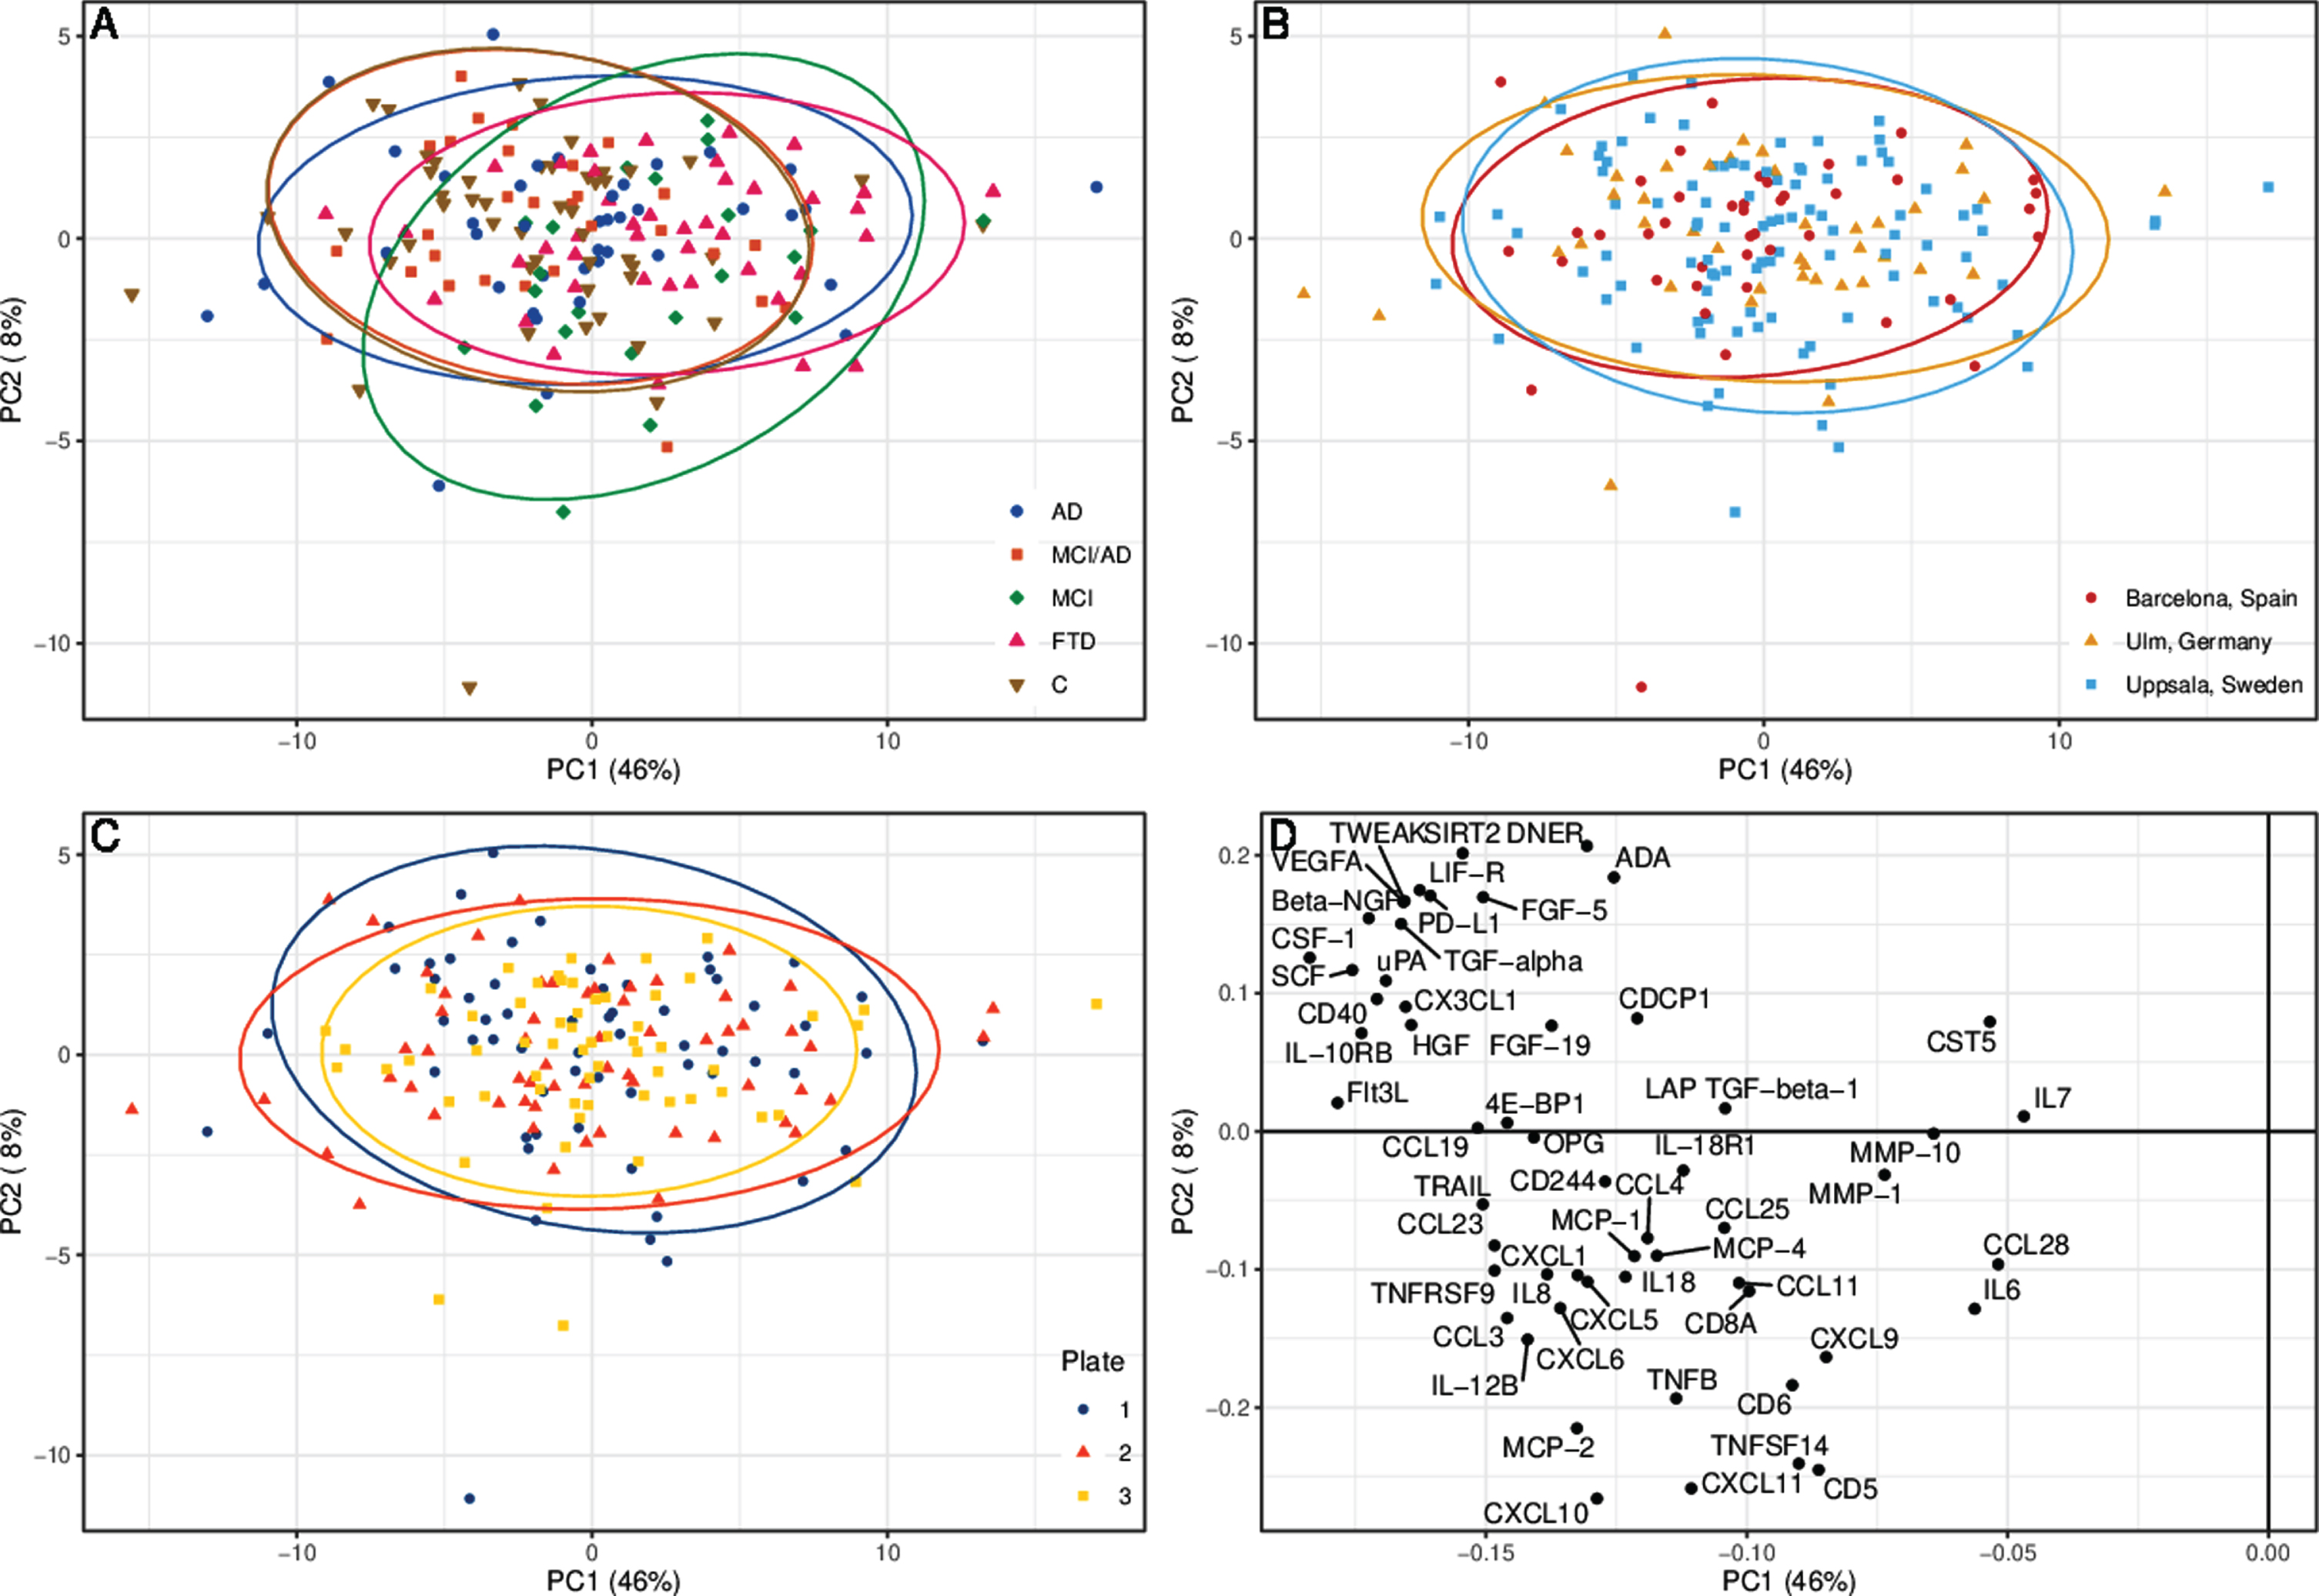
The control group and the MCI/AD group had a very similar distribution pattern of protein levels in the PCA (Fig. 1). The MCI and FTD groups deviated most from the control group, while the AD group displayed a pattern between those of the control and FTD groups. The PCA did not reveal any major differences between the three medical centers, or between the plate IDs (Fig. 1).
Fig. 1
Principal component analysis (PCA) of cerebrospinal fluid protein levels. The PCA is divided into (A) patient groups, (B) medical centers, and (C) number of plate sent for analysis. Each ellipse represents 95% of respective group’s samples. D) The detected proteins’ contribution to principal component 1 (PC1) and 2 (PC2). AD, Alzheimer’s disease dementia; C, healthy controls; FTD, frontotemporal dementia; MCI, mild cognitive impairment, cognitively stable at the MCI level; MCI/AD, mild cognitive impairment due to Alzheimer’s disease.
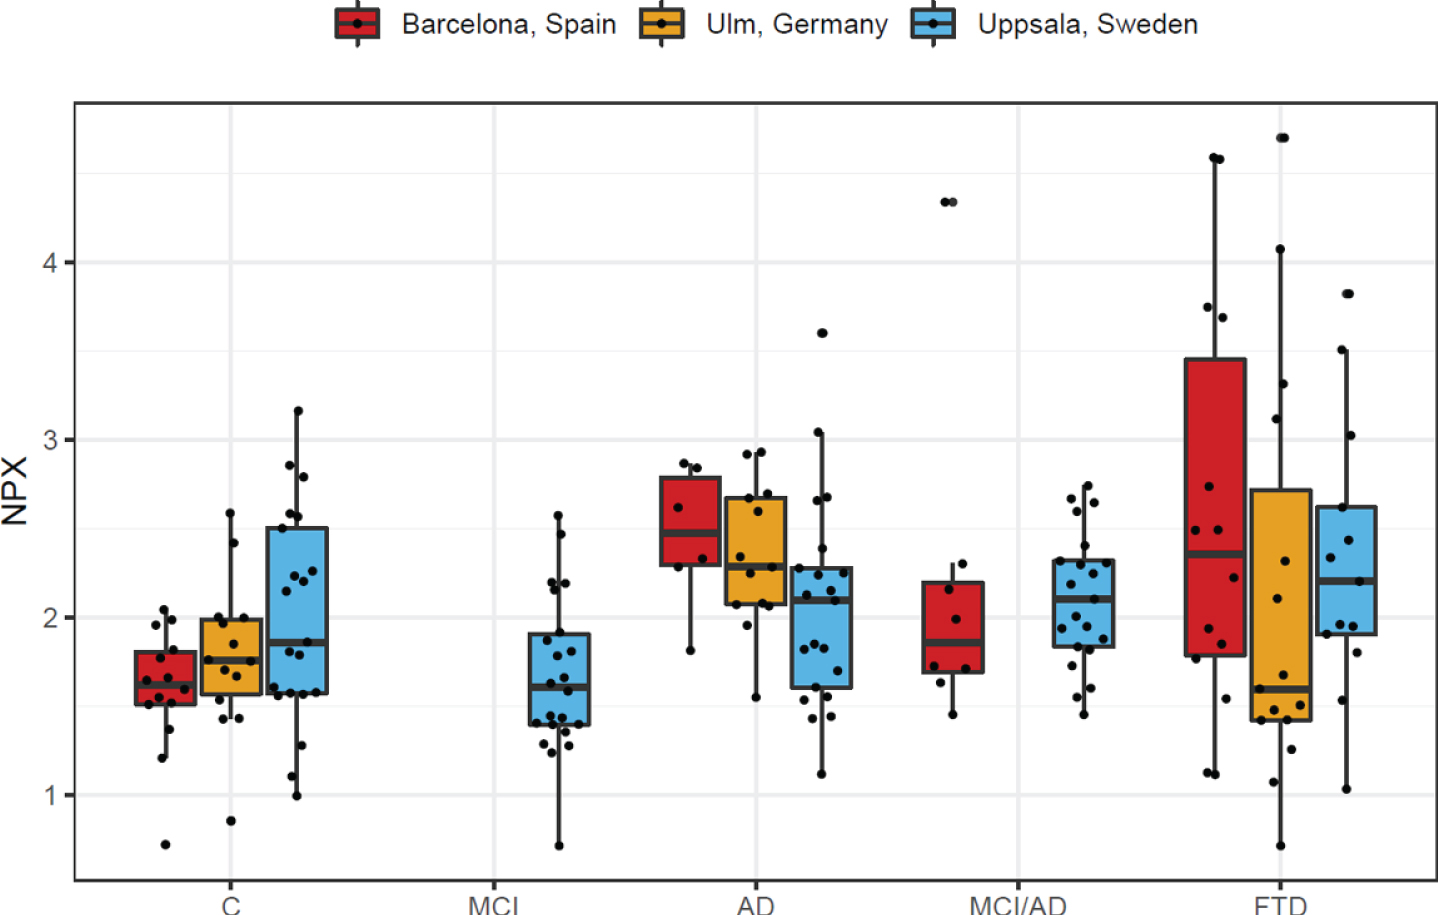
When assessing the individual analytes separately, matrix metalloproteinase-10 (MMP-10) was significantly increased in AD compared with controls (FC = 1.32, 95% confidence interval [CI] 1.14–1.53, q = 0.018, Fig. 2A), as well as between MCI/AD patients and controls (FC = 1.53, 95% CI 1.20–1.94, q = 0.045, Fig. 2A). It was also significantly higher in the MCI/AD group compared with the MCI group (FC = 1.38, 95% CI 1.16–1.65, q = 0.011, Fig. 2B), as well as in the FTD group compared with controls (FC = 1.42, 95% CI 1.10–1.83, q = 0.020, Fig. 2C). Upon stratification by patient group and medical center a trend toward higher levels of MMP-10 was observed in all three neurodegenerative disease groups (AD, MCI/AD and FTD), but with varying distributions among the different centers and a higher variability in the FTD group (Fig. 3).
Fig. 2
Volcano plots of group differences in cerebrospinal fluid proteins. The plots show fold change and p-values of inflammatory proteins in cerebrospinal fluid from (A) patients with AD and MCI/AD compared with healthy controls, (B) patients with MCI/AD compared with patients with MCI, and (C) patients with FTD compared with healthy controls. The proteins were analyzed using ANOVA F-tests, adjusting for age, sex, plate ID, and study site (A, C), and age, sex, and plate ID (B), respectively. Proteins with a false discovery rate below 0.05 are labeled. AD, Alzheimer’s disease dementia; C, healthy controls; FTD, frontotemporal dementia; MCI, mild cognitive impairment, cognitively stable at the MCI level; MCI/AD, mild cognitive impairment due to Alzheimer’s disease.
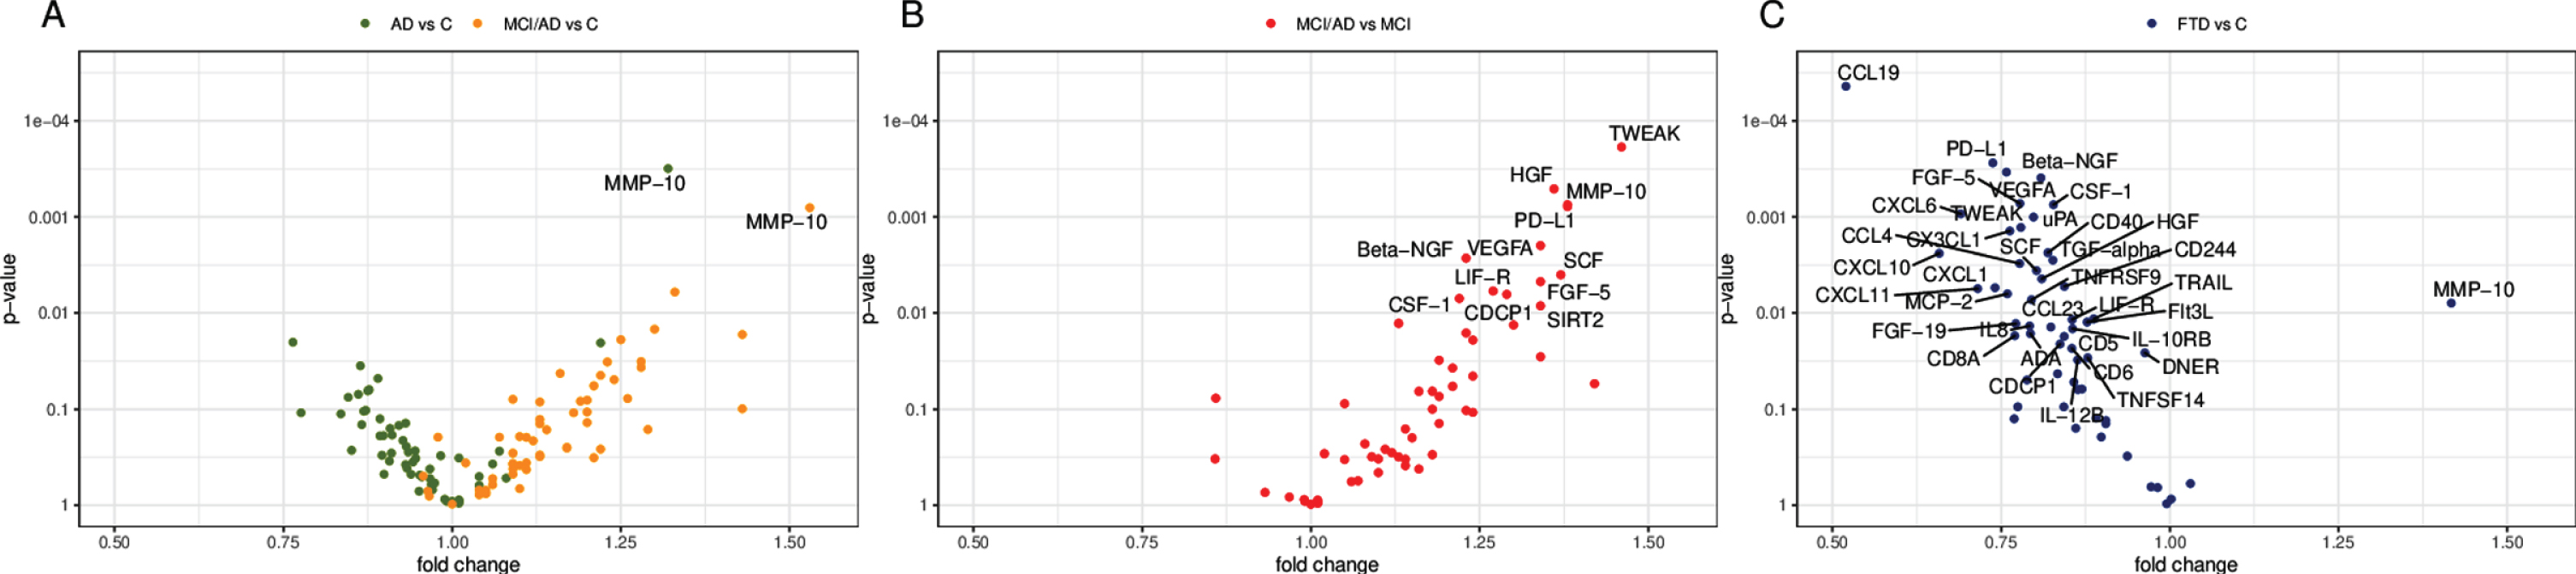
Fig. 3
Box plot of MMP-10 levels stratified by patient group and medical center. AD, Alzheimer’s disease dementia; C, healthy controls; FTD, frontotemporal dementia; MCI, mild cognitive impairment, cognitively stable at the MCI level; MCI/AD, mild cognitive impairment due to Alzheimer’s disease; MMP-10, matrix metalloproteinase-10; NPX, normalized protein expression.
We found eleven additional proteins to be significantly increased in MCI/AD compared with MCI (q < 0.05, Table 3, Fig. 2B), six of which were growth factors; tumor necrosis factor ligand superfamily member 12 (TNFSF12, also known as TWEAK; 46% higher), hepatocyte growth factor or scatter factor (HGF/SF, 36% higher), programmed death-ligand 1 (PD-L1, 38% higher), vascular endothelial growth factor A (VEGFA, 34% higher), nerve growth factor beta (NGF, 23% higher), stem cell factor (SCF, 37% higher), fibroblast growth factor 5 (FGF5, 34% higher), leukemia inhibitory factor receptor (LIFR, 27% higher), CUB domain-containing protein 1 (CDCP1, 29% higher), macrophage colony stimulating factor 1 (CSF-1, 22% higher), and sirtuin 2 (SIRT2, 34% higher).
Table 3
Differentially expressed cerebrospinal fluid proteins, in addition to MMP-10
| Comparison | Protein | Beta | Fold change (95 CI) | p | q |
| MCI/AD | Beta-NGF | 0.293 | 1.23 (1.08, 1.39) | 0.00268 | 0.0250 |
| versus MCIa | CDCP1 | 0.369 | 1.29 (1.08, 1.54) | 0.00640 | 0.0359 |
| CSF-1 | 0.283 | 1.22 (1.06, 1.40) | 0.00706 | 0.0359 | |
| FGF-5 | 0.417 | 1.34 (1.10, 1.62) | 0.00471 | 0.0330 | |
| HGF | 0.446 | 1.36 (1.16, 1.61) | 0.000511 | 0.0109 | |
| LIF-R | 0.347 | 1.27 (1.07, 1.50) | 0.00590 | 0.0359 | |
| PD-L1 | 0.469 | 1.38 (1.16, 1.66) | 0.00078 | 0.0109 | |
| SCF | 0.453 | 1.37 (1.11, 1.68) | 0.00400 | 0.0320 | |
| SIRT2 | 0.426 | 1.34 (1.08, 1.67) | 0.00842 | 0.0393 | |
| TWEAK | 0.549 | 1.46 (1.21, 1.76) | 0.000187 | 0.0105 | |
| VEGFA | 0.426 | 1.34 (1.22, 1.61) | 0.00199 | 0.0223 | |
| FTD versus Cb | ADA | –0.334 | 0.793 (0.657, 0.957) | 0.0163 | 0.0305 |
| Beta-NGF | –0.306 | 0.809 (0.722, 0.907) | 0.000393 | 0.00550 | |
| CCL4 | –0.363 | 0.777 (0.660, 0.916) | 0.00305 | 0.0122 | |
| CCL19 | –0.944 | 0.520 (0.385, 0.703) | 0.0000438 | 0.00245 | |
| CCL23 | –0.280 | 0.824 (0.706, 0.960) | 0.0140 | 0.0279 | |
| CD5 | –0.246 | 0.843 (0.733, 0.970) | 0.0175 | 0.0306 | |
| CD6 | –0.226 | 0.855 (0.747, 0.978) | 0.0233 | 0.0384 | |
| CD8A | –0.377 | 0.770 (0.622, 0.954) | 0.0172 | 0.0306 | |
| CD40 | –0.288 | 0.819 (0.722, 0.930) | 0.00236 | 0.0112 | |
| CD244 | –0.245 | 0.844 (0.750, 0.949) | 0.00528 | 0.0164 | |
| CDCP1 | –0.256 | 0.837 (0.721, 0.973) | 0.0210 | 0.0357 | |
| CSF-1 | –0.273 | 0.827 (0.743, 0.921) | 0.000745 | 0.00695 | |
| CX3CL1 | –0.391 | 0.763 (0.648, 0.898) | 0.00140 | 0.00784 | |
| CXCL1 | –0.433 | 0.741 (0.601, 0.913) | 0.00545 | 0.0164 | |
| CXCL6 | –0.535 | 0.690 (0.557, 0.855) | 0.000929 | 0.00702 | |
| CXCL10 | –0.603 | 0.658 (0.505, 0.858) | 0.00239 | 0.0112 | |
| CXCL11 | –0.483 | 0.715 (0.566, 0.904) | 0.00557 | 0.0164 | |
| DNER | –0.054 | 0.963 (0.932, 0.955) | 0.0260 | 0.0415 | |
| FGF-5 | –0.362 | 0.778 (0.675, 0.897) | 0.000724 | 0.00695 | |
| FGF-19 | –0.374 | 0.772 (0.630, 0.945) | 0.0129 | 0.0278 | |
| Flt3L | –0.189 | 0.877 (0.792, 0.971) | 0.0124 | 0.0278 | |
| HGF | –0.304 | 0.810 (0.702, 0.935) | 0.00440 | 0.0154 | |
| IL8 | –0.336 | 0.792 (0.659, 0.952) | 0.0136 | 0.0279 | |
| IL-10RB | –0.225 | 0.856 (0.756, 0.969) | 0.0145 | 0.0281 | |
| IL-12B | –0.212 | 0.863 (0.756, 0.986) | 0.0308 | 0.0466 | |
| LIF-R | –0.226 | 0.855 (0.758, 0.965) | 0.0117 | 0.0273 | |
| MCP-2 | –0.397 | 0.759 (0.624, 0.923) | 0.00631 | 0.0177 | |
| PD-L1 | –0.439 | 0.738 (0.629, 0.865) | 0.000274 | 0.00550 | |
| SCF | –0.318 | 0.802 (0.693, 0.929) | 0.00361 | 0.0135 | |
| TGF-alpha | –0.275 | 0.827 (0.731, 0.935) | 0.00282 | 0.0121 | |
| TNFRSF9 | –0.331 | 0.795 (0.673, 0.938) | 0.00728 | 0.0194 | |
| TNFSF14 | –0.187 | 0.878 (0.782, 0.987) | 0.0292 | 0.0454 | |
| TRAIL | –0.173 | 0.887 (0.809, 0.973) | 0.0115 | 0.0273 | |
| TWEAK | –0.360 | 0.779 (0.671, 0.904) | 0.00129 | 0.00784 | |
| uPA | –0.326 | 0.798 (0.699, 0.910) | 0.00100 | 0.00702 | |
| VEGFA | –0.400 | 0.758 (0.654, 0.878) | 0.000342 | 0.00550 |
Proteins are presented in alphabetical order. A false discovery rate, q < 0.05 was considered significant. aAnalyzed using ANOVA F-tests, adjusted for age, sex and plate ID; bAnalyzed using ANOVA F-tests, adjusting for age, sex, plate ID, and Study site; AD, Alzheimer’s disease dementia; C, healthy controls; MCI, patients with mild cognitive impairment, cognitively stable at the MCI level; MCI/AD, mild cognitive impairment due to Alzheimer’s disease; FTD, frontotemporal dementia.
Thirty-six of the proteins were decreased in FTD compared with controls (q < 0.05, Table 3, Fig. 2C), including all the eleven proteins increased in MCI/AD compared with MCI, except SIRT2, whereas only MMP-10 was increased. Of the 36 decreased proteins, eleven were growth factors, ten chemokines, and five related to TNF-signaling. In addition, several of the decreased proteins were related to T cell function, including T cell receptors, T cell receptor ligands, growth factors and chemokines (Table 2).
DISCUSSION
In this study, we have compared CSF levels of 56 different inflammation-related proteins between groups of patients with AD, MCI/AD, MCI, FTD, and healthy controls. Several findings emerge. Firstly, levels of MMP-10 were found to be increased in AD, MCI/AD, and FTD patients, compared with healthy controls. Secondly, MMP-10 and eleven other inflammatory proteins were elevated in CSF from patients with MCI/AD, as compared with MCI subjects that remained cognitively stable after several years of follow-up. Notably, none of the proteins analyzed were found at decreased levels in the AD or the MCI/AD group. Thirdly, and in stark contrast to the pattern in the AD and MCI/AD groups, 36 of the inflammatory proteins were found at decreased levels in the FTD group, compared with healthy controls. Apart from MMP-10, none of the markers were found at increased levels in the FTD patients.
Increased CSF levels of MMP-10 have previously been reported in AD and have also been found to correlate with increased levels of tau and p-tau [26]. A recently published study, using the same panel, also found increased levels of MMP-10 in CSF samples of AD and MCI/AD patients compared with healthy controls [27]. To our knowledge, the current study is the first to show increased CSF levels of MMP-10 in FTD patients. The MMPs comprise a group of enzymes that help to increase cell motility by degrading parts of the extracellular matrix. Increased activity of these enzymes has previously been associated with the disruption of the blood-brain barrier (BBB) [26]. The levels of MMPs are regulated by tissue inhibitors of metalloproteinases (TIMPs), which may in turn be reduced by cerebral microbleeds [26]. Cerebral microbleeds are common in neurocognitive disorders and have been found to increase the risk of dementia, including AD, possibly by activating a neuroinflammatory and neurodegenerative process in microglia through fibrinogen-induced spine elimination [28]. Previously, a combination of eight proteins, including TIMP-1, MMP-9, and MMP-2, but not MMP-10, was shown to discriminate patients with subcortical vascular disease from patients with AD, with a sensitivity of 89% and a specificity of 90% [29]. MMP-10 was also increased in both of these patient groups compared with controls [29]. Thus, the increased CSF levels of MMP-10 may be a result of a disrupted BBB in the AD, MCI/AD, and FTD brain. Disruption of the BBB may lead to the influx of plasma proteins into CNS, which in turn may increase the level of neurotoxicity and accelerate the neurodegenerative process [30].
As for the increase of the eleven other inflam-mation-related proteins in MCI/AD compared with stable MCI subjects, several have previously been implicated in AD or in other neurodegenerative diseases. After reviewing the putative functions of these eleven proteins, we have divided them into pro- or anti-inflammatory proteins (Table 2).
The pro-inflammatory proteins include tumor necrosis factor (TNF)-related weak inducer of apoptosis (TWEAK), vascular endothelial growth factor A (VEGFA, or VEGF), fibroblast growth factor 5 (FGF5), CUB domain-containing protein 1 (CDCP1, also known as CD318) and macrophage colony stimulating factor (M-CSF, also known as CSF-1). Many of these are involved in regulation of blood vessel permeability, induction of angiogenesis and/or mobilization or activation of pro-inflammatory cells or cytokines. In models of multiple sclerosis and amyotrophic lateral sclerosis, endothelial cells respond to stimulation by TWEAK through neuroinflammation and BBB-disruption by upregulating MMP-9, increasing the level of pro-inflammatory cytokines and attracting monocytes [31]. Increased levels of VEGFA have been associated with neurogenesis, learning, and neuroprotective effects, but may also increase vascular permeability and be neurotoxic in high concentrations [32]. FGF5 may be involved in reactive astrocytes, as FGF5 knock-out mice have been shown to have a reduced number of GFAP-positive astrocytes in midbrain tegmentum [33]. Blockage of the T cell receptor CD6 and its ligands, such as CDCP1, have shown protection from disease in mouse models of psoriasis and multiple sclerosis [34]. M-CSF, or CSF-1, binds to a receptor (CSF-1R) that is located on microglia. In a mouse model, blocking the CSF-1R has led to a blockage of microglial activation and a shift from pro-inflammatory to anti-inflammatory microglia [35].
The remaining six anti-inflammatory proteins with increased CSF levels in MCI/AD compared with MCI include hepatocyte growth factor (HGF), programmed death-ligand 1 (PD-L1), nerve growth factor (NGF), stem cell factor (SCF), leukemia inhibi-tory factor (LIF), and sirtuin 2 (SIRT2). Many of these proteins are involved in tissue regeneration, immune cell inhibition, or alterations of immune cells to anti-inflammatory phenotypes (Table 2). Previous studies have found increased levels of HGF in astrocytes and microglia surrounding senile plaques in the AD brain [36]. Blockage of PD-L1, or its receptor (PD-1), has been used in cancer therapy to activate the T cell mediated immune response, which in a mouse model of tauopathy has led to an increased recruitment of circulating monocytes to the brain and the rescue of neurons [37]. Previous studies have implicated a mismatch in NGF metabolism in AD, where higher levels of MMPs have been associated with an increased degradation of NGF and an increase in loss of cholinergic neurons [38]. Microglia exposed for SCF have shown an anti-inflammatory phenotype in vitro. Intracellular signaling cascades in neurons and oligodendrocytes, caused by LIF, leads to neurosurvival. It also alters immune cells to anti-inflammatory phenotypes [40]. Several studies have observed a positive effect of blocking SIRT2, both in models of Parkinson’s disease and AD, which stabilizes microtubules and increases the autophagic breakdown of accumulated proteins [41]. Which of these mechanisms that are relevant in the pathogenesis of early AD and their internal interactions remain to be determined. It is noticeable that more proteins differed when comparing MCI/AD with MCI than when comparing MCI/AD with controls. These results seem to be partly caused by a general decrease in CSF inflammatory proteins in stable MCI patients. However, as the MCI groups were rather small, it may be a coincidental observation and larger studies are thus needed to confirm these data.
Another main finding of this study is the general decrease of inflammatory markers in CSF of FTD brains, including almost all of the proteins found to be increased in MCI/AD compared with MCI. This finding indicates that the pathogenic processes involved in FTD may affect microglial function, inflammation and neurodegeneration in a different manner than in AD. An interesting observation is that several of the decreased proteins were related to T cell function, a research area that has not been much explored in FTD.
A combination of CSF t-tau and Aβ42 has been shown to have a sensitivity of 95% and a specificity of 83% for detection of incipient AD in patients with MCI [42]. In addition, the ratio of t-tau/Aβ42 gives a high sensitivity and specificity when comparing AD to FTD [43]. However, this ratio is not as useful in distinguishing FTD from healthy controls [43]. The use of inflammatory biomarkers in CSF can potentially aid clinicians in predicting which MCI cases will progress to AD dementia, as well as distinguishing patients with FTD from AD.
Both our results and previous studies indicate that elevated CSF levels of inflammatory proteins is an early feature in AD pathogenesis [27]. In postmortem studies as well as in studies of neuroinflammatory translocator protein (TSPO) positron emission tomography (PET), inflammation has been implicated at early AD stages [44, 45]. Moreover, it has been suggested to be involved in the propagation of tau pathology in AD, increasing linearly throughout the disease and reaching the highest levels in late stages [44, 45]. Some TSPO PET studies have noted an early inflammatory peak in MCI/AD, with a subsequent decline before the inflammation reaches even higher levels in AD dementia [45, 46]. In our study, there was a tendency toward higher levels of inflammatory proteins in MCI/AD than in AD dementia CSF (Fig. 2A), indicating that the different methods might measure different aspects of neuroinflammation. This contrast seems to be especially prominent in FTD, where increased levels of inflammation has been found with TSPO PET, while the levels of inflammatory proteins were dramatically lower in the present study [13]. As discussed in other studies, TSPO PET may not be able to differ between activated microglia of pro- or anti-inflammatory phenotype [45, 46]. It seems that more than one pro- or anti-inflammatory phenotype of microglia may exist and that the current measurements focusing on the morphology or the activity of microglia may miss to differentiate between those phenotypes.
A limitation of this study is the small sample sizes in the MCI/AD and MCI groups, which may have affected the precision of the results in these groups. Still, the sample sizes in the AD, FTD, and control groups were robust and, although sample sizes from the individual study sites were too small to be investigated separately, the general trends of increased MMP-10 levels in AD and FTD, as well as the dec-reased levels of inflammatory proteins in FTD, were similar between the study sites. Whereas the methods to diagnose AD and FTD were the same between the sites, the control groups were recruited differently, which affects comparability and generalizability of the results. However, all subjects in the control group were cognitively healthy and represent a group free of neurocognitive disease. As another limitation we did not have access to genetic information of the AD or FTD patients. Since FTD is a heterogeneous disease where 30–50% have a familial form, it would be of interest to see if the observed differences relate to mutations in specific genes, such as microtubule-associated protein tau (MAPT), progranulin (PGRN), or C9orf72 [47]. In general, the AD and FTD groups had higher levels of MMP-10, but the within-group variation was large, indicating that different phenotypes or subgroups may exist within these diseases, which could be attributable to disease specific mutations. Moreover, the proteins selected for analyses in this study were based on a commercially available pre-manufactured, instead of a custom-made protein panel, or on unbiased methods such as mass spectrometry. Although Olink Proteomics’ PEA technology gives a fast and accurate analysis of relative protein levels of many different and small proteins, using only a small volume sample, important inflammatory mediators may not be included in the panel.
The CSF levels of neuroinflammatory proteins likely correlate with the levels of the same proteins within the brain, but other factors, such as the thickness and structure of the CSF-brain barrier, probably also affect the protein concentrations. To further elucidate how neuroinflammatory proteins vary during the course of neurodegenerative diseases, postmortem studies of neuroinflammatory proteins from brains of patients at different disease stages would be of great interest.
In summary, our findings indicate that AD and FTD have fundamentally different inflammatory signatures in CSF. As the only exception, MMP-10 levels were found to be increased in CSF from patients with both disorders. However, additional studies on yet other cohorts are needed to confirm our results.
ACKNOWLEDGMENTS
This study was supported by the Swedish Alz-heimer Foundation (AF-930343), the Swedish Brain Foundation (FO2018-0118), the Gun and Bertil Stohne’s Foundation, Geriatriska Fonden, Stiftelsen för Gamla Tjänarinnor, the Fondo de Investigaciones Sanitario (FIS), Instituto de Salud Carlos III (PI18/00435 to DA, PI17/01896 and AC19/00103 to AL) and the CIBERNED program (Program 1, Alzheimer Disease to Alberto Lleó), partly jointly funded by Fondo Europeo de Desarrollo Regional, Unión Europea, Una Manera de Hacer Europa, Ger-man Federal Ministry of Education and Research (grant # FTLDc 01GI1007A, Genfi-Prox: 01ED2008).
Authors’ disclosures available online (https://www.j-alz.com/manuscript-disclosures/20-1565r2).
SUPPLEMENTARY MATERIAL
[1] The supplementary material is available in the electronic version of this article: https://dx.doi.org/10.3233/JAD-201565.
REFERENCES
[1] | McGeer PL , McGeer EG ((2013) ) The amyloid cascade-inflammatory hypothesis of Alzheimer disease: Implications for therapy. Acta Neuropathol 126: , 479–497. |
[2] | Jack CR Jr , Bennett DA , Blennow K , Carrillo MC , Dunn B , Haeberlein SB , Holtzman DM , Jagust W , Jessen F , Karlawish J ((2018) ) NIA-AA Research Framework: Toward a biological definition of Alzheimer’s disease. Alzheimers Dement 14: , 535–562. |
[3] | Petersen RC , Smith GE , Waring SC , Ivnik RJ , Tangalos EG , Kokmen E ((1999) ) Mild cognitive impairment: Clinical characterization and outcome. Arch Neurol 56: , 303–308. |
[4] | Heneka MT , Carson MJ , El Khoury J , Landreth GE , Brosseron F , Feinstein DL , Jacobs AH , Wyss-Coray T , Vitorica J , Ransohoff RM , Herrup K , Frautschy SA , Finsen B , Brown GC , Verkhratsky A , Yamanaka K , Koistinaho J , Latz E , Halle A , Petzold GC , Town T , Morgan D , Shinohara ML , Perry VH , Holmes C , Bazan NG , Brooks DJ , Hunot S , Joseph B , Deigendesch N , Garaschuk O , Boddeke E , Dinarello CA , Breitner JC , Cole GM , Golenbock DT , Kummer MP ((2015) ) Neuroinflammation in Alzheimer’s disease. Lancet Neurol 14: , 388–405. |
[5] | Hesse R , Wahler A , Gummert P , Kirschmer S , Otto M , Tumani H , Lewerenz J , Schnack C , von Arnim CAF ((2016) ) Decreased IL-8 levels in CSF and serum of AD patients and negative correlation of MMSE and IL-1β. BMC Neurol 16: , 185. |
[6] | OecklP, HalbgebauerS, Anderl-StraubS, SteinackerP, HussAM, NeugebauerH, vonArnim CAF, Diehl-SchmidJ, GrimmerT, KornhuberJ, DanekA, German Consortium for Frontotemporal Lobar Degeneration, LudolphAC, OttoM ((2019) ) Glial fibrillary acidic protein in serum is increased in Alzheimer’s disease and correlates with cognitive impairment. J Alzheimers Dis 67: , 481–488. |
[7] | Thygesen C , Larsen MR , Finsen B ((2019) ) Proteomic signatures of neuroinflammation in Alzheimer’s disease, multiple sclerosis and ischemic stroke. Expert Rev Proteomics 16: , 601–611. |
[8] | Wang J , Cunningham R , Zetterberg H , Asthana S , Carlsson C , Okonkwo O , Li L ((2016) ) Label-free quantitative comparison of cerebrospinal fluid glycoproteins and endogenous peptides in subjects with Alzheimer’s disease, mild cognitive impairment, and healthy individuals. Proteomics Clin Appl 10: , 1225–1241. |
[9] | Vafadar-Isfahani B , Ball G , Coveney C , Lemetre C , Boocock D , Minthon L , Hansson O , Miles AK , Janciauskiene SM , Warden D ((2012) ) Identification of SPARC-like 1 protein as part of a biomarker panel for Alzheimer’s disease in cerebrospinal fluid. J Alzheimers Dis 28: , 625–636. |
[10] | Snowden JS , Neary D , Mann DM ((2002) ) Frontotemporal dementia. Br J Psychiatry 180: , 140–143. |
[11] | Neary D , Snowden JS , Gustafson L , Passant U , Stuss D , Black S , Freedman M , Kertesz A , Robert P , Albert M ((1998) ) Frontotemporal lobar degeneration: A consensus on clinical diagnostic criteria. Neurology 51: , 1546–1554. |
[12] | Gorno-Tempini ML , Hillis AE , Weintraub S , Kertesz A , Mendez M , Cappa SF , Ogar JM , Rohrer J , Black S , Boeve BF ((2011) ) Classification of primary progressive aphasia and its variants. Neurology 76: , 1006–1014. |
[13] | Cagnin A , Rossor M , Sampson EL , MacKinnon T , Banati RB ((2004) ) In vivo detection of microglial activation in frontotemporal dementia. Ann Neurol 56: , 894–897. |
[14] | Galimberti D , Schoonenboom N , Scheltens P , Fenoglio C , Venturelli E , Pijnenburg Y , Bresolin N , Scarpini E ((2006) ) Intrathecal chemokine levels in Alzheimer disease and frontotemporal lobar degeneration. Neurology 66: , 146–147. |
[15] | Galimberti D , Venturelli E , Fenoglio C , Guidi I , Villa C , Bergamaschini L , Cortini F , Scalabrini D , Baron P , Vergani C ((2008) ) Intrathecal levels of IL-6, IL-11 and LIF in Alzheimer’s disease and frontotemporal lobar degeneration. J Neurol 255: , 539–544. |
[16] | Alcolea D , Irwin DJ , Illán-Gala I , Muñoz L , Clarimón J , McMillan CT , Fortea J , Blesa R , Lee EB , Trojanowski JQ ((2019) ) Elevated YKL-40 and low sAPPβ: YKL-40 ratio in antemortem cerebrospinal fluid of patients with pathologically confirmed FTLD. J Neurol Neurosurg Psychiatry 90: , 180–186. |
[17] | Oeckl P , Weydt P , Steinacker P , Anderl-Straub S , Nordin F , Volk AE , Diehl-Schmid J , Andersen PM , Kornhuber J , Danek A ((2019) ) Different neuroinflammatory profile in amyotrophic lateral sclerosis and frontotemporal dementia is linked to the clinical phase. J Neurol Neurosurg Psychiatry 90: , 4–10. |
[18] | Sjögren M , Folkesson S , Blennow K , Tarkowski E ((2004) ) Increased intrathecal inflammatory activity in frontotemporal dementia: Pathophysiological implications. J Neurol Neurosurg Psychiatry 75: , 1107–1111. |
[19] | Rentzos M , Paraskevas GP , Kapaki E , Nikolaou C , Zoga M , Rombos A , Tsoutsou A , Vassilopoulos D ((2006) ) Interleukin-12 is reduced in cerebrospinal fluid of patients with Alzheimer’s disease and frontotemporal dementia. J Neurol Sci 249: , 110–114. |
[20] | McKhann GM , Knopman DS , Chertkow H , Hyman BT , Jack CR Jr , Kawas CH , Klunk WE , Koroshetz WJ , Manly JJ , Mayeux R ((2011) ) The diagnosis of dementia due to Alzheimer’s disease: Recommendations from the National Institute on Aging-Alzheimer’s Association workgroups on diagnostic guidelines for Alzheimer’s disease. Alzheimers Dement 7: , 263–269. |
[21] | Albert MS , DeKosky ST , Dickson D , Dubois B , Feldman HH , Fox NC , Gamst A , Holtzman DM , Jagust WJ , Petersen RC ((2011) ) The diagnosis of mild cognitive impairment due to Alzheimer’s disease: Recommendations from the National Institute on Aging-Alzheimer’s Association workgroups on diagnostic guidelines for Alzheimer’s disease. Alzheimers Dement 7: , 270–279. |
[22] | Rascovsky K , Hodges JR , Knopman D , Mendez MF , Kramer JH , Neuhaus J , Van Swieten JC , Seelaar H , Dopper EG , Onyike CU ((2011) ) Sensitivity of revised diagnostic criteria for the behavioural variant of frontotemporal dementia. Brain 134: , 2456–2477. |
[23] | Alcolea D , Clarimón J , Carmona-Iragui M , Illán-Gala I , Morenas-Rodríguez E , Barroeta I , Ribosa-Nogué R , Sala I , Sánchez-Saudinós MB , Videla L ((2019) ) The Sant Pau Initiative on Neurodegeneration (SPIN) cohort: A data set for biomarker discovery and validation in neurodegenerative disorders. Alzheimers Dement (N Y) 5: , 597–609. |
[24] | Assarsson E , Lundberg M , Holmquist G , Björkesten J , Bucht Thorsen S , Ekman D , Eriksson A , Rennel Dickens E , Ohlsson S , Edfeldt G , Andersson A-C , Lindstedt P , Stenvang J , Gullberg M , Fredriksson S ((2014) ) Homogenous 96-Plex PEA immunoassay exhibiting high sensitivity, specificity, and excellent scalability. PLoS One 9: , e95192. |
[25] | Thevenot EA , Roux A , Xu Y , Ezan E , Junot C ((2015) ) Analysis of the human adult urinary metabolome variations with age, body mass index and gender by implementing a comprehensive workflow for univariate and OPLS statistical analyses. J Proteome Res 14: , 3322–3335. |
[26] | Duits FH , Hernandez-Guillamon M , Montaner J , Goos JD , Montañola A , Wattjes MP , Barkhof F , Scheltens P , Teunissen CE , van der Flier WM ((2015) ) Matrix metalloproteinases in Alzheimer’s disease and concurrent cerebral microbleeds. J Alzheimers Dis 48: , 711–720. |
[27] | Whelan CD , Mattsson N , Nagle MW , Vijayaraghavan S , Hyde C , Janelidze S , Stomrud E , Lee J , Fitz L , Samad TA ((2019) ) Multiplex proteomics identifies novel CSF and plasma biomarkers of early Alzheimer’s disease. Acta Neuropathol Commun 7: , 169. |
[28] | Merlini M , Rafalski VA , Coronado PER , Gill TM , Ellisman M , Muthukumar G , Subramanian KS , Ryu JK , Syme CA , Davalos D ((2019) ) Fibrinogen induces microglia-mediated spine elimination and cognitive impairment in an Alzheimer’s disease model. Neuron 101: , 1099–1108.e6. |
[29] | Bjerke M , Zetterberg H , Edman Å , Blennow K , Wallin A , Andreasson U ((2011) ) Cerebrospinal fluid matrix metalloproteinases and tissue inhibitor of metalloproteinases in combination with subcortical and cortical biomarkers in vascular dementia and Alzheimer’s disease. J Alzheimers Dis 27: , 665–676. |
[30] | Erickson MA , Banks WA ((2013) ) Blood–brain barrier dysfunction as a cause and consequence of Alzheimer’s disease. J Cereb Blood Flow Metab 33: , 1500–1513. |
[31] | Boulamery A , Desplat-Jégo S ((2017) ) Regulation of neuroinflammation: What role for the tumor necrosis factor-like weak inducer of apoptosis/Fn14 pathway? Front Immunol 8: , 1534. |
[32] | Su F , Bai F , Zhang Z ((2016) ) Inflammatory cytokines and Alzheimer’s disease: A review from the perspective of genetic polymorphisms. Neurosci Bull 32: , 469–480. |
[33] | Reuss B , Dono R , Unsicker K ((2003) ) Functions of fibroblast growth factor (FGF)-2 and FGF-5 in astroglial differentiation and blood-brain barrier permeability: Evidence from mouse mutants. J Neurosci 23: , 6404–6412. |
[34] | Consuegra-Fernandez M , Lin F , Fox DA , Lozano F ((2018) ) Clinical and experimental evidence for targeting CD6 in immune-based disorders. Autoimmun Rev 17: , 493–503. |
[35] | Olmos-Alonso A , Schetters ST , Sri S , Askew K , Mancuso R , Vargas-Caballero M , Holscher C , Perry VH , Gomez-Nicola D ((2016) ) Pharmacological targeting of CSF1R inhibits microglial proliferation and prevents the progression of Alzheimer’s-like pathology. Brain 139: , 891–907. |
[36] | Fenton H , Finch P , Rubin J , Rosenberg J , Taylor W , Kuo-Leblanc V , Rodriguez-Wolf M , Baird A , Schipper H , Stopa E ((1998) ) Hepatocyte growth factor (HGF/SF) in Alzheimer’s disease. Brain Res 779: , 262–270. |
[37] | Rosenzweig N , Dvir-Szternfeld R , Tsitsou-Kampeli A , Keren-Shaul H , Ben-Yehuda H , Weill-Raynal P , Cahalon L , Kertser A , Baruch K , Amit I ((2019) ) PD-1/PD-L1 checkpoint blockade harnesses monocyte-derived macrophages to combat cognitive impairment in a tauopathy mouse model. Nat Commun 10: , 465. |
[38] | Cuello AC , Pentz R , Hall H ((2019) ) The brain NGF metabolic pathway in health and in Alzheimer’s pathology. Front Neurosci 13: , 62. |
[39] | Terashima T , Nakae Y , Katagi M , Okano J , Suzuki Y , Kojima H ((2018) ) Stem cell factor induces polarization of microglia to the neuroprotective phenotype in vitro. Heliyon 4: , e00837. |
[40] | Davis SM , Pennypacker KR ((2018) ) The role of the leukemia inhibitory factor receptor in neuroprotective signaling. Pharmacol Ther 183: , 50–57. |
[41] | Silva D , Esteves A , Oliveira C , Cardoso S ((2017) ) Mitochondrial metabolism power SIRT2-dependent deficient traffic causing Alzheimer’s-disease related pathology. Mol Neurobiol 54: , 4021–4040. |
[42] | Hansson O , Zetterberg H , Buchhave P , Londos E , Blennow K , Minthon L ((2006) ) Association between CSF biomarkers and incipient Alzheimer’s disease in patients with mild cognitive impairment: A follow-up study. Lancet Neurol 5: , 228–234. |
[43] | Oeckl P , Steinacker P , Feneberg E , Otto M ((2016) ) Neurochemical biomarkers in the diagnosis of frontotemporal lobar degeneration: An update. J Neurochem 138: , 184–192. |
[44] | Serrano-Pozo A , Mielke ML , Gómez-Isla T , Betensky RA , Growdon JH , Frosch MP , Hyman BT ((2011) ) Reactive glia not only associates with plaques but also parallels tangles in Alzheimer’s disease. Am J Pathol 179: , 1373–1384. |
[45] | Bradburn S , Murgatroyd C , Ray N ((2019) ) Neuroinflammation in mild cognitive impairment and Alzheimer’s disease: A meta-analysis. Ageing Res Rev 50: , 1–8. |
[46] | Fan Z , Brooks DJ , Okello A , Edison P ((2017) ) An early and late peak in microglial activation in Alzheimer’s disease trajectory. Brain 140: , 792–803. |
[47] | Seelaar H , Rohrer JD , Pijnenburg YA , Fox NC , Van Swieten JC ((2011) ) Clinical, genetic and pathological heterogeneity of frontotemporal dementia: A review. J Neurol Neurosurg Psychiatry 82: , 476–486. |


