
The Behavioral and Psychological Symptoms of Dementia in Down Syndrome Scale (BPSD-DS II): Optimization and Further Validation1
Abstract
Background:
People with Down syndrome (DS) are at high risk to develop Alzheimer’s disease dementia (AD). Behavioral and psychological symptoms of dementia (BPSD) are common and may also serve as early signals for dementia. However, comprehensive evaluation scales for BPSD, adapted to DS, are lacking. Therefore, we previously developed the BPSD-DS scale to identify behavioral changes between the last six months and pre-existing life-long characteristic behavior.
Objective:
To optimize and further study the scale (discriminative ability and reliability) in a large representative DS study population.
Methods:
Optimization was based on item irrelevance and clinical experiences obtained in the initial study. Using the shortened and refined BPSD-DS II, informant interviews were conducted to evaluate 524 individuals with DS grouped according to dementia status: no dementia (DS, N = 292), questionable dementia (DS + Q, N = 119), and clinically diagnosed dementia (DS + AD, N = 113).
Results:
Comparing item change scores between groups revealed prominent changes in frequency and severity for anxious, sleep-related, irritable, restless/stereotypic, apathetic, depressive, and eating/drinking behavior. For most items, the proportion of individuals displaying an increased frequency was highest in DS + AD, intermediate in DS + Q, and lowest in DS. For various items within sections about anxious, sleep-related, irritable, apathetic, and depressive behaviors, the proportion of individuals showing an increased frequency was already substantial in DS + Q, suggesting that these changes may serve as early signals of AD in DS. Reliability data were promising.
Conclusion:
The optimized scale yields largely similar results as obtained with the initial version. Systematically evaluating BPSD in DS may increase understanding of changes among caregivers and (timely) adaptation of care/treatment.
INTRODUCTION
Down syndrome (DS, trisomy 21) is the most frequent genetic cause of intellectual disability (ID), prevalent in approximately 1 in 900 live births [1, 2]. People with DS are at high risk to develop dementia due to Alzheimer’s disease (AD). Despite substantial variation between studies, prevalences rise strongly from age 40 [3]. Indeed, by that age, virtually all people with DS have extensive AD-like pathology in the brain [4]. Nevertheless, onset of clinical symptoms varies substantially in time [5, 6]. Consequently, predicting and monitoring decline and onset of dementia is a diagnostic challenge and of essence in daily care and support for people with DS [7].
Behavioral alterations are very common in AD in addition to decline in cognitive and functional skills. These so-called behavioral and psychological symptoms of dementia (BPSD), or neuropsychiatric symptoms, are defined as “a heterogeneous range of psychological reactions, psychiatric symptoms, and behaviors resulting from the presence of dementia” [8]. Nearly all people with dementia in the general population experience at least one BPSD symptom at some point during their disease course [9, 10]. Various contributing factors have been identified to explain the heterogeneity of these symptoms, among others, factors relating to the person with dementia, factors related to caregivers and environmental factors, and the interaction between these factors [11]. In the general population, BPSD are associated with a reduced quality of life and earlier institutionalization for people with dementia, and increased burden for caregivers [8, 12]. Additionally, BPSD are a key reason for referral to specialist services [13].
Professional caregivers of people with DS + AD found it particularly difficult to respond to the unpredictability of behavioral changes [14] and might not seek intervention until the behavior becomes more difficult to manage [15, 16]. Moreover, changes may be perceived as disability-specific instead of related to dementia (i.e., diagnostic overshadowing) [14, 17]. Therefore, systematic evaluation of BPSD is important to increase awareness, acceptance and understanding among family members and care professionals, which in turn may contribute to adapting care/support [15, 18]. Furthermore, BPSD are reported in prodromal and early stages of dementia and might, as such, serve as early ‘alarm signals’ [19]. For daily practice, anticipating the development of symptoms enables among others timely adaptation of daily support, work and day-care and the living environment [20]. Importantly, BPSD can (partially) be treated, either non-pharmacologically or pharmacologically [17, 21–26].
In the general population, BPSD are regularly evaluated using validated scales such as the Neuropsychiatric Inventory [27, 28]. However, such scales are not adapted/validated for people with ID, including DS. Scales commonly used to screen for or diagnose dementia in people with ID have a more limited focus on behavioral alterations [29]. Consequently, BPSD have not been thoroughly evaluated in this population. Therefore, we developed the Behavioral and Psychological Symptoms of Dementia in Down Syndrome (BPSD-DS) scale to evaluate behavioral changes by comparing frequency and severity of behavioral items in the last six months with characteristic/typical behavior before decline occurred. Initial development of this systematic informant interview has been previously described in Journal of Alzheimer’s Disease [30]. The initial version consisted of 83 behavioral items in 12 clinically defined sections. In 281 individuals with DS without dementia (DS), with questionable dementia (DS + Q) and with dementia (DS + AD), behavioral changes were identified with promising results in terms of first validity and reliability data [30]. Based on results and experiences obtained in the initial study, we aimed to optimize the scale (among others by shortening and refining it for applicability in daily practice) and to further study this optimized version (including reliability and discriminative ability, such as confirmation of previous results about item relevance) in a large representative DS study population.
METHODS
Scale optimization
The initial BPSD-DS scale (83 items) was shortened based on item irrelevance in combination with multidisciplinary experiences gained in the initial study. An item was considered irrelevant if≥85% of DS + Q and DS + AD individuals showed unaltered scores (change = 0) for both frequency and severity, i.e., a lack of clinically relevant change in relation to dementia [30]. After shortening, the scale was textually refined, and the manual was improved considering practical experiences in the initial study.
Translation
The optimized Dutch version (source document) was forward and back translated into French, Italian, and Spanish by a certified professional translation company (DBF Communicatie B.V., Alphen aan den Rijn, The Netherlands). Translations were performed according to the International Organization for Standardization (ISO) standard for translation services (ISO 17100:2015) and the company’s standard operating procedures based on this standard. Firstly, the BPSD-DS II was translated into the target languages by certified, experienced native-speaker translators and subsequently checked by experienced revisers. Next, back translations into Dutch were performed by different translators than those involved in the original forward translation. Together with medical/psychological experts of various consortium partners (see below), translations were additionally checked and refined. Checks for consistency were performed before and after refinement. The manual was only translated from Dutch to English, given the fact that the interviewers were proficient in English.
Digitization
To facilitate administration, improve data quality (completeness of entered data, guidance of interviewers), and facilitate data processing, a digital version of the optimized scale was developed in various rounds of optimization and problem-solving. An online version of the BPSD-DS II was built and customized in the web application Limesurvey. The system has been hosted and managed in a secured in-house IT environment at the Center for Information Technology of the University of Groningen (RUG) in accordance with privacy and security policy, the Acceptable Use policy, ethical guidelines and the EU General Data Protection Regulation. The system provided a step-by-step guide for interviewers, automatically calculated change scores and enabled downloading PDF-reports after completion. A pseudonymized SPSS-export of this database constituted the basis for analyses.
Multidisciplinary consortium
Expanding on the previously established consortium [30], a total of 17 Dutch care institutions and 4 European expertise centers took part in the study. This broad, multidisciplinary consortium enabled the study of a large, representative study population of people with DS in a daily clinical practice setting. The following Dutch care institutions participated, providing care, diagnostics and therapy to people with ID/DS throughout nearly the entire country: Amerpoort, Aveleijn, Cosis, De Twentse Zorgcentra, Dichterbij, Elver, Ipse de Bruggen, Nieuw Woelwijck, Philadelphia, Reinaerde, ’s Heeren Loo, Severinus, Sherpa, Sprank, Talant (part of Alliade Care Group), Vanboeijen, and Zuidwester. In addition, University of Antwerp and its Flemish network of care institutions (Belgium), Institut Jérôme Lejeune (France), Policlinico Gemelli (Italy), and Hospital de la Santa Creu i Sant Pau (Spain) participated in administering the scale.
Scoring
Frequency and severity were scored for each scale item. To identify behavioral changes over time and account for pre-existing behavior, frequency and severity were scored for two periods of time: (a) last six months and (b) typical/characteristic behavior before any deterioration occurred. Frequency was scored on a five-point scale: 0 = never or once only, 1 = less than once a month, 2 = monthly, not weekly, 3 = weekly, not daily, or 4 = daily or continuously. The resulting frequency change score (score for sub-item (a) –score for sub-item (b)) is a measure of behavioral change over time and ranged from –4 to + 4. Severity was considered from the perspective of the person with DS and based on two aspects: personal suffering and degree of impact on daily life. Severity was scored on a four-point scale: 0 = none, 1 = slight, 2 = moderate, or 3 = serious. The resulting severity change score (score for sub-item (a) –score for sub-item (b)) is a measure of behavioral change over time and ranged from –3 to + 3.
Depending on the residential circumstances, informant(s) may not always be aware of the person’s sleep behavior. The answer option ‘unknown’ (?) was therefore provided to items in section 2 about sleep problems. In addition, for some items the answer option ‘not applicable’ (N/A) was provided. Depending on the person’s physical disability and/or freedom-restricting measures (items 1.2, 1.4, 2.3, 5.2, and 5.4, see Results section) and verbal (in)abilities (items 3.3, 5.5, 6.1, and 10.2, see Results section), the interviewer could select the answer ‘not applicable’ if a symptom could not occur.
Finally, care(giver) burden was evaluated in each section from the perspective of caregivers/family members. Care burden score per section was based on three aspects: 1) manageability of symptoms, 2) additional time required, and 3) emotional burden. Care burden was scored on a four-point scale: 0 = none, 1 = slight, 2 = moderate, or 3 = serious. Per section, the resulting care burden change (score for sub-item (a) –score for sub-item (b)) ranged from –3 to + 3.
Interviewers
The BPSD-DS II was completed by conducting interviews with informants according to a detailed manual. Interviews were performed by experienced clinicians, ID (neuro)psychologists (including behavioral therapists who studied special needs education (in Dutch: orthopedagogiek)), psychological assistants or researchers. Interviewers all received an instruction session about the procedure and the digital system and were able to practice with the system in advance. Interviewers adhered to the manual and the sequence of sections and items.
Informants
Interviews were conducted with at least one key informant of the person with DS, such as a caregiver working in a day-care center/residential facility or a family member. Informants had to be able to provide an accurate description of the behavior in the last six months as well as the typical/characteristic behavior in the past before decline occurred. Additional key informants were recruited, especially in cases where a single informant could not provide answers to all questions and both time periods. If informants were not able to describe the typical/characteristic behavior and this became apparent during the interview, this resulted in exclusion. In case of multiple informants, they were interviewed in a single session (not separately). Interviews were conducted in absence of the person with DS. Prior to the interview, set-up and scoring system were explained to the informant(s). In case of disagreement between informants, consensus on the score was reached during the interview. If an informant did not understand an item, the interviewer provided clarification. If informants evidently exaggerated or trivialized symptoms, the interviewer addressed this. Informants were asked to give short, succinct answers, and were reminded to do so if they gave long-winded or anecdotal responses. For each person with DS, the BPSD-DS II was administered once-only, apart from a number for individuals for whom a retest interview was conducted (test-retest reliability).
Ethics
The Medical Ethics Review Board of the University Medical Center Groningen (UMCG) evaluated the study protocol (no. 2018/220) and concluded that the Dutch Medical Research Human Subjects Act did not apply. The study was registered in the UMCG Research Register (no. 201800252) and compliant with the EU General Data Protection Regulation and standards for medical research in humans recommended by the Declaration of Helsinki. Local institutional review committees gave their approval, whenever applicable. In Flanders, Belgium, the Institutional Review Boards of the Hospital Network Antwerp (no. 5058) and the University Hospital Antwerp/University of Antwerp (no. 17/50/566) approved the study. In France, the study was authorized under research standard MR-004 by the Commission Nationale de l’Informatique et des Libertés (no. 2214487 v 0). In Italy, the study was approved by the Ethical Committee of the Universitá Cattolica del Sacro Cuore (no. 2731520). In Spain, the study was approved by the Sant Pau Ethics Committee and reported to the Minister of Justice according to the Spanish law for research in people with ID.
Study population, recruitment, and consent
To ensure a representative study population, participants were recruited through the aforementioned care institutions (various backgrounds, regions, living situations) based on inclusion and exclusion criteria. Inclusion criteria: phenotypical diagnosis of DS, aged ≥30 years, and a stable dose of psychoactive medications (if any). Exclusion criteria: profound ID, long-term admission to hospital in the past six months, bed-ridden or in terminal care (e.g., end-stage dementia), presence of a confirmed cerebrovascular accident, and absence of at least one informant able to describe the person’s behavior in the past six months and typical/characteristic behavior in the past. People who faced a recent life event, e.g., moving home or death of a family member, with continued impact on behavior were excluded, according to clinical judgement. Furthermore, individuals were excluded who presented behavioral changes that, according to clinical judgement, were due to another condition (comorbidity), if diagnosed, for example (un)treated depression, epilepsy, hypothyroidism, vitamin B12 deficiency, hearing problems, vision problems, sleep apnea, and chronic pain. A diagnosis of such a comorbidity per se did not result in exclusion if the person functioned normally (e.g., due to effective treatment). ID level, medical conditions, and medication use were based on (medical) records, and if necessary, inquiries with involved care institutions, clinicians, and ID (neuro)psychologist. After selection, an information letter with consent form was sent. Except for a few individuals with DS capable to provide consent themselves (adapted informed consent form with pictograms), written informed consent was generally obtained from legal representatives (proxy consent). Consent was provided for evaluation of behavioral changes using the BPSD-DS II scale and processing/analysis of the coded data for this study.
Dementia diagnosis
Three diagnostic study groups were distinguished in this cross-sectional study: 1) DS without dementia (DS), 2) DS with questionable dementia (DS + Q), i.e., (slight) deterioration that is suggestive of dementia, but does not (yet) clearly meet the diagnostic criteria, and 3) DS with a clinical diagnosis of dementia (DS + AD). People with DS were assigned to one of the three study groups on the basis of expert clinical judgement by clinicians and/or ID (neuro)psychologists at the participating care institutions. Clinical diagnosis of dementia in people with DS is valid and reliable [16, 31]. This judgement was generally based on routine multidisciplinary clinical evaluation, informant interview(s), information from medical records, and general dementia criteria [32, 33]. People with DS were not subjected to new dementia assessments. The diagnosis, and thus assignment to the three study groups, was established in advance and not based on outcomes of the BPSD-DS II.
Validity
This study builds further on the initial development process in which face and content validity of the BPSD-DS were ensured by deducing items from literature (review provided in [29]), multidisciplinary experiences in daily practice and consecutive feedback rounds with experts from different disciplines [30]. Validity was strengthened here by substantially optimizing the scale (BPSD-DS II) based on test results and multidisciplinary clinical feedback obtained in the initial study. Like in the initial study, concurrent validity could not be established due to the lack of a (gold) standard instrument for behavioral changes in DS or ID to compare the BPSD-DS II with. Finally, discriminative ability of the BPSD-DS II in relation to the status of dementia was assessed (see below).
Discriminative ability
In the context of discriminative ability, 1) item (ir)relevance, 2) total scale scores, and 3) sensitivity, specificity and predictive values were analyzed. First of all, we aimed to confirm relevance of behavioral items in the optimized BPSD-DS II, that is, to what extent did behavioral items change in relation to the status of dementia. Frequency change and severity change were compared between the three groups for every individual item. Resembling the initial study [30], an item was considered irrelevant if≥85% of DS + Q and DS + AD individuals showed unaltered scores (change = 0) for both frequency change and severity change (cross-sectional data), i.e., a lack of clinically relevant change in relation to dementia. That is, applicability/implementation of the scale in daily clinical practice would be hampered if specific items need to be scored (at the cost of time), while such items only change for a very limited number of individuals in relation to dementia. Secondly, frequency change and severity change scores for the total scale were calculated as the sum of individual item change scores for frequency and severity, respectively. To evaluate discriminative ability of the BPSD-DS II, sum scores for the total scale were compared between the three groups. Thirdly, we calculated sensitivity, specificity, positive predictive values, and negative predictive values [34] for different cut-off (total scale) scores on the BPSD-DS II. ROC analyses were performed using total scale frequency change scores (all items).
Reliability
Reliability was studied by evaluating interrater reliability (IRR) and test-retest reliability (TRR) for a subset of individuals with DS. For IRR, the same interview was scored by two interviewers blinded to each other’s scores. For this purpose, the first interviewer conducted the interview, and a second interviewer was present as a ‘fly on the wall’ (not involved in the interview). IRR assessments were performed in various combinations of interviewers in multiple centers. For TRR, a second interview by the same interviewer and with the same informant(s) was conducted within 1–7 weeks after the first interview. Originally, we aimed to have a retest conducted within 4 weeks. However, due to practical difficulties, this was extended in the course of the study. IRR and TRR may be calculated using percent agreement, correlations or Cohen’s kappa [35]. Because of the categorical nature of the item scores in the BPSD-DS II, we have used percent agreement instead of correlation, since correlation is the recommended measure of agreement for results on a continuous scale. We did not use Cohen’s kappa, because this measure is affected by the prevalence or, as in our case, clustering of agreement in one of the categories, and is therefore less reliable for items where change is rare and both assessments agree on this. For items with low variations in the change scores, low values of kappa may not necessarily reflect low rates of overall agreement [36]. Although the total scale score could be regarded as continuous, we also applied percent agreement here to be able to evaluate reliability both for perfect agreement as well as with margins of plus or minus 1, 2, or 3 points. Moreover, percent agreement is considered a safe reliability measure in situations where raters (interviewers here) are well trained and guessing the answer is unlikely [35]. Finally, internal consistency was determined per item and for the total scale by calculating Cronbach’s alphas for frequency change and severity change scores.
Data processing and quality control
Each completed scale, including those administered for reliability testing, was thoroughly checked for any lack of clarity, missing data, inclusion/exclusion criteria, and compliance with the instructed method and rules described in the manual, including rules regarding the interviewer, informants and scoring (see above). In particular, rules concerning the possibility to answer ‘not applicable’ were double checked and scores adapted, if necessary. That is, ‘not applicable’ was only allowed if a person was not verbal, physically impaired, or freedom-limiting measures were in place. If required, the involved interviewers were consulted, and issues were solved through consensus.
Statistics
For population characteristics (Table 1), Pearson’s chi-squared tests were applied to compare categorical data between groups. ANOVA tests were used to compare normally distributed continuous data (age and IQ-scores) between groups.
Table 1
Characteristics of the three diagnostic study groups
| A: Participants’ characteristics | DS (N = 292) | DS + Q (N = 119) | DS + AD (N = 113) | p |
| Sex (% male) | 51.7 | 48.7 | 61.1 | 0.135 |
| Mean age±SD (min.-max.) | 47.4±9.0 (30.0–73.0) | 53.8±7.7 (33.4–74.0) | 57.3±6.4 (37.2–70.0) | < 0.001 |
| ID level (baseline): mild; moderate; severe (%) | 11.3; 66.8; 21.9 | 16.0; 57.1; 26.9 | 8.0; 62.8; 29.2 | 0.160 |
| IQ-score available (%) (mean IQ-score±SD) | 21.2 (42.3±11.6) | 22.7 (44.2±9.4) | 15.9 (40.4±11.9) | 0.387; 0.543 |
| Living independently; with family; assisted facilities; other (%) | 1.7; 12.7; 85.6; 0.0 | 0.0; 12.6; 86.6; 0.8 | 0.0; 10.6; 86.7; 2.7 | 0.066 |
| Attending day-care (%) | 93.5 | 89.9 | 82.3 | 0.003 |
| Type DS: full trisomy; translocation; mosaicism; unknown (%) | 37.0; 0.3; 0.3; 62.3 | 39.5; 0.8; 0.8; 58.8 | 45.1; 0.9; 0.9; 53.1 | 0.706 |
| Depression: treated; untreated (%) | 2.7; 0.0 | 3.4; 0.0 | 8.0; 0.0 | 0.051 |
| Epilepsy: treated; untreated (%) | 3.8; 0.3 | 9.2; 1.7 | 20.4; 2.7 | < 0.001 |
| Hypothyroidism: treated; untreated (%) | 41.4; 1.0 | 46.2; 0.8 | 56.6; 0.9 | 0.106 |
| Vitamin B12 deficiency: treated; untreated (%) | 4.1; 0.0 | 8.4; 0.0 | 5.3; 0.0 | 0.214 |
| Hearing problems: treated; untreated (%) | 28.8; 15.1 | 34.5; 19.3 | 38.1; 25.7 | 0.006 |
| Vision problems: treated; untreated (%) | 58.9; 19.2 | 59.7; 22.7 | 58.4; 26.5 | 0.355 |
| Sleep apnea: treated; untreated (%) | 4.1; 2.4 | 4.2; 5.0 | 6.2; 4.4 | 0.536 |
| Chronic pain: treated; untreated (%) | 10.6; 3.1 | 13.4; 5.0 | 18.6; 2.7 | 0.211 |
| Physical disability (%) | 7.9 | 7.6 | 8.8 | 0.929 |
| Dependent on wheelchair (%) | 0.3 | 1.7 | 5.3 | 0.003 |
| Swallowing problems (%) | 10.6 | 14.3 | 21.2 | 0.020 |
| Dental problems causing eating/drinking problems (%) | 10.3 | 13.4 | 14.2 | 0.458 |
| Verbal communication: able; no longer; never (%) | 93.2; 0.3; 6.5 | 90.8; 1.7; 7.6 | 90.3; 5.3; 4.4 | 0.013 |
| Any psychoactive medication use (%) | 18.8 | 33.6 | 54.9 | < 0.001 |
| - Antiepileptics (N03A, %) | 5.1 | 12.6 | 25.7 | < 0.001 |
| - Antipsychotics (N05A, %) | 8.6 | 13.4 | 23.9 | < 0.001 |
| - Anxiolytics (N05B, %) | 0.7 | 2.5 | 8.8 | < 0.001 |
| - Hypnotics and sedatives (N05C, %) | 1.0 | 0.8 | 3.5 | 0.142 |
| - Antidepressants (N06A, %) | 7.9 | 18.5 | 24.8 | < 0.001 |
| - Antidementia (N06D, %) | 0.0 | 1.7 | 5.3 | < 0.001 |
| - Opiods (N02A, %) | 0.0 | 0.0 | 2.7 | 0.004 |
| Number of psychoactive medications (% N = 0; 1; 2; 3; 4; 5) | 81.2; 14.0; 3.8; 0.3; 0.7; 0.0 | 66.4; 19.3; 10.9; 0.0; 3.4; 0.0 | 45.1; 23.9; 19.5; 5.3; 4.4; 1.8 | < 0.001 |
| B: Informants’ characteristics | DS (N = 534 informants) | DS + Q (N = 217 informants) | DS + AD (N = 203 informants) | p |
| Informants per participant (% N = 1; N = 2 or N = 3) | 35.6; 47.3; 17.1 | 34.5; 48.7; 16.8 | 36.3; 47.8; 15.9 | 0.997 |
| Sex (% men) | 21.6 | 19.3 | 15.9 | 0.436 |
| Caregiver: day-care; residential; nurse; family; other (%) | 6.8; 53.2; 0.2; 36.0; 3.8 | 7.4; 54.8; 0.9; 33.6; 3.2 | 4.4; 57.1; 0.5; 34.0; 3.9 | 0.779 |
| Years knowing participant (% < 2; 2–10; 10–20; > 20 years) | 6.6; 37.0; 14.0; 42.5 | 5.5; 36.9; 18.9; 38.7 | 11.3; 38.4; 12.8; 37.4 | 0.116 |
| Hours per week with participant (% < 10; 10–20; > 20 hours) | 27.9; 32.3; 39.8 | 29.0; 19.8; 51.2 | 33.5; 19.7; 46.8 | < 0.001 |
ID level refers to the highest level of functioning (baseline) before dementia-related decline occurred. Dependence on a wheelchair was defined as requiring a wheelchair not only outdoors for longer distances, but also indoors. If the person with DS does not need a wheelchair indoors, they may show most behavioral items related to physical activity in the BPSD-DS II, such as avoiding places, wandering, etc. The presence of (un)treated comorbidities did not result in evident behavioral changes. The fact that a condition had sometimes not been treated (no need yet, lack of/poor compliance, no treatment possible) was not the cause of behavioral changes in the BPSD-DS II scale, according to clinical judgment. Pearson’s chi-squared tests were applied to compare (categorical) data between groups. ANOVA was used to compare normally distributed continuous data (age and IQ-scores) between groups. A Kruskal-Wallis test was used to compare the number of psychoactive medications between groups (categorial, not normally distributed). p-values are reported with three decimals. DS, Down syndrome without dementia; DS + Q, Down syndrome with questionable dementia; DS + AD, Down syndrome with diagnosed AD dementia; ID, intellectual disabilities; IQ, intelligence quotient; SD, standard deviation.
In the context of discriminative ability, analysis focused on item (ir)relevance of individual items. ‘Unknown’ and ‘not applicable’ answers were treated as ‘missing values’. To compare individual item scores (frequency change and severity change) between the three groups, Kruskal-Wallis tests were used. Statistical analysis was conducted using original underlying frequency change scores (–4 to + 4), severity change scores (–3 to + 3), and care burden change scores (–3 to + 3). In Figs. 3–9 and Supplementary MaterialFigures 1–6, however, a simplified graphical representation of changes is provided in which the changes were simplified to ‘decrease’, ‘unaltered’, and ‘increase’. Secondly, frequency change and severity change scores for the total scale were calculated as the sum of individual item change scores for frequency and severity, respectively, and were compared between groups using Kruskal-Wallis tests. Thirdly, using total scale frequency change scores (all items), ROC analyses were performed. In addition to sensitivity and specificity, positive and negative predictive values were calculated as well [34].
Concerning reliability, IRR and TRR were calculated as percent agreement for frequency change scores and severity change scores per item and for the total scale. Total scale scores for frequency change could range from –208 to + 208 points and for severity change from –156 to + 156 points. Given the fact that the BPSD-DS II consists of 52 items and the fact that scoring behavior is not absolute, IRR and TRR were determined for perfect agreement (identical scores) as well as with margins on the total score ranging from –1 to + 1 point, from –2 to + 2 points and from –3 to + 3 points between both raters or between test and retest. Those margins are comparable with, for example, one item among 52 being scored differently. IRR and TRR were also calculated for care burden change scores (11 items) and the total scale care burden change score which could range from –33 to + 33 points, again for perfect agreement and with margins. To determine the internal consistency, Cronbach’s alphas were calculated for frequency change and severity change scores per item and for the total scale.
Additional analyses were performed to evaluate the effect of age, sex, ID level, and presence of depression on total scale scores for frequency change and severity change. To assess the effect of age, a linear regression analysis was performed within the study group without dementia (DS) using age as independent variable and total scale frequency change or severity change as dependent variable. The effect of sex (male/female) and depression (presence/absence) were studied using Mann-Whitney U tests on the entire study group of 524 participants (regardless of dementia status). Finally, the effect of ID level was studied on the entire study group comparing total scale scores (one-way ANOVA) between groups with mild, moderate ID, and severe ID.
p-values below 0.05 were regarded statistically significant. However, for analyses of frequency change and severity change per item and care burden change per section, the level of significance was adjusted according to the procedure described by Benjamini & Hochberg [37] to account for multiple testing. After applying this procedure original p-values below 0.020 were regarded statistically significant. Data were analyzed using SPSS version 26 (IBM Corp.) and Stata/SE version 14.2 (StataCorp LP).
RESULTS
Scale optimization
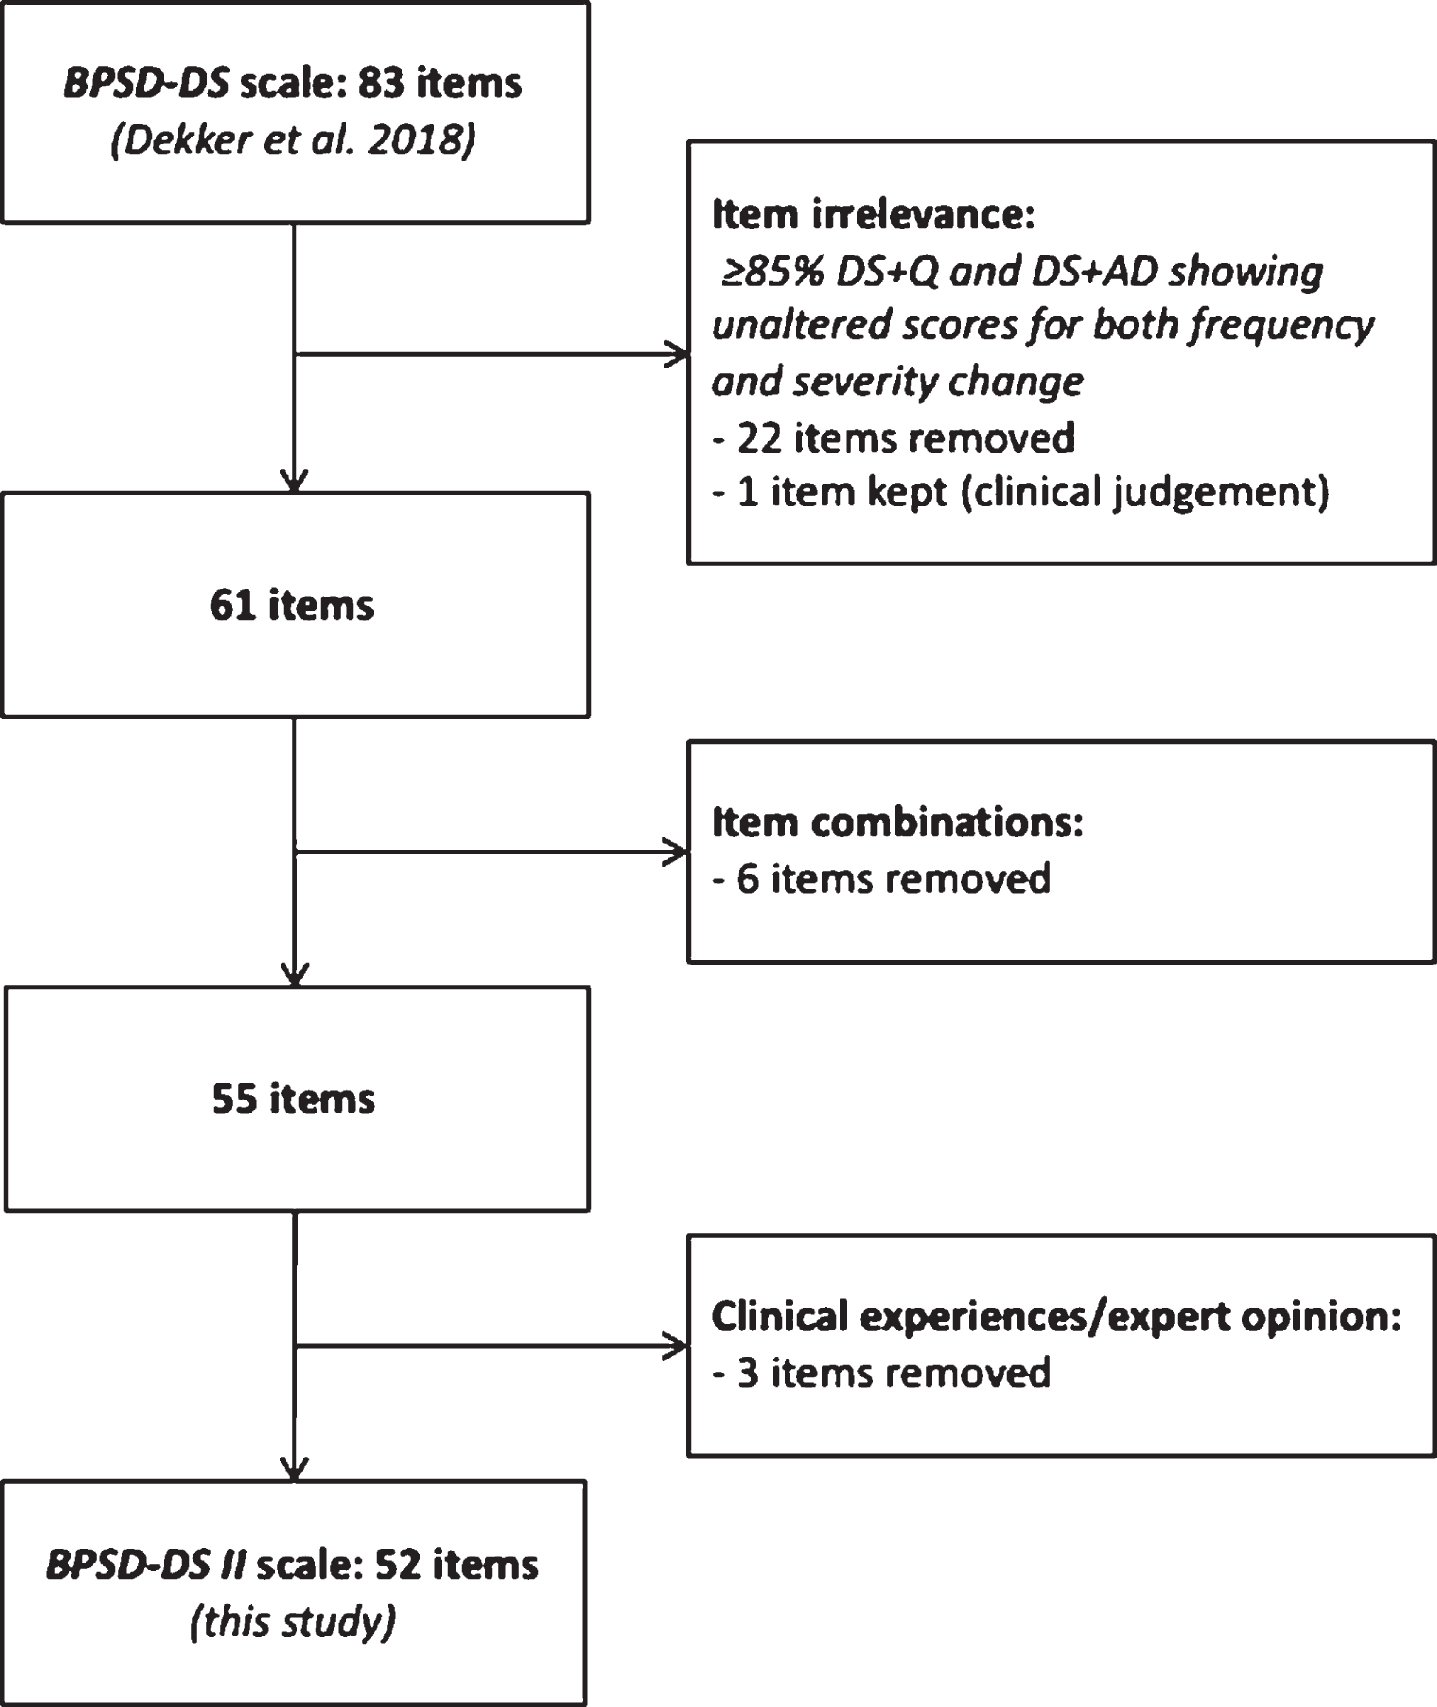
Based on prior results and clinical experiences obtained in the initial study [30], the BPSD-DS scale was optimized. A total of 23 items was considered irrelevant, including a large number of items relating to delusions, hallucinations, and disinhibited behavior. These items were removed with the exception for the item about pica, which was maintained based on multidisciplinary expert opinion. The scale was finally reduced from 83 to 52 items (Fig. 1). The scoring procedure was optimized as well: similar to the initial study, frequency and severity were scored per item for the last six months and the characteristic/typical behavior. However, care burden, previously scored per item for the last six months only, was now scored per section (instead of per item) and for both periods of time.
Fig. 1
Schematic overview of optimization of the BPSD-DS scale.
The BPSD-DS II consisted of two parts. Part A covered general information about interviewer, informant(s), and the person with DS, including items about differential diagnostics. Part B covered 52 items subdivided in 11 clinically defined sections: 1) anxious behavior, 2) sleeping problems, 3) irritable behavior, 4) obstinate behavior, 5) restless & stereotypic behavior, 6) aggressive behavior, 7) apathetic behavior, 8) depressive behavior, 9) psychotic behavior, 10) disinhibited behavior, and 11) eating & drinking behavior. Items per section are described below. The aim of these sections was not to diagnose, e.g., anxiety or aggression as an entity as such, but simply to group together items in a logic and informative manner to guide interviewers and informants through the entire scale. This is especially relevant for informants who are generally not trained in behavioral definitions and may misinterpret an item. Items addressed various potential dementia-related behavioral alterations within each section. Since BPSD may present rather heterogeneously over time [29], sections were not designed with the expectation that all items within a section would be relevant simultaneously.
Population demographics
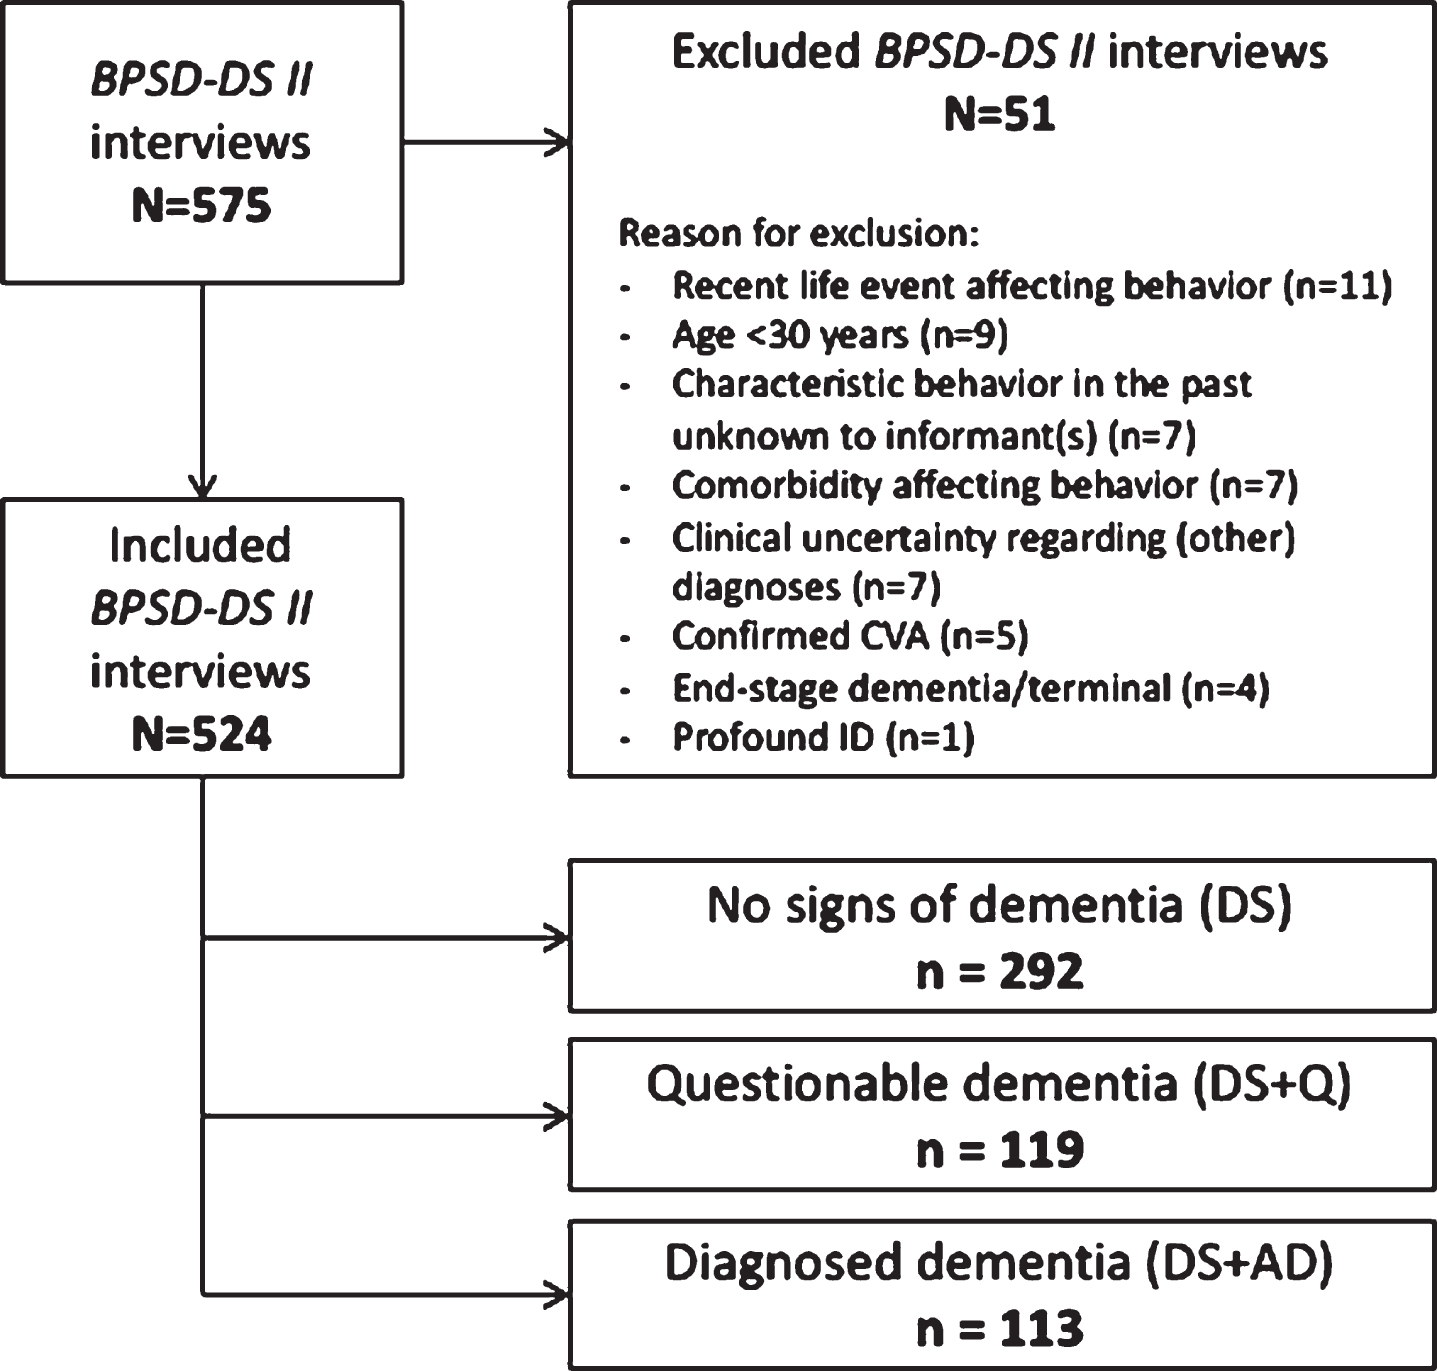
Using informant interviews, the BPSD-DS II was completed for 575 people with DS. According to exclusion criteria, 51 interviews were excluded for various reasons (Fig. 2), resulting in 524 eligible interviews. For a total of 92 people with DS, the interviewer had been previously involved in the diagnostic procedure of the (questionable) dementia within the care institution. Table 1A presents demographic data for each of the three study groups: DS (N = 292; 55.7% of people with DS in this study), DS + Q (N = 119; 22.7%), and DS + AD (N = 113; 21.6%). A total of 950 informants (17.5% men) participated in the 524 eligible interviews: 186 interviews were conducted with one informant, 250 with two informants, and 88 with three informants. Table 1B shows demographic data for the informants per study group. Informants were primarily caregivers working in day-care centers or residential facilities, and family members.
Fig. 2
Schematic overview of included and excluded interviews and the three study groups. BPSD-DS II, Behavioral and Psychological Symptoms of Dementia in Down Syndrome II scale; CVA, cerebrovascular accident; DS, Down syndrome without dementia; DS + Q, Down syndrome with questionable dementia; DS + AD, Down syndrome with diagnosed AD dementia; ID, intellectual disability.
Validity
Face and content validity were already ensured for the initial version of the BPSD-DS. Results and clinical experiences from that first study guided optimization of the scale to further strengthen its validity. In the context of discriminative ability, 23 irrelevant items were removed, shortening the scale from 83 to 52 items (Fig. 1). These were subsequently compared between groups (see below).
Discriminative ability: item (ir)relevance
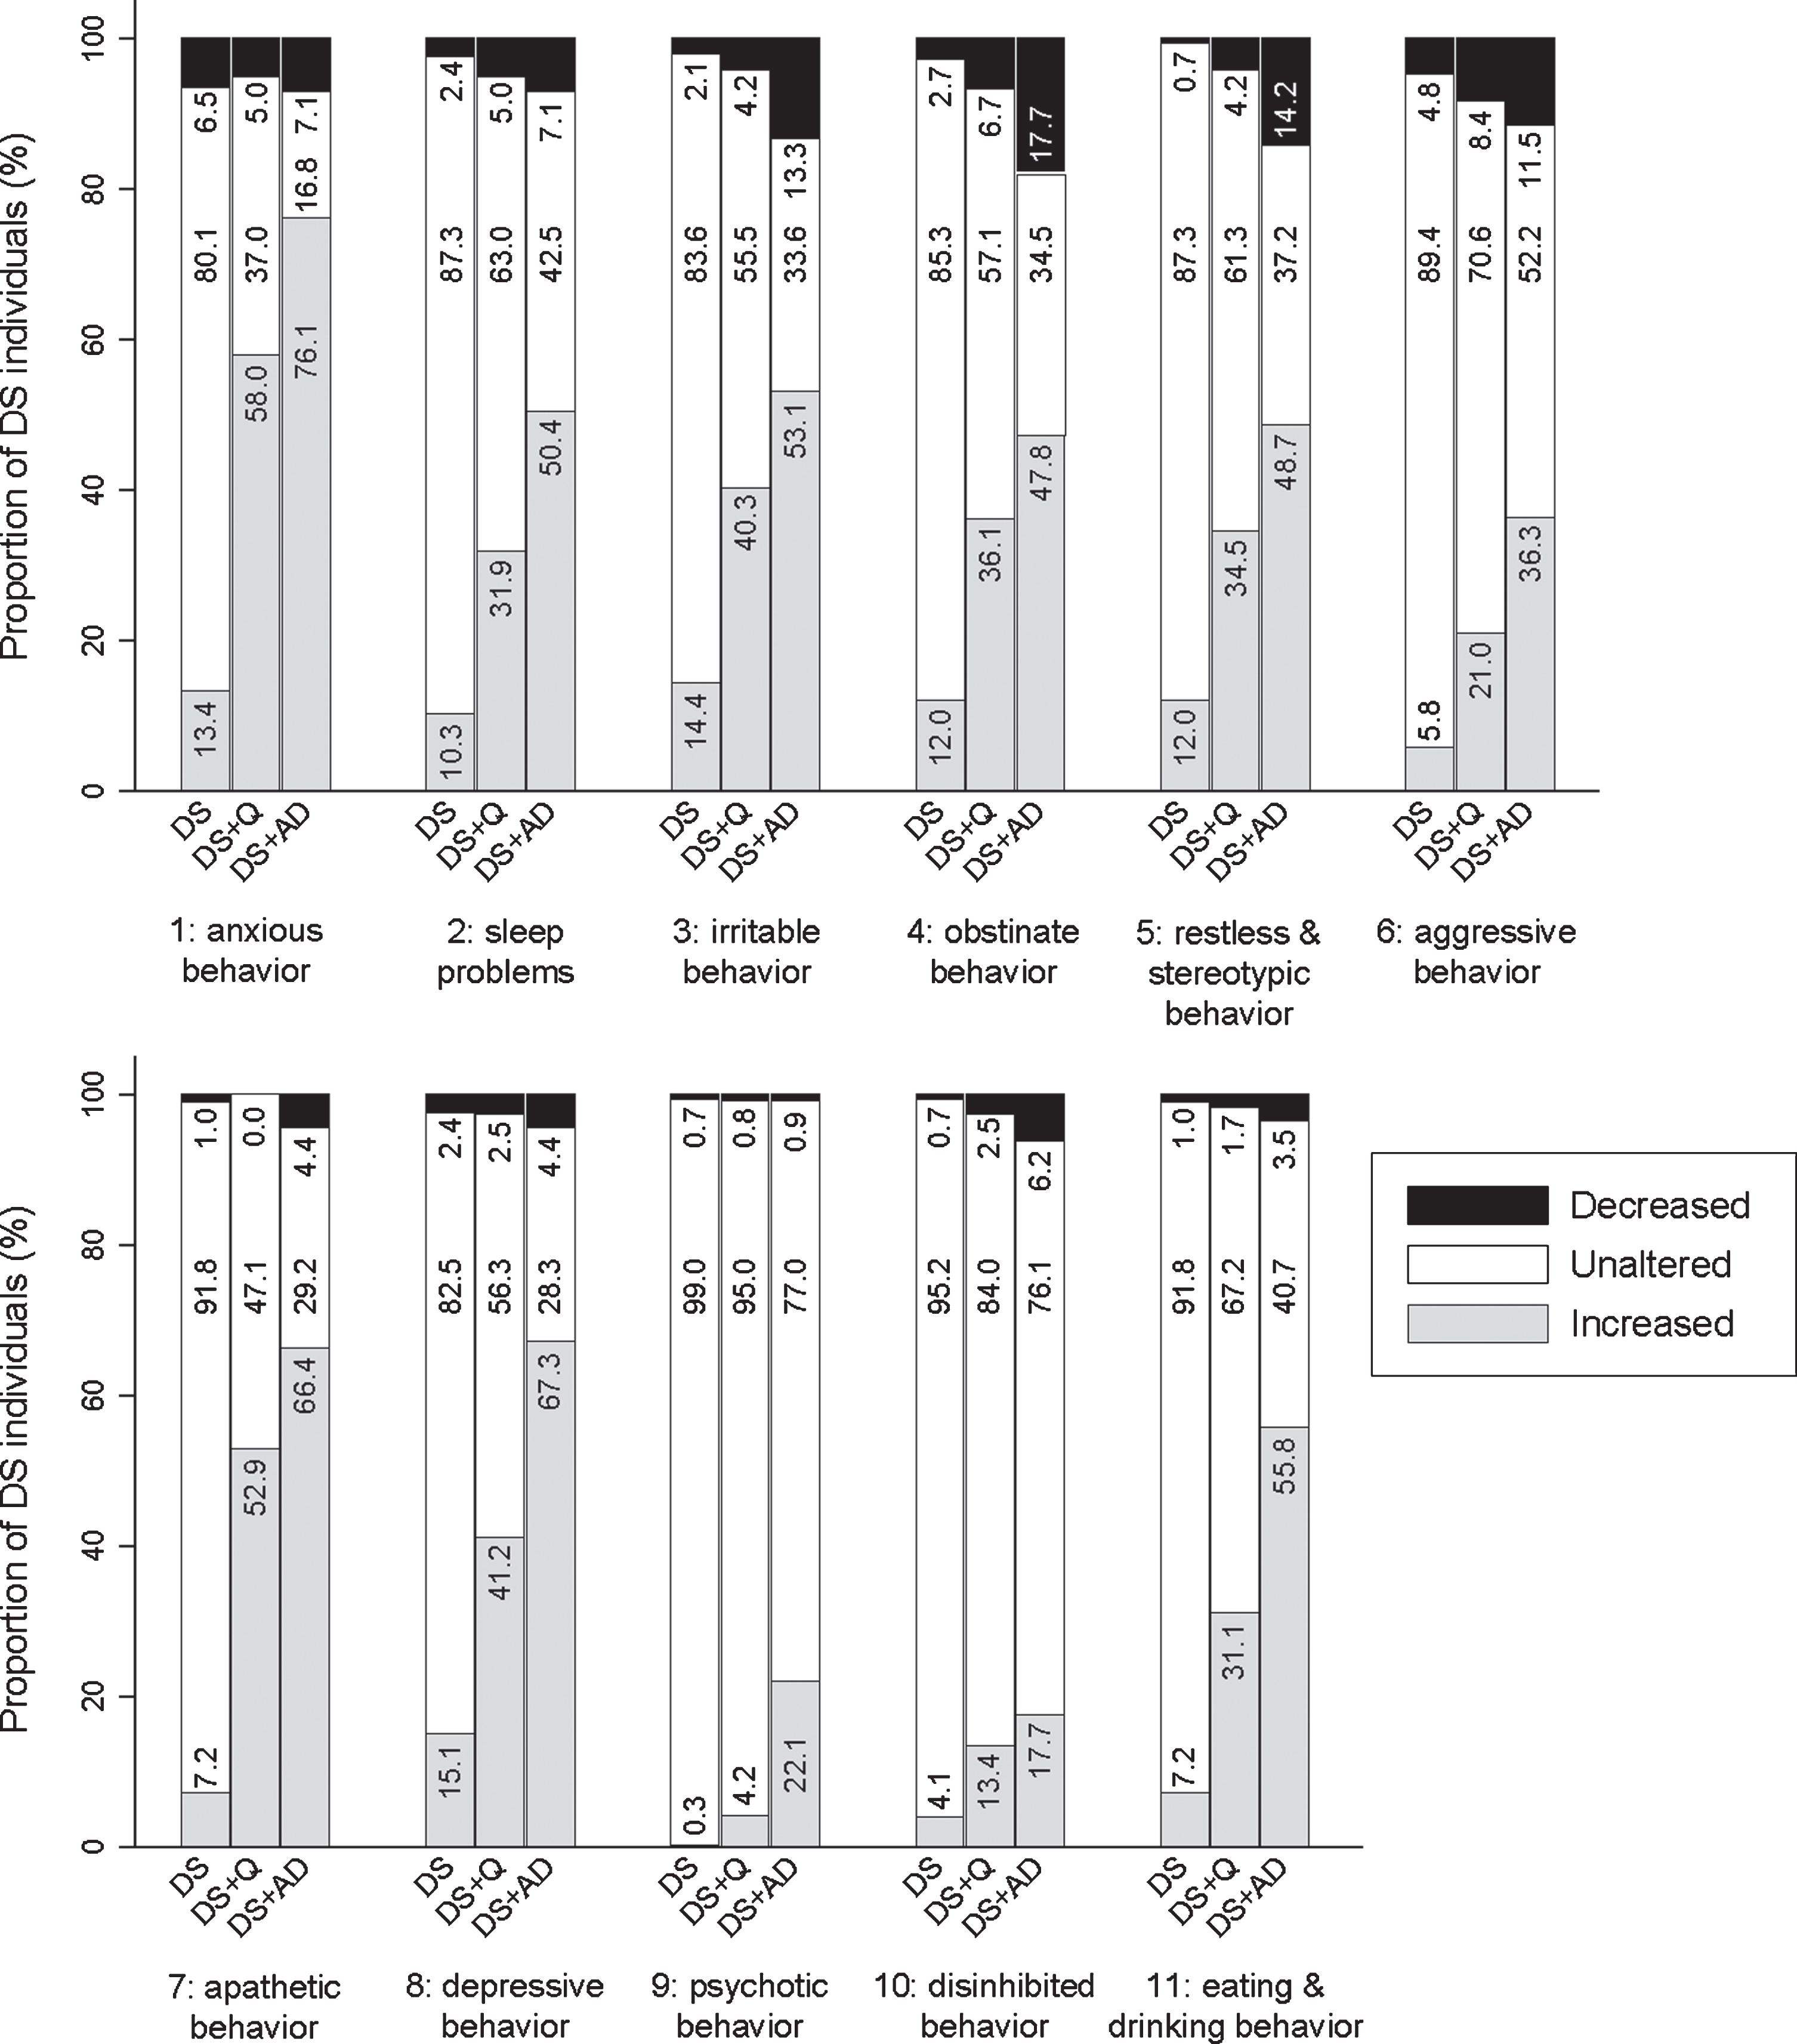
Here, we aimed to confirm the relevance of the remaining and refined 52 items by comparing frequency change and severity change across the three study groups. Hereafter, items are described per clinically defined section with the corresponding p-values for the comparison of frequency change scores (pfq) and severity change scores (psv) between groups. Figures 3–9 visualize frequency changes in a simplified way per item by depicting the proportion of individuals in each group (DS, DS + Q, DS + AD) showing any decreased, unaltered, or any increased frequency comparing the last sixth months to the typical/ characteristic behavior in the past. In general, frequency changes were more pronounced than severity changes. With the exception of a few items, the proportion of individuals within each group showing severity changes (any decrease, no change, any increase) largely followed the same pattern as frequency changes, though less pronounced. Therefore, only frequency changes are visualized below. A simplified presentation of severity changes is available in Supplementary Figures 1–6.
Fig. 3
Significant frequency changes for items in section 1 (anxious behavior). Underlying frequency change scores are depicted in a simplified way: the proportion of individuals (%) per group showing any decreased, unaltered or any increased frequency comparing the last sixth months to the typical/characteristic behavior in the past. Proportions of individuals (%) with missing values is depicted in dark grey, but not in numbers. Item descriptions and p-values (Kruskal-Wallis) are provided in the text. DS, Down syndrome without dementia; DS + Q, Down syndrome with questionable dementia; DS + AD, Down syndrome with diagnosed AD dementia.
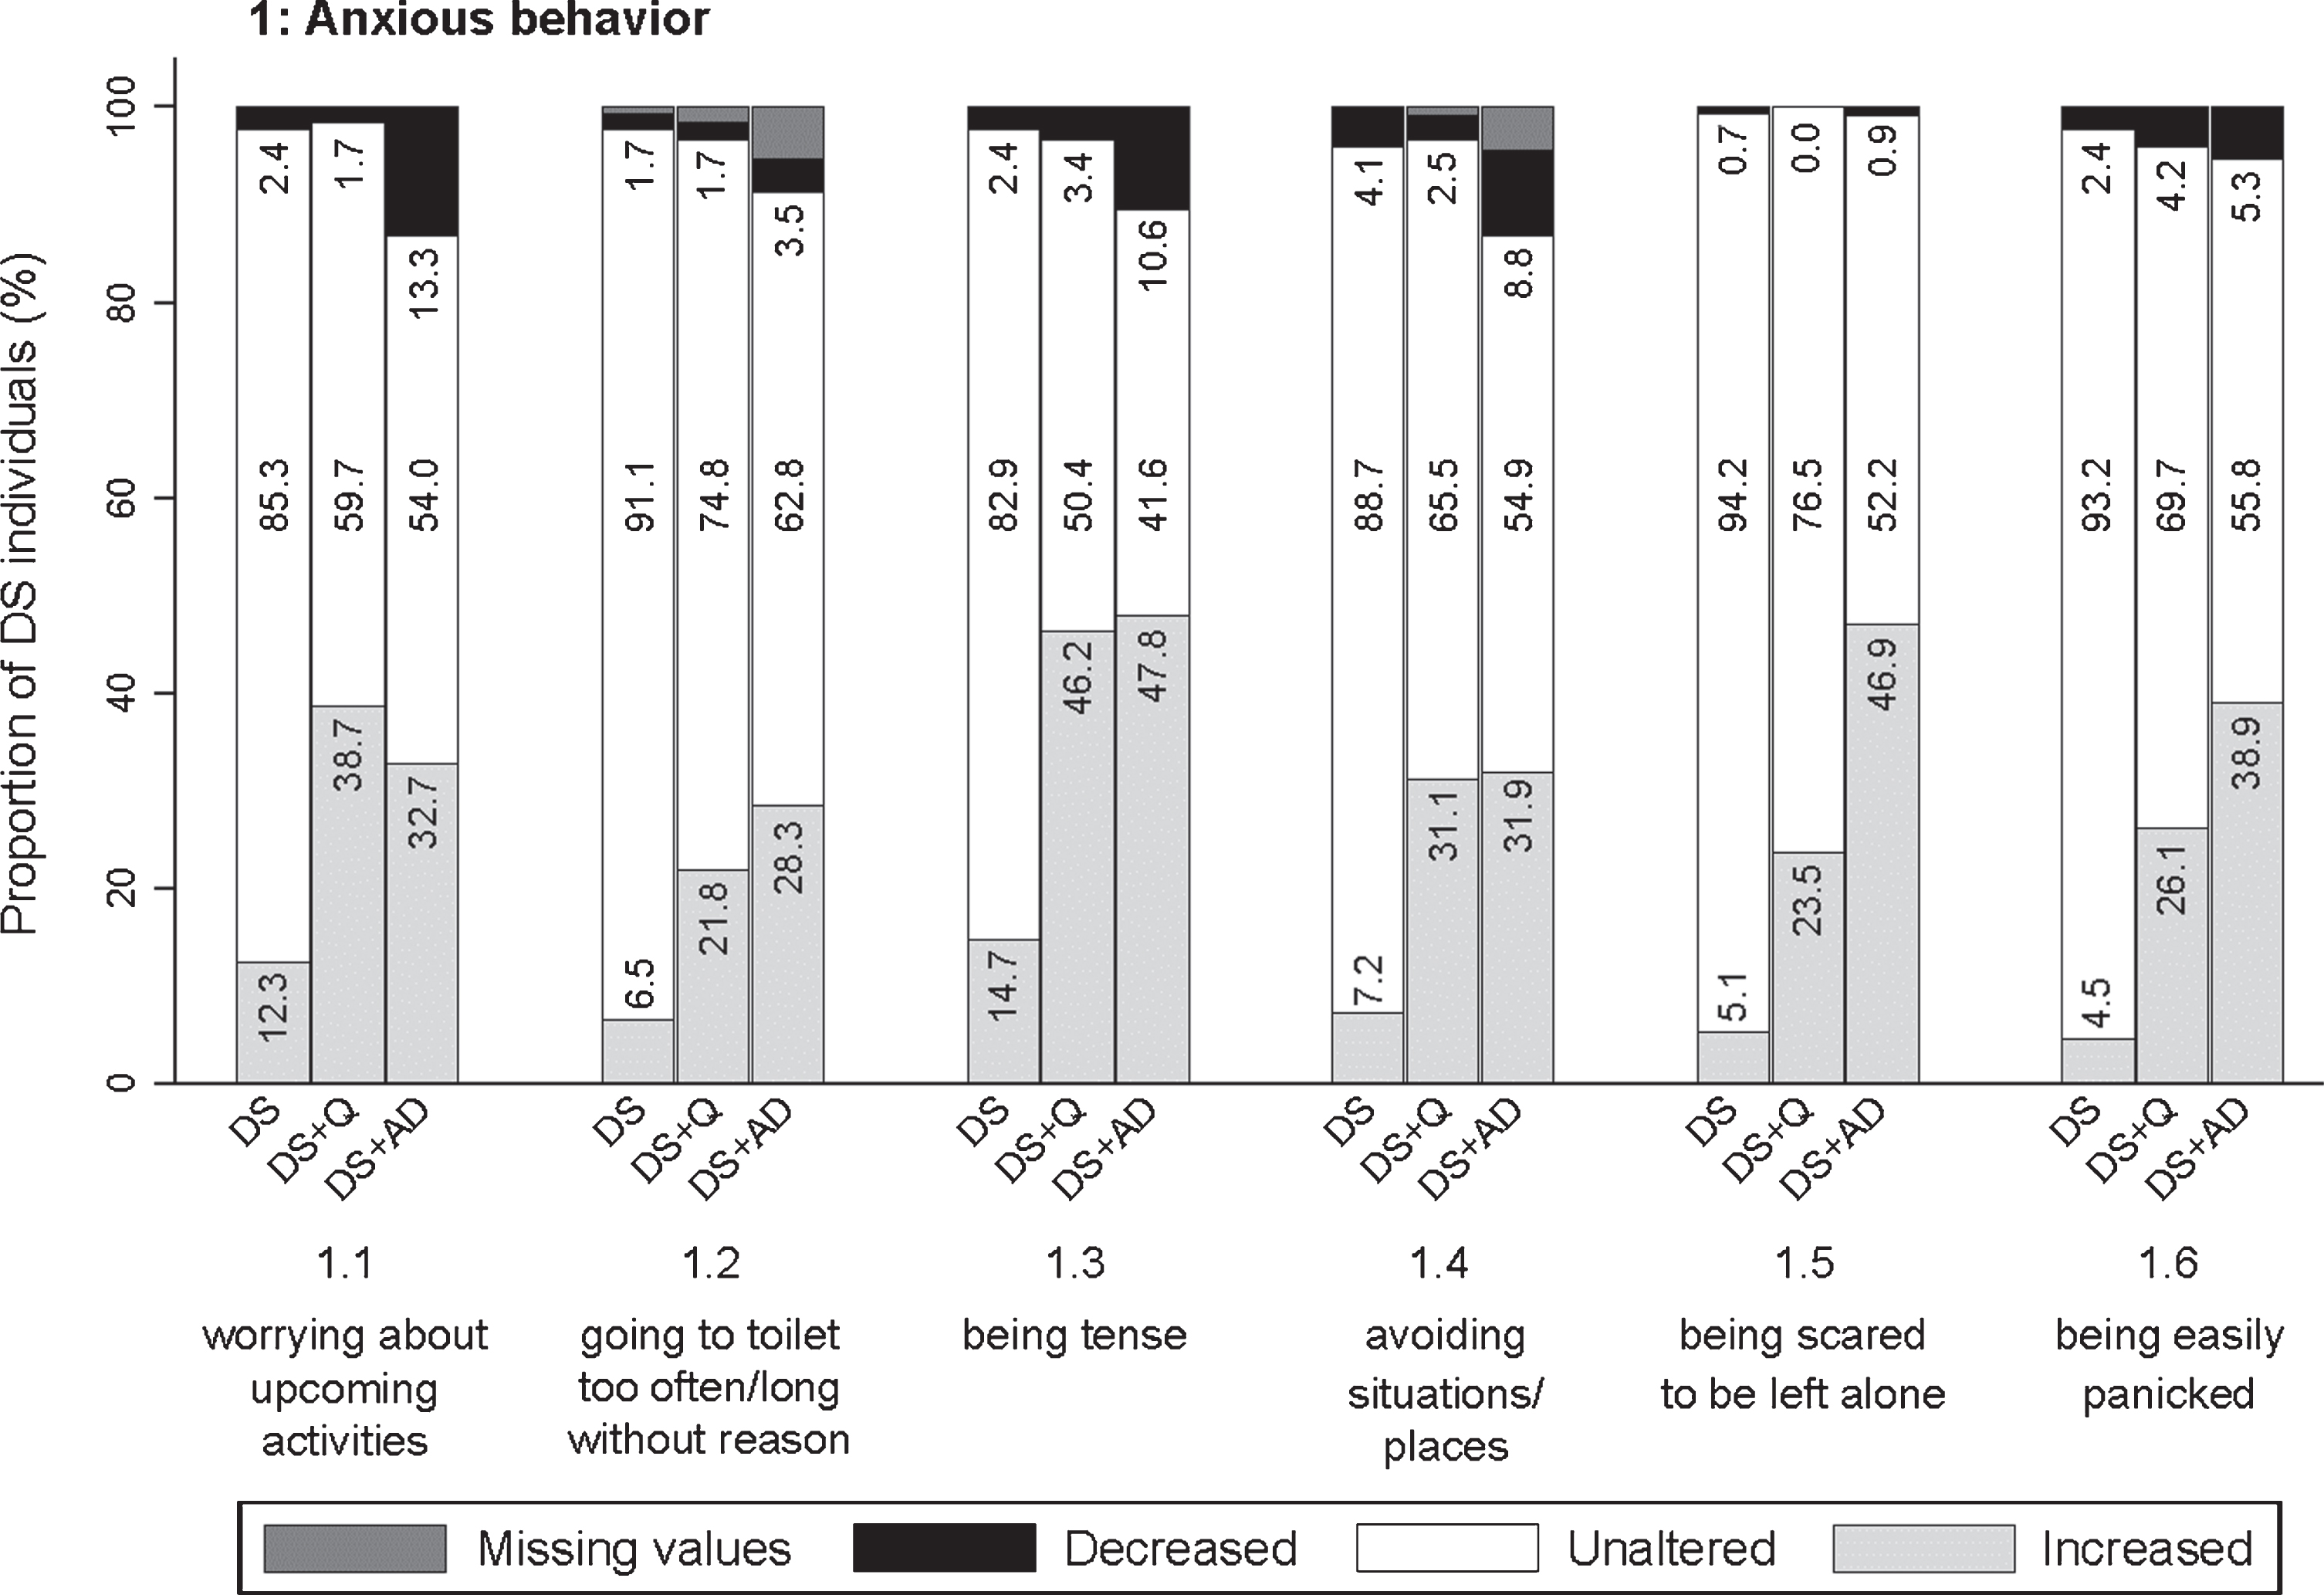
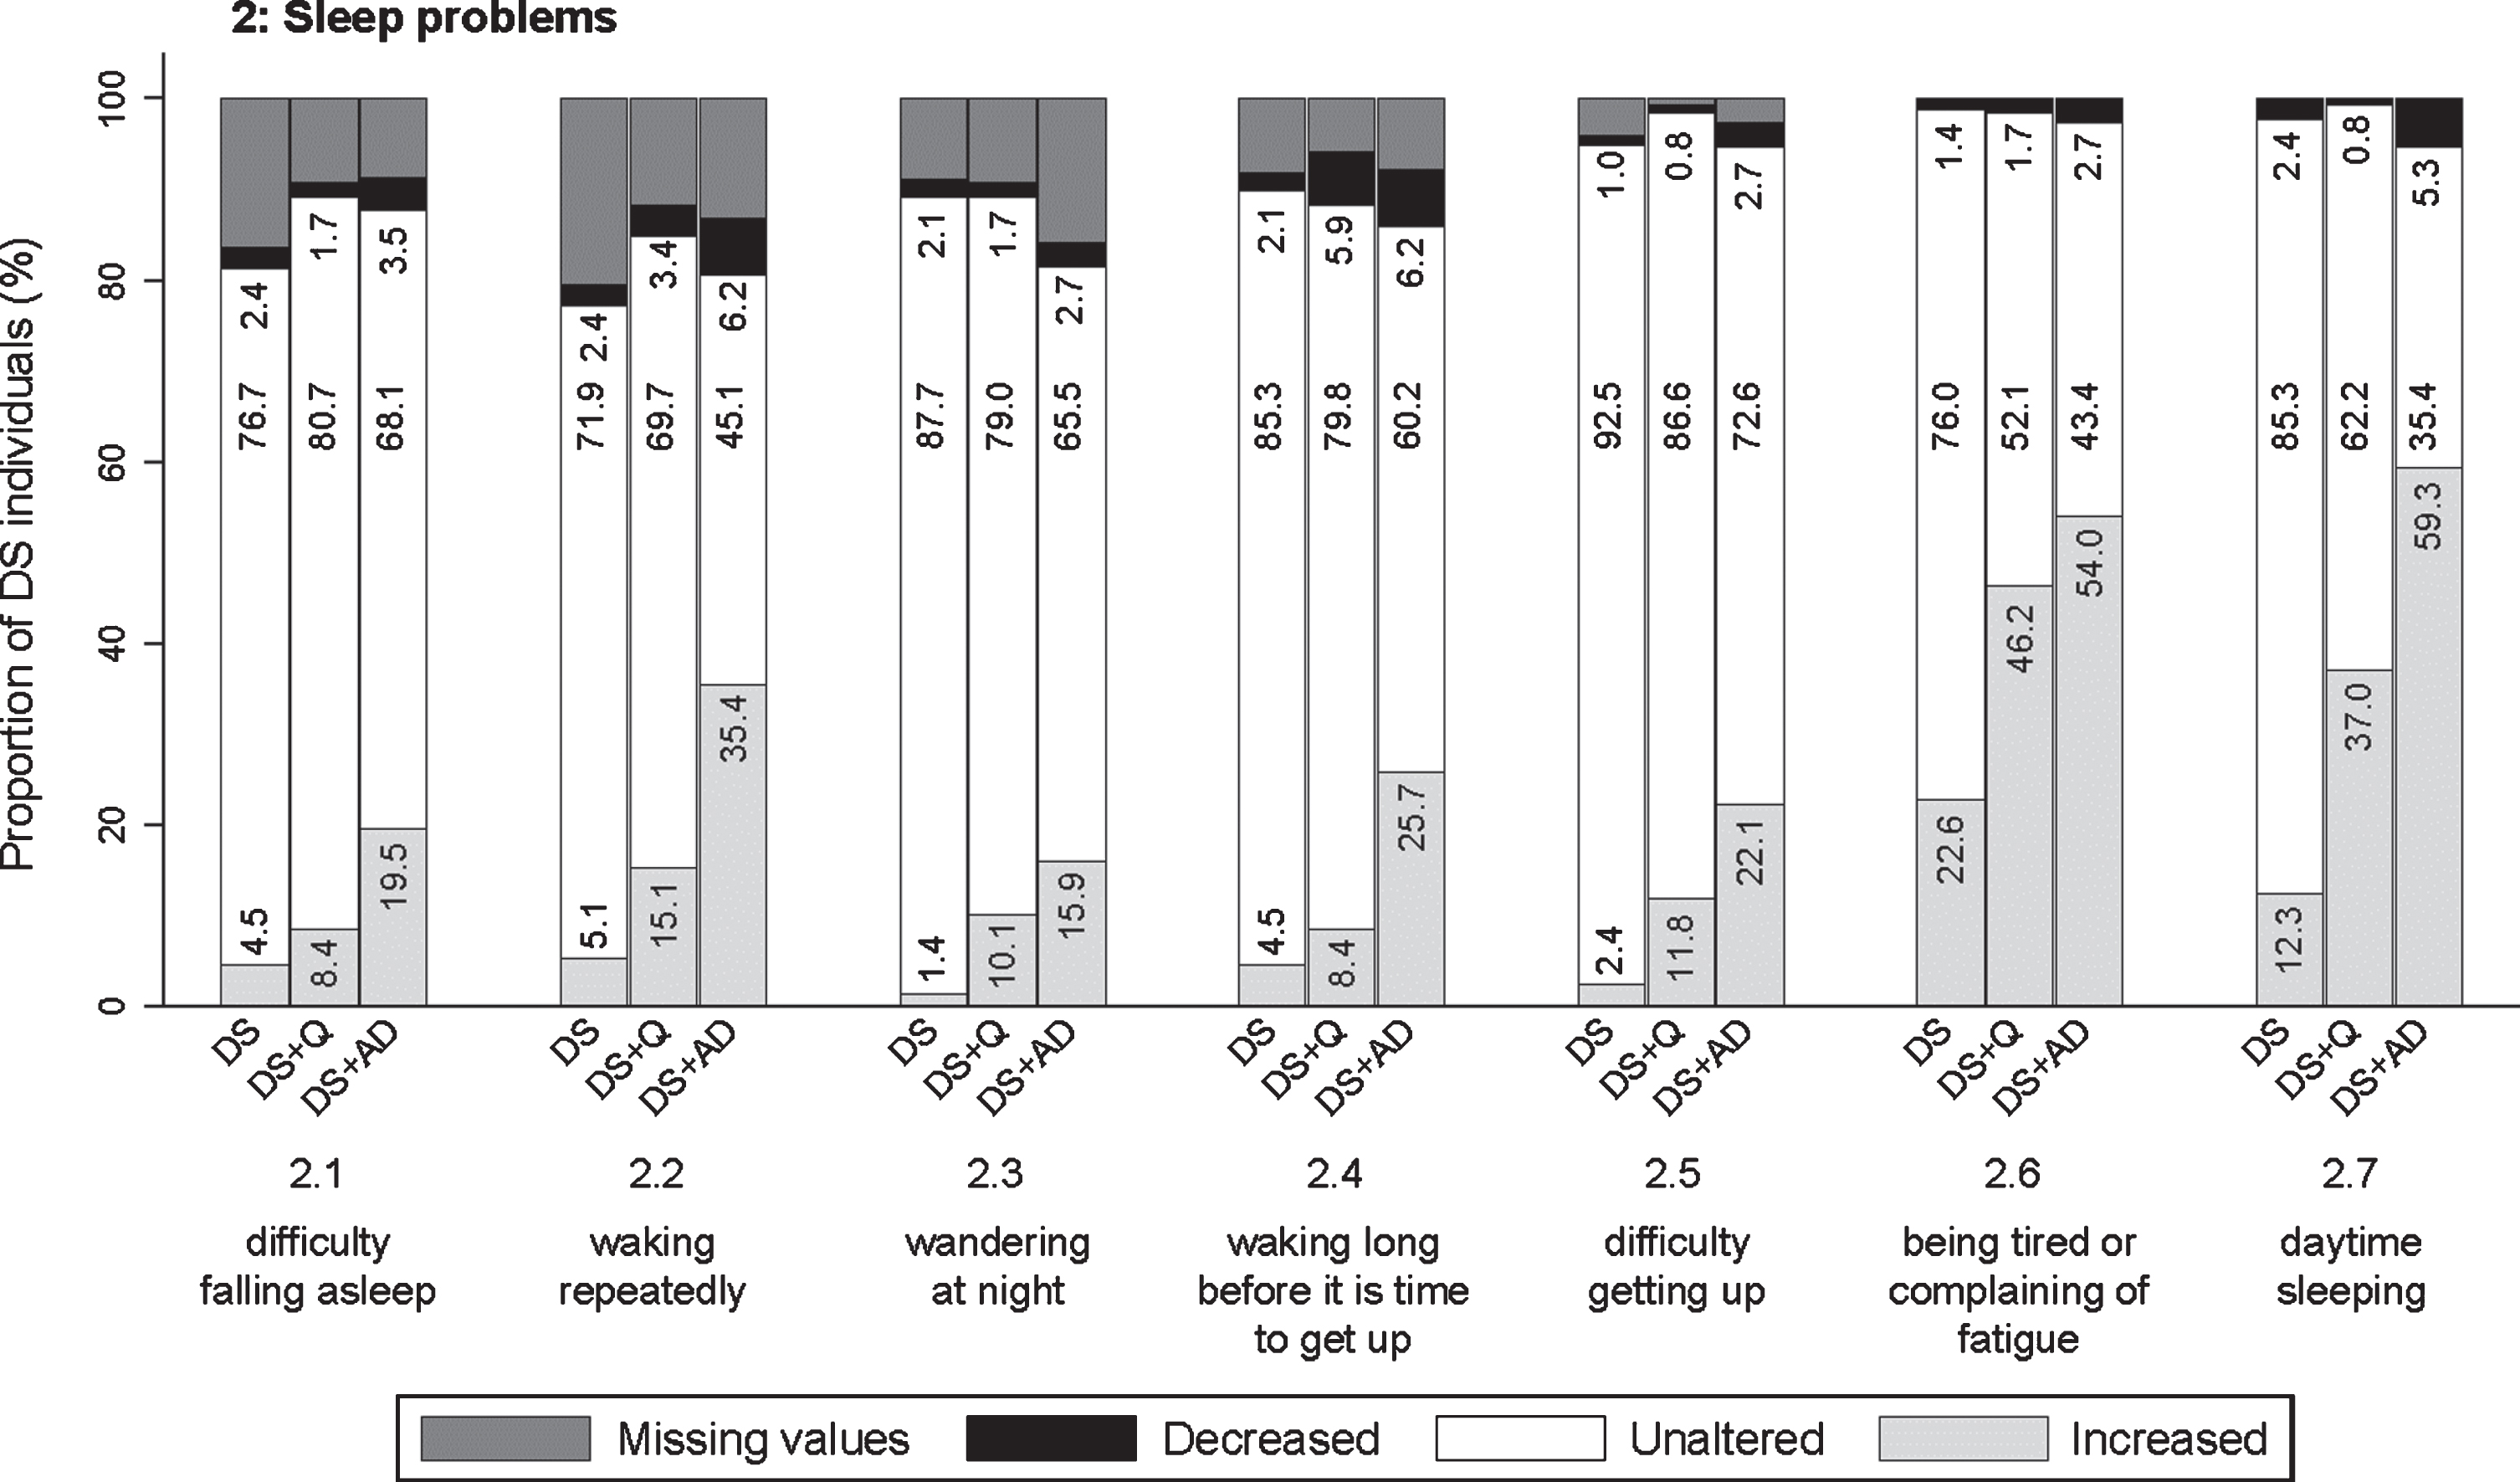
Fig. 4
Significant frequency changes for items in section 2 (sleep problems). Underlying frequency change scores are depicted in a simplified way: the proportion of individuals (%) per group showing any decreased, unaltered or any increased frequency comparing the last sixth months to the typical/characteristic behavior in the past. Proportions of individuals (%) with missing values is depicted in dark grey, but not in numbers. Item descriptions and p-values (Kruskal-Wallis) are provided in the text. DS, Down syndrome without dementia; DS + Q, Down syndrome with questionable dementia; DS + AD, Down syndrome with diagnosed AD dementia.
Section 1: Anxious behavior
The first section addressed worrying about upcoming activities/events (item 1.1; pfq < 0.001, psv < 0.001), going to the toilet unusually often or for an unusually long time with any (apparent) physical reason (1.2; pfq < 0.001, psv < 0.001), being tense (1.3; pfq < 0.001, psv < 0.001), avoiding situations/ places that makes the person nervous (1.4; pfq < 0.001, psv < 0.001), being scared to be left alone (1.5; pfq < 0.001, psv < 0.001), and being easily panicked (1.6; pfq < 0.001, psv < 0.001). Figure 3 visualizes that increased anxiety was prominent for people with DS + AD, but also for DS + Q. For items 1.1–1.4, the difference between DS + Q and DS + AD was rather small, suggesting that increased anxiety may already occur in an early stage of dementia.
Section 2: Sleep problems
This section evaluated finding it hard to fall asleep (2.1; pfq = 0.001, psv = 0.001), waking repeatedly during the night (2.2; pfq < 0.001, psv < 0.001), wandering around at night (2.3; pfq < 0.001, psv < 0.001), waking long before it is time to get up/ the alarm goes (2.4; pfq < 0.001, psv < 0.001), finding it hard to get up in the morning (2.5; pfq < 0.001, psv = 0.002), being tired or complaining of fatigue (2.6; pfq < 0.001, psv < 0.001), and sleeping in the daytime (2.7; pfq < 0.001, psv < 0.001). Figure 4 demonstrates that the proportion of individuals showing an increase in sleep problems was consistently highest in DS + AD, intermediate in DS + Q, and lowest in DS. Specifically, for items 2.6 and 2.7, the proportion of individuals showing an increased frequency was already substantial in more than one third of individuals with DS + Q.
Section 3: Irritable behavior
Three items evaluated were: being irritable, touchy (3.1; pfq < 0.001, psv < 0.001), being impatient (3.2; pfq < 0.001, psv < 0.001), and being short-spoken, responding grumpily (3.3; pfq < 0.001, psv < 0.001). In general, the proportion of individuals showing an increase was highest in both DS + Q and DS + AD, and lowest in DS (Fig. 5). The difference between DS + Q and DS + AD was rather small, suggesting that increased irritable behavior may already occur in an early stage of dementia.
Fig. 5
Significant frequency changes for items in section 3 (irritable behavior), section 4 (obstinate behavior), section 5 (restless & stereotypic behavior), and section 6 (aggressive behavior). Underlying frequency change scores are depicted in a simplified way: the proportion of individuals (%) per group showing any decreased, unaltered or any increased frequency comparing the last sixth months to the typical/characteristic behavior in the past. Item descriptions and p-values (Kruskal-Wallis) are provided in the text. Proportions of individuals (%) with missing values is depicted in dark grey, but not in numbers. DS, Down syndrome without dementia; DS + Q, Down syndrome with questionable dementia; DS + AD, Down syndrome with diagnosed AD dementia.
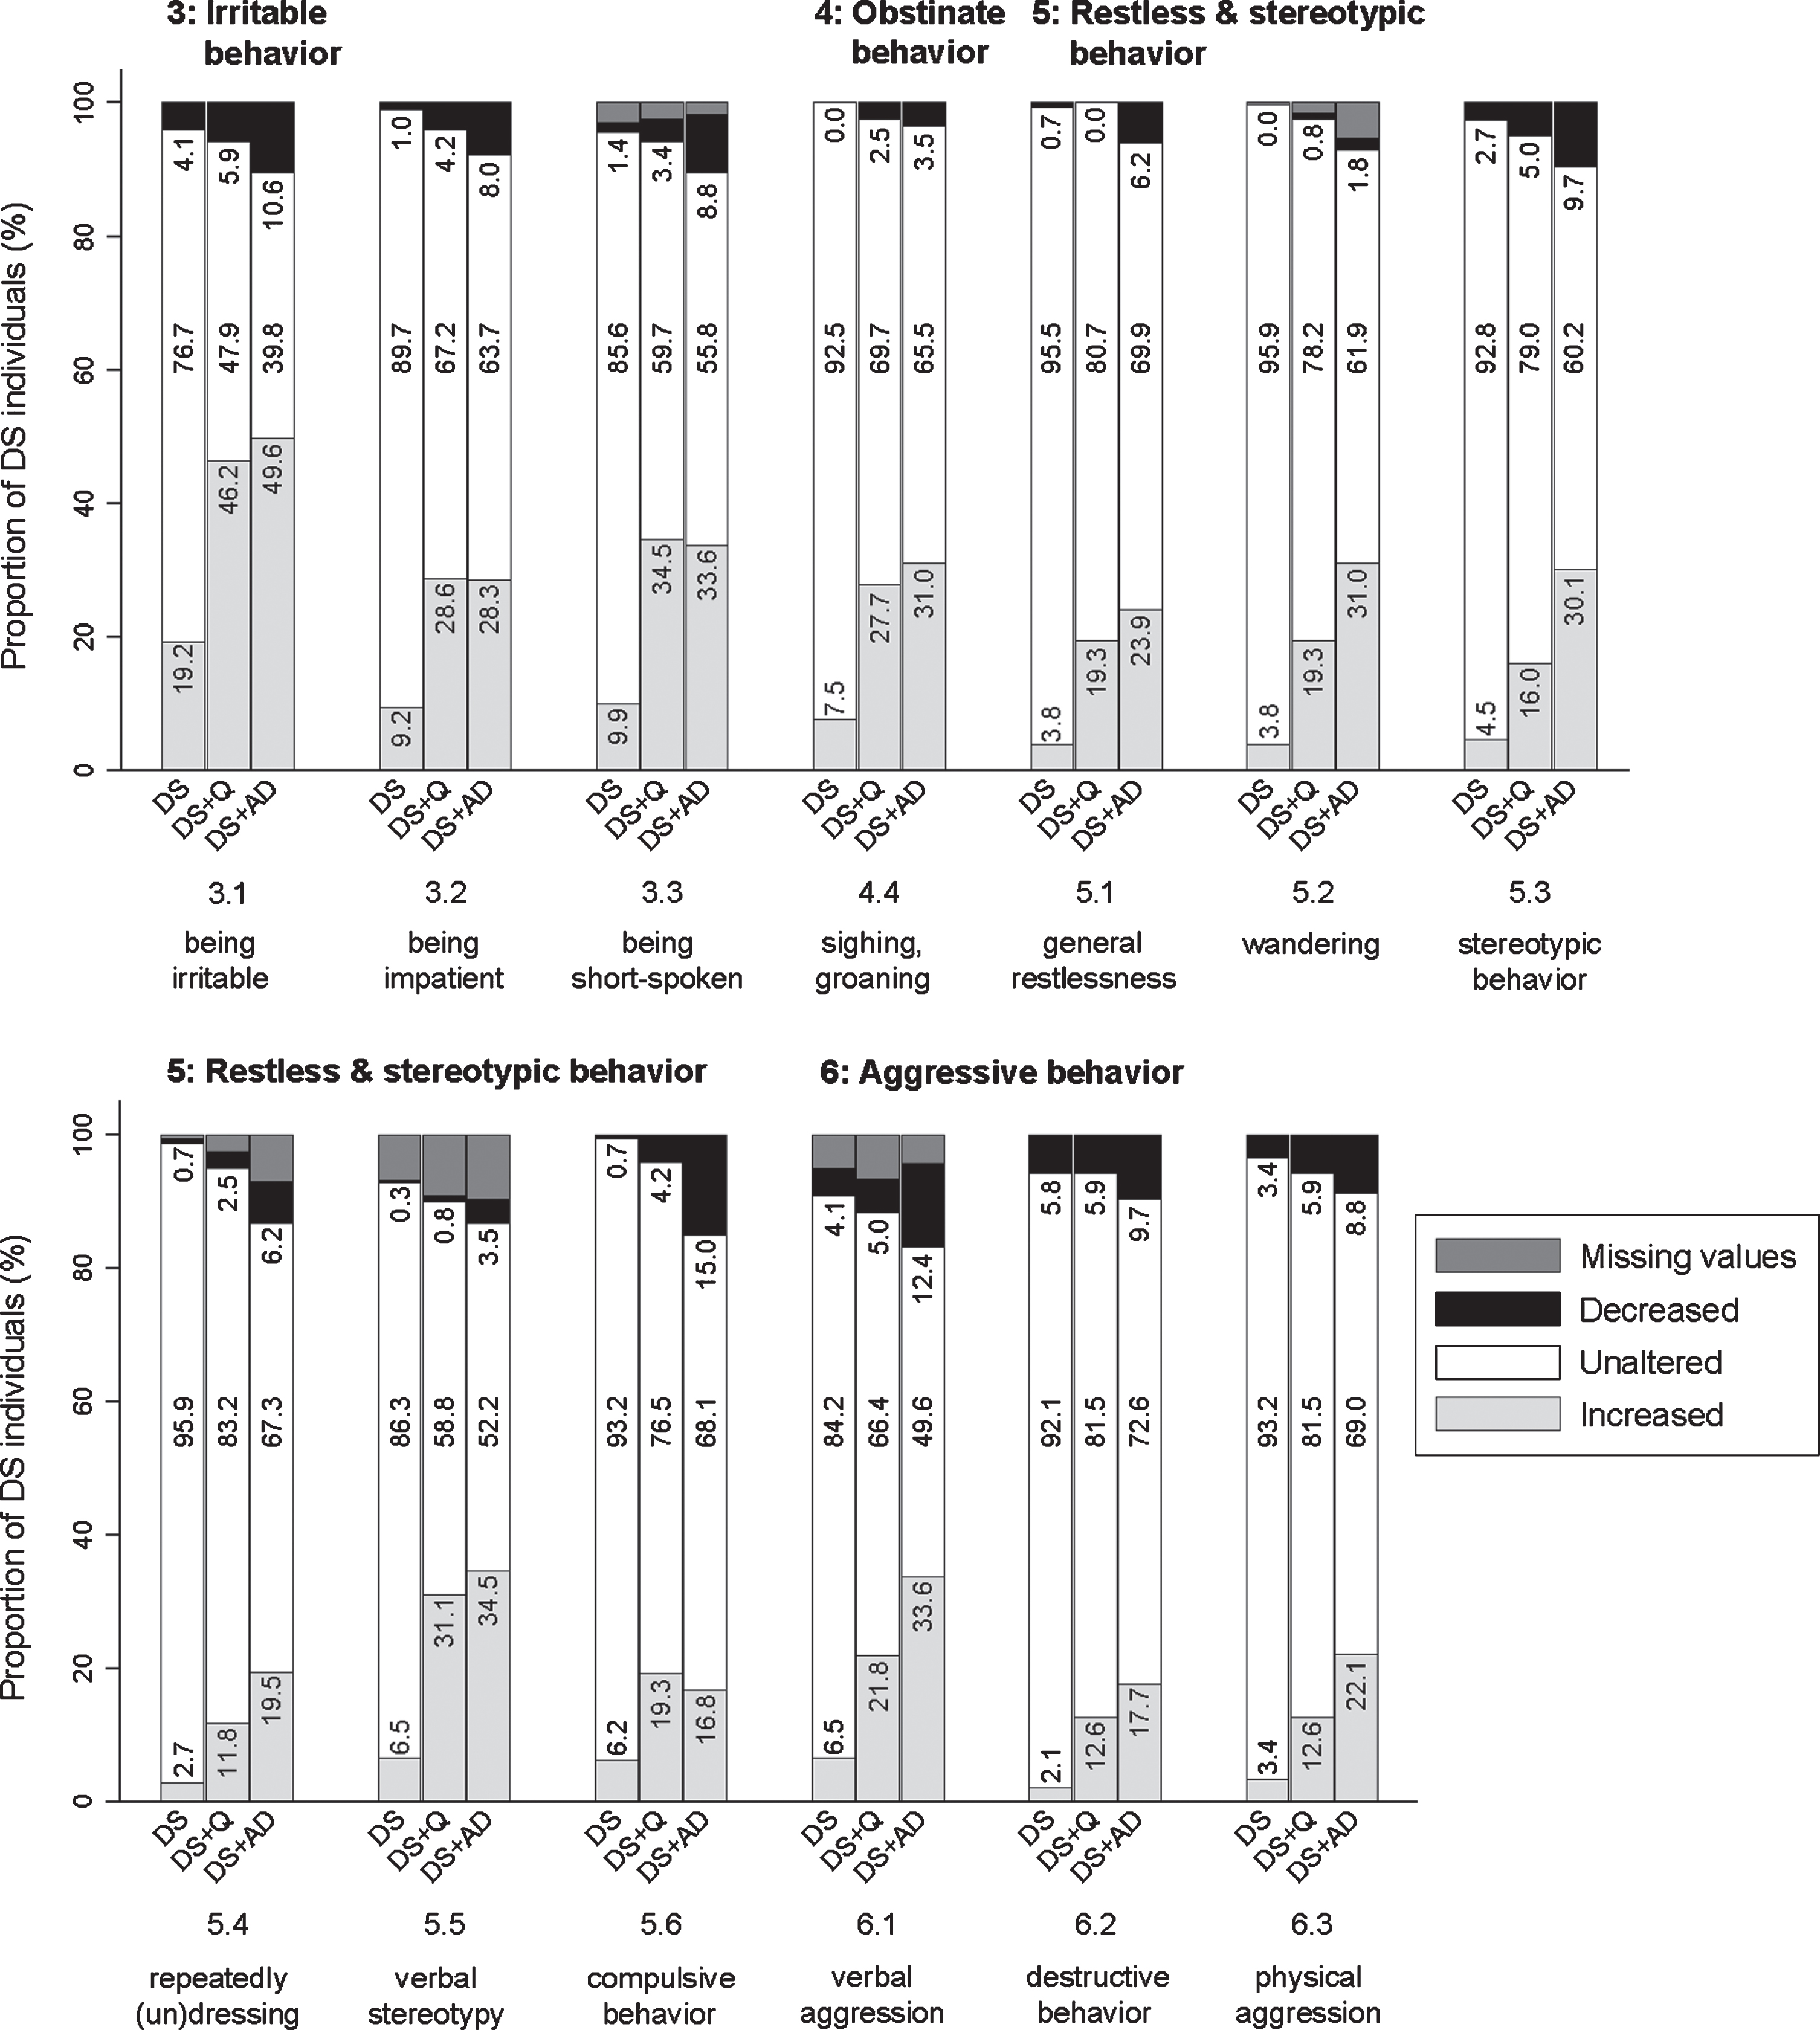
Section 4: Obstinate behavior
Being self-willed (4.1; pfq = 0.436, psv = 0.362), being argumentative, uncooperative, or obstructive (4.2; pfq = 0.089, psv = 0.007), not willing to accept necessary help (4.3; pfq = 0.420, psv = 0.415), and sighing/groaning (4.4; pfq < 0.001, psv < 0.001) were evaluated in this section. Only the latter item differed significantly between groups, with the proportion of individuals showing an increased frequency being lowest in the DS group and higher in DS + Q and DS + AD groups (Fig. 5). Though not significant, items 4.1–4.3 showed an interesting bidirectional change: for a substantial proportion of individuals a decreased frequency was reported, while for another substantial proportion an increased frequency was reported. Among the DS + AD group, item 4.1 (14.2% decreased frequency; 15.9% increased frequency), 4.2 (13.3%; 24.8%), and 4.3 (15.0%; 23.9%) was found.
Section 5: Restless & stereotypic behavior
This section included items on general restlessness (5.1; pfq < 0.001, psv < 0.001), wandering (5.2; pfq < 0.001, psv < 0.001), stereotypic behavior (5.3; pfq < 0.001, psv < 0.001), repeatedly dressing and undressing (more than necessary) (5.4; pfq = 0.001, psv < 0.001), verbal stereotypy (5.5; pfq < 0.001, psv < 0.001), and compulsive behavior (5.6; pfq = 0.018, psv = 0.005). Between groups, the same pattern was observed for all items, with the proportion of individuals showing an increase being consistently highest in DS + AD and lowest in DS (Fig. 5).
Section 6: Aggressive behavior
Verbally aggressive behavior (6.1; pfq < 0.001, psv < 0.001), destructive behavior (6.2; pfq = 0.004, psv = 0.014), and physically aggressive behavior towards others (6.3; pfq = 0.003, psv = 0.020) were evaluated. Figure 5 demonstrates that an increased frequency of verbal aggression was more pronounced in DS + AD than in DS. Destructive and physically aggressive behavior showed a rather similar pattern, though less pronounced.
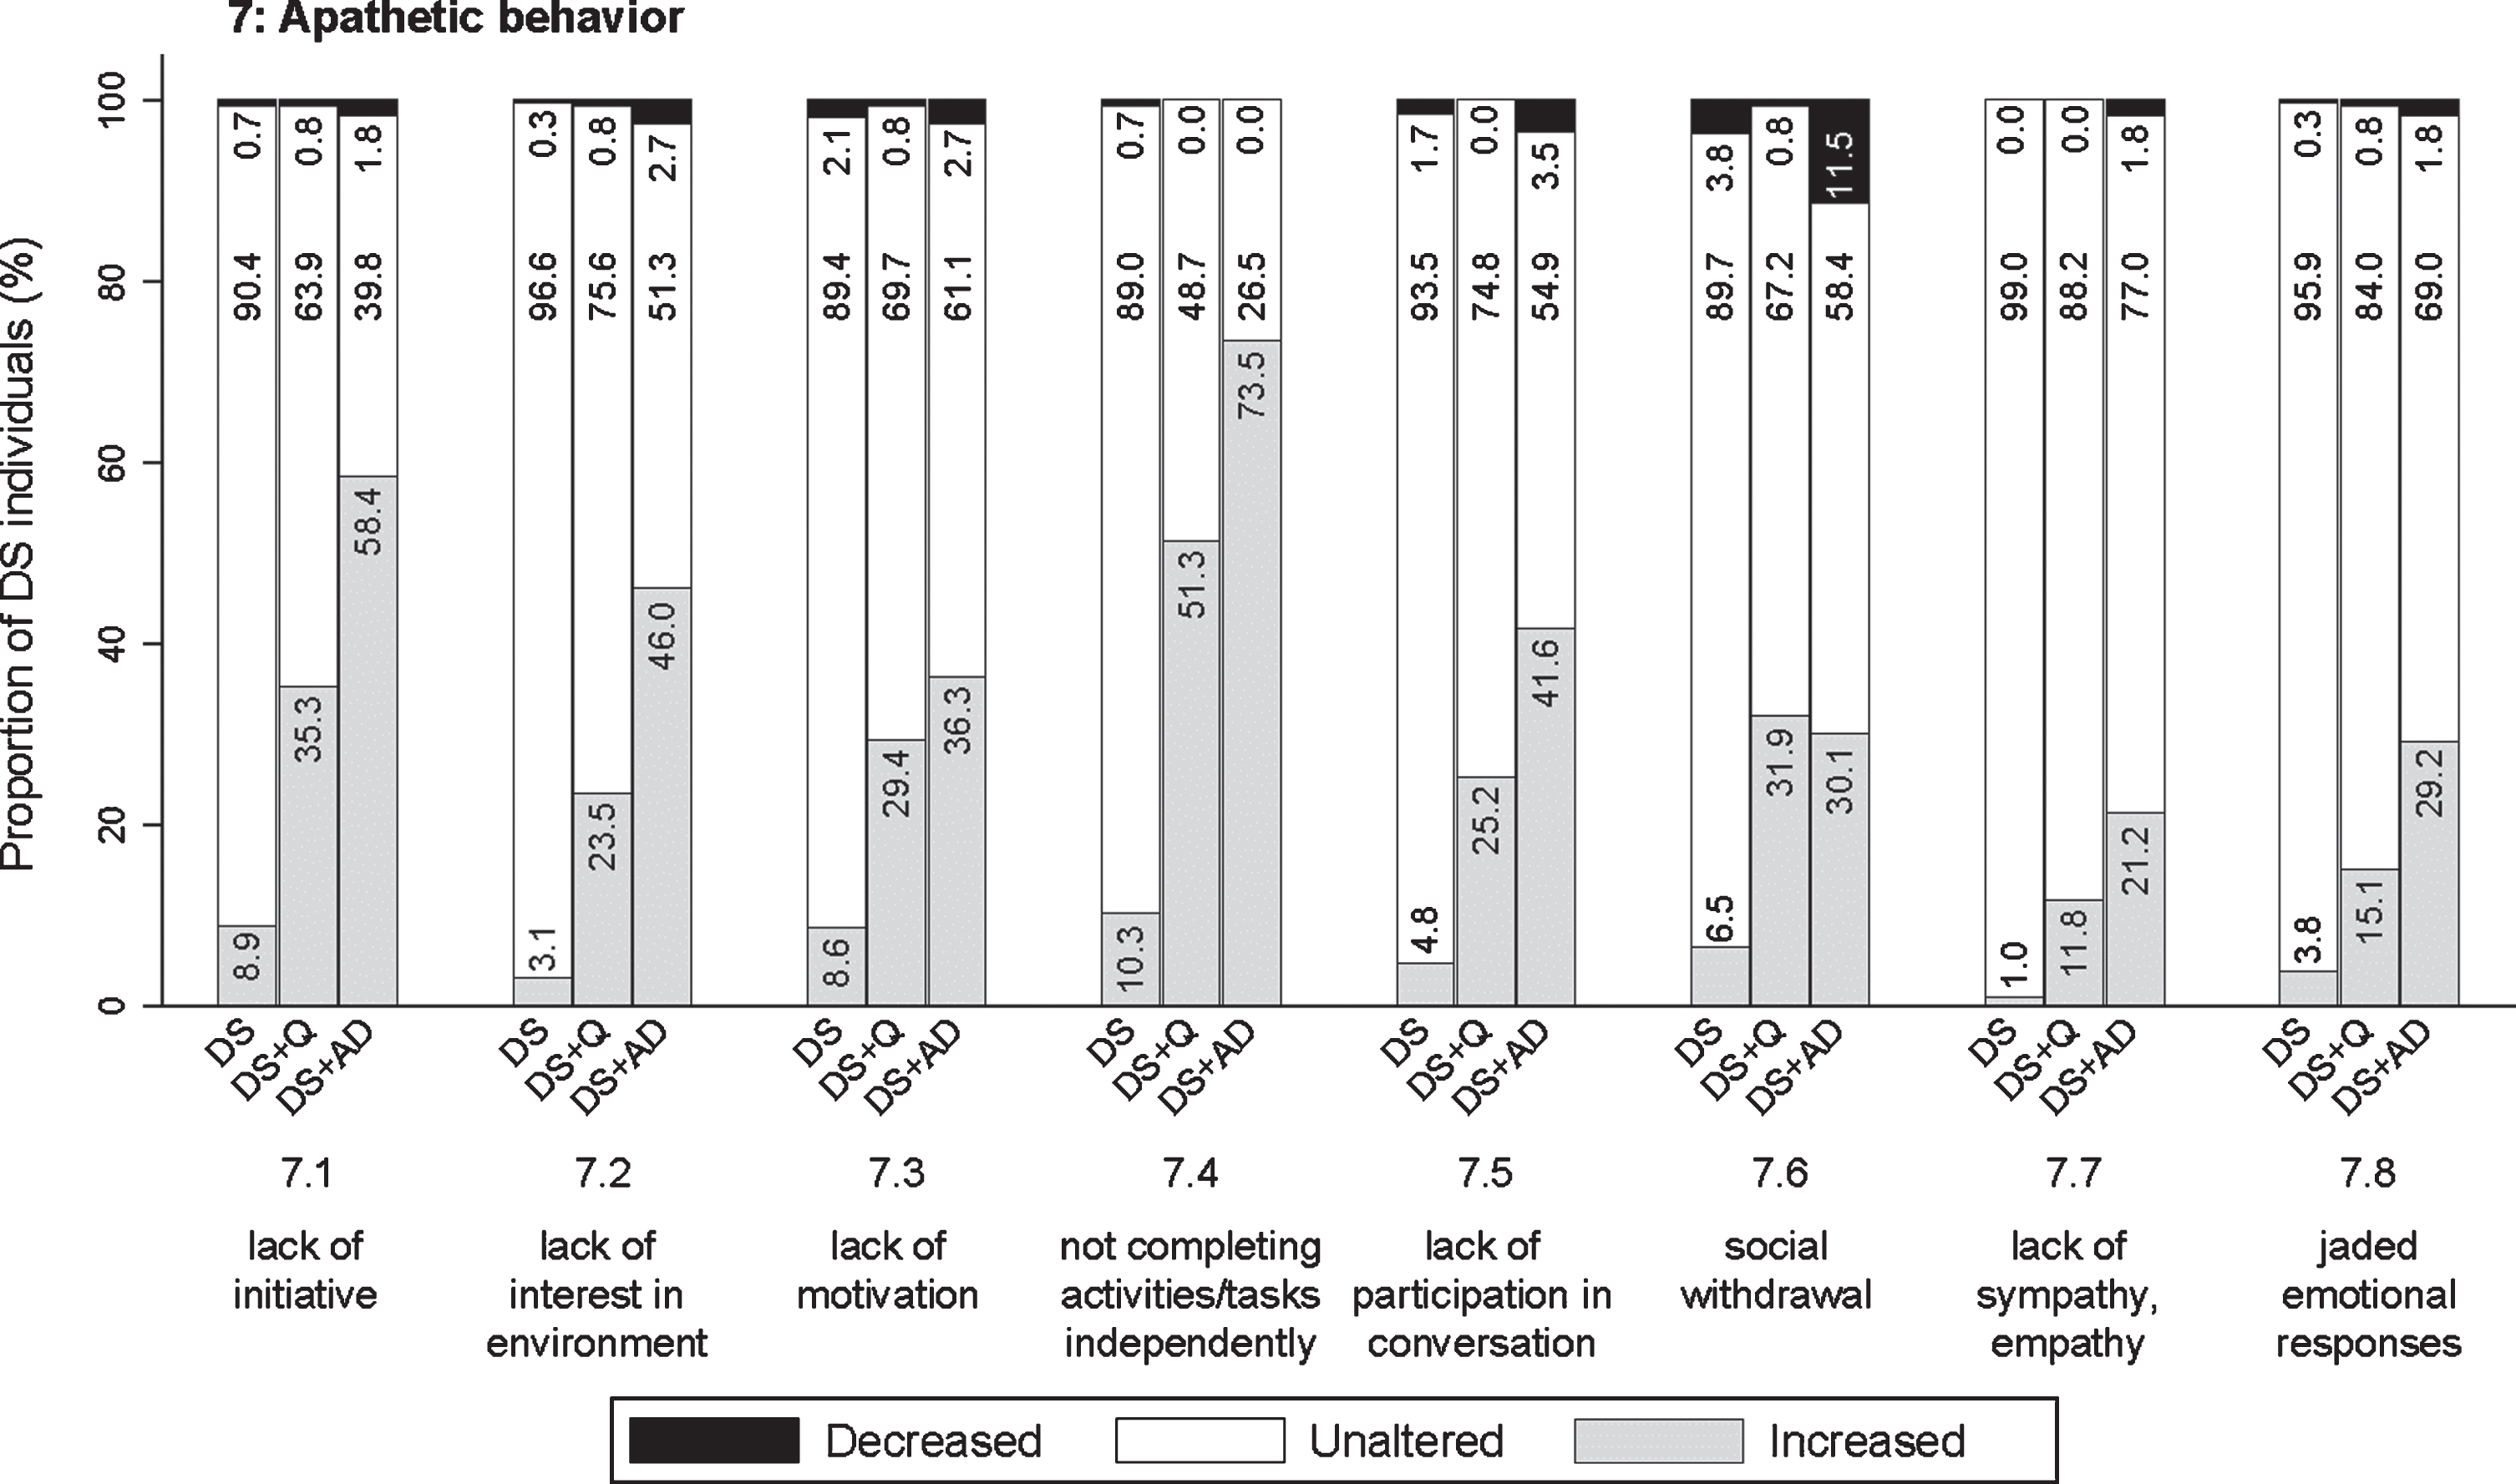
Section 7: Apathetic behavior
Different possible symptoms of apathetic behavior were assessed: lack of initiative (7.1; pfq < 0.001, psv < 0.001), lack of interest in the direct living environment (7.2; pfq < 0.001, psv < 0.001), hard to motivate to get involved in familiar activities/tasks, appearing lazy (7.3; pfq < 0.001, psv < 0.001), not independently completing activities/tasks, needs encouragement or help (7.4; pfq < 0.001, psv < 0.001), not participating much in conversation (7.5; pfq < 0.001, psv < 0.001), social withdrawal (7.6; pfq < 0.001, psv < 0.001), lack of sympathy or empathy (7.7; pfq < 0.001, psv = 0.109), and jaded emotional responses (7.8; pfq < 0.001, psv = 0.002). Among all sections, apathetic behavior was increased most evidently in relation to the status of dementia, with proportions of individuals showing an increase up to 73.5 % (item 7.4). The proportion of individuals showing an increase was consistently highest in DS + AD, intermediate in DS + Q, and lowest in DS for all items (Fig. 6), with the exception of item 7.6 in which DS + Q and DS + AD were relatively similar. A substantial proportion of individuals with DS + Q already demonstrated an increase frequency of most apathetic items, thus suggesting that increased apathetic symptoms may already present in an early phase of dementia.
Fig. 6
Significant frequency changes for items in section 7 (apathetic behavior). Underlying frequency change scores are depicted in a simplified way: the proportion of individuals (%) per group showing any decreased, unaltered or any increased frequency comparing the last sixth months to the typical/characteristic behavior in the past. Item descriptions and p-values (Kruskal-Wallis) are provided in the text. DS, Down syndrome without dementia; DS + Q, Down syndrome with questionable dementia; DS + AD, Down syndrome with diagnosed AD dementia.
Section 8: Depressive behavior
Although many symptoms overlap, apathy and depression are regarded as two distinct neuropsychiatric conditions [29]. Items in this section emphasized depressive over apathetic characteristics, including rapid mood swings (8.1; pfq < 0.001, psv < 0.001), being sad and/or weeping a lot (8.2; pfq < 0.001, psv < 0.001), being very downhearted and appearing to be in low spirits (8.3; pfq < 0.001, psv < 0.001), having physical complaints without any apparent illness or injury (8.4; pfq = 0.001, psv = 0.007), and moving and responding slowly (general slowness) (8.5; pfq < 0.001, psv < 0.001). For items 8.1, 8.2, and 8.5 the proportion of individuals showing an increase was evidently highest in DS + AD, intermediate in DS + Q, and lowest in DS (Fig. 7). For items 8.3 and 8.4, the proportion of individuals in DS + Q and DS + AD was rather similar as compared to DS. The proportion of individuals in the DS + Q group showing an increased frequency was already substantial for items 8.2 and 8.5, suggesting that these symptoms may present early in the course of the disease.
Fig. 7
Significant frequency changes for items in section 8 (depressive behavior) and section 9 (psychotic behavior). Underlying frequency change scores are depicted in a simplified way: the proportion of individuals (%) per group showing any decreased, unaltered, or any increased frequency comparing the last sixth months to the typical/characteristic behavior in the past. Item descriptions and p-values (Kruskal-Wallis) are provided in the text. DS, Down syndrome without dementia; DS + Q, Down syndrome with questionable dementia; DS + AD, Down syndrome with diagnosed AD dementia.
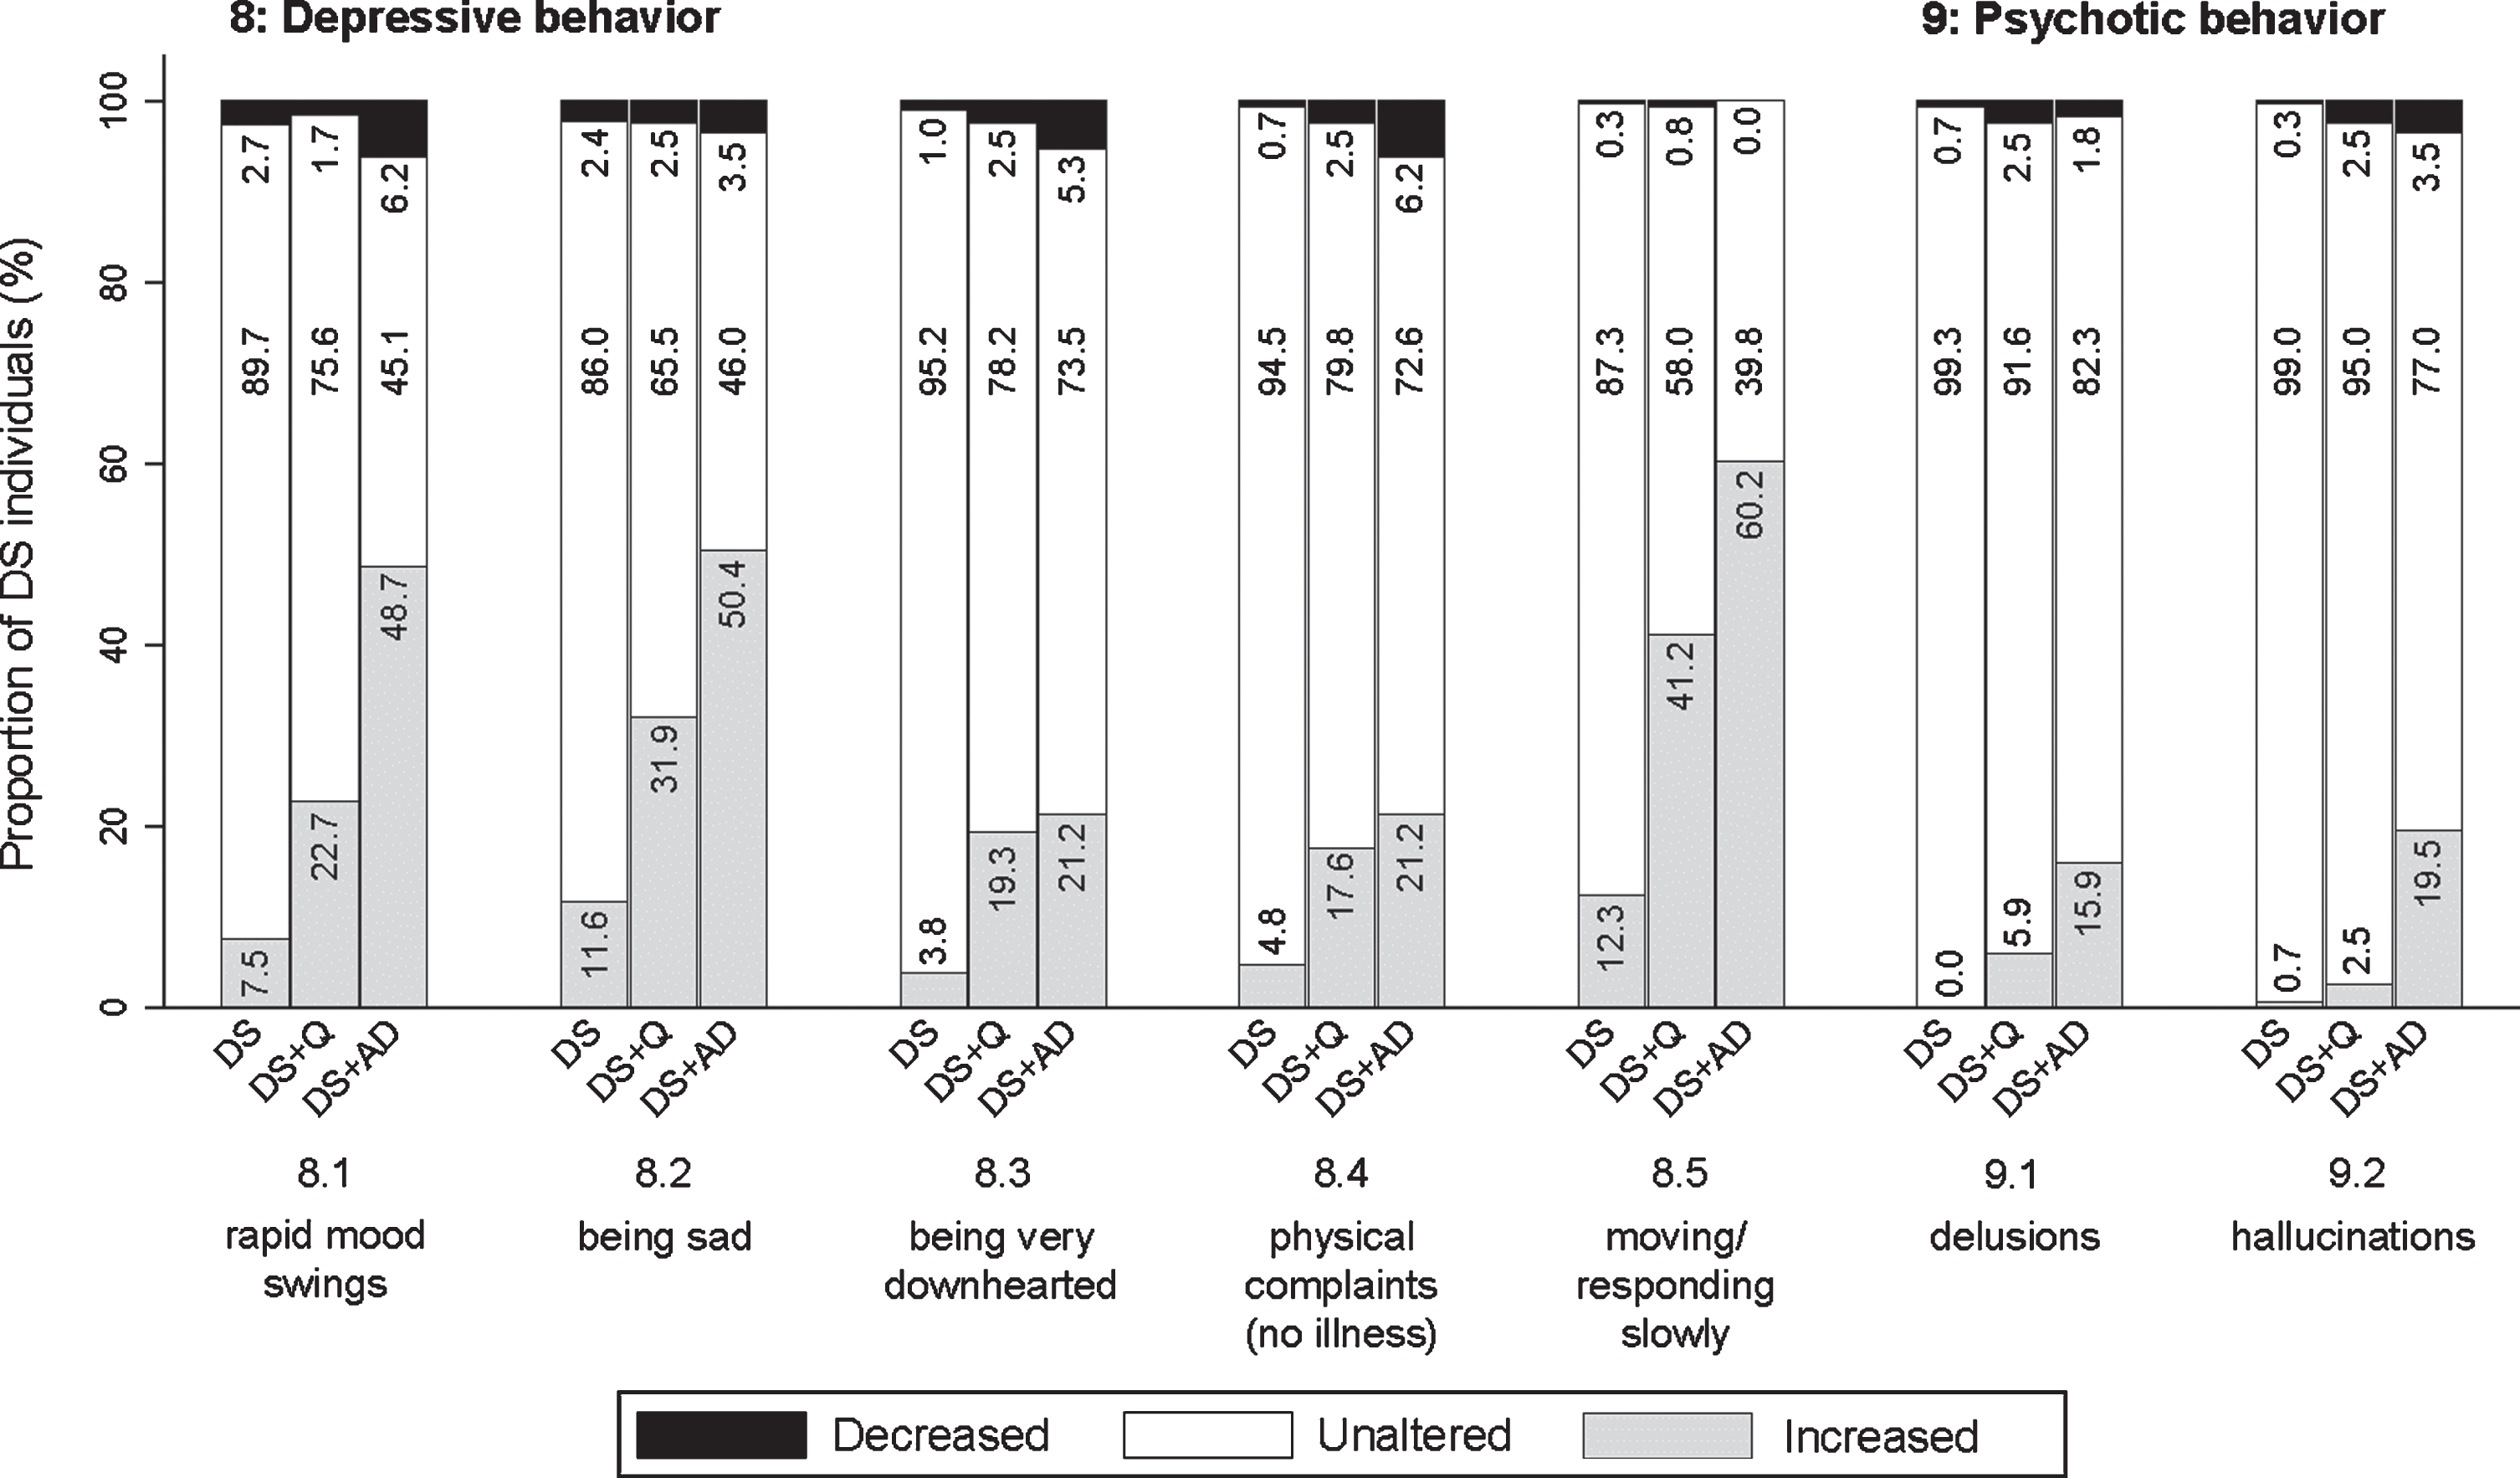
Section 9: Psychotic behavior
This section concerned incorrect beliefs/thoughts (delusions) (9.1; pfq < 0.001, psv < 0.001) and abnormal sensory experiences not experienced by others (hallucinations) (9.2; pfq < 0.001, psv < 0.001). Psychotic symptoms were reported substantially less commonly as compared to other sections. Figure 7 shows that the frequency of psychotic behavior increased in a larger proportion of individuals with dementia compared to those without dementia.
Section 10: Disinhibited behavior
Items addressed behaving impulsively (10.1; pfq = 0.001, psv = 0.111), making inappropriate comments or jokes (10.2; pfq = 0.526, psv = 0.071), and behaving in impolite or indecent ways (loss of decorum) (10.3; pfq < 0.001, psv = 0.302). The proportion of individuals demonstrating an increased frequency of disinhibited behavior was highest in DS + AD and lowest in DS (Fig. 8).
Fig. 8
Significant frequency changes for items in section 10 (disinhibited behavior) and section 11 (eating & drinking behavior). Underlying frequency change scores are depicted in a simplified way: the proportion of individuals (%) per group showing any decreased, unaltered or any increased frequency comparing the last sixth months to the typical/characteristic behavior in the past. Item descriptions and p-values (Kruskal-Wallis) are provided in the text. DS, Down syndrome without dementia; DS + Q, Down syndrome with questionable dementia; DS + AD, Down syndrome with diagnosed AD dementia.
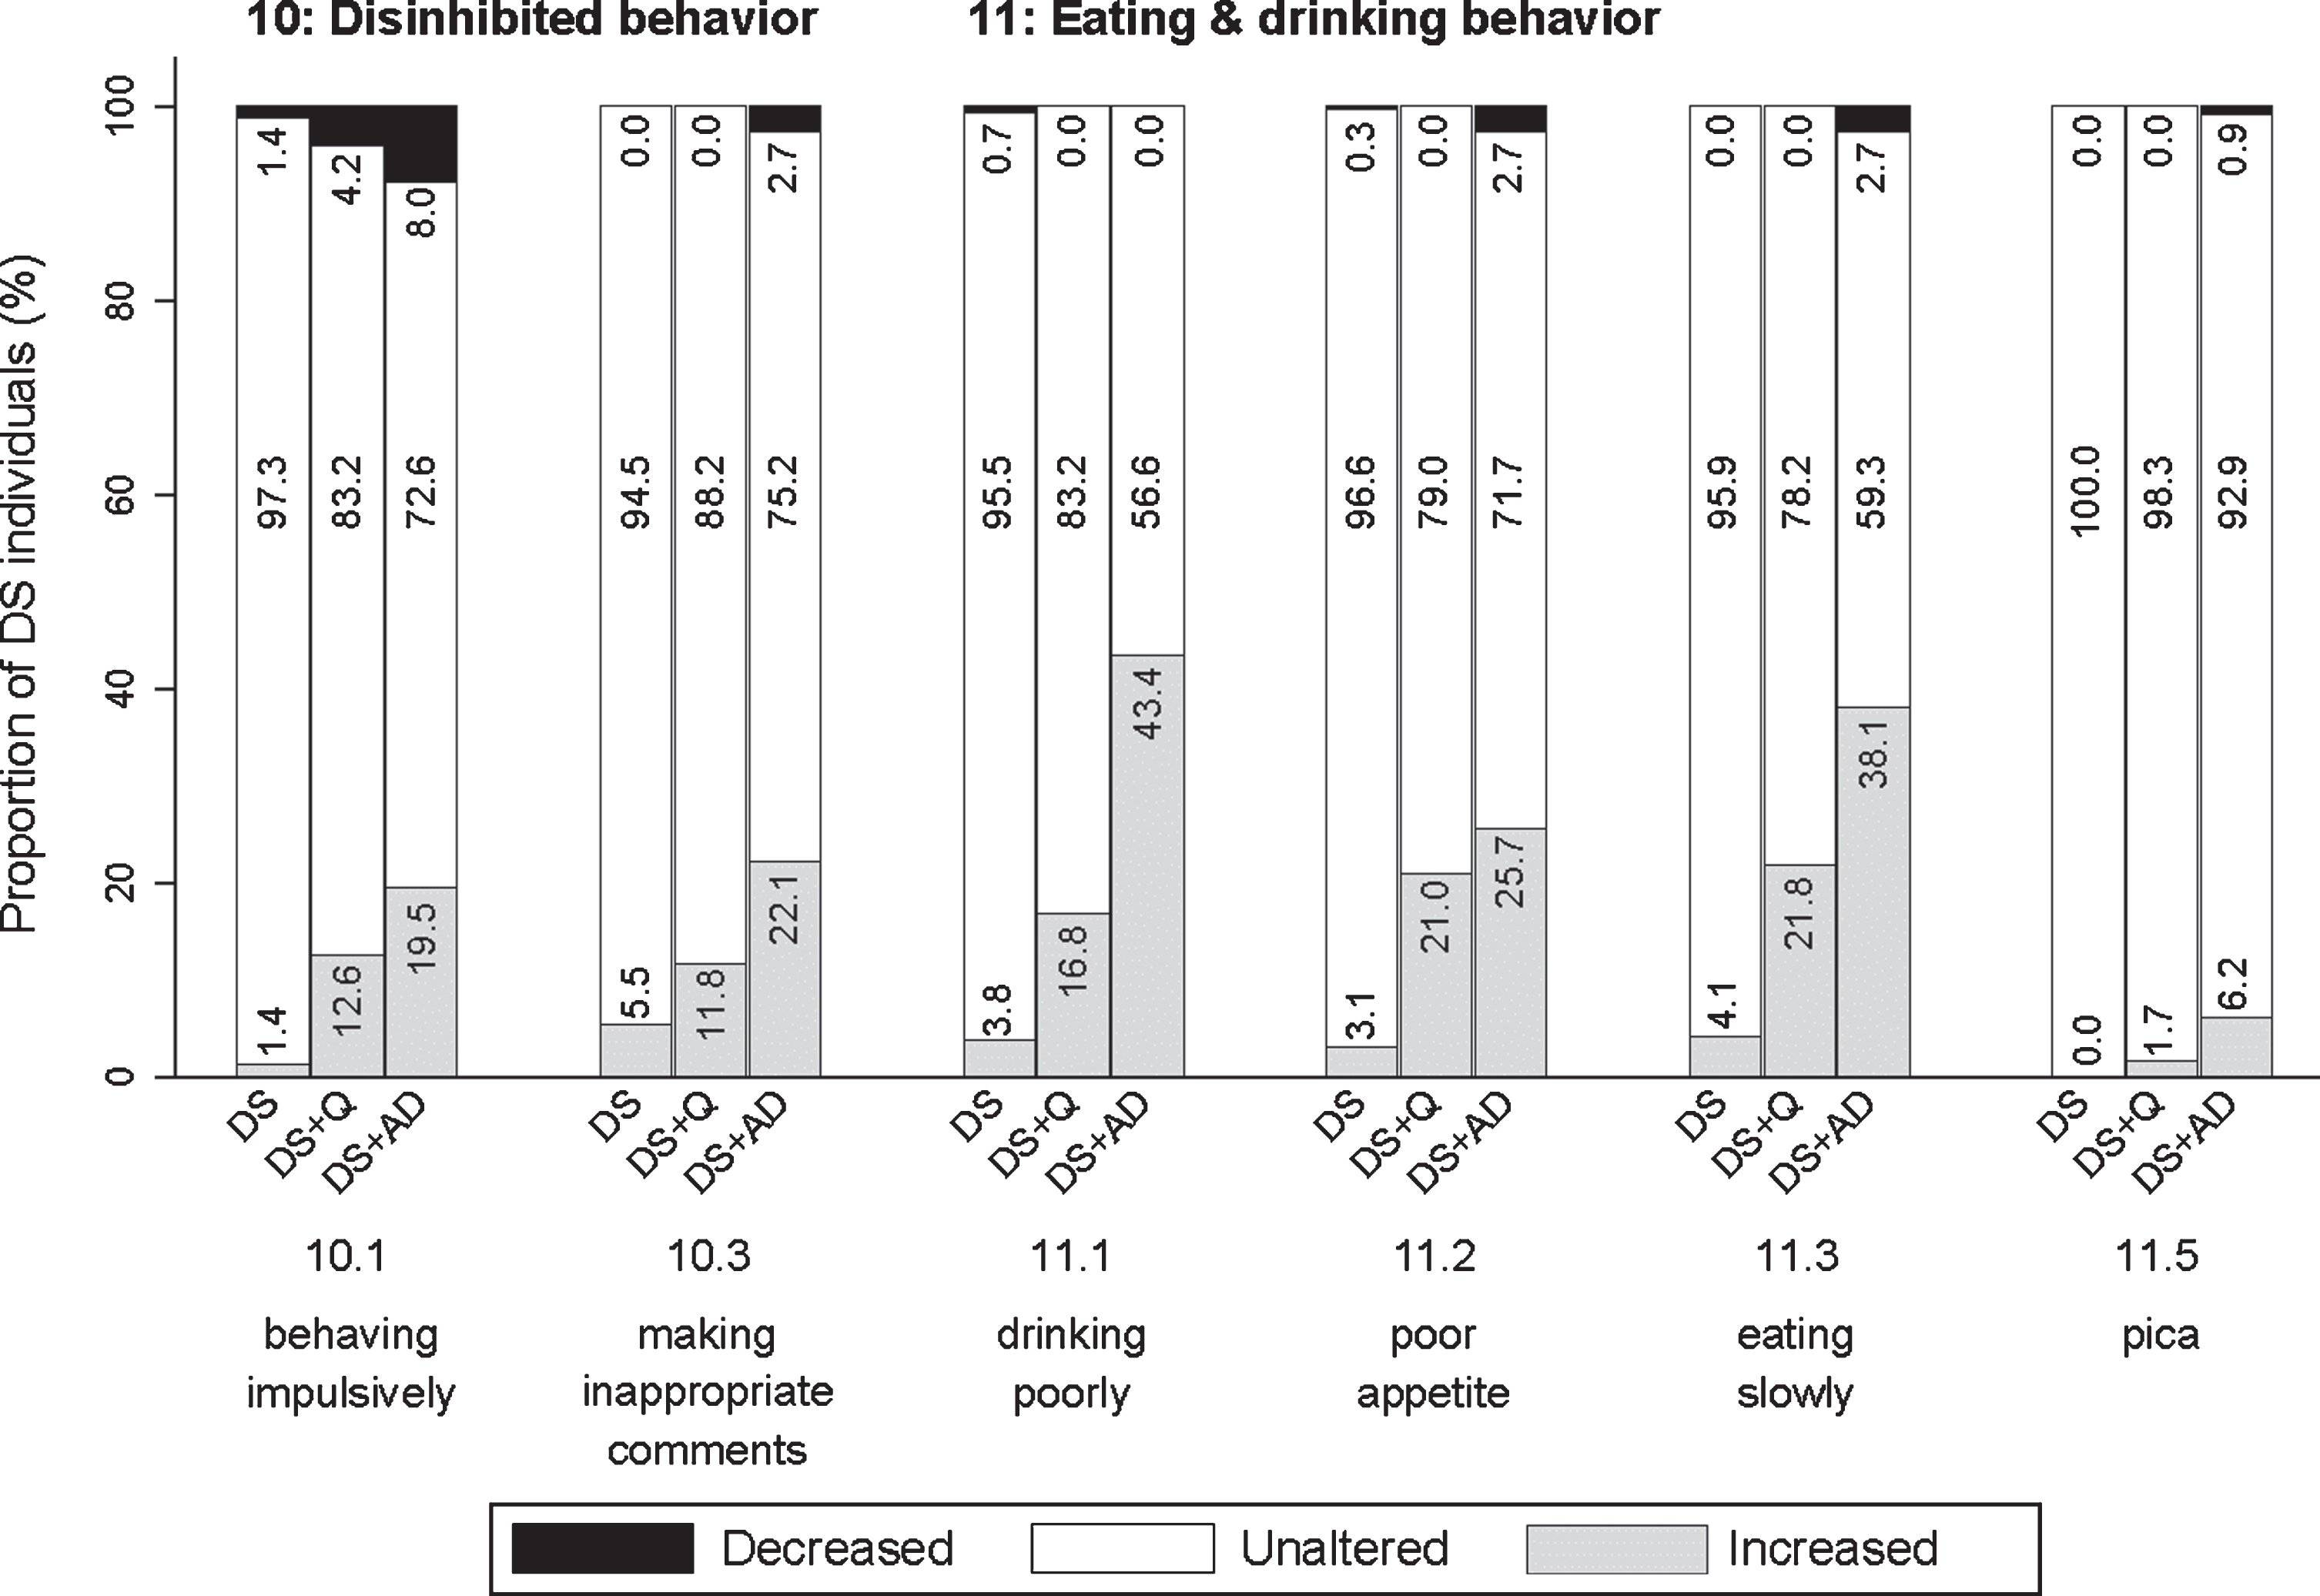
Section 11: Eating & drinking behavior
This last section addressed drinking poorly, having to be encouraged to drink (11.1; pfq < 0.001, psv < 0.001), poor appetite, having to be encouraged to eat (11.2; pfq < 0.001, psv < 0.001), eating slowly (11.3; pfq < 0.001, psv < 0.001), being picky about food and drink (11.4; pfq = 0.078, psv = 0.116), and putting substances/objects in the mouth that are not intended for consumption (pica) (11.5; pfq = 0.002, psv = 0.162). For items 11.1–11.3, the proportion of individuals showing an increase was highest in DS + AD and lowest in DS (Fig. 8).
Items with unaltered frequency change and severity change scores (change = 0) for≥85% of DS + Q and DS + AD were regarded irrelevant. Only 11.5 (pica) fulfilled this criterion: frequency change was unaltered for 98.3% of DS + Q and 98.1% for DS + AD, and severity change was unaltered for 100% of DS + Q and 99.1% of DS + AD. None of the other items were found to be irrelevant as substantial changes were observed between groups.
Discriminative ability: Total scale scores
Kruskal-Wallis tests were used to compare sum scores for the total scale between the three groups. Total scale frequency change scores differed significantly between groups (p < 0.001): DS (median = 0; 25% = –11; 75% = 4), DS + Q (median = 15; 25% = 3; 75% = 29), and DS + AD (median = 23; 25% = 7; 75% = 54). In line with frequency change, also total scale severity change scores differed significantly between groups (p < 0.001): DS (median = 0; 25% = –11; 75% = 2), DS + Q (median = 5; 25% = –2; 75% = 14), and DS + AD (median = 6; 25% = –5; 75% = 22). Evidently, total scale scores were significantly higher in the group with dementia (DS + AD) as compared to those without dementia (DS).
Discriminative ability: Sensitivity, specificity, and predictive values
Although a diagnosis of dementia cannot exclusively be based on a purely behavioral assessment (without addressing cognitive and functional decline), scores on a behavioral scale may aid clinicians and ID (neuro)psychologists in the diagnostic process. Therefore, we aimed to identify cut-off scores for discrimination between groups, i.e., DS versus DS + Q/DS + AD (cut-off 1) and DS/DS + Q versus DS + AD (cut-off 2). Between groups, frequency changes were more pronounced than severity changes. Therefore, Supplementary Figure 7 shows the ROC curves for total scale frequency change scores for DS versus DS + Q/DS + AD and for DS/DS + Q versus DS + AD. Since sensitivity, specificity, positive predictive value and negative predictive value approached each other, Table 2 presents a range of cut-off scores.
Table 2
Cut-off scores with corresponding sensitivity, specificity, positive predictive value, and negative predictive value
| DS versus DS + Q/DS + AD | ||||
| Cut-off score | Sensitivity | Specificity | PPV | NPV |
| 4 | 76.7 | 72.6 | 69.0 | 79.7 |
| 5 | 75.0 | 75.7 | 71.0 | 79.2 |
| 6 | 74.6 | 78.4 | 73.3 | 79.5 |
| 7 | 73.3 | 80.1 | 74.6 | 79.1 |
| 8 | 72.0 | 82.2 | 76.3 | 78.7 |
| 9 | 69.8 | 83.2 | 76.8 | 77.6 |
| DS/DS + Q versus DS + AD | ||||
| Cut-off score | Sensitivity | Specificity | PPV | NPV |
| 11 | 69.9 | 71.8 | 40.5 | 89.7 |
| 12 | 69.9 | 74.2 | 42.7 | 90.0 |
| 13 | 69.0 | 75.4 | 43.6 | 89.9 |
| 14 | 66.4 | 76.4 | 43.6 | 89.2 |
| 15 | 65.5 | 78.4 | 45.5 | 89.2 |
| 16 | 64.6 | 79.8 | 46.8 | 89.1 |
The range of cut-off scores provided here starts with the first cut-off score reaching a specificity≥70%. DS, Down syndrome without dementia; DS + Q, Down syndrome with questionable dementia; DS + AD, Down syndrome with diagnosed AD dementia; PPV, positive predictive value; NPV, negative predictive value.
Care burden
Care burden was scored per section considering those items within each section that were answered positively (frequency ≥1). Kruskal-Wallis tests demonstrated that care burden change scores differed significantly between groups for all sections: 1) anxious behavior (p < 0.001), 2) sleeping problems (p < 0.001), 3) irritable behavior (p < 0.001), 4) obstinate behavior (p < 0.001), 5) restless & stereotypic behavior (p < 0.001), 6) aggressive behavior (p < 0.001), 7) apathetic behavior (p < 0.001), 8) depressive behavior (p < 0.001), 9) psychotic behavior (p < 0.001), 10) disinhibited behavior (p = 0.019), and 11) eating & drinking behavior (p < 0.001). Figure 9 shows a simplified representation of the results in stacked bar charts. It shows the total proportion of individuals in each group for whom informants experienced a decreased, unaltered or increased care burden. Evidently, the proportion of individuals for whom an increase in care burden was reported, was the highest in the DS + AD group, intermediate in the DS + Q group and lowest in the DS group. In most sections, an increase was already reported in a substantial number of individuals in the DS + Q group. Care burden thus increased in relation to the presence of dementia, most prominently for anxious, apathetic and depressive behavior: in these sections, care burden increased for over 65% of individuals in the DS + AD group.
Fig. 9
Care burden changes for each section. Underlying frequency change scores are depicted in a simplified way: the proportion of individuals (%) per group showing a decreased, unaltered or increased care burden comparing the last sixth months to the typical/characteristic behavior in the past. p-values (Kruskal-Wallis) are provided in the text. DS, Down syndrome without dementia; DS + Q, Down syndrome with questionable dementia; DS + AD, Down syndrome with diagnosed AD dementia.
Reliability
IRR was determined for a subset of N = 82 individuals (15.6%): DS (n = 52), DS + Q (n = 12), DS + AD (n = 18). TRR was determined for a subset of N = 50 individuals (9.5%): DS (n = 33), DS + Q (n = 9), DS + AD (n = 8). Table 3 depicts the lowest and highest IRR and TRR (range) for individual items within each section for frequency change and severity change (percent agreement). Evidently, IRR was very high with lowest percent agreement of 92.7%, demonstrating that the defined scoring system was not subject to evident interpretation differences between raters. TRR was lower than IRR, but still yields sufficiently high percent agreement (>70%) scores. Time interval between test and retest interviews did not evidently affect percent agreement. IRR and TRR results did not necessitate removal of items. IRR and TRR were also evaluated for total scale scores for frequency change and severity change. Table 3 provides IRR and TRR for perfect agreement (identical scores) and with margins. Logically, IRR and TRR were lower for the total scale scores as compared to the individual items. Similar to individual items, TRR for the total scale was lower than IRR.
Table 3
Interrater reliability and test-retest reliability
| Section | Number of items | IRR (% agreement) | TRR (% agreement) | ||
| Frequency change | Severity change | Frequency change | Severity change | ||
| 1) Anxious behavior | 6 | 93.9–97.6 | 95.1–97.6 | 76.0–92.0 | 76.0–92.0 |
| 2) Sleeping problems | 7 | 92.7–98.8 | 93.9–98.8 | 72.0–92.0 | 78.0–98.0 |
| 3) Irritable behavior | 3 | 96.3–98.8 | 96.3–98.8 | 70.0–90.0 | 82.0–88.0 |
| 4) Obstinate behavior | 4 | 97.6–98.8 | 97.6–98.8 | 76.0–86.0 | 80.0–86.0 |
| 5) Restless &stereotypic behavior | 6 | 98.8–100.0 | 98.8–100.0 | 84.0–94.0 | 84.0–96.0 |
| 6) Aggressive behavior | 3 | 97.6–100.0 | 97.6–98.8 | 80.0–84.0 | 88.0–90.0 |
| 7) Apathetic behavior | 8 | 96.3–100.0 | 95.1–100.0 | 78.0–96.0 | 80.0–98.0 |
| 8) Depressive behavior | 5 | 97.6–100.0 | 97.6–100.0 | 76.0–94.0 | 78.0–96.0 |
| 9) Psychotic behavior | 2 | 98.8–100.0 | 100.0-100.0 | 96.0–98.0 | 96.0–98.0 |
| 10) Disinhibited behavior | 3 | 100.0-100.0 | 95.1–100.0 | 90.0–96.0 | 94.0–98.0 |
| 11) Eating &drinking behavior | 5 | 98.8–100.0 | 98.8–100.0 | 88.0–98.0 | 94.0–100.0 |
| Total scale (perfect agreement) | 52 | 70.7 | 65.9 | 12.0 | 26.0 |
| Total scale (margin –1 to + 1) | 52 | 82.9 | 81.7 | 34.0 | 38.0 |
| Total scale (margin –2 to + 2) | 52 | 84.2 | 87.8 | 40.0 | 56.0 |
| Total scale (margin –3 to + 3) | 52 | 86.6 | 89.0 | 54.0 | 66.0 |
IRR and TRR for frequency change and severity change are provided as percent agreement. For each section, the range of agreement for individual items is given, i.e., the lowest and the highest percent agreement for items in each section. For each individual item, IRR, TRR, as well as internal consistency, are provided in Supplementary Table 1. For the total scale, both IRR and TRR were calculated for perfect agreement (identical scores) as well as with of plus or minus 1, 2, or 3 points. DS, Down syndrome without dementia; DS + Q, Down syndrome with questionable dementia; DS + AD, Down syndrome with diagnosed AD dementia; IRR, interrater reliability; TRR, test-retest reliability.
In addition, IRR and TRR were calculated as percent agreement for section care burden change scores: 1) anxious behavior (IRR = 95.1; TRR = 78.0), 2) sleeping problems (96.3; 86.0), 3) irritable behavior (97.6; 80.0), 4) obstinate behavior (95.1; 76.0), 5) restless & stereotypic behavior (95.1; 84.0), 6) aggressive behavior (100.0; 80.0), 7) apathetic behavior (98.8; 86.0), 8) depressive behavior (97.6; 66.0), 9) psychotic behavior (98.8; 96.0), 10) disinhibited behavior (98.8; 92.0), and 11) eating & drinking behavior (97.6; 92.0). IRR and TRR were also calculated for the total scale care burden change score for perfect agreement (IRR = 82.9; TRR = 40.0) and with margins –1 to + 1 point (93.9; 64.0), –2 to + 2 points (98.8; 86.0), and –3 to + 3 points (100; 92.0).
Internal consistency was evaluated by determining Cronbach’s alphas for frequency change and severity change of individual items against the total scale scores for frequency change and severity change, respectively. Individual items had Cronbach’s alphas above 0.839 (frequency change) and above 0.788 (severity change) (Supplementary Material Table 1). Among all items together, overall Cronbach’s alpha was 0.845 (frequency change) and 0.799 (severity change). In summary, reliability and consistency data for frequency change and severity change were good and confirm previous results [30].
Effect of age, sex, depression, and ID level
Various potential confounding factors were already addressed in advance through clinical judgement (see Methods section). In addition, effects of age, sex, depression, and ID level were evaluated. Since age is the major risk factor for dementia [38], the DS + AD group was expectedly older. A linear regression analysis in the group without dementia (DS) showed that age did neither significantly influence total scale scores for frequency change (coefficient b = 0.07, p = 0.526) and severity change (b = 0.010, p = 0.926). Next, regardless of dementia status, effects of sex, depression and ID level were studied. Comparing men (n = 278) and women (n = 246) showed that sex did not significantly affect total scale scores for frequency change (p = 0.41) and severity change (p = 0.57). Comparing groups with (n = 21) and without depression (n = 503) demonstrated that the presence of (effectively) treated depression (without evident effect on behavior according to clinical judgement) did not significantly influence total scale scores for frequency change (p = 0.114) and severity change (p = 0.128). Finally, groups with mild ID (n = 61), moderate ID (n = 334), and severe ID (n = 129) were compared. ID level significantly influenced total scale score for severity change (F(2,521) = 3.95, p = 0.020), but not for frequency change (F(2,521) = 0.81, p = 0.444).
DISCUSSION
Using the shortened and refined BPSD-DS II scale, dementia-related behavioral changes in 524 individuals with DS were evaluated in relation to their status of dementia to further study reliability and discriminative ability, such as confirmation of previous results about item relevance [30]. Comparing item change scores between groups revealed prominent changes in frequency and severity for anxious, sleep-related, irritable, restless & stereotypic, apathetic, depressive, and eating & drinking behavior. For most individual items, an overall pattern emerges in which the proportion of individuals displaying a frequency/severity increase was highest in DS + AD, intermediate in DS + Q, and lowest in DS. Interestingly, for various items within sections about anxious, sleep-related, irritable, apathetic and depressive behaviors, already more than 1/3 of the DS + Q group showed an increased frequency (and sometimes even higher than in the DS + AD group), which suggests that changes in these items might be early ‘alarm signals’ for AD in DS. These results are largely in accordance with the initial study publication [30], in which a more extensive contextualization of results with literature is found. Care burden was found highest for DS + AD and lowest for DS. As reported in the general population [8, 12], care burden evidently increased with the presence of dementia and the presence of BPSD. Finally, reliability measures were promising: IRR and TRR data show high percent agreement and internal consistency with alpha around 0.80 was found for individual items and the total scale.
Study strengths
Virtually all individuals with dementia present with one or more behavioral changes [9, 10]. Whereas these symptoms are well studied in the general population [8, 10, 39], BPSD have not been comprehensively studied in DS [29]. To that end, we developed the BPSD-DS scale exclusively focus on behavioral alterations in DS [30]. Such a modular approach corresponds to the way in which dementia is assessed in the general population using specific behavioral questionnaires like the Neuropsychiatric Inventory [27, 28] in addition to cognitive and functional assessments.
Diagnosing dementia in DS is rather complex due to the baseline level of functioning, presence of (life-long) characteristic behavior and the frequent presence of comorbidities which may contribute to dementia-like symptoms [29, 40–42]. Considering this diagnostic complexity and specific circumstances relating to individuals with DS, an important strength of this scale is its specific adaptation to the target group. To account for life-long characteristic behavior, the central aim of the scale is to identify ‘change’. The scoring system has been developed as such that the individual with DS is compared to oneself. As people with ID often find it difficult to verbally express their feelings and emotions, or may not understand the items, identification of changes is based on interviews with key informants [43].
In this study, the diagnosis of (questionable) dementia was based on existing clinical multidisciplinary assessment, the current gold standard [16]. Participants were not subjected to new dementia assessments. To minimize the effect of other potential causes of decline than dementia and to reduce the risk of erroneously attributing changes to dementia, each individual was carefully evaluated for other causes of decline/change, such as major life events or comorbidities that may present with dementia-like symptoms.
Results from the initial study [30] guided optimization of the scale. The BPSD-DS scale is not intended as purely an academic research tool but was developed together with daily practice experts. To enhance usability and reduce assessment time, the scale was shortened and digitized, also enhancing data completeness and quality. Another strength concerns the large representative study population with, among others, different baseline ID levels and living situations (e.g., different care institutions and regions/countries). To the best of our knowledge, this study is the largest behavioral study in DS so far, enhancing generalizability of results.
Study limitations
Among the 524 eligible interviews, the interviewer was previously involved in the diagnostic procedure of (questionable) dementia of 92 individuals with DS. Although one could argue that this is a strength (well aware of the diagnostic process and its thoroughness), this might also be regarded as a risk of bias. Therefore, it is important to note that the scores were provided by informants (not the interviewer). Moreover, diagnosis of dementia, and thus division into study groups, was established without considering the outcomes of the BPSD-DS II.
In retrospective interviews, recall bias and a degree of subjectivity—especially regarding (variable) behavior—may influence results. Although the selection and quality of informants was considered in advance by the interviewer, differences in informants’ personal attentiveness to signal changes could be a potential limitation. In the context of assessing dementia in individuals with ID, however, Jamieson-Craig et al. showed that ‘retrospective carer report of change in everyday function was as good as, if not better than, prospective ratings to identify dementia’ [42]. Nevertheless, certain informants may have exaggerated or trivialized behavioral alterations. That is why an interview design was chosen rather than self-completion by informants. Experienced interviewers may, in part, recognize and address this during the interview.
Another possible limitation is the fact that this study did not consider individuals with profound ID who often face other disabilities as well, such as motor or sensory disabilities. They require a specific approach to identify symptoms of dementia [44] as (many) specific skills have never been developed or care professionals have taken over. Consequently, items addressing such skills are not relevant as they cannot demonstrate decline, i.e., they cannot be indicative of dementia [16, 45]. Currently, no adapted scales are available for dementia in this subpopulation. Potentially, a future selection of BPSD-DS II items might serve useful in this population. In relation to individuals’ capacities, changes in psychotic behavior were reported less frequently as compared to other sections. This most likely relates to the fact that observing such symptoms largely relies on the (often limited) self-report abilities by the person with DS.
Lastly, we faced practical difficulties to schedule more retest interviews. Although we extended the time interval from maximum 4 weeks to 7 weeks, it was still not feasible on many occasions due to, e.g., holidays, illness, far travel distances to the interview location, illness, full agendas.
Future implications
Primary goal of this study was to optimize and further study an adapted assessment tool for BPSD in adults with DS. We have shown that the BPSD-DS II, capturing a wide range of dementia-related behavioral changes, appears to be reliable and may aid identification of those at risk to develop dementia (‘alarm signals’). The scale serves useful to systematically evaluate a person’s behavioral changes, important for person-centered care (planning) [46, 47]. Indeed, in the context of improving or maintaining quality of life, it is of essence to determine the needs of the person to adapt daily care and (behavioral) treatment. Furthermore, identifying changes would also help increasing understanding and insight into the progress of dementia among caregivers. Additionally, disease progression and effects of therapeutic interventions could possibly be assessed in daily clinical practice using the BPSD-DS II.
The BPSD-DS II provides rich, detailed information about the person’s behavioral changes over time. Depending on the status of dementia, such interviews take an hour, on average. It is conceivable that in specific settings, a more rapid screening is preferred (at the cost of less detail), similar to, e.g., a brief clinical version of the Neuropsychiatric Inventory in the general population [48]. Since severity changes in this study largely followed the same pattern as frequency changes, though less pronounced, a short version of the BPSD-DS II only including frequency changes might be considered. Moreover, results point at irrelevance of item 11.5 (pica), which could potentially be removed in a new version. Furthermore, those items that did not differ significantly between groups might be further scrutinized. Finally, consideration of further practical experiences obtained in this study may refine the scale and procedure for future use.
In addition, it would be valuable to apply the BPSD-DS II in qualitative as well as longitudinal studies. Qualitative studies may further contextualize the added value of the BPSD-DS II in daily practice. Whereas the current cross-sectional study retrospectively assessed changes, longitudinal studies would enable evaluation of intraindividual changes over time. Such a longitudinal approach is essential to address the temporal relationship between behavioral alterations and dementia staging and confirm early behavioral ‘alarm signals’ of dementia in DS.
CONCLUSION
The optimized BPSD-DS II has been studied in a large representative DS study population in relation to the status of dementia. Results are largely in accordance with previous findings and further confirm item relevance and reliability. Comparing study groups, the BPSD-DS II revealed an overall pattern in which the proportion of individuals displaying a frequency/severity increase was highest in DS + AD, intermediate in DS + Q, and lowest in DS. Interestingly, changes in various items concerning anxious, sleep-related, irritable, apathetic, and depressive behaviors might be early ‘alarm signals’ for AD in DS. Care burden increased in relation to dementia. Systematic evaluation of behavioral changes in DS using the BPSD-DS II may contribute to early identification of those at risk to develop dementia, adaption of daily care/treatment and understanding among caregivers/family members. The scale may be a useful addition to already existing cognitive questionnaires for dementia in DS.
ACKNOWLEDGMENTS
This study was financially supported by the J. Th. Guepin Stichting Onderzoek Down Syndroom and further supported by in kind contributions from the participating care institutions and European expertise centers. Founding work of this project [30] was financially supported by the Research School Behavioral and Cognitive Neurosciences (RUG/UMCG) and the Gratama Stichting/Stichting Groninger Universiteitsfonds (2015-04). In Belgium, Institute Born-Bunge/University of Antwerp was granted a subsidy from Research Foundation Flanders (G053218N). In Spain, this study was supported by Fondo de Investigaciones Sanitario, Instituto de SaludCarlos III (PI14/01126, PI17/01019 to JF) and the CIBERNED program, partly jointly funded by Fondo Europeo de Desarrollo Regional, Unión Europea, Una manera de hacer Europa. This work was also supported by the National Institutes of Health (NIA grants 1R01AG056850–01A1, R21AG056974, R01AG061566 to JF), Fundació La Marató de TV3 (20141210 to JF), Fundació Catalana Síndrome de Down, Fundació Víctor Grífols i Lucas and Generalitat de Catalunya (SLT006/17/00119 to JF).
The authors are grateful for the participation of all caregivers/familiy members for being informants as well as support staff of the various care institutions for the local organization and administration. We wish to thank all interviewers who took part in the project (per institute): Mylou Pool, Marije Ravesteijn, Nadi de Vos (Amerpoort), Lizan Exterkate, Rachel Kemna, Nardine Lukassen, Danielle Oosterling, Carla Wensink (Aveleijn), José Eleveld, Desiree van Leth, Sharina Grefelman, Cobien Wever (Cosis), Sanne Apperloo, Eline de Jong, Sandra Kleijer (De Twentse Zorgcentra), Jade Oostrom (Dichterbij), Marscha Brunia, Rosanne Derksen, Esther Scholten, Marije van Dijk-van der Werff (Elver), Lyanne Hassefras, Marloes Lansbergen, Simone Wilson-Koudenburg (Ipse de Bruggen), Janette Drolinga, Tineke Arts-Wiegmink (Nieuw Woelwijck), Hannelore Broers, Regine van Duijvenboden, Maarten Faber, Annebeth Maarsman, Lilian van der Meer, Romy Scheggetman, Karen van de Weijer (Philadelphia), Merel Duim, Kirsten Hendrickx, Britta te Nijenhuis, Loes Velner (Reinaerde), Eden van den Akker, Lobke Berendsen (Severinus), Fenna Blaas, Herco Elbertsen, Marjon van der Poel (Sherpa), Marieke Groen, Corien Rikkers-van Nes, Corine van Essen (’s Heeren Loo), Annemarieke Bronswijk, Ybelina de Jong-van der Meulen (Sprank), Natascha Albers, Eva Smit, Nienke Stap (Talant/Alliade Care Group), Aart-Jan Lenstra, Tijs van der Linden, Marian Roffel-de Jong (Vanboeijen), Monique Bomer-Veenboer, Lisette Meinster, Deliah Ormskerk (Zuidwester), Gianluca Radice (Institut Lejeune), and Laura Videla (Sant Pau).
Authors’ disclosures available online (https://www.j-alz.com/manuscript-disclosures/20-1427r3).
SUPPLEMENTARY MATERIAL
[1] The supplementary material is available in the electronic version of this article: https://dx.doi.org/10.3233/JAD-201427.
REFERENCES
[1] | de Graaf G , Engelen JJM , Gijsbers ACJ , Hochstenbach R , Hoffer MJV , Kooper AJA , Sikkema-Raddatz B , Srebniak MI , van der Kevie-Kersemaekers AMF , van Zutven LJCM , Voorhoeve E ((2017) ) Estimates of live birth prevalence of children with Down syndrome in the period 1991–2015 in the Netherlands. J Intellect Disabil Res 61: , 461–470. |
[2] | Loane M , Morris JK , Addor M-CC , Arriola L , Budd J , Doray B , Garne E , Gatt M , Haeusler M , Khoshnood B , Klungsøyr Melve K , Latos-Bielenska A , McDonnell B , Mullaney C , O’Mahony M , Queißer-Wahrendorf A , Rankin J , Rissmann A , Rounding C , Salvador J , Tucker D , Wellesley D , Yevtushok L , Dolk H , Klungsoyr Melve K , Latos-Bielenska A , McDonnell B , Mullaney C , O’Mahony M , Queißer-Wahrendorf A , Rankin J , Rissmann A , Rounding C , Salvador J , Tucker D , Wellesley D , Yevtushok L , Dolk H ((2013) ) Twenty-year trends in the prevalence of Down syndrome and other trisomies in Europe: Impact of maternal age and prenatal screening. Eur J Hum Genet 21: , 27–33. |
[3] | Ballard C , Mobley WC , Hardy J , Williams G , Corbett A ((2016) ) Dementia in Down’s syndrome. Lancet Neurol 15: , 622–636. |
[4] | Mann DMA ((1988) ) Alzheimer’s disease and Down’s syndrome. Histopathology 13: , 125–137. |
[5] | McCarron M , McCallion P , Reilly E , Dunne P , Carroll R , Mulryan N ((2017) ) A prospective 20-year longitudinal follow-up of dementia in persons with Down syndrome. J Intellect Disabil Res 61: , 834–852. |
[6] | Fortea J , Vilaplana E , Carmona-Iragui M , Benejam B , Videla L , Barroeta I , Fernández S , Altuna M , Pegueroles J , Montal V , Valldeneu S , Giménez S , González-Ortiz S , Muñoz L , Estellés T , Illán-Gala I , Belbin O , Camacho V , Wilson LR , Annus T , Osorio RS , Videla S , Lehmann S , Holland AJ , Alcolea D , Clarimón J , Zaman SH , Blesa R , Lleó A ((2020) ) Clinical and biomarker changes of Alzheimer’s disease in adults with Down syndrome: A cross-sectional study. Lancet 395: , 1988–1997. |
[7] | Janicki MP ((2011) ) Quality outcomes in group home dementia care for adults with intellectual disabilities. J Intellect Disabil Res 55: , 763–776. |
[8] | Finkel SI ((2001) ) Behavioral and psychological symptoms of dementia: A current focus for clinicians, researchers, and caregivers. J Clin Psychiatry 62 Suppl 2: , 3–6. |
[9] | Gauthier S , Cummings J , Ballard C , Brodaty H , Grossberg G , Robert P , Lyketsos C , Brodaty H , Grossberg G , Robert P ((2010) ) Management of behavioral problems in Alzheimer’s disease. Int Psychogeriatrics 22: , 346–372. |
[10] | Cerejeira J , Lagarto L , Mukaetova-Ladinska EB ((2012) ) Behavioral and psychological symptoms of dementia. Front Neurol 3: , 73. |
[11] | Kales HC , Gitlin LN , Lyketsos CG ((2015) ) Assessment and management of behavioral and psychological symptoms of dementia. BMJ 350: , h369. |
[12] | Finkel SI ((2000) ) Introduction to behavioural and psychological symptoms of dementia (BPSD). Int J Geriatr Psychiatry 15: (Suppl 1), S2–4. |
[13] | Adams D , Oliver C , Kalsy S , Peters S , Broquard M , Basra T , Konstandinidi E , McQuillan S ((2008) ) Behavioural characteristics associated with dementia assessment referrals in adults with Down syndrome. J Intellect Disabil Res 52: , 358–368. |
[14] | Iacono T , Bigby C , Carling-Jenkins R , Torr J ((2014) ) Taking each day as it comes: Staff experiences of supporting people with Down syndrome and Alzheimer’s disease in group homes. J Intellect Disabil Res 58: , 521–533. |
[15] | Cleary J , Doody O ((2017) ) Nurses’ experience of caring for people with intellectual disability and dementia. J Clin Nurs 26: , 620–631. |
[16] | Sheehan R , Sinai A , Bass N , Blatchford P , Bohnen I , Bonell S , Courtenay K , Hassiotis A , Markar T , McCarthy J , Mukherji K , Naeem A , Paschos D , Perez-Achiaga N , Sharma V , Thomas D , Walker Z , Strydom A ((2015) ) Dementia diagnostic criteria in Down syndrome. Int J Geriatr Psychiatry 30: , 857–863. |
[17] | Keller SM , Janicki MP , Esralew L ((2016) ) Dementia: Screening, evaluation, diagnosis and management. In Health Care for People with Intellectual and Developmental Disabilities across the Lifespan, Rubin IL, Merrick J, Greydanus DE, Patel DR, eds. Springer International Publishing, pp. 1449-1463. |
[18] | Chapman M , Lacey H , Jervis N ((2018) ) Improving services for people with learning disabilities and dementia: Findings from a service evaluation exploring the perspectives of health and social care professionals. Br J Learn Disabil 46: , 33–44. |
[19] | Lautarescu BA , Holland AJ , Zaman SH ((2017) ) The early presentation of dementia in people with Down syndrome: A systematic review of longitudinal studies. Neuropsychol Rev 27: , 31–45. |
[20] | Bekkema N , De Veer AJE , Hertogh CMPM , Francke AL ((2015) ) “From activating towards caring”: Shifts in care approaches at the end of life of people with intellectual disabilities; A qualitative study of the perspectives of relatives, care-staff and physicians. BMC Palliat Care 14: , 33. |
[21] | Ogg-Groenendaal M , Hermans H , Claessens B ((2014) ) A systematic review on the effect of exercise interventions on challenging behavior for people with intellectual disabilities. Res Dev Disabil 35: , 1507–1517. |
[22] | Heyvaert M , Saenen L , Maes B , Onghena P ((2014) ) Systematic review of restraint interventions for challenging behaviour among persons with intellectual disabilities: Focus on effectiveness in single-case experiments. J Appl Res Intellect Disabil 27: , 493–510. |
[23] | Nicoll M , Beail N , Saxon D ((2013) ) Cognitive behavioural treatment for anger in adults with intellectual disabilities: A systematic review and meta-analysis. J Appl Res Intellect Disabil 26: , 47–62. |
[24] | Chowdhury M , Benson BA ((2011) ) Use of differential reinforcement to reduce behavior problems in adults with intellectual disabilities: A methodological review. Res Dev Disabil 32: , 383–394. |
[25] | Hässler F , Reis O ((2010) ) Pharmacotherapy of disruptive behavior in mentally retarded subjects: A review of the current literature. Dev Disabil Res Rev 16: , 265–272. |
[26] | Janowsky DS , Barnhill LJ , Davis JM ((2003) ) Olanzapine for self-injurious, aggressive, and disruptive behaviors in intellectually disabled adults: A retrospective, open-label, naturalistic trial. J Clin Psychiatry 64: , 1258–1265. |
[27] | Cummings JL , Mega MS , Gray K , Rosenberg-Thompson S , Carusi DA , Gornbein J ((1994) ) The Neuropsychiatric Inventory: Comprehensive assessment of psychopathology in dementia. Neurology 44: , 2308–2314. |
[28] | Cummings JL ((1997) ) The Neuropsychiatric Inventory: Assessing psychopathology in dementia patients.S. Neurology 48: , 10–16. |
[29] | Dekker AD , Strydom A , Coppus AMW , Nizetic D , Vermeiren Y , Naudé PJW , Van Dam D , Potier M-C , Fortea J , De Deyn PP ((2015) ) Behavioural and psychological symptoms of dementia in Down syndrome: Early indicators of clinical Alzheimer’s disease? {Cortex 73: , 36–61. |
[30] | Dekker AD , Sacco S , Carfi A , Benejam B , Vermeiren Y , Beugelsdijk G , Schippers M , Hassefras L , Eleveld J , Grefelman S , Fopma R , Bomer-Veenboer M , Boti M , Oosterling GDE , Scholten E , Tollenaere M , Checkley L , Strydom A , Van Goethem G , Onder G , Blesa R , zu Eulenburg C , Coppus AMW , Rebillat A-S , Fortea J , De Deyn PP ((2018) ) The Behavioral and Psychological Symptoms of Dementia in Down Syndrome (BPSD-DS) scale: Comprehensive assessment of psychopathology in Down syndrome. J Alzheimers Dis 63: , 797–820. |
[31] | Hithersay R , Hamburg S , Knight B , Strydom A ((2017) ) Cognitive decline and dementia in Down syndrome. Curr Opin Psychiatry 30: , 102–107. |
[32] | McKhann GM , Knopman DS , Chertkow H , Hyman BT , Jack CR , Kawas CH , Klunk WE , Koroshetz WJ , Manly JJ , Mayeux R , Mohs RC , Morris JC , Rossor MN , Scheltens P , Carrillo MC , Thies B , Weintraub S , Phelps CH ((2011) ) The diagnosis of dementia due to Alzheimer’s disease: Recommendations from the National Institute on Aging-Alzheimer’s Association workgroups on diagnostic guidelines for Alzheimer’s disease. Alzheimers Dement 7: , 263–269. |
[33] | World Health Organization. International Statistical Classification of diseases and Related Health Problems, 10th Revision. |
[34] | Trevethan R ((2017) ) Sensitivity, specificity, and predictive values: Foundations, pliabilities, and pitfalls in research and practice. Front Public Health 5: , 307. |
[35] | McHugh ML ((2012) ) Interrater reliability: The kappa statistic. Biochem Med 22: , 276–282. |
[36] | Feinstein AR , Cicchetti DV ((1990) ) High agreement but low kappa: I. The problems of two paradoxes. J Clin Epidemiol 43: , 543–549. |
[37] | Benjamini Y , Hochberg Y ((1995) ) Controlling the false discovery rate: A practical and powerful approach to multiple testing. J R Stat Soc Series B Methodol 57: , 289–300. |
[38] | Alzheimer’s Association ((2020) ) 2020 Alzheimer’s disease facts and figures. Alzheimers Dement 16: , 391–460. |
[39] | Gottesman RT , Stern Y ((2019) ) Behavioral and psychiatric symptoms of dementia and rate of decline in Alzheimer’s disease. Front Pharmacol 10: , 1062. |
[40] | Sabbagh M , Edgin J ((2016) ) Clinical assessment of cognitive decline in adults with Down syndrome. Curr Alzheimer Res 13: , 30–34. |
[41] | Zigman WB , Devenny DA , Krinsky-McHale SJ , Jenkins EC , Urv TK , Wegiel J , Schupf N , Silverman WP ((2008) ) Alzheimer’s disease in adults with Down syndrome. Int Rev Res Ment Retard 36: , 103–145. |
[42] | Jamieson-Craig R , Scior K , Chan T , Fenton C , Strydom A ((2010) ) Reliance on carer reports of early symptoms of dementia among adults with intellectual disabilities. J Policy Pract Intellect Disabil 7: , 34–41. |
[43] | Sturmey P , Reed J , Corbett J ((1991) ) Psychometric assessment of psychiatric disorders in people with learning difficulties (mental handicap): A review of measures. Psychol Med 21: , 143–155. |
[44] | DekkerAD, WissingMBG, UlgiatiAM, BijlB, van GoolG, GroenMR, GrootendorstES, van der WalIA, HobbelenJSM, De DeynPP, WaningeA. Dementia in people with severe or profound intellectual (and multiple) disabilities: Focus group research into relevance, symptoms and training needs. Journal of Applied Research in Intellectual Disabilities. In press. |
[45] | Llewellyn P ((2011) ) The needs of people with learning disabilities who develop dementia: A literature review. Dementia 10: , 235–247. |
[46] | Dodd KD ((2015) ) Care considerations for dementia in people with Down’s syndrome: A management perspective. Neurodegener Dis Manag 5: , 293–304. |
[47] | Molony SL , Kolanowski A , Van Haitsma K , Rooney KE ((2018) ) Person-centered assessment and care planning. Gerontologist 58: , S32–S47. |
[48] | Kaufer DI , Cummings JL , Ketchel P , Smith V , MacMillan A , Shelley T , Lopez OL , DeKosky ST ((2000) ) Validation of the NPI-Q, a brief clinical form of the Neuropsychiatric Inventory. J Neuropsychiatry Clin Neurosci2 12: , 233–239. |


