
Multi-Target Effects of the Cannabinoid CP55940 on Familial Alzheimer’s Disease PSEN1 E280A Cholinergic-Like Neurons: Role of CB1 Receptor
Abstract
Background:
Alzheimer’s disease (AD) is characterized by structural damage, death, and functional disruption of cholinergic neurons (ChNs) as a result of intracellular amyloid-β (Aβ) aggregation, extracellular neuritic plaques, and hyperphosphorylation of protein tau (p-Tau) overtime.
Objective:
To evaluate the effect of the synthetic cannabinoid CP55940 (CP) on PSEN1 E280A cholinergic-like nerve cells (PSEN1 ChLNs)—a natural model of familial AD.
Methods:
Wild type (WT) and PSEN1 ChLNs were exposed to CP (1μM) only or in the presence of the CB1 and CB2 receptors (CB1Rs, CB2Rs) inverse agonist SR141716 (1μM) and SR144528 (1μM) respectively, for 24 h. Untreated or treated neurons were assessed for biochemical and functional analysis.
Results:
CP in the presence of both inverse agonists (hereafter SR) almost completely inhibits the aggregation of intracellular sAβPPβf and p-Tau, increases ΔΨm, decreases oxidation of DJ-1Cys106-SH residue, and blocks the activation of c-Jun, p53, PUMA, and caspase-3 independently of CB1Rs signaling in mutant ChLNs. CP also inhibits the generation of reactive oxygen species partially dependent on CB1Rs. Although CP reduced extracellular Aβ42, it was unable to reverse the Ca2+ influx dysregulation as a response to acetylcholine stimuli in mutant ChLNs. Exposure to anti-Aβ antibody 6E10 (1:300) in the absence or presence of SR plus CP completely recovered transient [Ca2+]i signal as a response to acetylcholine in mutant ChLNs.
Conclusion:
Taken together our findings suggest that the combination of cannabinoids, CB1Rs inverse agonists, and anti-Aβ antibodies might be a promising therapeutic approach for the treatment of familial AD.
INTRODUCTION
Alzheimer’s disease (AD) is a multifactorial neu-rodegenerative condition [1] characterized by severe loss of cholinergic neurons from the nucleus basalis magnocellularis of Meynert and cholinergic projections to the cortex and hippocampus [2]. The neuronal destruction is associated with the extracellular accumulation of insoluble forms of amyloidβ (Aβ) in plaques, mostly fragment Aβ1–42 (hereafter Aβ42), intracellular aggregation of the microtubule protein tau in neurofibrillary tangles, neuronal cell death, and synaptic dysfunction [3]. The Aβ42 peptide is derived from the amyloid-β protein precursor (AβPP) via sequential cleavage by the beta-site amyloid precursor protein cleaving enzyme 1 (BACE1) and by the gamma-site aspartyl protease γ-secretase [4]. This last protein is composed of four subunits, namely presenilins (PSEN1 and PSEN2), presenilin enhancer 2 (PEN2), anterior pharynx-defective 1 (APH-1), and nicastrin. While PEN2, APH-1, and nicastrin stabilize the complex, PSEN1 and PSEN2 function as the catalytic core of the protease [5]. Over two hundred autosomal dominant mutations in the presenilin 1 (PSEN 1) gene result in the overproduction of extracellular (e)Aβ42 [6] and occur most frequently in familial AD (FAD; https://www.alzforum.org/mutations/psen-1). Among PSEN1 mutations, the Glu280Ala (p. E280A, c.839A>C, exon 8) in PSEN1 causes FAD with complete penetrance in a large kindred localized in Antioquia, Colombia [7–10]. As the majority of dominant-negative PSEN1 mutations [11], PSEN1 E280A produces increased Aβ42 deposition [12], hippocampal neuron loss [13], and Aβ/tau accumulation in young adults [14, 15]. Recently, we have recapitulated the molecular pathogenesis of FAD caused by PSEN1 E280A in umbilical cord mesenchymal stem cells-derived cholinergic-like neurons (ChLNs [16]). It has demonstrated that PSEN1 E280A ChLNs effectively exhibited not only an increased eAβ42 but also an early increased of intracellular sAβPPβ fragments (but not Aβ42 peptide) and tau phosphorylation. Moreover, PSEN1 E280A ChLNs exhibited oxidized DJ-1 (at Cys106SO3) indicative of oxidative stress (OS), and concomitant loss of the mitochondrial membrane potential (ΔΨm), activation of apoptogenic proteins, and DNA fragmentation, markers of apoptosis—a type of regulated cell death. Additionally, mutant ChLNs displayed Ca2+ flux dysregulation when challenged to acetylcholine (ACh) and deficient acetylcholinesterase (AChE) activity compared to wild type (WT) ChLNs most probably due to eAβ42 peptide. Taken together these observations suggest that PSEN1 E280A ChLNs display the typical neuropathological markers of AD; therefore, mutant ChLNs provide a unique FAD model for screening of candidate molecule(s)/drug(s).
Due to the lack of effective therapies to date for AD, the need for new drugs has become increasingly urgent. Phytocannabinoids, a group of biologically active compounds isolated from the plant Cannabis sativa [17], have been postulated to possess therapeutic potential for clinical purposes in AD [18]. Cannabis contains at least 120 kinds of cannabinoids mainly classified as Δ9-trans-tetrahydrocannabidiol (THC), cannabidiol (CBD), CBG (Cannabigerol), and CBN (Cannabinol), among others [19]. Biologically, cannabinoids, endocannabinoids (e.g., anandamide, 2-arachidonoylglycerol), and synthetic cannabimimetic compounds (e.g., CP55940) bind cannabinoid type 1 and 2 receptors (CB1R/ CB2R), two G-protein-coupled receptors (GPCR) [20, 21]. Interestingly, it has been shown in vitro that 9 out of 11 cannabinoids studied, including THC, were able to protect cells (e.g., MC65—a human neuron-like cell line, HT22 mouse hippocampal nerve cell line, primary cortical neurons from 18-day-old rat embryos, BV2—a microglial cell line) in four distinct phenotypic neurodegeneration screening assays including proteotoxicity, loss of trophic support, OS, energy loss, and inflammation [22]. Outstandingly, cannabinoids were able to remove intraneuronal Aβ, reduce oxidative damage, and protect from the loss of energy or trophic support in neurons in which CB1 and CB2 receptors were lacking (e.g., MC65 and HT22 cells). Furthermore, CB1 agonists (e.g., CP55940) were also effective neuroprotective agents against Aβ toxicity in MC65 neurons [22]. These data suggest that cannabinoids might be antioxidant and anti-amylogenic compounds through receptor-independent mechanisms in a cell- and species-specific manner [22–28]. Despite these observations, no data are available to establish whether cannabinoids might reverse the neuropathological markers, i.e., intracellular sAβPPβf aggregation, hyperphosphorylation of tau protein, and DJ-1 oxidation in PSEN1 E280A ChLNs. Furthermore, it is not yet known whether cannabinoids might be able to block neuronal apoptosis, eAβ42, and/or prevent Ca2+ dysregulation in those mutant cholinergic neurons.
To get insight into these issues, we have selected the commercially available CP55940 ((-)-cis-3-[2-Hydroxy-4-(1,1-dimethylheptyl)phenyl]-trans-4-(3-hydroxypropyl)cyclohexanol, hereafter CP), a CB1 and CB2 potent bicyclic analog of THC [29], to evaluate its effect on wild-type and PSEN1 E280A ChLNs concerning the intracellular sAβPPβf accumulation, tau phosphorylation, OS, cell death, and Ca2+ neuronal dysfunction in ChLNs. We demonstrate for the first time that CP can protect FAD PSEN1 E280A ChLNs against neuronal structural damage and OS-induced cell death signaling and that it can reverse the cholinergic dysfunction in the presence of eAβ42 blocking agents (e.g., anti-Aβ42 antibody 6E10). These findings might favor the use of cannabinoids as potential lead compound candidates as a combined therapy for FAD.
MATERIALS AND METHODS
Cholinergic-like neuron (ChLN) differentiation
ChLN differentiation was performed according to [30]. The WT (TBC# WJMSC-11) and PSEN1 E280A (TBC# WJMSC-12) [16] MSCs were seeded at 1–1.5×10⁴ cells/cm2 in laminin-treated culture plates for 24 h in regular culture medium (RCm). Then, the medium was removed, and cells were incubated in cholinergic differentiation medium (Cholinergic-N-Run medium, hereafter Ch-N-Rm) containing DMEM/F-12 media 1:1 Nutrient Mixture (Gibco cat# 10565018), 10 ng/ mL basic fibroblast growth factor (bFGF) recombinant human protein (Gibco Cat# 13256029), 50μg/ mL sodium heparin (Hep, Sigma-Aldrich cat# H3393), 0.5μM all-trans retinoic acid, 50 ng/ml sonic hedgehog peptide (SHH, Sigma cat# SRP3156) and 1% FBS at 37°C for 7 days. After this process of transdifferentiation, the cells were labeled as WT PSEN1 or PSEN1 E280A ChLNs. Since Ch-N-Rm contains several factors that might interfere with the experiment interpretation and measurements, WT PSEN1 and PSEN1 E280A ChLNs (obtained after 7 days in Ch-N-Rm) were left in regular culture medium (RCm) for 4 additional days of post transdifferentiation.
Immunofluorescence analysis
For the analysis of markers of AD, oxidative stress, and cell death, the cells treated under different conditions were fixed with 4% paraformaldehyde for 20 min, followed by Triton X-100 (0.1%) permeabilization and 10% bovine serum albumin (BSA) blockage. Cells were incubated overnight with primary antibodies against APP751 and/or protein amyloid β1 - 42 (1:500; clone 6E10 cat# 803014, Biolegend), total tau (1:500; t-Tau; cat# T6402, Sigma), and phospho-tau (p-Tau, 1:500, Ser202/Thr205, cat# MN1020 (AT8), Thermo Fisher Scientific); and primary antibodies against oxidized DJ-1 (1:500; ox(Cys106)DJ-1; spanning residue C106 of human PARK7/DJ1; oxidized to produce cysteine sulfonic (SO3) acid; cat # ab169520, Abcam). To assess cell death, we used primary antibodies against p53-upregulated modulator of apoptosis (1:500; PUMA, cat# ab-9643, Abcam), p53 (1:500; cat# MA5-12453, Millipore), phospho-c-Jun (1:250; c-Jun (S63/73) cat# sc-16312, Santa Cruz), and caspase-3 (1:250; cat # AB3623, Millipore). After exhaustive rinsing, we incubated the cells with secondary fluorescent antibodies (DyLight 488 and 594 horse anti-rabbit, -goat and -mouse, cat DI 1094, DI 3088, and DI 2488, respectively) at 1:500. The nuclei were stained with 1μM Hoechst 33342 (Life Technologies), and images were acquired on a Floyd Cells Imaging Station microscope.
Western blot analysis
Cells were incubated as described above, detached with 0.25% trypsin and lysed in 50 mM Tris-HCl, pH 8.0, with 150 mM sodium chloride, 1.0% Igepal CA-630 (NP-40), and 0.1% sodium dodecyl sulfate and a protease inhibitor cocktail (Sigma-Aldrich). All lysates were quantified using the bicinchoninic acid assay (Thermo Scientific cat # 23225). Extracted samples (30μg of proteins) were heated at 95°C for 5 min in 2×SDS and 20× reducing agent (except for protein oxDJ-1) and loaded on to 12% gels at 120 V for 90 min, and the bands were transferred onto nitrocellulose membranes (Hybond-ECL, Amersham Biosciences) at 270 mA for 90 min using an electrophoretic transfer system (BIO-RAD) according to Bio-Rad protocol (http://www.bio-rad.com/webroot/web/pdf/lsr/literature/Bulletin_6376). The membra-nes were incubated overnight at 4°C with anti-APP751, total tau, phospho-Tau, ox(Cys106) DJ1, PUMA, p53, p-c-Jun, and caspase-3 primary antibodies (1:5000). The anti-actin antibody (1:1000, cat #MAB1501, Millipore) was used as an expression control. Secondary infrared antibodies (goat anti-rabbit IRDye® 680 RD, cat #926-68071; donkey anti-goat IRDye ® 680 RD, cat # 926-68074; and goat anti-mouse IRDye ® 800 CW, cat #926-32270; LI-CORBiosciences) at 1:1000 were used for western blotting analysis, and data were acquired using Odyssey software. The determination of the aggregation state of APP751 (i.e., sAβPPβf) was performed by western analysis of SDS-PAGE as described above. The assessment was repeated three times in independent experiments.
Analysis of cells
Assay protocol
The methodology for both WT and PSEN1 E280A ChLNs cell culture assays was the same. Initial CP55940 screening was performed at least twice in triplicate between 10 nM and 1μM. Subsequently, CP55940 (1μM) was established as an optimal concentration for further experiments. ChLNs were divided in four groups: 1) untreated; 2) treated with SR141716 (CB1 receptor inverse agonist) and SR144528 (CB2 receptor inverse agonist) at 1μM final concentration each (hereafter SR); 3) CP55940 (or CP); 4) RS + CP55940 (also named as SR + CP cocktail). To block eAβ42 [31], WT and mutant ChLNs were incubated four days with anti-Aβ42 antibody 6E10 (1:300 in RCm) after differentiation in the presence or absence of CP or CP + RS.
Evaluation of intracellular hydrogen peroxide (H2O2) by fluorescence microscopy
To determine the levels of intracellular H2O2, we used 2′,7′-dichlorofluorescein diacetate (5μM, DCFH2-DA; Invitrogen). ChLNs were left in RCm for 4 days. Then, the cells (5×10³) were incubated with the DCFH2-DA reagent for 30 min at 37°C in the dark. Cells were then washed, and DCF fluorescence intensity was determined by analysis of fluorescence microscopy images. The assessment was repeated three times in independent experiments. The nuclei were stained with 0.5μM Hoechst 33342 staining compound. The assessment was repeated three times in independent experiments blind to the experimenter.
Analysis of mitochondrial membrane potential (ΔΨm) by fluorescence microscopy
The ChLNs were left in regular culture medium (RCm) for 4 days. Then, the cells (5×10³) were incubated with the passively diffusing and active mitochondria-accumulating dye deep red MitoTracker compound (20 nM, final concentration) for 20 min at room temperature in the dark (Invitrogen, cat # M22426). Cells were then washed twice with PBS. MitoTracker fluorescence intensity was determined by analysis of fluorescence microscopy images. The assessment was repeated three times in independent experiments. The nuclei were stained with 0.5μM Hoechst 33342 staining compound. The assessment was repeated three times in independent experiments blind to the experimenter and flow cytometer analyst.
Measurement of Aβ42 peptide in culture medium
The level of Aβ1–42 peptide was measured according to a previous report [32] with minor modifications. Briefly, WT and PSEN1 E280A ChLNs were left in RCm for 4 days. Then, 100μl of conditioned medium was collected, and the levels of secreted Aβ42 peptides were determined by a solid-phase sandwich ELISA (Invitrogen, Cat# KHB3544) following the manufacturer’s instructions. The ass-essment was repeated 4 times in independent experiments blind to the experimenter.
Intracellular calcium imaging
Intracellular calcium (Ca2+) concentration chan-ges evoked by cholinergic stimulation were assessed according to [33, 34] with minor modifications. For the measurement, the fluorescent dye Fluo-3 (Fluo-3 AM; Thermo Fisher Scientific, cat: F1242) was employed. The dye was dissolved in DMSO (1 mM) to form a stock solution. Before the experiments, the stock solution was diluted in neuronal buffer solution (NBS buffer: 137 mM NaCl, 5 mM KCl, 2.5 mM CaCl2, 1 mM MgCl2, pH 7.3, and 22 mM glucose). The working concentration of the dye was 2μM. The WT and PSEN1 E280A ChLNs were incubated for 30 min at 37°C with the dye-containing NBS and then washed five times. Intracellular Ca2+ transients were evoked by acetylcholine (1 mM final concentration) at 4 days post differentiation. The measurements were carried out using the 20× objective of the microscope. Several regions of interest (ROIs) were defined in the visual field of the camera. One of the ROIs was cell-free, and the fluorescence intensity measured here was considered background fluorescence (Fbg). The time dependence of the fluorescence emission was acquired, and the fluorescence intensities (hence the Ca2+ levels) were represented by pseudo colors. To calculate the changes of the average Ca2+ -related fluorescence intensities, the Fbg value was determined from the cell-free ROI, and then the resting fluorescence intensities (Frest) of the cell-containing ROIs were obtained as the average of the points recorded during a consecutive period of 10 s before the addition of acetylcholine. The peaks of the fluorescence transients were found by calculating the average of six consecutive points and identifying those points that gave the highest average value (Fmax). The amplitudes of the Ca2+ -related fluorescence transients were expressed relative to the resting fluorescence (ΔF/F) and were calculated by the following formula: ΔF/F = (Fmax-Frest)/(Frest-Fbg). For the calculation of the fluorescence intensities, ImageJ was used. The terms fluorescence intensity was used as an indirect indicator of intracellular Ca2+ concentration. The assessment was repeated three times in independent experiments blind to the experimenter.
Photomicrography and image analysis
Light microscopy photographs were taken using a Zeiss Axiostart 50 Fluorescence Microscope equipped with a Canon PowerShot G5 digital camera (Zeiss Wöhlk-Contact-Linsen, Gmb Schcönkirchen, Germany), and fluorescence microscopy photographs were taken using a Zeiss Axiostart 50 Fluorescence Microscope equipped with a Zeiss AxioCam Cm1 and (Zeiss Wöhlk-Contact-Linsfluoreen, Gmb Schcönkirchen, Germany) and Floyd Cells Imaging Station microscope. Fluorescence images were analyzed by ImageJ software (http://imagej.nih.gov/ij/). The figures were transformed into 8-bit images, and the background was subtracted. The cellular measurement ROIs were drawn around the nucleus (for the case of transcription factors and apoptosis effectors) or overall cells (for cytoplasmic probes), and the fluorescence intensity was subsequently determined by applying the same the threshold for cells in the control and treatment conditions. Mean fluorescence intensity (MFI) was obtained by normalizing total fluorescence to the number of nuclei.
Data analysis
In this experimental design, a vial of MSCs was thawed, cultured and the cell suspension was pipetted at a standardized cellular density of 2.6×10⁴ cells/ cm2 into different wells of a 24-well plate. Cells (i.e., the biological and observational unit [35]) were randomized to wells by simple randomization (sampling without replacement method), and then wells (i.e., the experimental units) were randomized to treatments by a similar method. Experiments were conducted in triplicate wells. The data from individual replicate wells were averaged to yield a value of n = 1 for that experiment and this was repeated on three occasions blind to the experimenter and/ or flow cytometer analyst for a final value of n = 3 [35]. Based on the assumption that the experimental unit (i.e., the well) data comply with the independence of observations, the dependent variable is normally distributed in each treatment group (Shapiro-Wilk test), and variances are homogeneous (Levene’s test), the statistical significance was determined by one-way analysis of variance (ANOVA) followed by Tukey’s post hoc comparison calculated with GraphPad Prism 5.0 software. Differences between groups were only deemed significant when a p-value of < 0.05 (*),<0.001 (**) and < 0.001 (***). All data are illustrated as the mean±S.D.
RESULTS
CP55940 restores the mitochondrial membrane potential (ΔΨm) and blunts generation of ROS in PSEN1 E280A ChLNs in an independent concentration fashion
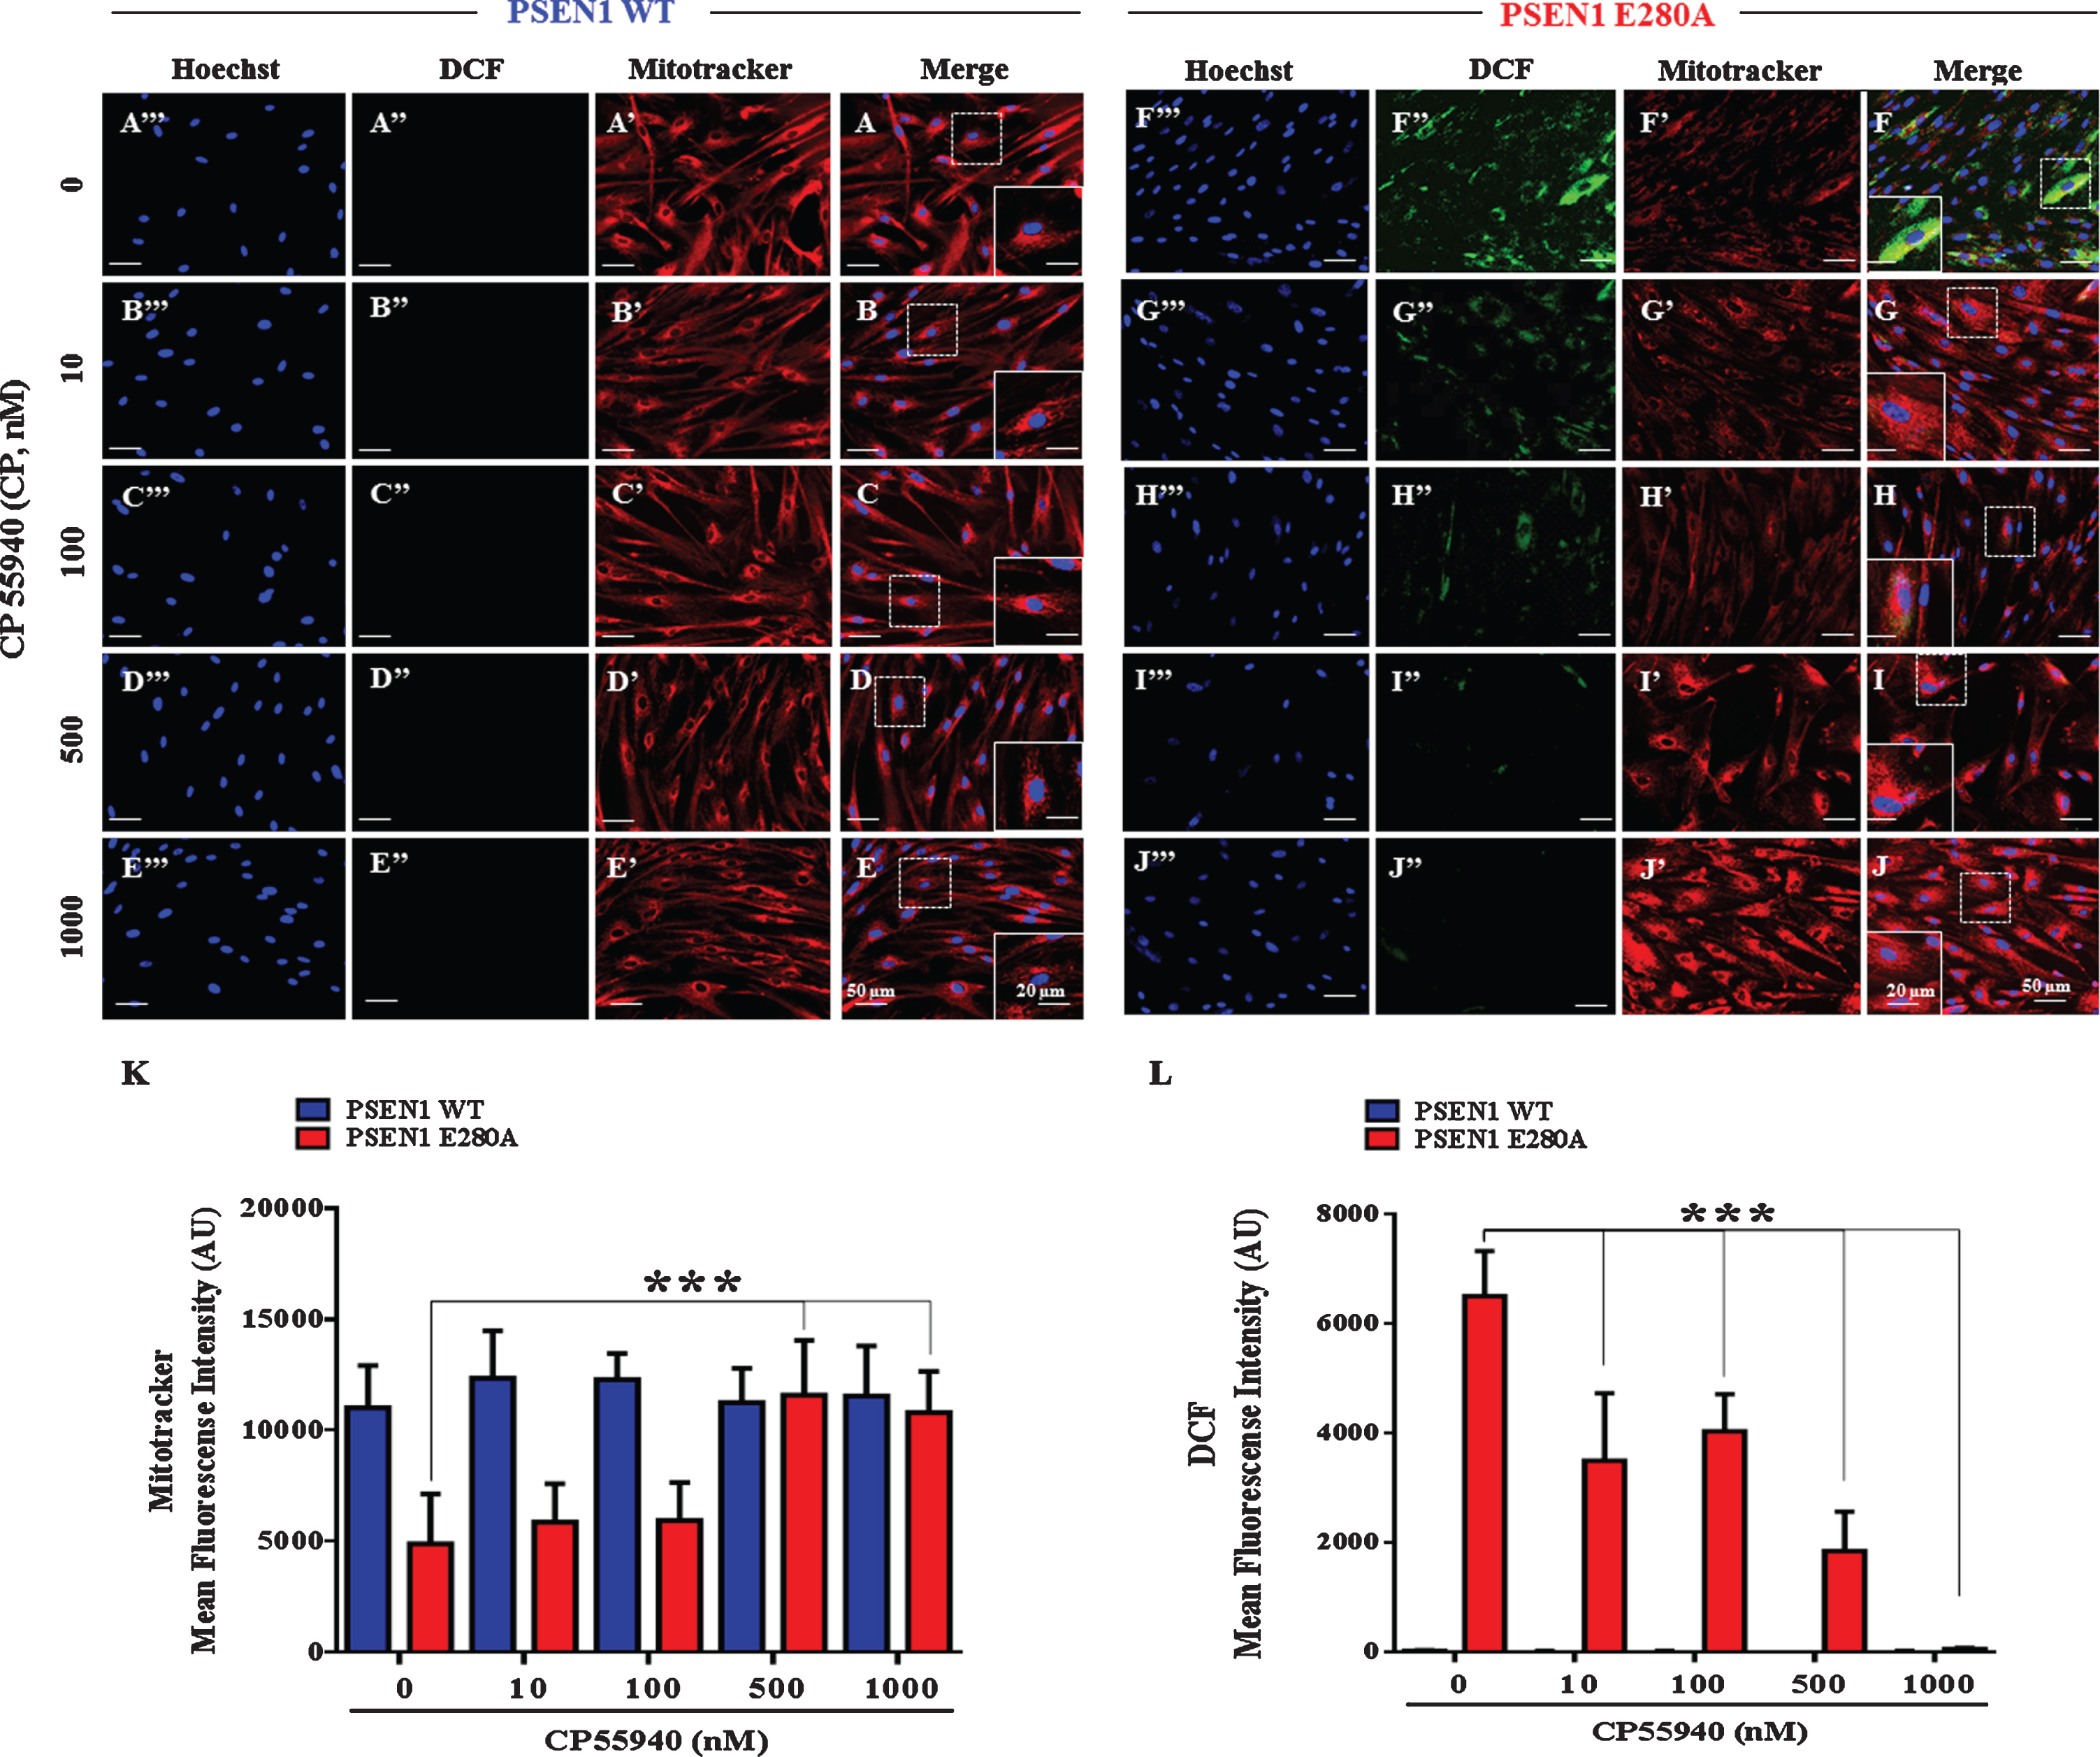
Previously, it has been shown that PSEN 1 E280A ChLNs present aggregation of sAβPPβf, endogenously generated OS, and loss of ΔΨm as the earliest neuropathological markers in mutant ChLNs [16]. Therefore, we initially determined whether CP could recover ΔΨm and scavenge ROS in those cells. To this aim, cholinergic cells were exposed to increasing concentrations of CP. As shown in Fig. 1A’-E’, CP did not affect ΔΨm in wild type ChLNs (Fig. 1A–E, K). However, it significantly increased the ΔΨm in PSEN1 E280A ChLNs in a concentration-independent fashion (Fig. 1F’-J’). Accordingly, we found 500 nM –1000 nM (= 1μM), but not low concentrations (10, 100 nM), as the maximal optimal concentrations to raise ΔΨm in mutant cells (Fig. 1F-J, K). Figure 1 shows mutant ChLNs (Fig. 1F”) but no WT ChLNs (Fig. 1A”) endogenously produce ROS. CP blunted ROS yield in mutant ChLNs (Fig. 1G”-J”) compared to WT ChLNs (Fig. 1B”-E”) in an independent concentration fashion. Since CP (1μM) recovered ΔΨm to control levels and completely diminished ROS in mutant ChLNs (Fig. 1K, L), we selected this concentration for further experiments.
Fig. 1
CP55940 restores the mitochondrial membrane potential (ΔΨm) and reduces the levels of intracellular reactive oxygen species independent of its concentration in PSEN1 E280A ChLNs. After 7 days of transdifferentiation, WT PSEN1 and PSEN1 E280A ChLNs were left untreated or treated with CP at increasing concentrations (0, 10, 100, 500, and 1000 nM) in regular culture medium (RCm) for 4 days. Representative MitoTracker (A’-J’), DCF (A”-J”), Hoechst (A”’-J”’), and merge (A-J) pictures of WT PSEN1 and PSEN1 E280A ChLNs treated as described. K) Quantification of MitoTracker fluorescence intensity. L) Quantification of DCF fluorescence intensity. Data are expressed as the mean±SD; *p < 0.05; **p < 0.01; ***p < 0.001. The histograms and figures represent 1 out of 3 independent experiments. Image magnification, 200×. Inset magnification, 800×.
CP55940 restores ΔΨm in a CB1 receptor-independent manner but diminishes ROS production partially dependent on CB1 receptors in PSEN1 E280A ChLNs
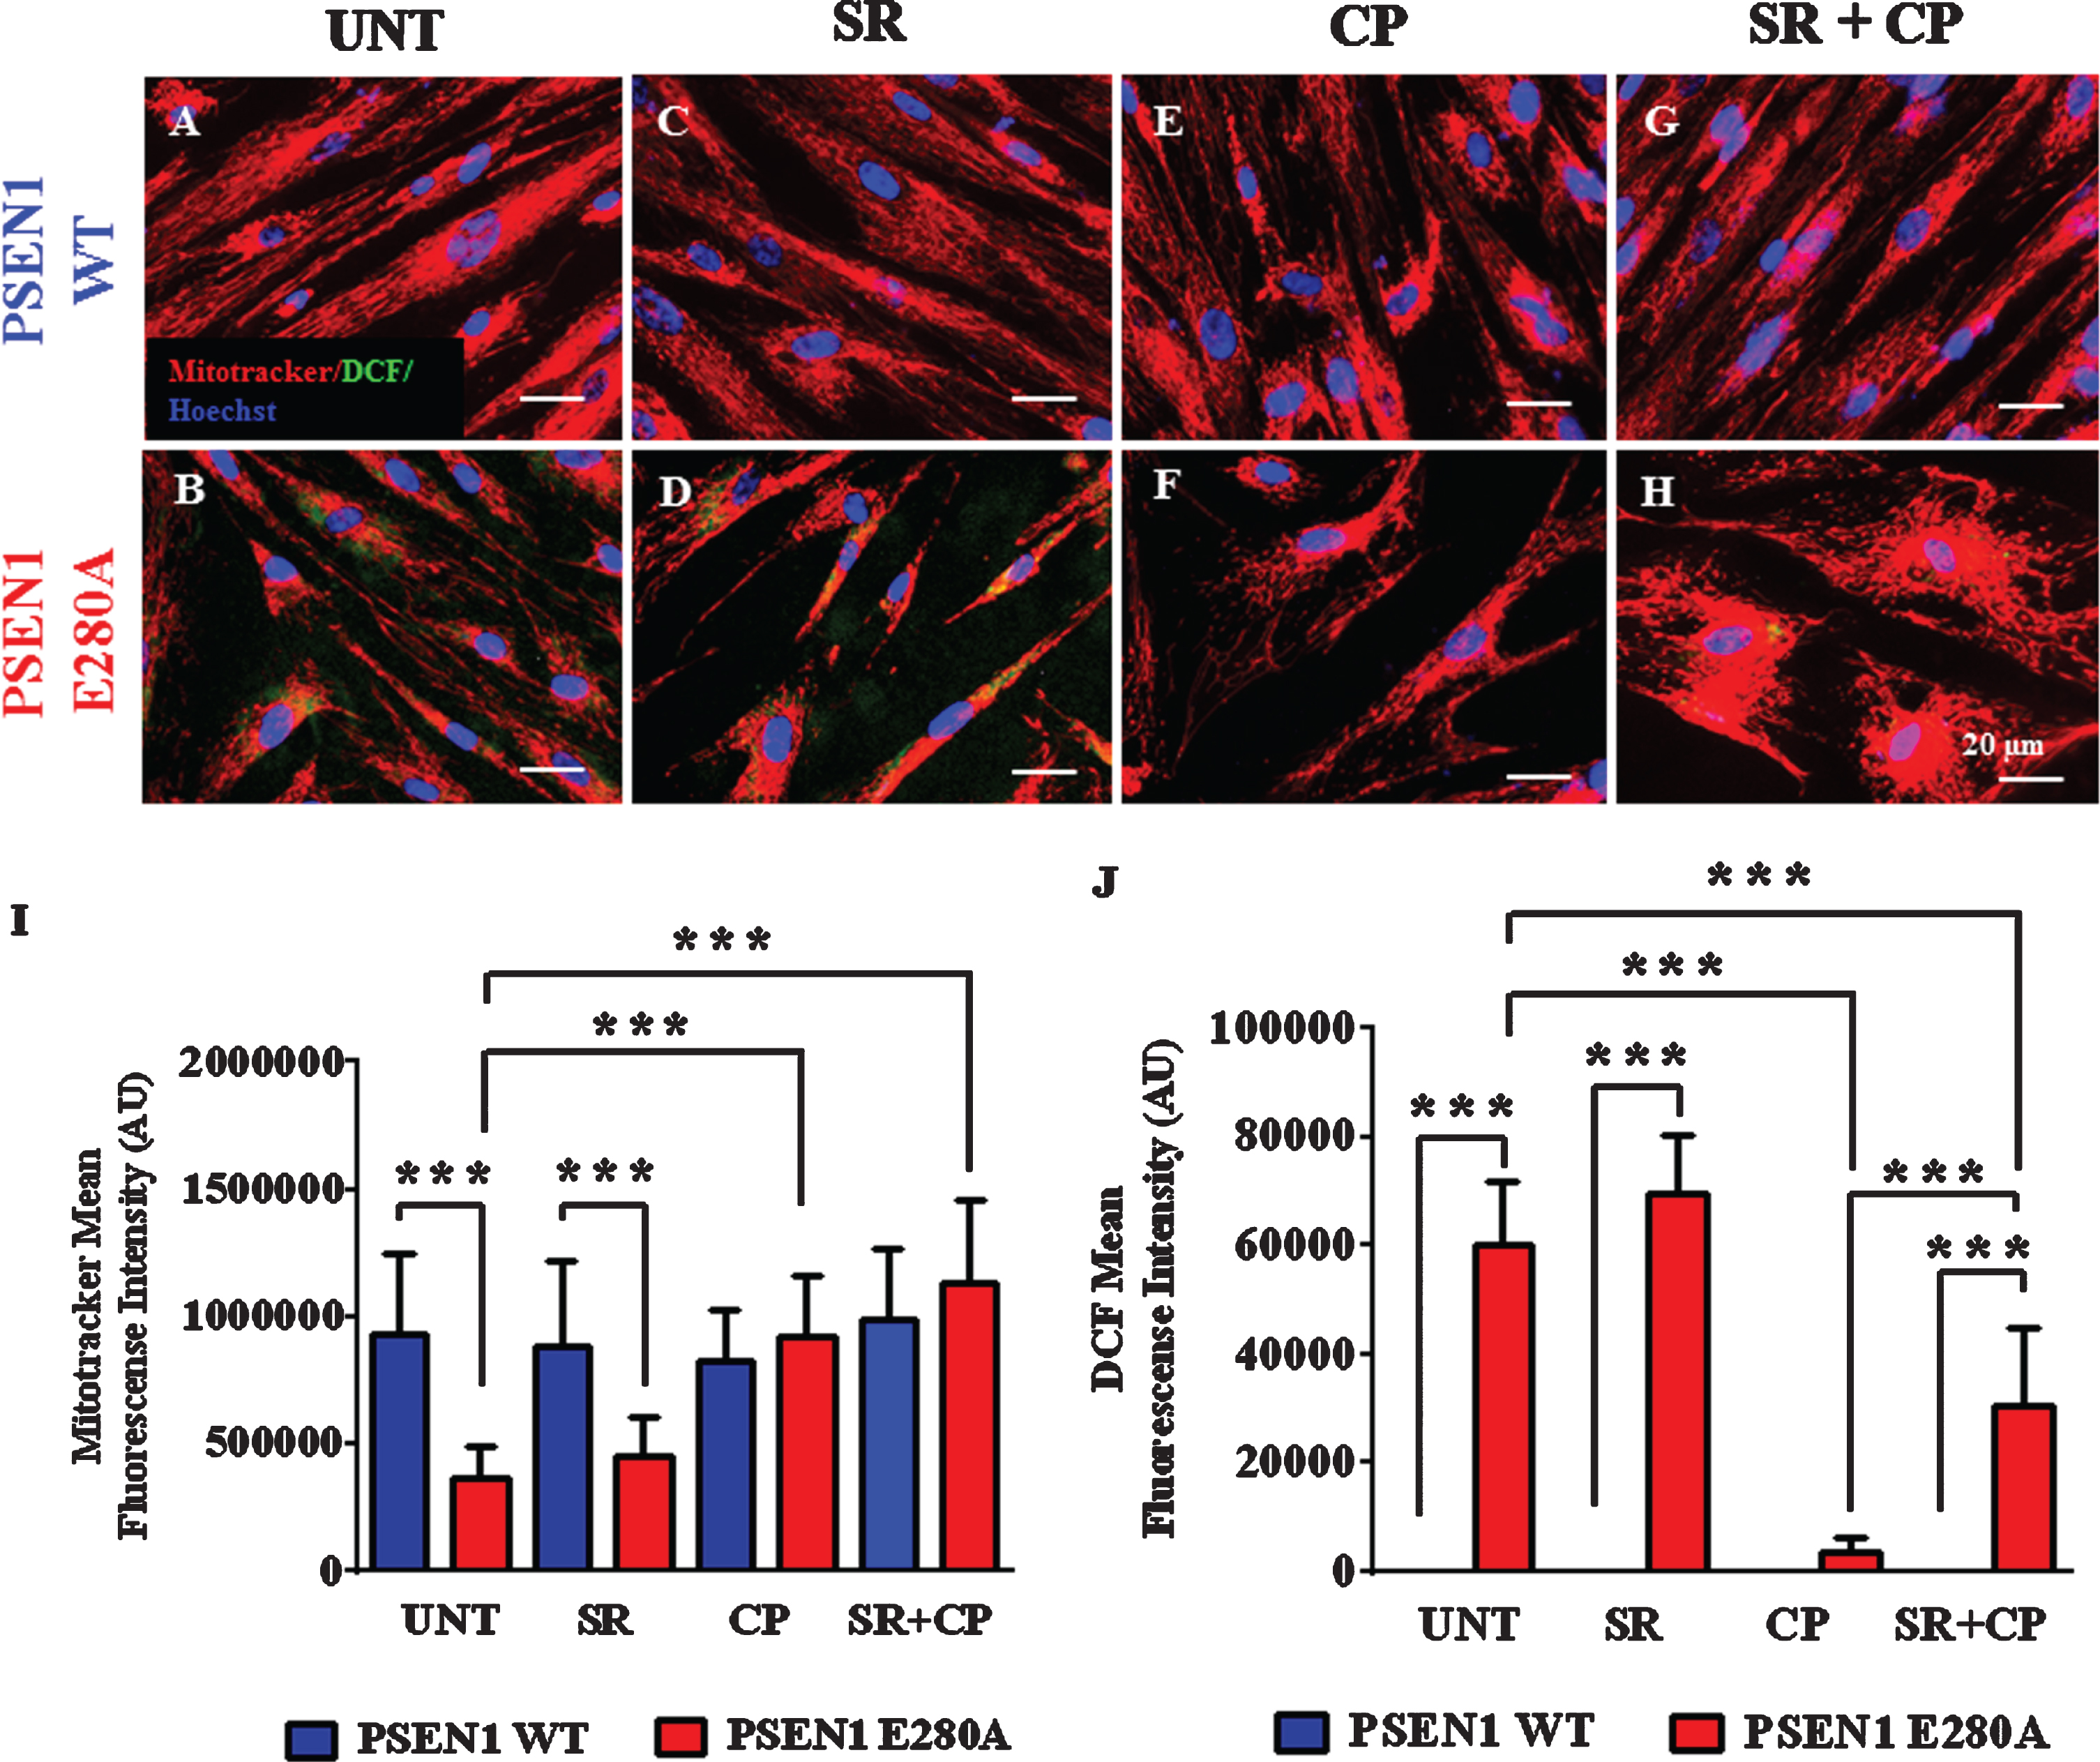
We wanted to establish whether the neuroprotective effect on mitochondria and antioxidant activity of CP was due to interaction with CB1Rs. Although these receptors are expressed in cholinergic neurons [36] and CP is a CB1 and CB2 receptor agonist, we used both potent and highly specific CB1 and CB2 receptor inverse agonist SR141716 and SR144528 (hereafter SR at 1μM each) only or with CP agonist (i.e., SR + CP cocktail) to avoid ambiguous observations. Figure 2 shows that while SR only neither affects ΔΨm in wild type ChLNs (i.e., high ΔΨm Fig. 2C) nor in mutant ChLNs (i.e., low ΔΨm Fig. 2D) when compared to untreated neurons (Fig. 2A, B), CP (Fig. 2F) or CP + SR (Fig. 2H) significantly increased the ΔΨm in mutant ChLNs (Fig. 2I). Neither CP nor the cocktail altered ΔΨm in WT ChLNs (Fig. 2E, G, I). However, analysis of ROS disappearance in ChLNs shows that while CP only almost completely scavenged ROS in mutant ChLNs (Fig. 2J), the SR + CP cocktail diminished ROS by almost half of the value of untreated or treated with SR only in PSEN1 E280A ChLNs (Fig. 2J). WT ChLNs produced no detectable ROS in any experimental condition (Fig. 2J). Of note, SR only treatment showed no effect in ΔΨm and ROS conditions in both WT (Fig. 2I) and mutant ChLNs (Fig. 2J).
Fig. 2
CP55940 augments the Ψm independent of CB1R but reduced the levels of intracellular reactive oxygen species partially dependent on those receptors in PSEN1 E280A ChLNs. After 7 days of transdifferentiation, WT PSEN1 and PSEN1 E280A ChLNs were left untreated or treated with SR, CP, or SR + CP in RCm for 4 days. A-H) Representative MitoTracker/DCF/Hoechst merge pictures of WT PSEN1 and PSEN1 E280A ChLNs treated as described. I) Quantification of MitoTracker fluorescence intensity. J) Quantification of DCF fluorescence intensity. Data are expressed as the mean±SD; *p < 0.05; **p < 0.01; ***p < 0.001. The histograms and figures represent 1 out of 3 independent experiments. Image magnification, 400×.
CP55940 reduces intracellular sAβPPβf aggregation in a CB1Rs-independent fashion but it reduces oxidized DJ-1 partially dependent of CB1Rs in PSEN1 E280A ChLNs
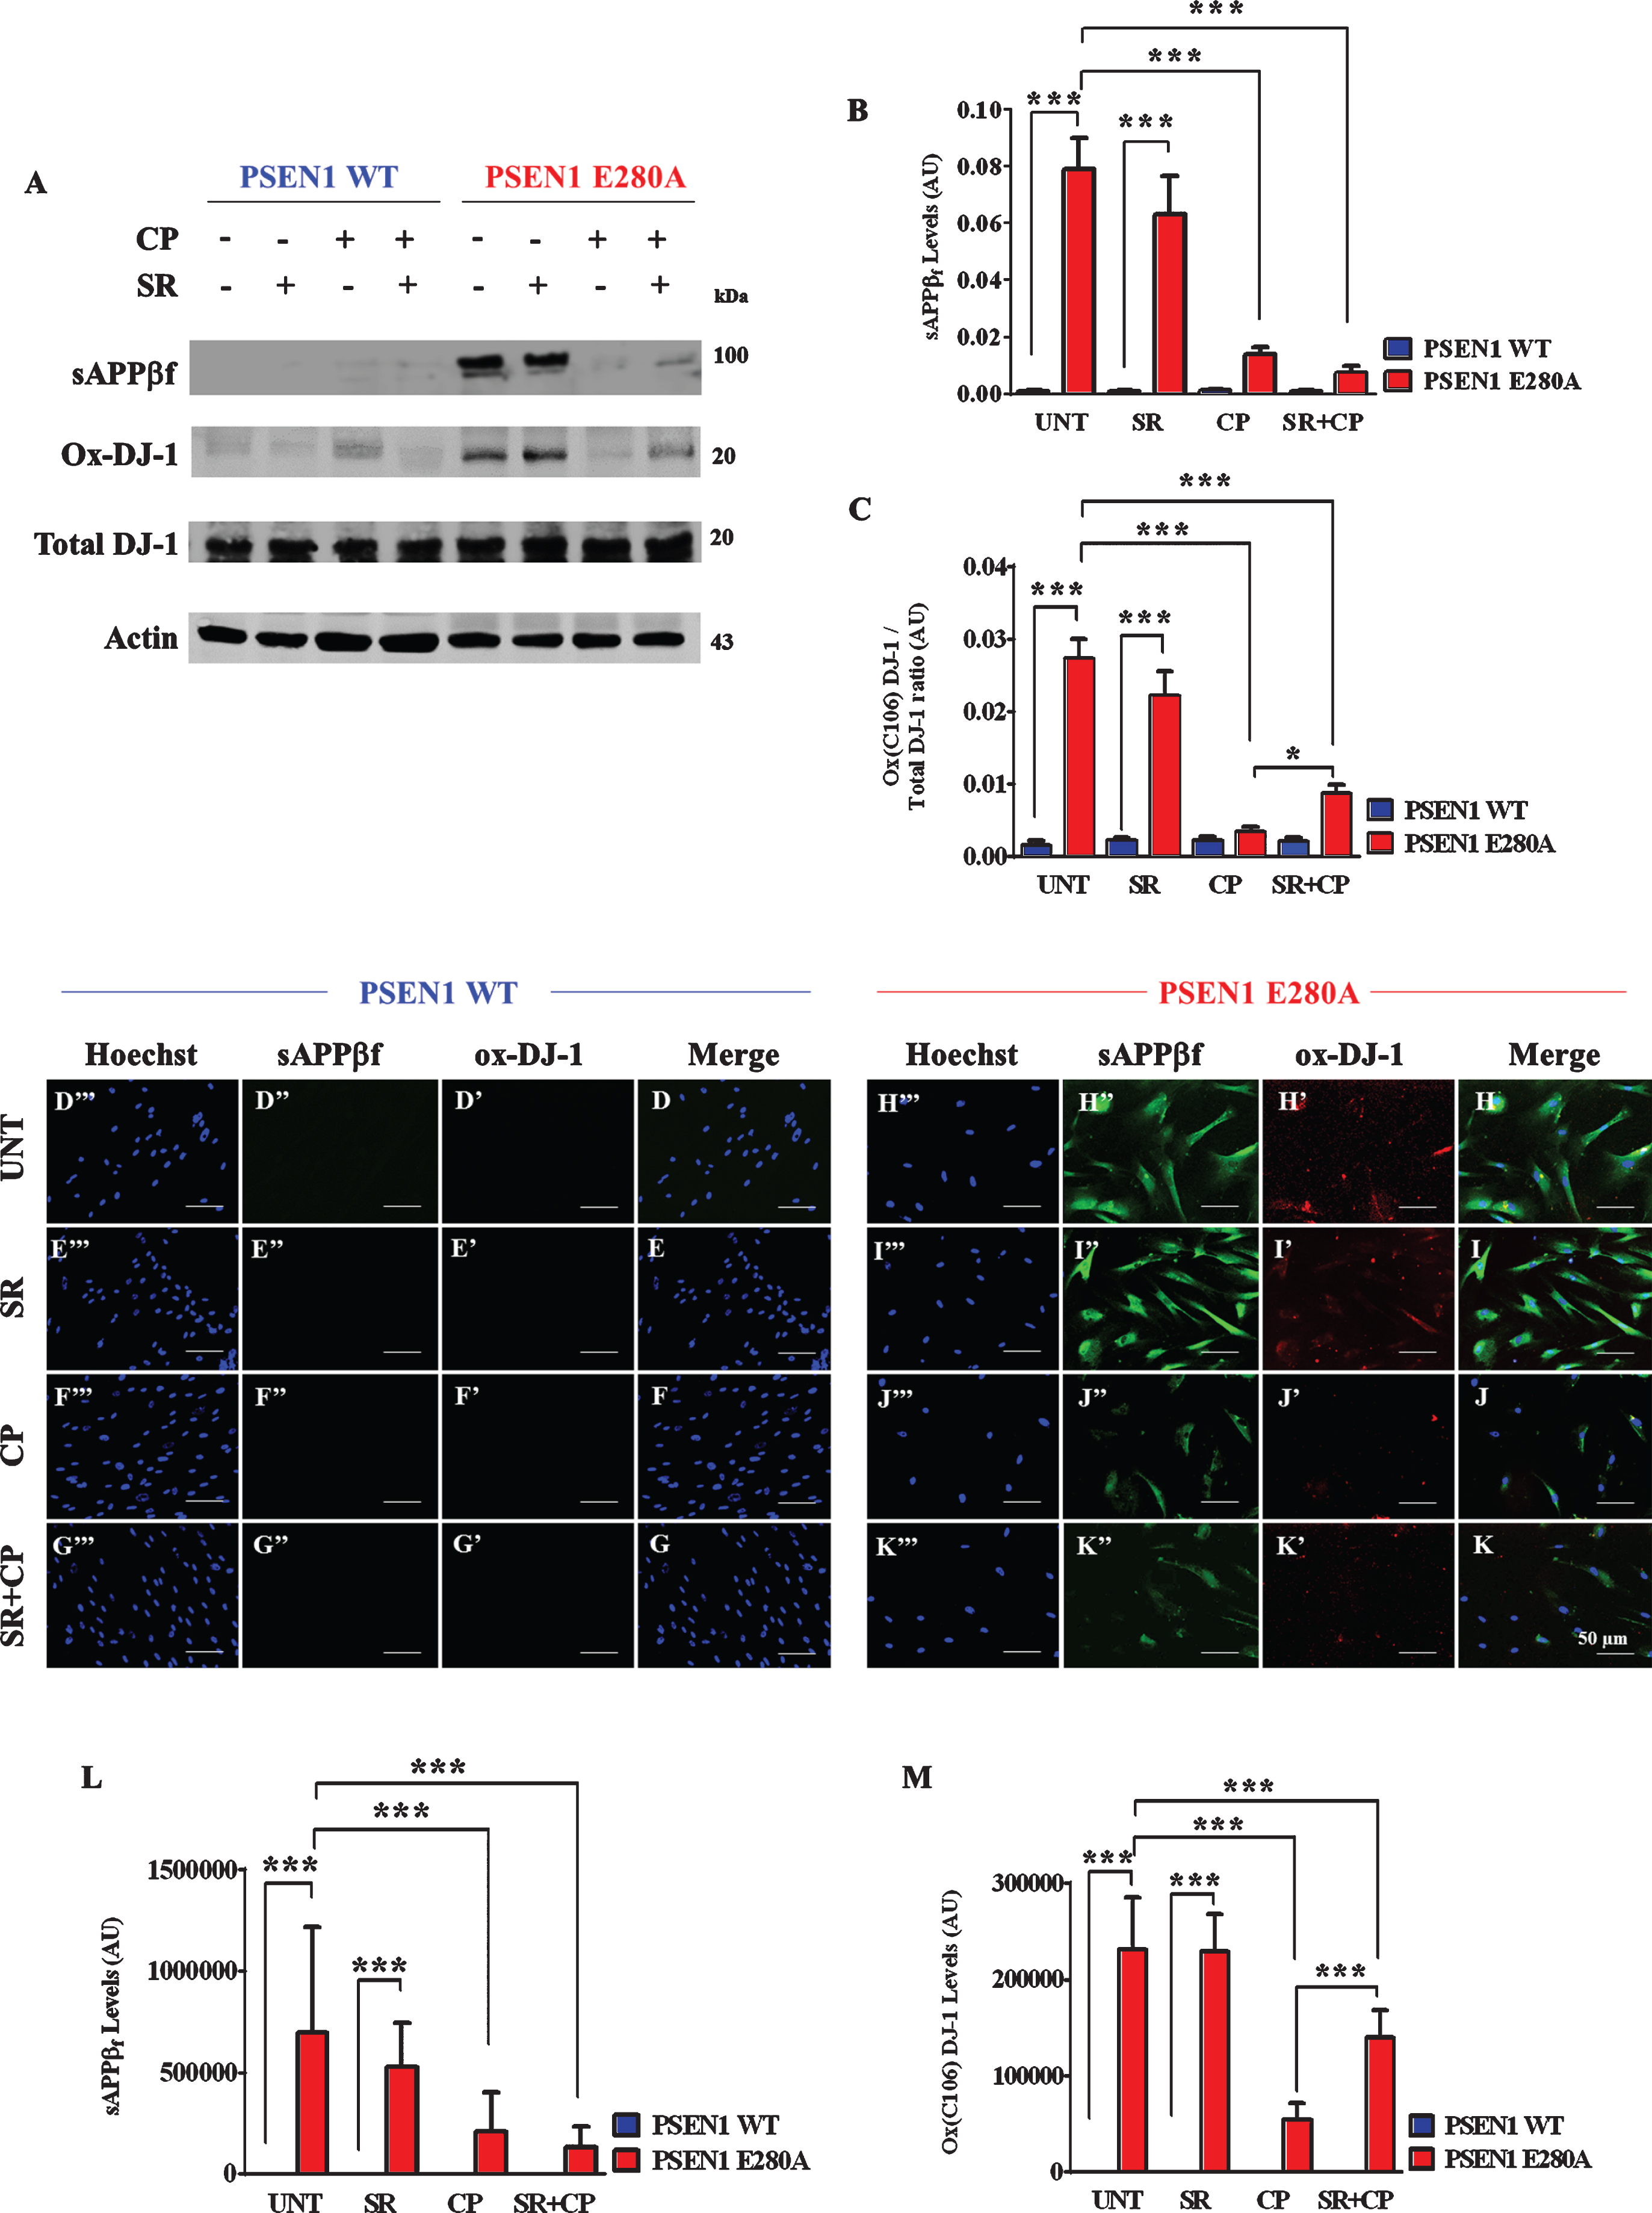
Next, we assessed whether CP could inhibit intracellular aggregation of sAβPPβf and avoid oxidation of the stress sensor protein DJ-1. To this aim, WT and mutant ChLNs were left untreated or exposed to CP in the absence or presence of SR. Western blot analysis revealed that CP only or with SR reduced the aggregation of sAβPPβf in a CB1Rs-independent manner (Fig. 3A, B) but blunted the oxidation of DJ-1 partially dependent of CB1Rs (Fig. 3A, C). As expected, WT ChLNs remained unaltered to CP and to the cocktail exposure. Neither sAβPPβf nor oxidized DJ-1 were detected in those neurons (Fig. 3A–C). These results were confirmed by fluorescent microscopy (Fig. 3D–M).
Fig. 3
CP55940 reduced intracellular sAβPPβf and oxidized DJ-1 independent of CB1Rs in PSEN1 E280A ChLNs. After 7 days of transdifferentiation, WT PSEN1 and PSEN1 E280A ChLNs were left untreated or treated with SR, CP, or SR + CP in RCm for 4 days. Further, the proteins in the extracts were blotted with primary antibodies against Aβ42, oxDJ-1Cys106, and actin proteins. The intensities of the western blot bands shown in (A) were measured (B, C) by an infrared imaging system (Odyssey, LI-COR), and the intensity was normalized to that of actin. Additionally, cells were double-stained as indicated in the figure (D-K) with primary antibodies against oxDJ-1Cys106 (red; D’-K’) and APP751/ Aβ42 (green; D”- K”). The nuclei were stained with Hoechst 33342 (blue; D”’- K”’). L) Quantification of Aβ42 fluorescence intensity. M) Quantification of oxDJ-1Cys106 fluorescence intensity. Data are expressed as the mean±SD; *p < 0.05; **p < 0.01; ***p < 0.001. The blots and figures represent 1 out of 3 independent experiments. Image magnification, 200×.
CP55940 blocks apoptosis in a CB1Rs-independent manner in PSEN1 E280A ChLNs
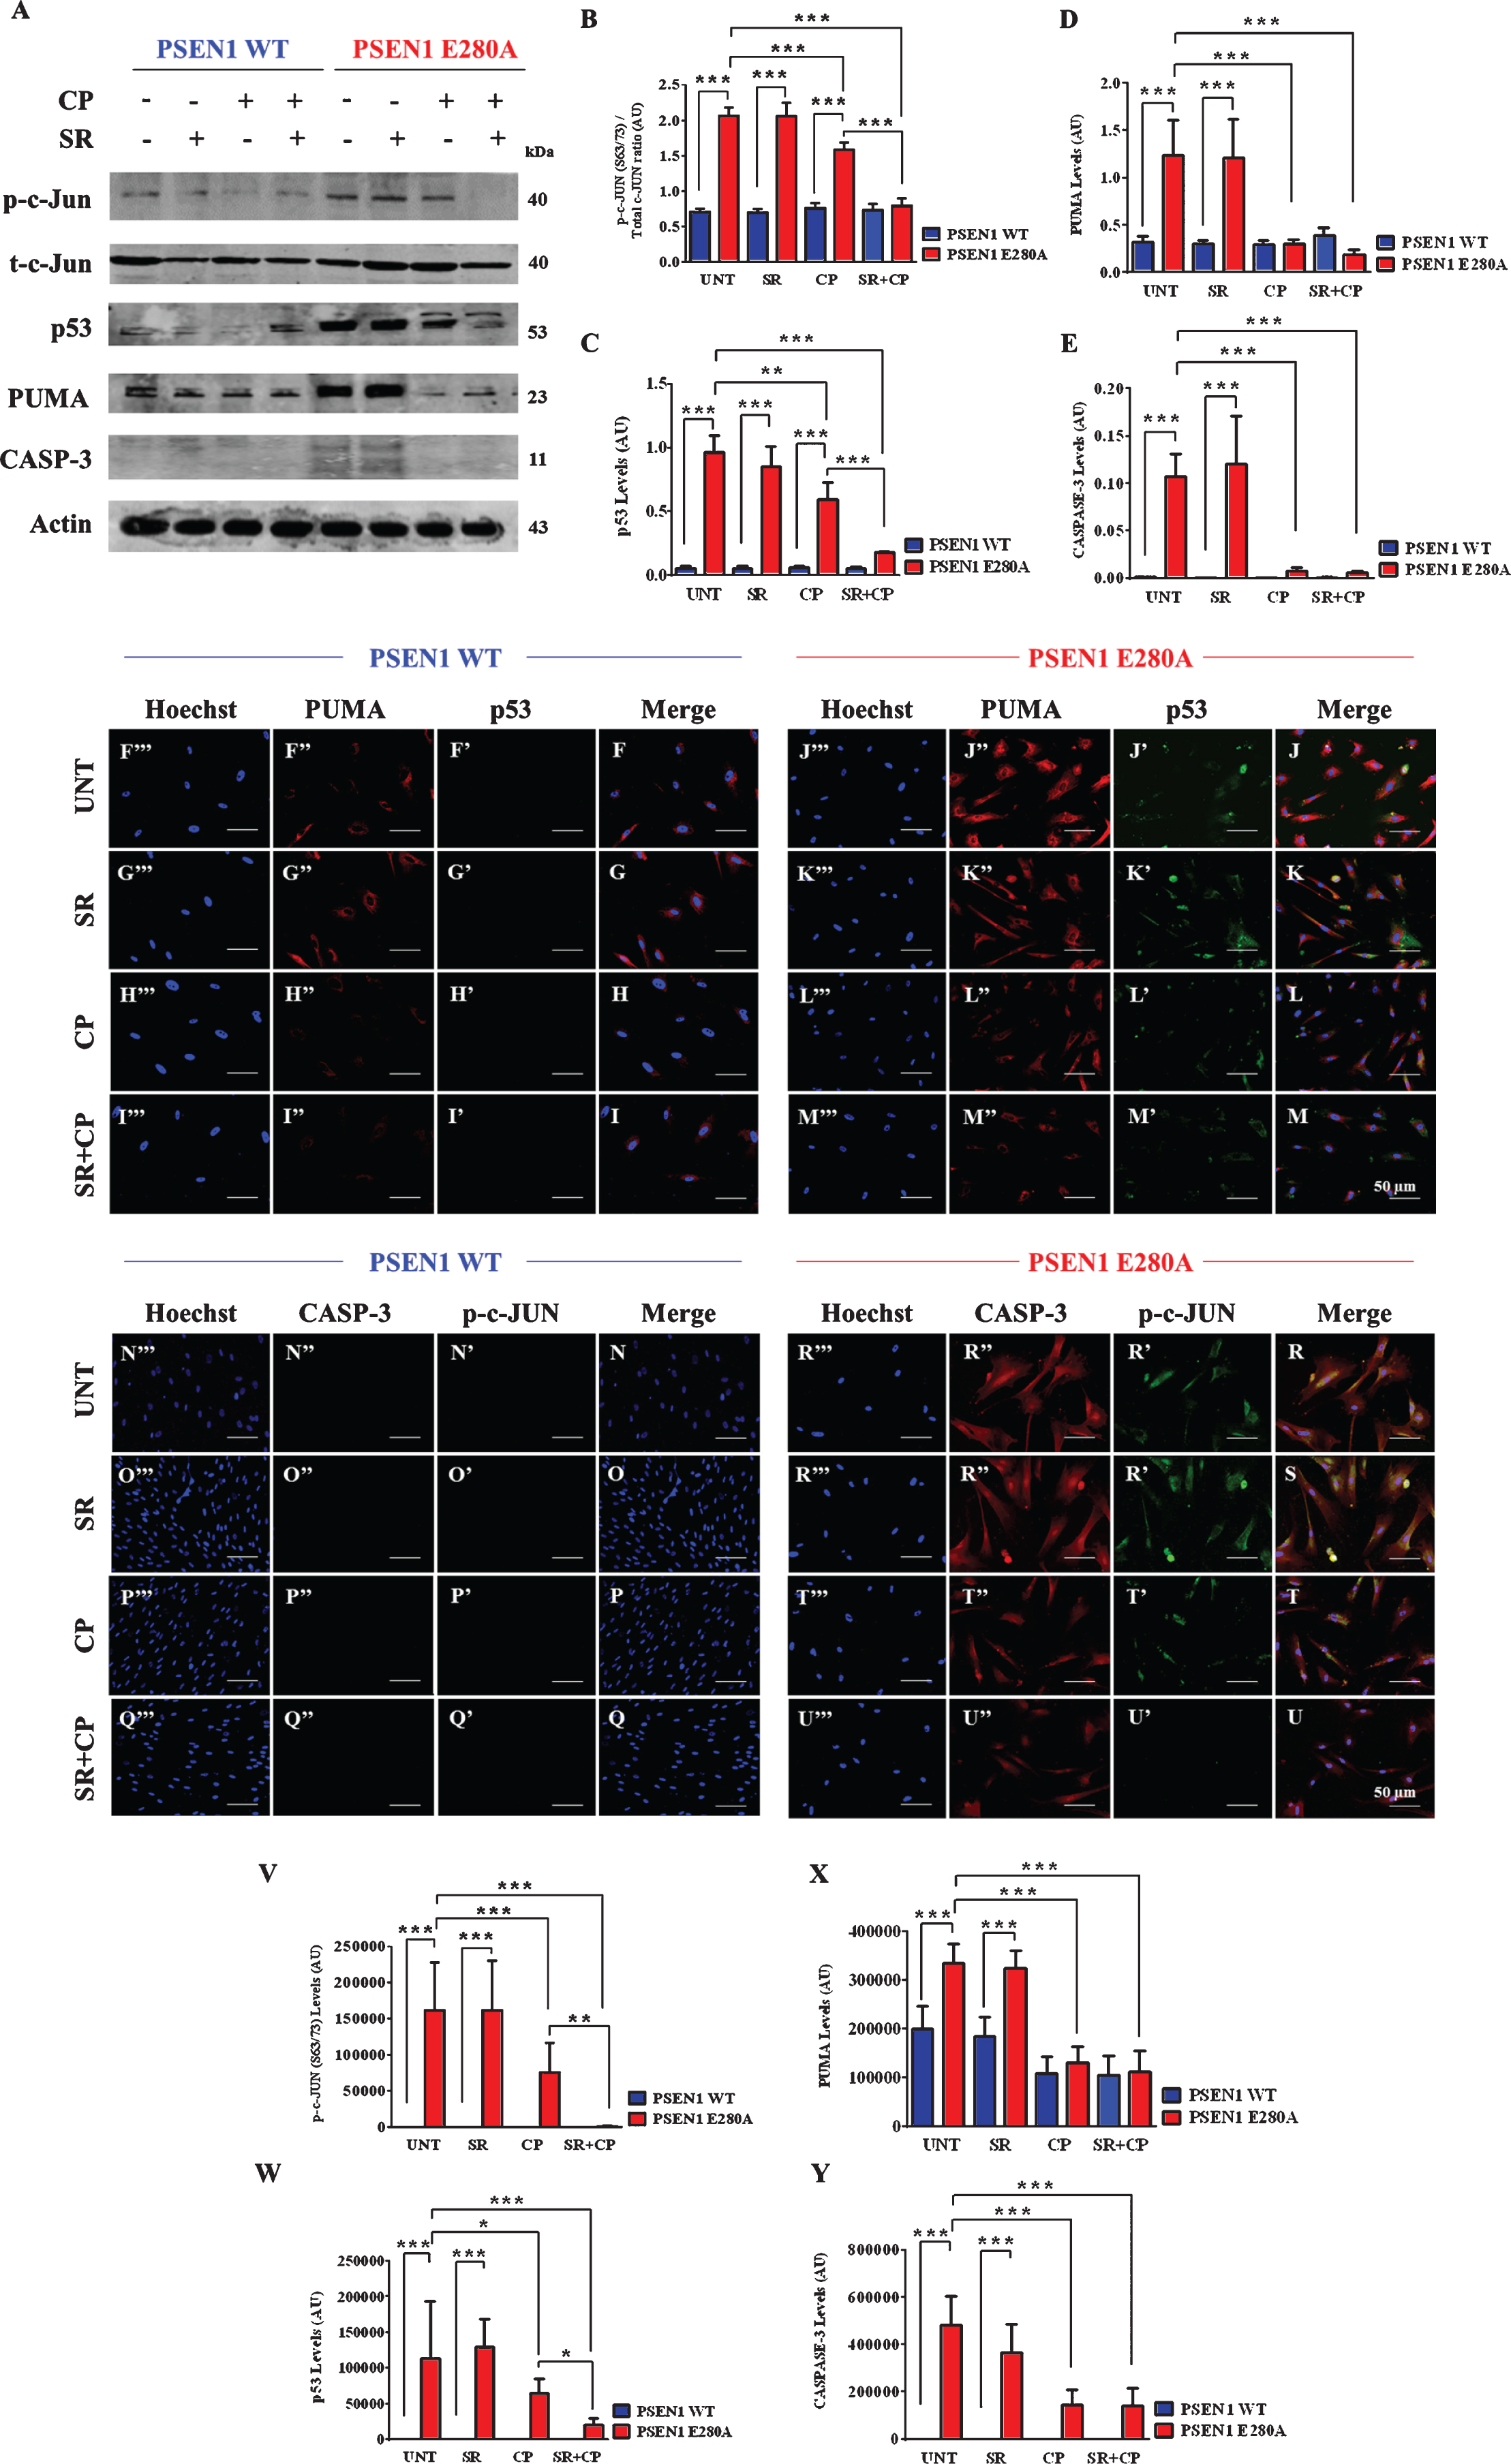
Cell death by apoptosis is a prominent feature in mutant ChLNs [16]. We used, therefore, the activation of the transcription factors p53 and c-Jun, pro-apoptotic BH3-only protein PUMA, and protease caspase-3 as apoptosis markers to examine the effect of CP and/or SR plus CP on those neuronal cells. Effectively, we confirmed that ChLNs displayed high levels of protein c-Jun (Fig. 4A, B), p53 (Fig. 4A, C), PUMA (Fig. 4A, D), and caspase-3 (Fig. 4A, E) in mutant but not in WT ChLNs (Fig. 4A–E). No significant difference was found between untreated and SR treatment for all the apoptosis markers in both types of cells. However, CP only or CP + SR significantly reduced c-Jun (Fig. 4A, B), p53 (Fig. 4A, C), PUMA (Fig. 4A, D), and caspase-3 (Fig. 4A, E) in PSEN1 E280A neurons when compared to untreated cells or WT ChLNs. Interestingly, mutant neurons exposed to CP + SR displayed almost basal levels of all proteins comparable to WT ChLNs. These observations were confirmed by fluorescent microscopy (Fig. 4F–Y).
Fig. 4
CP55940 reduced the activation of p53, PUMA, c-Jun, and caspase-3 independent of CB1Rs signaling in PSEN1 E280A ChLNs. After 7 days of transdifferentiation, WT PSEN1 and PSEN1 E280A ChLNs were left Untreated or treated with SR, CP, or SR + CP in regular culture medium for 4 days. After this time, the proteins in the extracts were blotted with primary antibodies against phosphorylated c-Jun (p-c-JUN)/total c-Jun, p53, PUMA, caspase-3 (CASP-3) and actin proteins. The intensities of the western blot bands shown in (A) were measured (B-E) by an infrared imaging system (Odyssey, LI-COR), and the intensity was normalized to that of actin. Additionally, cells were double-stained as indicated in the figure (F-U) with primary antibodies against p53 (green; F’-M’), PUMA (red; F”-M”), c-JUN (green; N’-U’), and CASP-3 (red; N”-U”). The nuclei were stained with Hoechst 33342 (blue; F”’-U”’). V-X) Quantification of c-JUN (V), p53 (W), PUMA (X), and CASP-3 (Y) fluorescence intensity. Data are expressed as the mean±SD; *p < 0.05; **p < 0.01; ***p < 0.001. The blots and figures represent 1 out of 3 independent experiments. Image magnification, 200×.
CP55940 inhibits tau phosphorylation in a CB1Rs-independent fashion PSEN1 E280A ChLNs
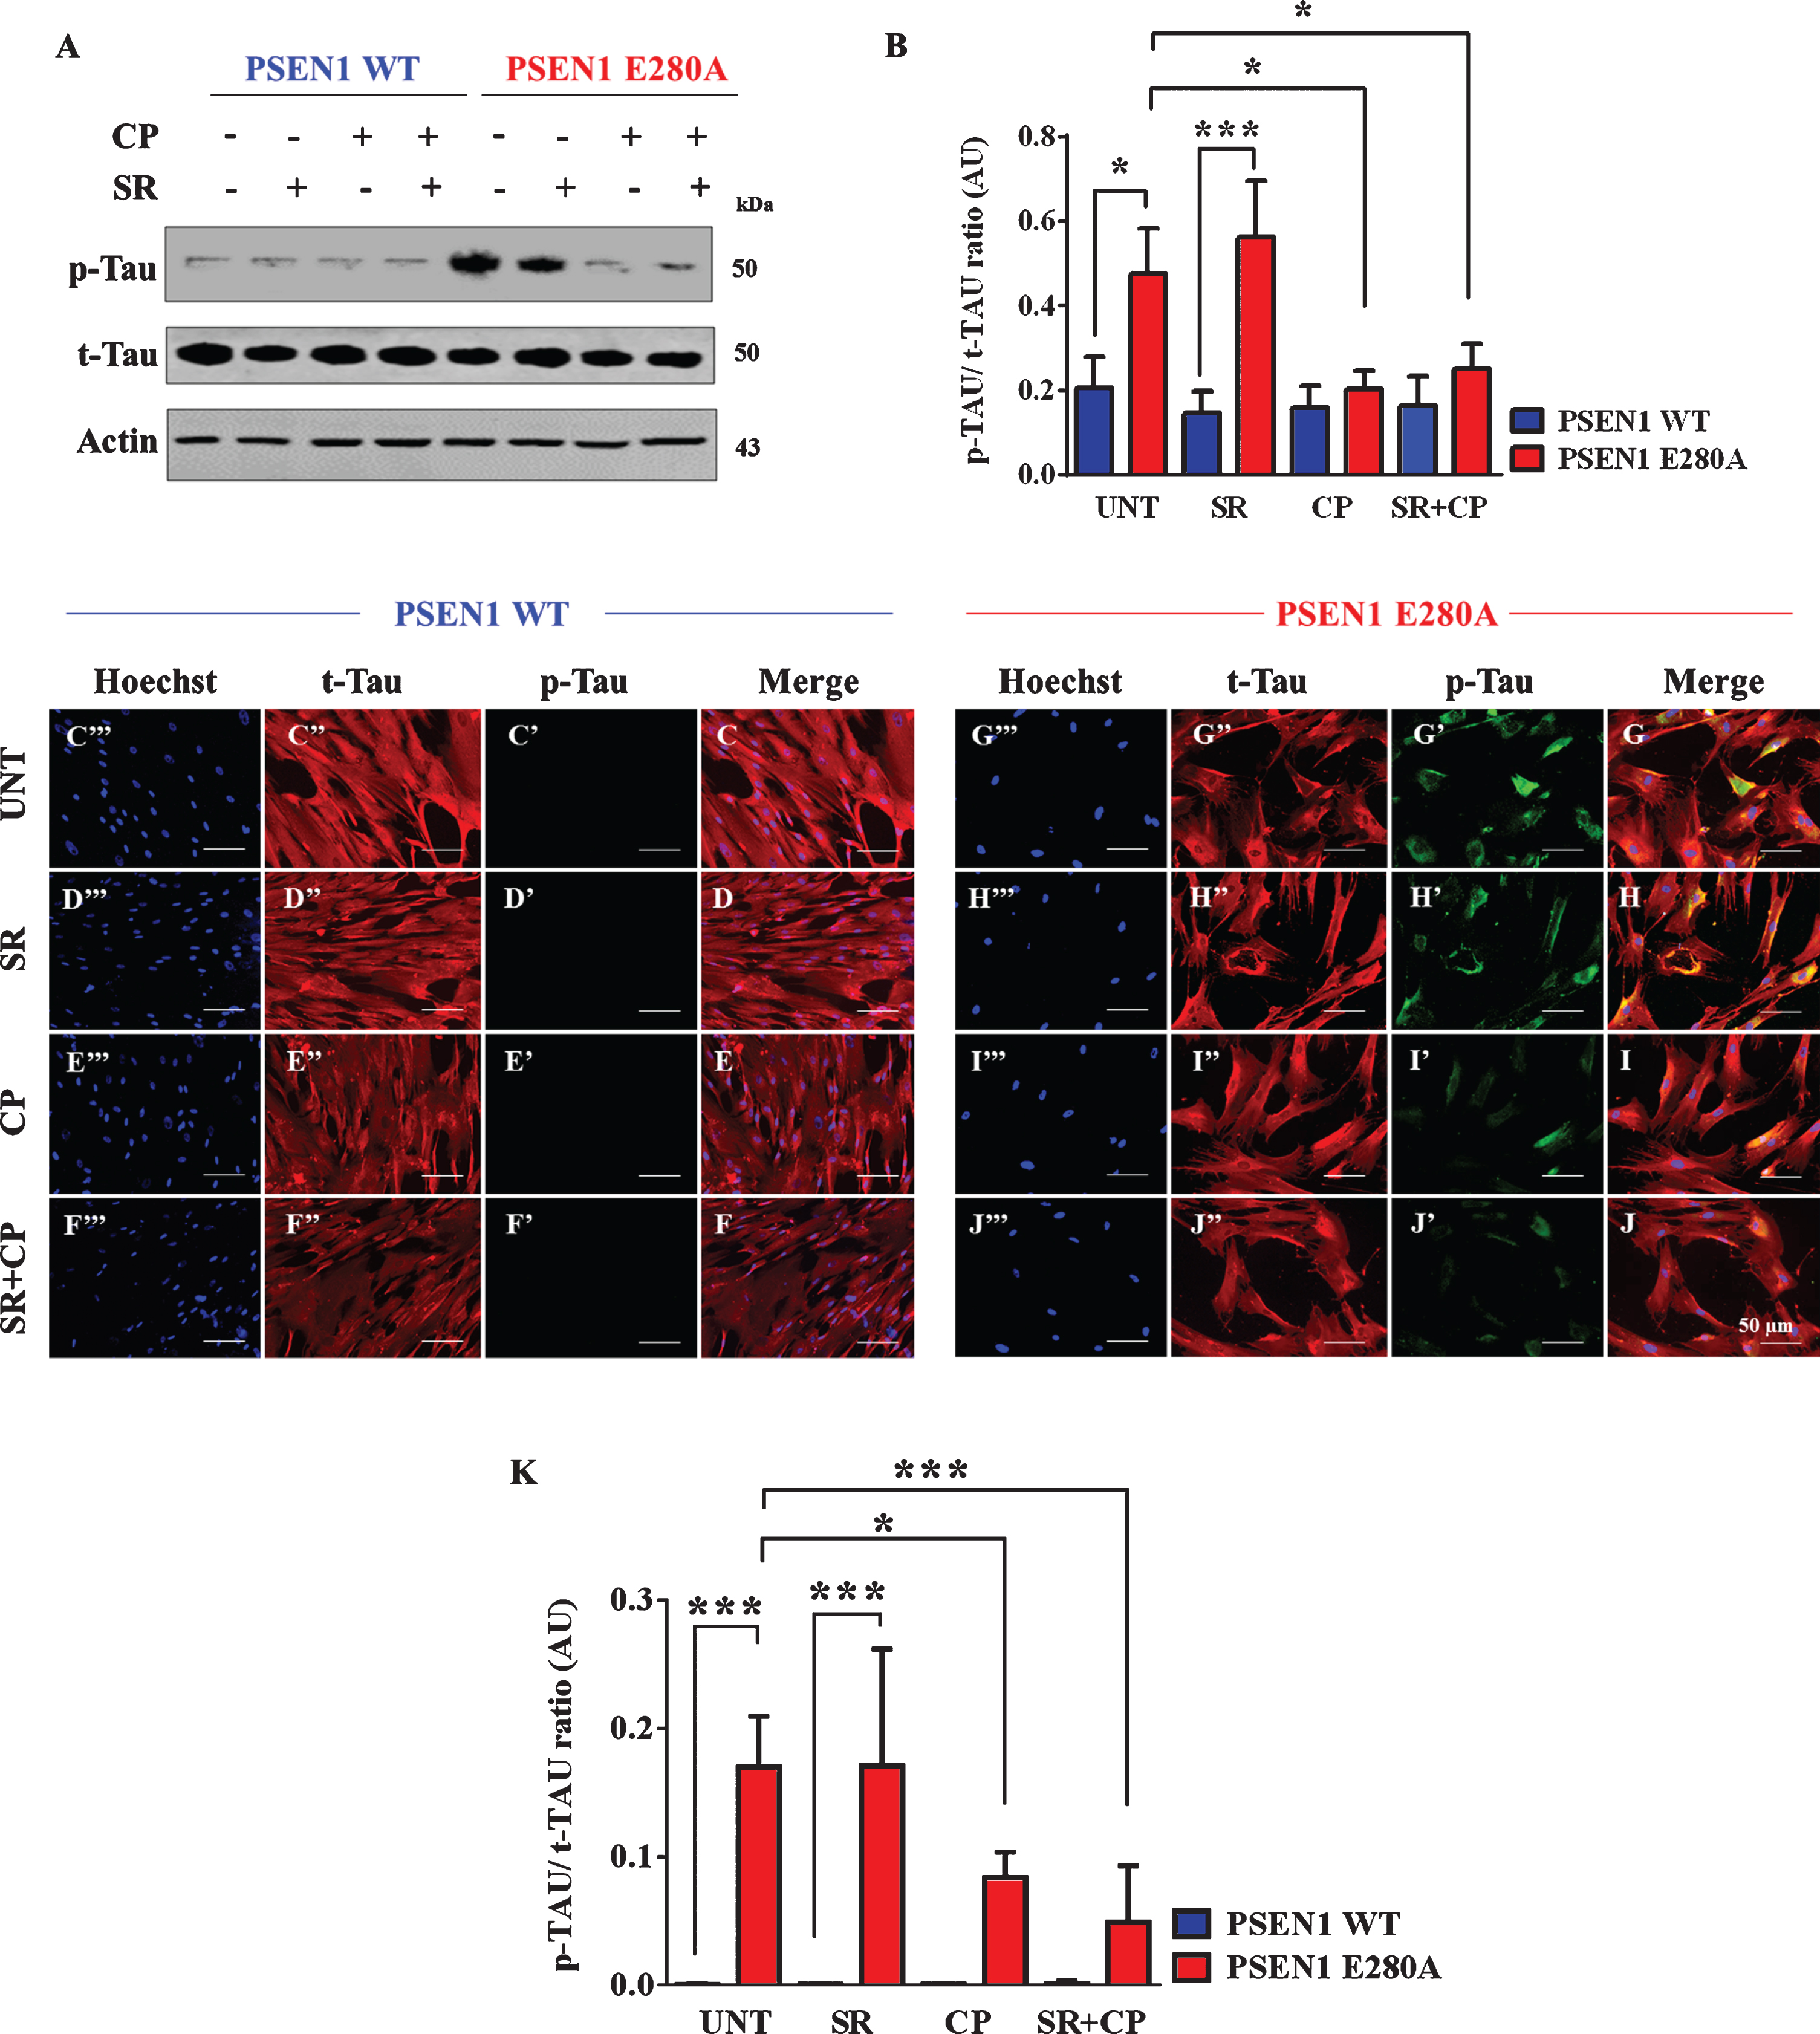
It has been established that intracellular sAβPPβf induce phosphorylation of tau [16]. We then investigated whether CP could inhibit tau phosphorylation in PSEN1 E280A ChLNs. As shown in Fig. 5, while the level of tau phosphorylation was detected to a similar extend in WT ChLNs under any experimental conditions (Fig. 5A, B), CP or CP + SR cocktail dramatically reduced phosphorylation of protein tau when compared to untreated or SR only treatment in mutant ChLNs (Fig. 5A, B). No statistically differences were observed between CP and CP + SR treatments in mutant ChLNs (Fig. 5B). These observations were confirmed by fluorescent microscopy (Fig. 5C–K).
Fig. 5
CP55940 reduced the phosphorylation of tau protein independent of CB1Rs in PSEN1 E280A ChLNs. After 7 days of transdifferentiation, WT PSEN1 and PSEN1 E280A ChLNs were left untreated or treated with SR, CP, or SR + CP in regular culture medium for 4 days. After this time, the proteins in the extracts were blotted with primary antibodies against phosphorylated tau (p-Tau), total tau (t-Tau), and actin proteins. The intensities of the western blot bands shown in (A) were measured (B) by an infrared imaging system (Odyssey, LI-COR), and the p-Tau/t-Tau ratio was normalized to that of actin. Additionally, cells were double-stained as indicated in the figure (C-J) with primary antibodies against p-Tau (green; C’-J’) and t-Tau (red; C”-J”). The nuclei were stained with Hoechst 33342 (blue; C”’-J”’). K) Quantification of the p-Tau/t-Tau fluorescence ratio. Data are expressed as the mean±SD; *p < 0.05; **p < 0.01; ***p < 0.001. The blots and figures represent 1 out of 3 independent experiments. Image magnification, 200×.
CP55940 reduces the levels of eAβ42 protein fragment independent of CB1Rs in PSEN 1 E280A ChLNs
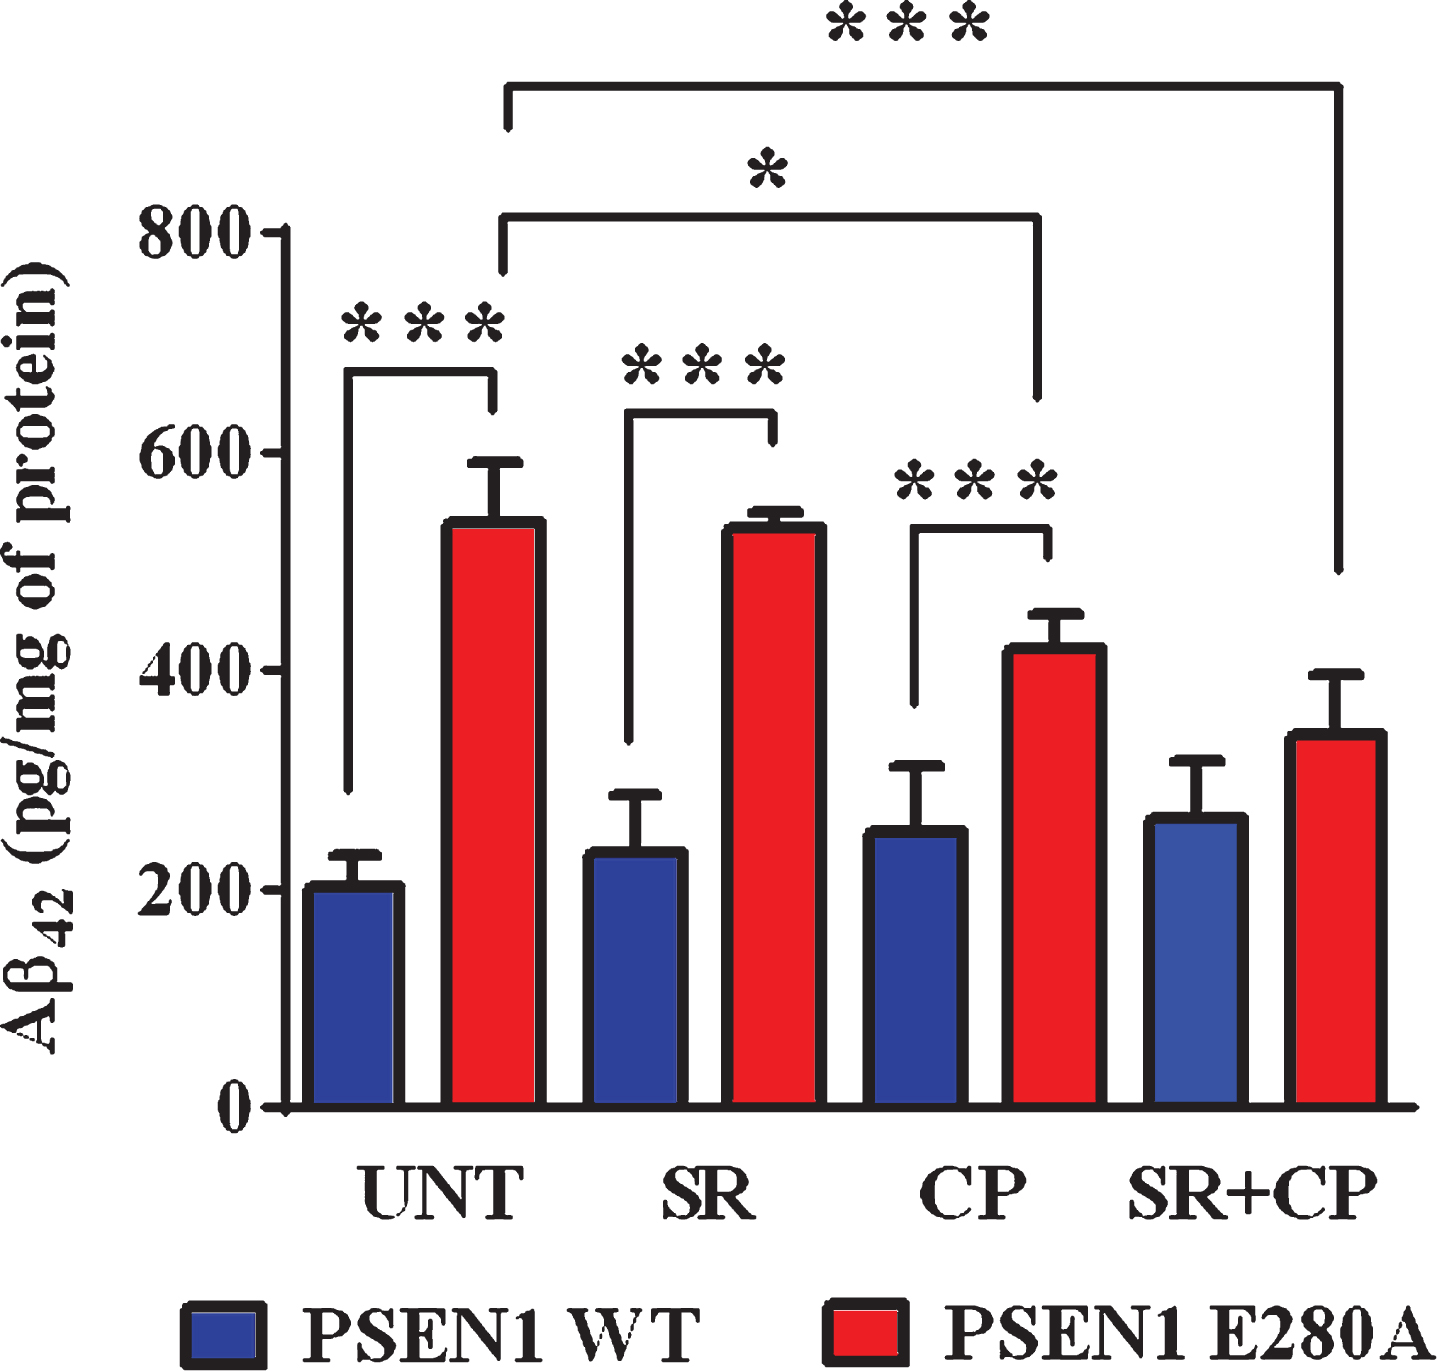
Based on the observation that CP inhibited the intracellular aggregation of sAβPPβf (see Fig. 3), we assessed whether CP could have the same effect on eAβ42 [16]. Effectively, CP and CP + SR but not SR only significantly diminished the amounts of eAβ42 compared to untreated neurons in mutant ChLNs according to the ELISA technique (Fig. 6). No statistically differences were observed between CP and CP + SR treatments in mutant ChLNs (Fig. 6). The amount of eAβ42 was not affected by any of the treatments in WT ChLNs (Fig. 6).
Fig. 6
CP55940 reduced the levels of extracellular Aβ42 peptide in PSEN1 E280A ChLNs by a CB1R-independent mechanism. After 7 days of transdifferentiation, WT PSEN1 and PSEN1 E280A ChLNs were left untreated or treated with SR, CP, or SR + CP in RCm for 4 days. ELISA quantification of extracellular Aβ42 peptide in supernatants. Data are presented as means±SD. *p < 0.05; **p < 0.01; ***p < 0.001. The histograms and figures represent 1 out of 4 independent experiments.
CP55940 does not recover Ca2+ dysregulation in PSEN1 E280A ChLNs
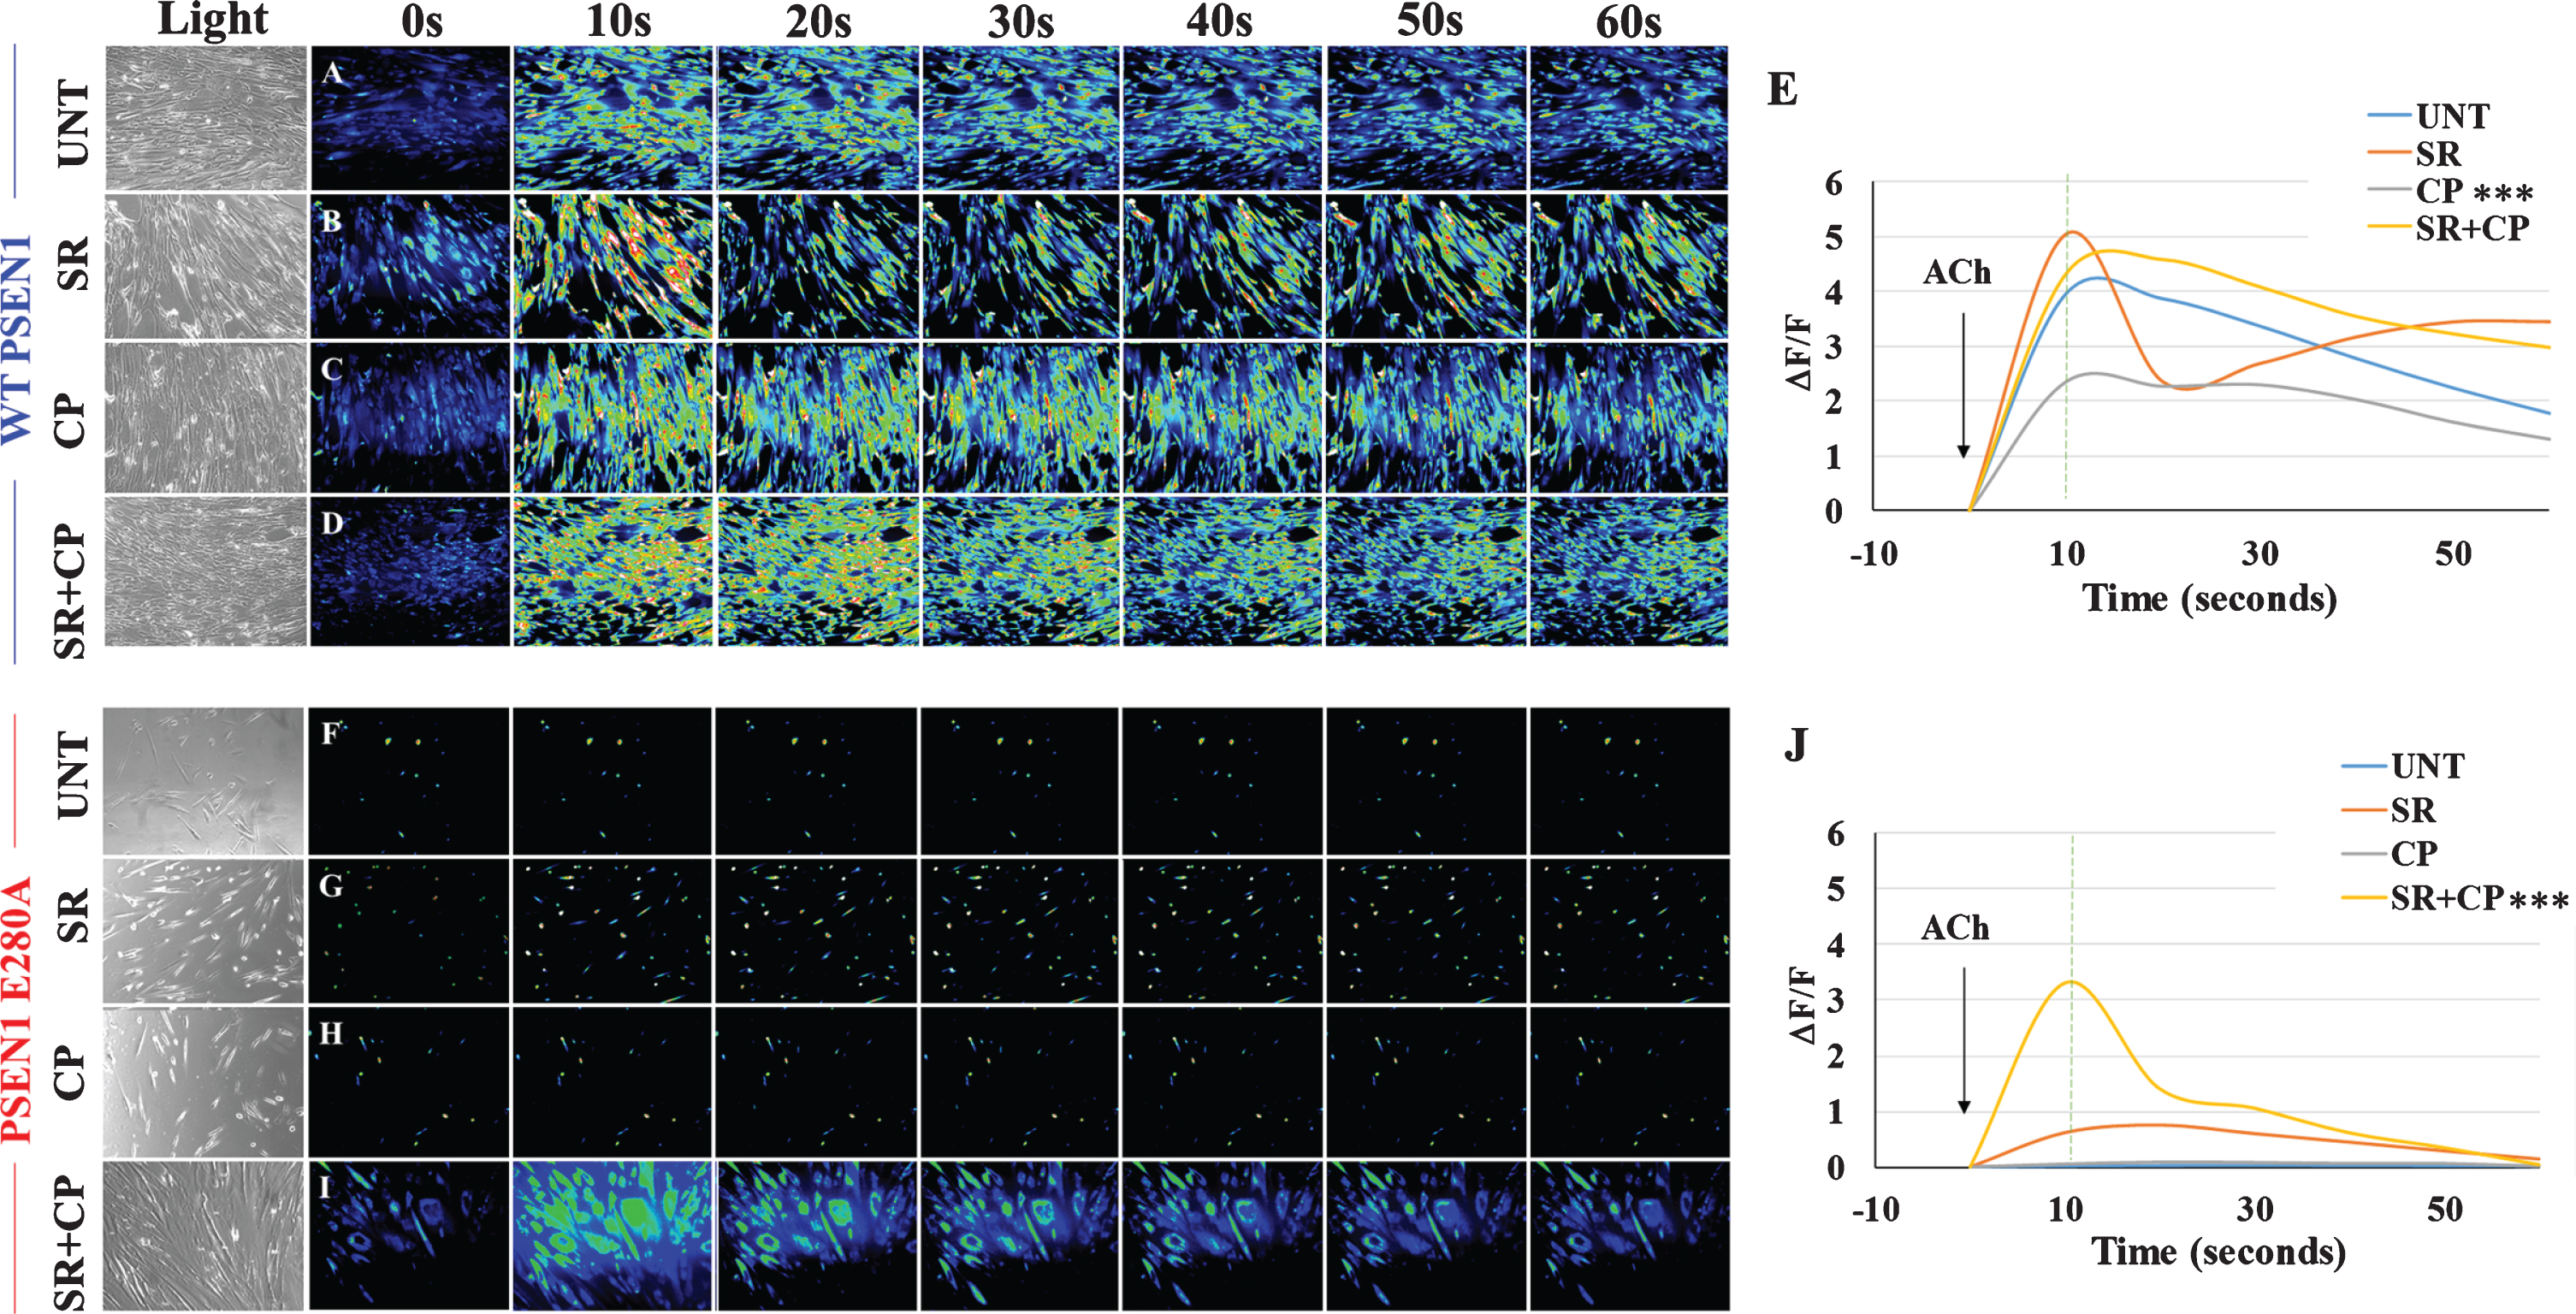
The above observations prompted us to test whether CP could ameliorate the physiological response of mutant ChLNs to ACh neurotransmitter stimuli. As expected, ACh induced a transient elevation of intracellular Ca2+ in WT ChLNs (control, the average maximum fluorescence change (ΔF/F) was 3.95±0.19 at 10 s (n = 20 ChLN cells imaged, N = 3 dishes were used as a standard condition in this and following experiments) according to cytoplasmic Ca2+ responses to Fluo-3-mediated imaging (Fig. 7A, E). We found no statistical differences between SR (Fig. 7B, E, ΔF/F = 5.05±0.35), SR + CP (Fig. 7D, E; ΔF/F = 4.31±0.26) and untreated conditions (Fig. 7E). In contrast, CP only and ACh significantly depressed intracellular Ca2+ (by –68%) in WT ChLNs (Fig. 7C, E, ΔF/F = 2.35±0.12). When mutant neurons were exposed to ACh only (Fig. 7F, J, ΔF/F = 0.02±0.00) and CP (Fig. 7H, J, ΔF/F = 0.06±0.00), mutant cells were irresponsive to both stimuli (Fig. 7J). Interestingly, while SR only slightly increased intracellular Ca2+ (Fig. 7G, J, ΔF/F = 0.63±0.07), the CP + SR cocktail and ACh increased inflow Ca2+ (Fig. 7H, J, ΔF/F = 3.32±0.23) in PSEN 1 E280A ChLNs to similar extend as [Ca2+]i in WT ChLNs (Fig. 7E, J).
Fig. 7
CP55940 does not recover Ca2+ dysregulation in PSEN1 E280A ChLNs. After 7 days of transdifferentiation, WT PSEN1 and PSEN1 E280A ChLNs were left untreated or treated with SR, CP, or SR + CP in regular culture medium for 4 days. A-D, F-I) Time-lapse images (0, 10, 20, 30, 40, 50, and 60 s) of Ca2+ fluorescence in WT PSEN1 and PSEN1 E280A ChLNs on day 4 in response to ACh treatment. ACh was puffed into the culture at 0 s (arrow). Then, the Ca2+ fluorescence of the cells was monitored at the indicated times. Color contrast indicates fluorescence intensity: dark blue < light blue < green<yellow<red. E, J) Normalized mean fluorescence signal (ΔF/F) over time from the cells indicating temporal cytoplasmic Ca2+ elevation in response to ACh treatment. Data are presented as the mean±SD. *p < 0.05; **p < 0.01; ***p < 0.001 compared to UNT. The histograms and figures represent 1 out of 3 independent experiments. Image magnification, 200×.
Anti-Aβ42 antibodies completely recuperate Ca2+ influx in PSEN1 E280A ChLNs
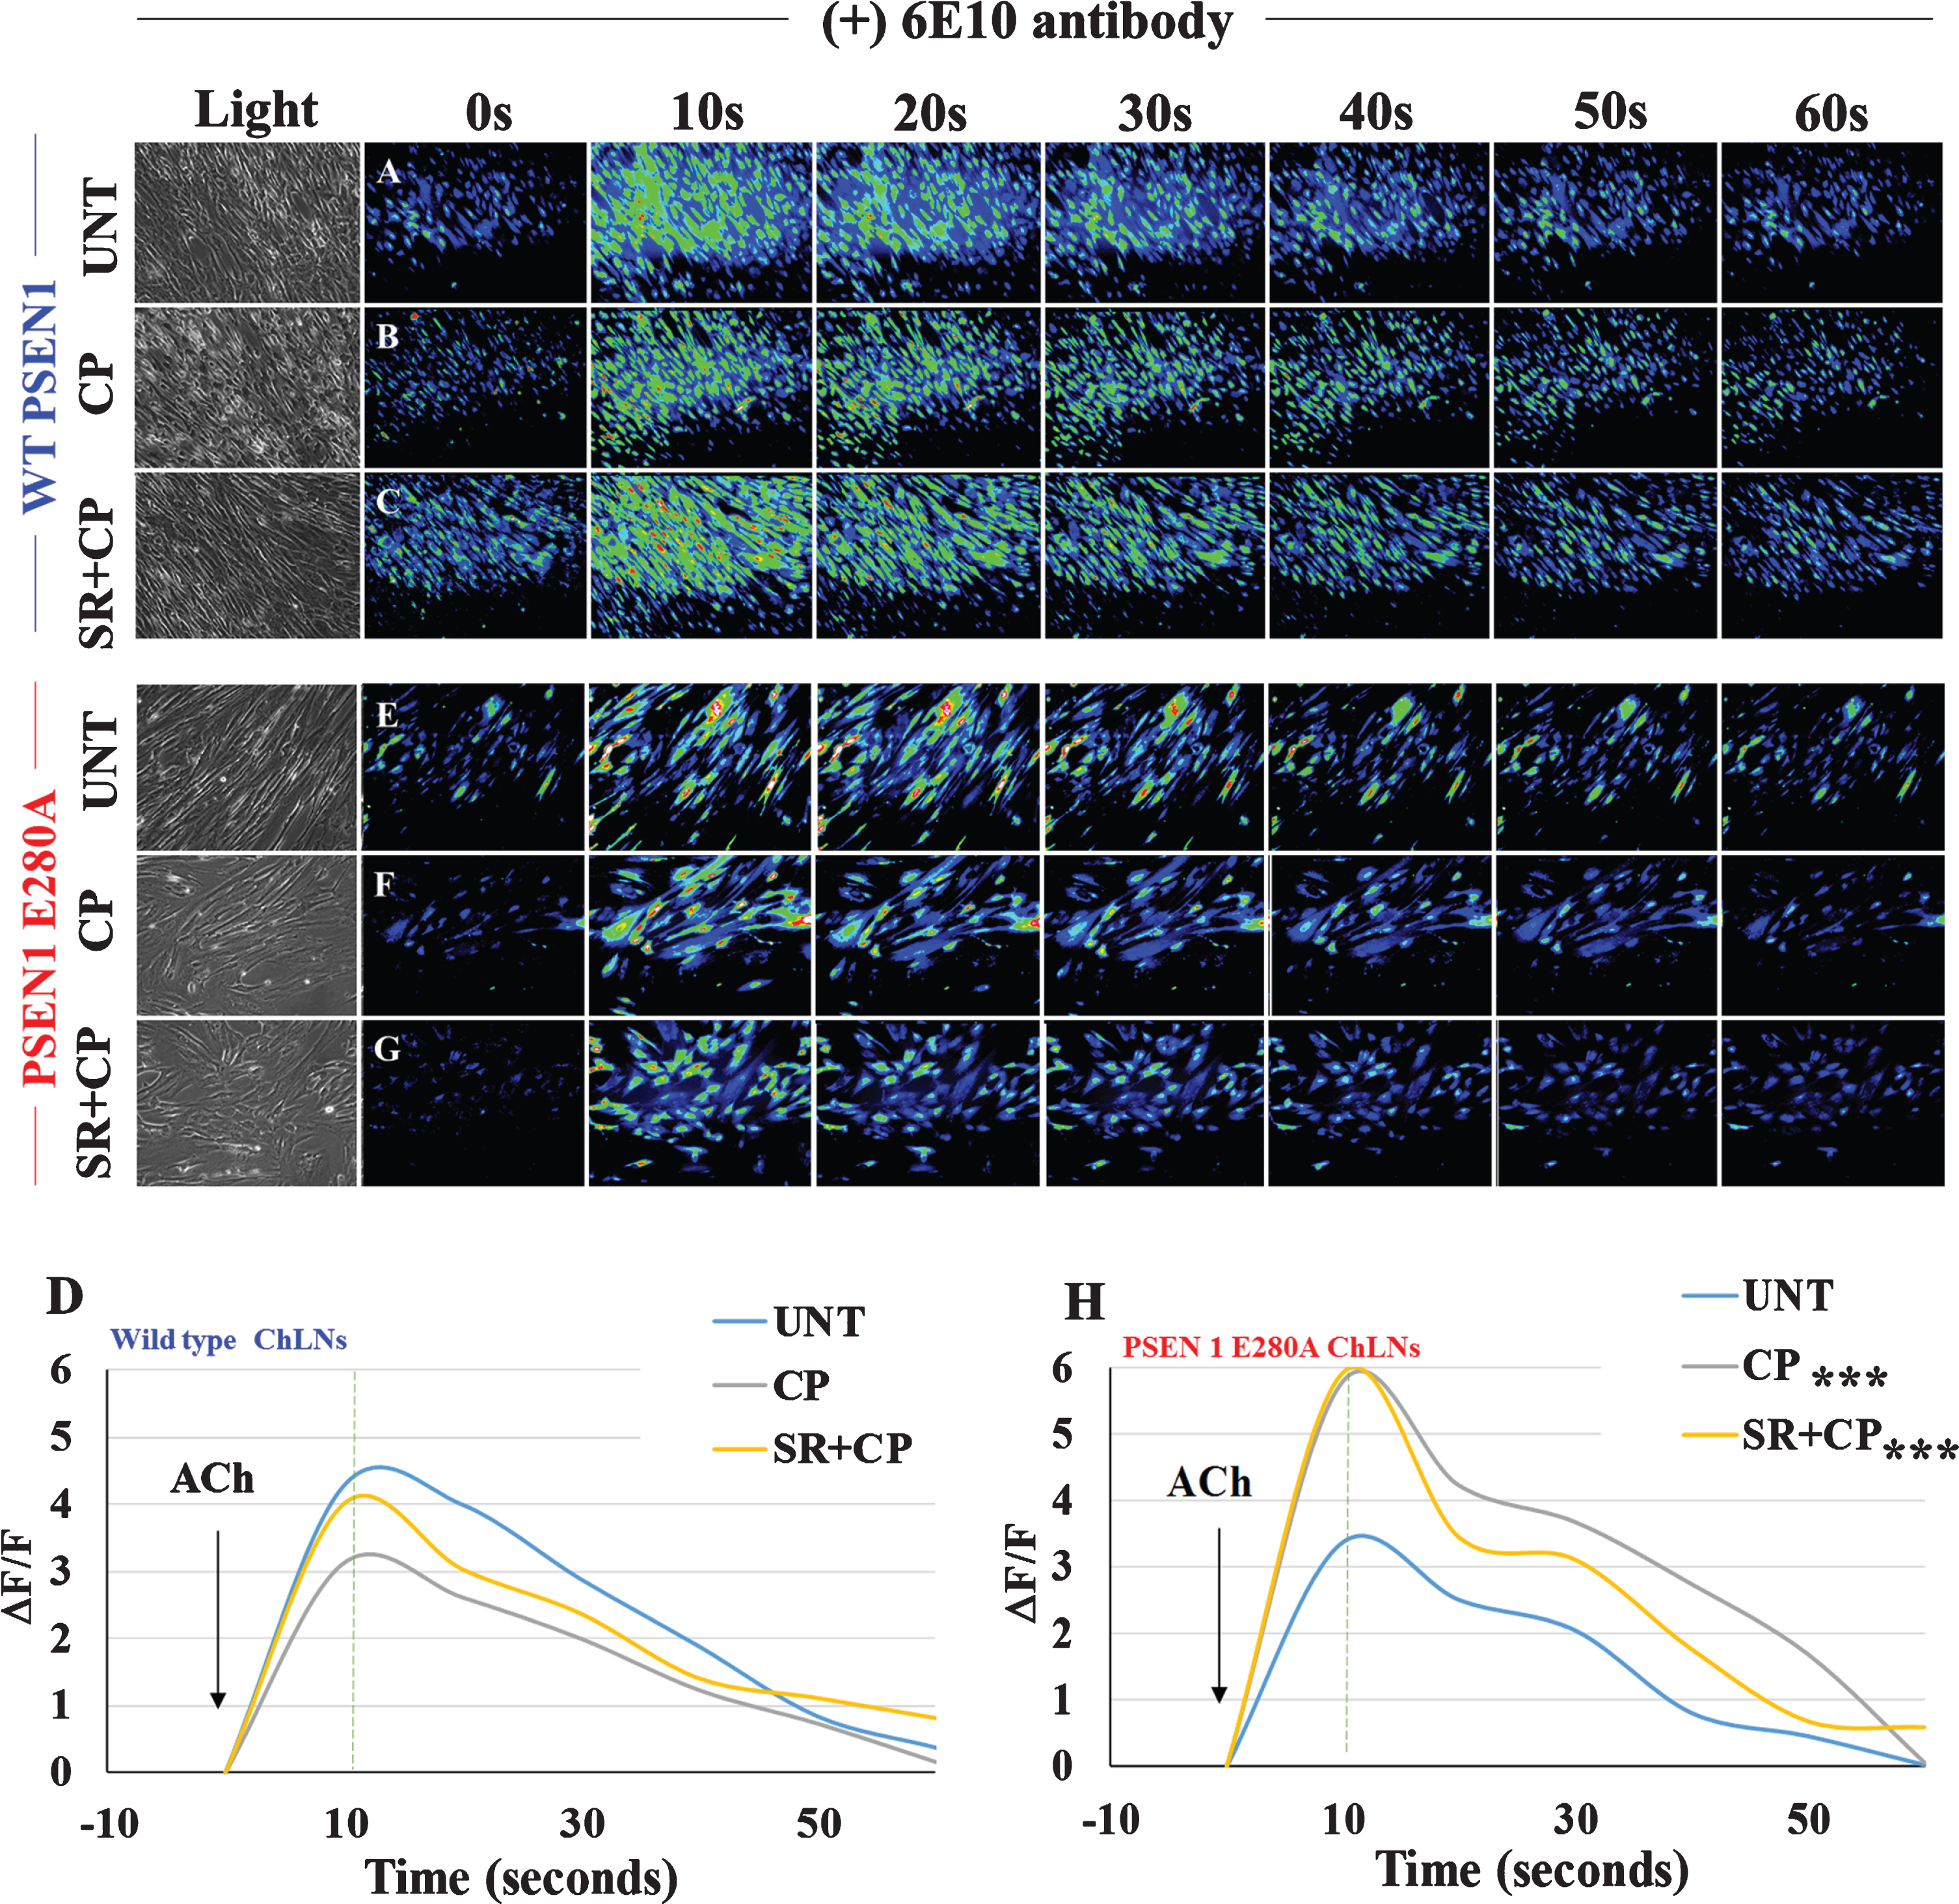
Since PSEN1 E280A ChLNs response to ACh decline in a time-dependent fashion [16], and since SR alone treatment was innocuous for WT and E280A ChLNs, we evaluated whether early inhibition of eAβ42 by anti-Aβ antibodies could ameliorate the mutant ChLNs response to ACh under CP and CP + SR treatments. As shown in Fig. 8, incubation of WT with anti-Aβ antibody 6E10 only (Fig. 8A, D; ΔF/F = 4.27±0.21) or in the presence of CP (Fig. 8B, D; ΔF/F = 3.11±0.25) or CP + SR (Fig. 8C, D; ΔF/F = 4.01±0.20) showed similar transient intracellular Ca2+. We found no statistical differences between those treatments (Fig. 8D). Remarkably, ACh and the anti-Aβ antibody 6E10 completely recovered Ca2+ influx in mutant ChLNs (Fig. 8E, H; ΔF/F = 3.37±0.20). The anti-Aβ antibody 6E10 and CP (Fig. 8F, H; ΔF/F = 5.78±0.87) and antibody + CP + SR (Fig. 8G, H; ΔF/F = 5.93±0.29) dramatically induced a transient elevation of intracellular Ca2+ in mutant ChLNs (Fig. 8H).
Fig. 8
CP55940 plus SR and anti-Aβ42 antibody 6E10 completely recover Ca2+ influx in PSEN1 E280A ChLNs. After 7 days of transdifferentiation, WT PSEN1 and PSEN1 E280A ChLNs were incubated with 6E10 antibody as described in Materials and Methods section. Simultaneously cells were left untreated or treated with CP or SR + CP in RCm for 4 days. A-C, E-G) Time-lapse images (0, 10, 20, 30, 40, 50, and 60 s) of Ca2+ fluorescence in WT PSEN1 and PSEN1 E280A ChLNs at day4 in the presence of 6E10 antibody as a response to ACh treatment. ACh was puffed into the culture at 0 s (arrow). Then, the Ca2+ fluorescence of the cells was monitored at the indicated times. Color contrast indicates fluorescence intensity: dark blue < light blue < green<yellow<red. D, H) Normalized mean fluorescence signal (ΔF/F) over time from the cells indicating temporal cytoplasmic Ca2+ elevation in response to ACh treatment. Data are presented as means±SD. *p < 0.05; **p < 0.01; ***p < 0.001 compared to UNT. The histograms and figures represent 1 out of 3 independent experiments. Image magnification, 200×.
DISCUSSION
In the present investigation, we demonstrate that CP inhibits the aggregation of (i)sAβPPβf, and p-Tau, increases ΔΨm, inhibits the generation of ROS and oxidation of DJ-1Cys106-SH to DJ-1Cys106-SO3, blocks the activation of the transcription factor p53 and c-Jun, pro-apoptotic protein PUMA, and protease caspase-3—all markers of cell death by apoptosis, and reduce eAβ42 in a CB1R-dependent and-independent fashion in PSEN1 E280A ChLNs, used as a neuronal cell model of FAD [16]. Although CP was unable to reverse the Ca2+ influx dysregulation as a response to ACh stimuli, it is demonstrated that CP affects several cellular molecular targets. Several observations support these assumptions. First, in agreement with previous work [27], we found that CP reduced OS by directly scavenging ROS (e.g., H2O2) [22–28] and partially diminished ROS through CB1Rs signaling. These observations may indicate that CP operates in a dual-way: as an antioxidant and as a CB1Rs ligand. Second, CP dramatically increases the ΔΨm in PSEN1 E280A ChLNs. Several data indicate that CP and other cannabinoids (e.g., THC, arachidonyl-2-chloroethylamide) can protect mitochondria against OS stimuli by inhibition of mitochondria permeability transition pore (mPTP) opening [37] or through activation of mitochondrial (mt)CB1Rs [38, 39]. Even though, mtCB1Rs activation have been linked to an intra-mitochondrial signaling cascade involving lessening of the activity of the electron transport system, oxygen consumption, and ATP production [40], our data favor the view that inhibition of mPTP opening by CP might be responsible for neuroprotective action on mutant ChLNs [37]. Indeed, it has been shown that the CB2 agonist JWH-015 attenuated mitochondrial damage against OS stimuli by scavenging anion superoxide radical (O2. -) and H2O2, maintaining ΔΨm and avoiding Ca2+-induced mitochondrial swelling [37]. Additionally, CP may indirectly protect mitochondria by blocking the interaction of sAβPPβf and mitochondrial respiratory complexes [41, 42] or by inhibition of mitochondria-targeted pro-apoptotic proteins (e.g., PUMA, this work). Taken together our findings suggest that CP reverses the loss of ΔΨm and mitochondria damage independently of plasma membrane CB1 receptors or (mt)CB1Rs. Third, it is known that cannabinoids (e.g., THC) stimulate the removal of intracellular Aβ through a dependent [43] or independent CB1Rs mechanism [22]. Here, we report for the first time that CP inhibits the aggregation of (i)sAβPPβf in PSEN1 E280A ChLNs independently of CB1 receptor signaling. Since Aβ42 is still detected extracellularly in mutant neurons treated with CP, it might imply that this cannabinoid does not interfere with the AβPP metabolism. Finally, CP significantly diminished oxidation of protein DJ-1, as evidence of OS. Because DJ-1Cys106SH residue is specifically sensible to H2O2 oxidation [44], it is likely that CP might directly interact with ROS or induces its suppression via CB1Rs activation. Taken together our results comply with the view that early aggregation of (i)sAβPPβf and generation of H2O2 can be blocked by the direct action of cannabinoid CP and by partial activation of CB1Rs, respectively.
Recent data have shown that (i)sAβPPβf (/H2O2) induce activation of JNK/c-Jun and p53, which in turn activate PUMA and caspase-3 [16]. Interestingly, we found that CP blocks activation of transcription factors c-Jun, p53, PUMA, and caspase-3 independently of CB1Rs stimulation. These observations suggest that CP exerted a direct role in protecting PSEN1 E280A ChLNs against endogenously OS-induced cell death signaling. Since downregulation of c-Jun and p53 may reduce transcription of PUMA [45–47], CP may restrain mitochondria from leaking pro-apoptogenic proteins such as caspase-9, and ensuing activation of caspase-3. These actions avoid neuronal dismantling and increase the survival of mutant ChLNs.
Previously, it has been shown that (i)sAβPPβf induces p-Tau through JNK kinase in PSEN 1 E280A ChLNs [16]. In this work, we demonstrate that CP almost completely inhibits the phosphorylation of protein tau independently of CB1Rs. One possible explanation is that CP can suppress H2O2 generation, which serves as a messenger molecule that triggers activation of JNK [48, 49], and phosphorylation of tau [50]. It is therefore not surprising that p-Tau was untraceable in PSEN1 E280A ChLNs. However, we do not discard the possibility that CP blocks p-Tau by alternative CB1Rs-independent mechanisms in ChLNs [51].
Mounting evidence has demonstrated that eAβ is neurotoxic before the appearance of plaques [16, 52, 53]. Interestingly, CP reduced the amounts of eAβ42 in a CB1Rs-independent manner. This observation suggests that CP directly modulates intracellular and extracellular AβPP-derived protein fragments. However, the action of CP on eAβ42 did not impact on the response of mutant ChLNs to ACh stimuli. Here, we confirm that ACh receptors (AChRs) are physiologically altered in PSEN 1 E280A ChLNs [16] most probably through Aβ-induced inhibition of nicotinic (n)AChRs [54, 55], which normally revealed a rapid elevation of intracellular Ca2+ [56–58] as shown in WT ChLNs. Indeed, AChRs were irresponsive to ACh stimuli, thereby nullifying the transient rise of intracellular Ca2+ in mutant ChLNs (i.e., –99% reduction in [Ca2 +]i) compared to wild type ChLNs. On the other hand, CP decreased [Ca2 +]i by –68% in WT ChLNs. These observations suggest that CP either directly inhibited the function of AChRs [59, 60] and/ or inhibited the inflow of Ca2+ via activation of CB1Rs on calcium channels (e.g., T, N- and P/Q-type [20]). Since the response of PSEN 1 E280A ChLNs to ACh is already compromised, CP was not able to modify the influx of Ca2+ when challenged with the neurotransmitter. Interestingly, SR only or with CP increased [Ca2 +]i in PSEN 1 E280A ChLNs compared to untreated mutant ChLNs. This positive improvement of Ca2+ inflow was comparable to WT ChLNs (see CP + SR effect on neurons). These observations can be explained by the fact that SR can either stimulate Ca2+ influx through Ca2+ channels (e.g., Cav2: N-, P/Q channels [61]) or block the negative interaction of CP with nAChRs in WT ChLNs when exposed to ACh (this work). Our findings suggest that CB1Rs are marginally active in PSEN 1 E280A ChLNs. Interestingly; anti-Aβ42 antibody completely recovered transient intracellular Ca2+ signal in mutant ChLNs. The Ca2+ signal was further increased when neurons were co-cultured with CP only or SR plus CP. These last observations reinforce the view that Aβ42 and SR interfere with CP and AChRs. Similar to PSEN 1 E280A ChLNs, antibody anti-Aβ42 increased transient intracellular Ca2+ signals in WT ChLNs. These observations imply that eAβ42 secreted in low amounts by WT ChLNs or abnormally secreted in high amounts by mutant ChLNs is an AChRs regulator in ChLNs. Taken together these observations suggest that a combination of CP with anti-Aβ42 would be therapeutically beneficial to FAD patients.
Conclusion
In an attempt to modify the neuropathological expression of ChLNs bearing the mutation PSEN1 E280A (e.g., intracellular aggregation of sAβPPβf, tau phosphorylation, OS, apoptosis, and Ca2+ influx dysfunction) (Fig. 9A), we found that cannabinoid CP is a multi-target molecule that promotes the recovery FAD cholinergic neurons by increasing ΔΨm, impedes phosphorylation of protein tau, and blocks OS-induced apoptosis signaling (Fig. 9B). However, CP was unable to modify the neuronal functionality as evidenced by an inability of ACh to increase Ca2+ influx in PSEN1 E280A ChLNs. Since the nature of the neuronal cholinergic dysfunctionality stems from the blocking of nAChRs by Aβ42 [54, 55], drugs that interfere with the interaction of Aβ and the AChRs might ameliorate the ligand-gated ion Ca2+ channel interactions (e.g., [62]). In this respect, we show that anti-Aβ42 antibody 6E10 plus CP or anti-Aβ42 and SR + CP change mutant ChLNs response to ACh by increasing Ca2+ influx to similar [Ca2+]i in WT ChLNs (Fig. 9C, D). It is therefore proposed that combinations of cannabinoids, anti-Aβ42 antibodies (e.g., crenezumab [63, 64]), and CB1 inverse agonists might be a promising multi-target drugs for therapy [65] in the early treatment of FAD PSEN 1 E280A ChLNs neurodegeneration.
Fig. 9
Schematic representation of the protective effect of CP55940 on PSEN 1 E280A ChLNs. A) Intracellularly accumulation of sAβPPβf (step 1) generates H2O2 (s2), which in turn oxidized the OS sensor protein DJ-1 at Cys-106-SH residue into DJ-1Cys106-SO3 (s3) and activates a domino-like pro-death signaling mechanism by triggering kinases (s4, e.g., ASK1) and JNK kinase (s5). This last kinase phosphorylates protein tau (s6) and activates the transcription factors c-Jun (s7) and p53 (s8). Both transcription factors transcribe the BH-3-only protein PUMA (s9), which together with other pro-apoptosis proteins (e.g., BAX), it induces depolarization of mitochondria, opening of the mitochondrial transition pore, and loss of mitochondrial membrane potential (ΔΨm, s10). Damage of mitochondria potential provokes the release of pro-apoptogenic protein cytochrome C, ensuing activation of caspase-3 (s11). In turn, this protease activates the endonuclease DFF40 by cleaving the nuclease’s inhibitor DFF45. Finally, DFF40 causes the nuclear chromatin fragmentation, typical of apoptosis (s12). Additionally, ChLNs do not respond to ACh stimuli, i.e., intracellular transient Ca2+ increase is missing due to extracellular interaction between Aβ42 (eAβ42) and nicotinic (n)ACh receptors (s13). The sAβPPβf-induced process (s1-s13) leads ChL neurons to structural alterations (e.g., aggregation/ hyperphosphorylation of protein tau), cell death (apoptosis) and intracellular Ca2+ dysfunction. B) Upon exposure to CP55940 (CP), ChLNs show normal features such as no oxidized protein DJ-1 (s3), unaltered ΔΨm (s10), and intact nuclei morphology (s12). Moreover, CP inhibits aggregation of sAβPPβf (s1), and blocks generation of H2O2 (s2) most probably by quenchinganion superoxide radicals (O2.―). As a consequence, no further activation of kinases (s4, s5), phosphorylation of protein tau (s6), and c-Jun(s7), and activation of p53 (s8), PUMA (s9), and caspase-3 (s11) occurs in PSEN1 E280A ChLNs just leaving mitochondria and nuclei unchanged from sAβPPβf-induced damage. C) Since nAChRs are blocked by eAβ42 (s13), CP was unable to modify the response of mutant ChLNs to ACh (inset graph i). Interestingly, the CB1 and CB2 receptor inverse agonists SR141716 plus SR144528 ( = SR) only or in the presence of CP induce a significant increase in intracellular Ca2+ (s14) most probably through activation of Ca2+ channels (s15 and inset graph i). D) When mutant ChLNs were exposed to CP, SR, and anti-Aβ42 antibody 6E10 (s16), the mixture induced a dramatic increase in the transient intracellular Ca2+ flow (s13, s17 and inset graph ii).
ACKNOWLEDGMENTS
This study was funded by MinCiencias grant # 1115-844-67062, contract #830-2019 to CV-P, MJ-Del-Rio, and MM-P. VS-M is a doctoral student of the Basic Biomedical Sciences Academic Corporation program at the Universidad de Antioquia (UdeA) funded by the “2019 Bicentennial Doctoral Excellence Scholarship”, MinCiencias-Colombia.
Authors’ disclosures available online (https://www.j-alz.com/manuscript-disclosures/20-1045r2).
REFERENCES
[1] | Long JM , Holtzman DM ((2019) ) Alzheimer disease: An update on pathobiology and treatment strategies. Cell 179: , 312–339. |
[2] | Hampel H , Mesulam MM , Cuello AC , Farlow MR , Giacobini E , Grossberg GT , Khachaturian AS , Vergallo A , Cavedo E , Snyder PJ , Khachaturian ZS ((2018) ) The cholinergic system in the pathophysiology and treatment of Alzheimer’s disease. Brain 141: , 1917–1933. |
[3] | DeTure MA , Dickson DW ((2019) ) The neuropathological diagnosis of Alzheimer’s disease. Mol Neurodegener 14: , 32. |
[4] | Yuksel M , Tacal O ((2019) ) Trafficking and proteolytic processing of amyloid precursor protein and secretases in Alzheimer’s disease development: An up-to-date review. Eur J Pharmacol 856: , 172415. |
[5] | Kabir MT , Uddin MS , Setu JR , Ashraf GM , Bin-Jumah MN , Abdel-Daim MM ((2020) ) Exploring the role of PSEN mutations in the pathogenesis of Alzheimer’s disease. Neurotox Res 38: , 833–849. |
[6] | Sun L , Zhou R , Yang G , Shi Y ((2017) ) Analysis of 138 pathogenic mutations in presenilin-1 on the in vitro production of Abeta42 and Abeta40 peptides by gamma-secretase. Proc Natl Acad Sci U S A 114: , E476–E485. |
[7] | Lopera F , Ardilla A , Martinez A , Madrigal L , Arango-Viana JC , Lemere CA , Arango-Lasprilla JC , Hincapie L , Arcos-Burgos M , Ossa JE , Behrens IM , Norton J , Lendon C , Goate AM , Ruiz-Linares A , Rosselli M , Kosik KS ((1997) ) Clinical features of early-onset Alzheimer disease in a large kindred with an E280A presenilin-1 mutation. JAMA 277: , 793–799. |
[8] | Sepulveda-Falla D , Glatzel M , Lopera F ((2012) ) Phenotypic profile of early-onset familial Alzheimer’s disease caused by presenilin-1 E280A mutation. J Alzheimers Dis 32: , 1–12. |
[9] | Fuller JT , Cronin-Golomb A , Gatchel JR , Norton DJ , Guzman-Velez E , Jacobs HIL , Hanseeuw B , Pardilla-Delgado E , Artola A , Baena A , Bocanegra Y , Kosik KS , Chen K , Tariot PN , Johnson K , Sperling RA , Reiman EM , Lopera F , Quiroz YT ((2019) ) Biological and cognitive markers of presenilin1 E280A autosomal dominant Alzheimer’s disease: A comprehensive review of the Colombian kindred. J Prev Alzheimers Dis 6: , 112–120. |
[10] | Lalli MA , Cox HC , Arcila ML , Cadavid L , Moreno S , Garcia G , Madrigal L , Reiman EM , Arcos-Burgos M , Bedoya G , Brunkow ME , Glusman G , Roach JC , Hood L , Kosik KS , Lopera F ((2014) ) Origin of the PSEN1 E280A mutation causing early-onset Alzheimer’s disease. Alzheimers Dement 10: , S277–S283.e210. |
[11] | Zhou R , Yang G , Shi Y ((2017) ) Dominant negative effect of the loss-of-function gamma-secretase mutants on the wild-type enzyme through heterooligomerization. Proc Natl Acad Sci U S A 114: , 12731–12736. |
[12] | Lemere CA , Lopera F , Kosik KS , Lendon CL , Ossa J , Saido TC , Yamaguchi H , Ruiz A , Martinez A , Madrigal L , Hincapie L , Arango JC , Anthony DC , Koo EH , Goate AM , Selkoe DJ ((1996) ) The E280A presenilin 1 Alzheimer mutation produces increased A beta 42 deposition and severe cerebellar pathology. Nat Med 2: , 1146–1150. |
[13] | Velez-Pardo C , Arellano JI , Cardona-Gomez P , Jimenez Del Rio M , Lopera F , De Felipe J ((2004) ) CA1 hippocampal neuronal loss in familial Alzheimer’s disease presenilin-1 E280A mutation is related to epilepsy. Epilepsia 45: , 751–756. |
[14] | Fleisher AS , Chen K , Quiroz YT , Jakimovich LJ , Gomez MG , Langois CM , Langbaum JB , Ayutyanont N , Roontiva A , Thiyyagura P , Lee W , Mo H , Lopez L , Moreno S , Acosta-Baena N , Giraldo M , Garcia G , Reiman RA , Huentelman MJ , Kosik KS , Tariot PN , Lopera F , Reiman EM ((2012) ) Florbetapir PET analysis of amyloid-β deposition in the presenilin 1 E280A autosomal dominant Alzheimer’s disease kindred: A cross-sectional study. Lancet Neurol 11: , 1057–1065. |
[15] | Quiroz YT , Sperling RA , Norton DJ , Baena A , Arboleda-Velasquez JF , Cosio D , Schultz A , Lapoint M , Guzman-Velez E , Miller JB , Kim LA , Chen K , Tariot PN , Lopera F , Reiman EM , Johnson KA ((2018) ) Association between amyloid and tau accumulation in young adults with autosomal dominant Alzheimer disease. JAMA Neurol 75: , 548–556. |
[16] | Soto-Mercado V , Mendivil-Perez M , Velez-Pardo C , Lopera F , Jimenez-Del-Rio M ((2020) ) Cholinergic-like neurons carrying PSEN1 E280A mutation from familial Alzheimer’s disease reveal intraneuronal sAPPβ fragments accumulation, hyperphosphorylation of tau, oxidative stress, apoptosis and Ca2+dysregulation: Therapeutic implications. PLoS One 15: , e0221669. |
[17] | Bonini SA , Premoli M , Tambaro S , Kumar A , Maccarinelli G , Memo M , Mastinu A ((2018) ) Cannabis sativa: A comprehensive ethnopharmacological review of a medicinal plant with a long history. J Ethnopharmacol 227: , 300–315. |
[18] | Cassano T , Villani R , Pace L , Carbone A , Bukke VN , Orkisz S , Avolio C , Serviddio G ((2020) ) From Cannabis sativa to cannabidiol: Promising therapeutic candidate for the treatment of neurodegenerative diseases. Front Pharmacol 11: , 124. |
[19] | ElSohly MA , Radwan MM , Gul W , Chandra S , Galal A ((2017) ) Phytochemistry of Cannabis sativa L. Prog Chem Org Nat Prod 103: , 1–36. |
[20] | Marcu J , Schechter J ((2016) ) Molecular pharmacology of CB1 and CB2 cannabinoid receptors. In Neuropathology of Drug Addictions and Substance Misuse, Preedy V, ed.Academic Press, pp. 713–721. |
[21] | Shahbazi F , Grandi V , Banerjee A , Trant JF ((2020) ) Cannabinoids and cannabinoid receptors: The story so far. iScience 23: , 101301. |
[22] | Schubert D , Kepchia D , Liang Z , Dargusch R , Goldberg J , Maher P ((2019) ) Efficacy of cannabinoids in a pre-clinical drug-screening platform for Alzheimer’s disease. Mol Neurobiol 56: , 7719–7730. |
[23] | Hampson AJ , Grimaldi M , Axelrod J , Wink D ((1998) ) Cannabidiol and (-)Delta9-tetrahydrocannabinol are neuroprotective antioxidants. Proc Natl Acad Sci U S A 95: , 8268–8273. |
[24] | Chen Y , Buck J ((2000) ) Cannabinoids protect cells from oxidative cell death: A receptor-independent mechanism. J Pharmacol Exp Ther 293: , 807–812. |
[25] | Marsicano G , Moosmann B , Hermann H , Lutz B , Behl C ((2002) ) Neuroprotective properties of cannabinoids against oxidative stress: Role of the cannabinoid receptor CB1. J Neurochem 80: , 448–456. |
[26] | Jimenez-Del-Rio M , Daza-Restrepo A , Velez-Pardo C ((2008) ) The cannabinoid CP55,940 prolongs survival and improves locomotor activity in Drosophila melanogaster against paraquat: Implications in Parkinson’s disease. Neurosci Res 61: , 404–411. |
[27] | Velez-Pardo C , Del Rio MJ ((2006) ) Avoidance of Abeta[(25-35)] / (H(2)O(2))-induced apoptosis in lymphocytes by the cannabinoid agonists CP55,940 and JWH-015 via receptor-independent and PI3K-dependent mechanisms: Role of NF-kappaB and p53. Med Chem 2: , 471–479. |
[28] | Harvey BS , Ohlsson KS , Mååg JL , Musgrave IF , Smid SD ((2012) ) Contrasting protective effects of cannabinoids against oxidative stress and amyloid-β evoked neurotoxicity in vitro . Neurotoxicology 33: , 138–146. |
[29] | Pertwee R , Cannabinoid Receptor Ligands, https://www.tocris.com/literature/scientific-reviews/cannabinoid-receptor-ligands, Accessed Aug. 2020. |
[30] | Mendivil-Perez M , Velez-Pardo C , Jimenez-Del-Rio M ((2019) ) Direct transdifferentiation of human Wharton’s jelly mesenchymal stromal cells into cholinergic-like neurons. J Neurosci Methods 312: , 126–138. |
[31] | Gulisano W , Melone M , Ripoli C , Tropea MR , Li Puma DD , Giunta S , Cocco S , Marcotulli D , Origlia N , Palmeri A , Arancio O , Conti F , Grassi C , Puzzo D ((2019) ) Neuromodulatory action of picomolar extracellular Aβ42 oligomers on presynaptic and postsynaptic mechanisms underlying synaptic function and memory. J Neurosci 39: , 5986–6000. |
[32] | Armijo E , Gonzalez C , Shahnawaz M , Flores A , Davis B , Soto C ((2017) ) Increased susceptibility to Abeta toxicity in neuronal cultures derived from familial Alzheimer’s disease (PSEN1-A246E) induced pluripotent stem cells. Neurosci Lett 639: , 74–81. |
[33] | Pap P , Koszeghy A , Szucs G , Rusznak Z ((2009) ) Cytoplasmic Ca(2+) concentration changes evoked by cholinergic stimulation in primary astrocyte cultures prepared from the rat cochlear nucleus. Hear Res 255: , 73–83. |
[34] | Sekiguchi-Tonosaki M , Obata M , Haruki A , Himi T , Kosaka J ((2009) ) Acetylcholine induces Ca2+signaling in chicken retinal pigmented epithelial cells during dedifferentiation. Am J Physiol Cell Physiol 296: , C1195–1206. |
[35] | Lazic SE , Clarke-Williams CJ , Munafo MR ((2018) ) What exactly is ‘N’ in cell culture and animal experiments? PLoS Biol 16: , e2005282. |
[36] | Nyíri G , Szabadits E , Cserép C , Mackie K , Shigemoto R , Freund TF ((2005) ) GABAB and CB1 cannabinoid receptor expression identifies two types of septal cholinergic neurons. Eur J Neurosci 21: , 3034–3042. |
[37] | Velez-Pardo C , Jimenez-Del-Rio M , Lores-Arnaiz S , Bustamante J ((2010) ) Protective effects of the synthetic cannabinoids CP55,940 and JWH-015 on rat brain mitochondria upon paraquat exposure. Neurochem Res 35: , 1323–1332. |
[38] | Benard G , Massa F , Puente N , Lourenco J , Bellocchio L , Soria-Gomez E , Matias I , Delamarre A , Metna-Laurent M , Cannich A , Hebert-Chatelain E , Mulle C , Ortega-Gutierrez S , Martin-Fontecha M , Klugmann M , Guggenhuber S , Lutz B , Gertsch J , Chaouloff F , Lopez-Rodriguez ML , Grandes P , Rossignol R , Marsicano G ((2012) ) Mitochondrial CB(1) receptors regulate neuronal energy metabolism. Nat Neurosci 15: , 558–564. |
[39] | Ma L , Niu W , Yang S , Tian J , Luan H , Cao M , Xi W , Tu W , Jia J , Lv J ((2018) ) Inhibition of mitochondrial permeability transition pore opening contributes to cannabinoid type 1 receptor agonist ACEA-induced neuroprotection. Neuropharmacology 135: , 211–222. |
[40] | Melser S , Pagano Zottola AC , Serrat R , Puente N , Grandes P , Marsicano G , Hebert-Chatelain E ((2017) ) Functional analysis of mitochondrial CB1 cannabinoid receptors (mtCB1) in the brain. Methods Enzymol 593: , 143–174. |
[41] | Devi L , Prabhu BM , Galati DF , Avadhani NG , Anandatheerthavarada HK ((2006) ) Accumulation of amyloid precursor protein in the mitochondrial import channels of human Alzheimer’s disease brain is associated with mitochondrial dysfunction. J Neurosci 26: , 9057–9068. |
[42] | Anandatheerthavarada HK , Biswas G , Robin MA , Avadhani NG ((2003) ) Mitochondrial targeting and a novel transmembrane arrest of Alzheimer’s amyloid precursor protein impairs mitochondrial function in neuronal cells. J Cell Biol 161: , 41–54. |
[43] | Currais A , Quehenberger O , M Armando A , Daugherty D , Maher P , Schubert D ((2016) ) Amyloid proteotoxicity initiates an inflammatory response blocked by cannabinoids. NPJ Aging Mech Dis 2: , 16012. |
[44] | Kinumi T , Kimata J , Taira T , Ariga H , Niki E ((2004) ) Cysteine-106 of DJ-1 is the most sensitive cysteine residue to hydrogen peroxide-mediated oxidation in vivo in human umbilical vein endothelial cells. Biochem Biophys Res Commun 317: , 722–728. |
[45] | Nakano K , Vousden KH ((2001) ) PUMA, a novel proapoptotic gene, is induced by p53. Mol Cell 7: , 683–694. |
[46] | Yu J , Zhang L , Hwang PM , Kinzler KW , Vogelstein B ((2001) ) PUMA induces the rapid apoptosis of colorectal cancer cells. Mol Cell 7: , 673–682. |
[47] | Lu H , Hou G , Zhang Y , Dai Y , Zhao H ((2014) ) c-Jun transactivates Puma gene expression to promote osteoarthritis. Mol Med Rep 9: , 1606–1612. |
[48] | Saitoh M , Nishitoh H , Fujii M , Takeda K , Tobiume K , Sawada Y , Kawabata M , Miyazono K , Ichijo H ((1998) ) Mammalian thioredoxin is a direct inhibitor of apoptosis signal-regulating kinase (ASK) 1. EMBO J 17: , 2596–2606. |
[49] | Nishitoh H , Saitoh M , Mochida Y , Takeda K , Nakano H , Rothe M , Miyazono K , Ichijo H ((1998) ) ASK1 is essential for JNK/SAPK activation by TRAF2. Mol Cell 2: , 389–395. |
[50] | Yoshida H , Hastie CJ , McLauchlan H , Cohen P , Goedert M ((2004) ) Phosphorylation of microtubule-associated protein tau by isoforms of c-Jun N-terminal kinase (JNK). J Neurochem 90: , 352–358. |
[51] | Esposito G , De Filippis D , Carnuccio R , Izzo AA , Iuvone T ((2006) ) The marijuana component cannabidiol inhibits beta-amyloid-induced tau protein hyperphosphorylation through Wnt/beta-catenin pathway rescue in PC12 cells. J Mol Med (Berl) 84: , 253–258. |
[52] | Lei M , Xu H , Li Z , Wang Z , O’Malley TT , Zhang D , Walsh DM , Xu P , Selkoe DJ , Li S ((2016) ) Soluble Aβ oligomers impair hippocampal LTP by disrupting glutamatergic/GABAergic balance. Neurobiol Dis 85: , 111–121. |
[53] | Cline EN , Bicca MA , Viola KL , Klein WL ((2018) ) The amyloid-beta oligomer hypothesis: Beginning of the third decade. J Alzheimers Dis 64: , S567–S610. |
[54] | Liu Q , Kawai H , Berg DK ((2001) ) beta-Amyloid peptide blocks the response of alpha 7-containing nicotinic receptors on hippocampal neurons. Proc Natl Acad Sci U S A 98: , 4734–4739. |
[55] | Pettit DL , Shao Z , Yakel JL ((2001) ) beta-Amyloid(1-42) peptide directly modulates nicotinic receptors in the rat hippocampal slice. J Neurosci 21: , RC120. |
[56] | Szabo GG , Lenkey N , Holderith N , Andrasi T , Nusser Z , Hajos N ((2014) ) Presynaptic calcium channel inhibition underlies CB(1) cannabinoid receptor-mediated suppression of GABA release. J Neurosci 34: , 7958–7963. |
[57] | Shen JX , Yakel JL ((2009) ) Nicotinic acetylcholine receptor-mediated calcium signaling in the nervous system. Acta Pharmacol Sin 30: , 673–680. |
[58] | Uteshev VV ((2012) ) α7 nicotinic ACh receptors as a ligand-gated source of Ca(2+) ions: The search for a Ca(2+) optimum. Adv Exp Med Biol 740: , 603–638. |
[59] | Oz M , Ravindran A , Diaz-Ruiz O , Zhang L , Morales M ((2003) ) The endogenous cannabinoid anandamide inhibits alpha7 nicotinic acetylcholine receptor-mediated responses in Xenopus oocytes. J Pharmacol Exp Ther 306: , 1003–1010. |
[60] | Butt C , Alptekin A , Shippenberg T , Oz M ((2008) ) Endo-genous cannabinoid anandamide inhibits nicotinic acetylcholine receptor function in mouse thalamic synaptosomes. J Neurochem 105: , 1235–1243. |
[61] | Twitchell W , Brown S , Mackie K ((1997) ) Cannabinoids inhibit N- and P/Q-type calcium channels in cultured rat hippocampal neurons. J Neurophysiol 78: , 43–50. |
[62] | Wang HY , Stucky A , Liu J , Shen C , Trocme-Thibierge C , Morain P ((2009) ) Dissociating beta-amyloid from alpha 7 nicotinic acetylcholine receptor by a novel therapeutic agent, S 24795, normalizes alpha 7 nicotinic acetylcholine and NMDA receptor function in Alzheimer’s disease brain. J Neurosci 29: , 10961–10973. |
[63] | Tariot PN , Lopera F , Langbaum JB , Thomas RG , Hendrix S , Schneider LS , Rios-Romenets S , Giraldo M , Acosta N , Tobon C , Ramos C , Espinosa A , Cho W , Ward M , Clayton D , Friesenhahn M , Mackey H , Honigberg L , Sanabria Bohorquez S , Chen K , Walsh T , Langlois C , Reiman EM ((2018) ) The Alzheimer’s Prevention Initiative Autosomal-Dominant Alzheimer’s Disease Trial: A study of crenezumab versus placebo in preclinical PSEN1 E280A mutation carriers to evaluate efficacy and safety in the treatment of autosomal-dominant Alzheimer’s disease, including a placebo-treated noncarrier cohort. Alzheimers Dement (N Y) 4: , 150–160. |
[64] | Meilandt WJ , Maloney JA , Imperio J , Lalehzadeh G , Earr T , Crowell S , Bainbridge TW , Lu Y , Ernst JA , Fuji RN , Atwal JK ((2019) ) Characterization of the selective in vitro and in vivo and binding properties of crenezumab to oligomeric Aβ. Alzheimers Res Ther 11: , 97. |
[65] | Benek O , Korabecny J , Soukup O ((2020) ) A perspective on multi-target drugs for Alzheimer’s disease. Trends Pharmacol Sci 41: , 434–445. |


