
Quantitative Measurement of Cerebrospinal Fluid Amyloid-β Species by Mass Spectrometry
Abstract
Background:
High sensitivity liquid chromatography mass spectrometry (LC-MS/MS) was recently introduced to measure amyloid-β (Aβ) species, allowing for a simultaneous assay that is superior to ELISA, which requires more assay steps with multiple antibodies.
Objective:
We validated the Aβ1-38, Aβ1-40, Aβ1-42, and Aβ1-43 assay by LC-MS/MS and compared it with ELISA using cerebrospinal fluid (CSF) samples to investigate its feasibility for clinical application.
Methods:
CSF samples from 120 subjects [8 Alzheimer’s disease (AD) with dementia (ADD), 2 mild cognitive dementia due to Alzheimer’s disease (ADMCI), 14 cognitively unimpaired (CU), and 96 neurological disease subjects] were analyzed. Aβ species were separated using the Shimadzu Nexera X2 system and quantitated using a Qtrap 5500 LC-MS/MS system. Aβ1-40 and Aβ1-42 levels were validated using ELISA.
Results:
CSF levels in CU were 666±249 pmol/L in Aβ1-38, 2199±725 pmol/L in Aβ1-40, 153.7±79.7 pmol/L in Aβ1-42, and 9.78±4.58 pmol/L in Aβ1-43. The ratio of the amounts of Aβ1-38, Aβ1-40, Aβ1-42, and Aβ1-43 was approximately 68:225:16:1. Linear regression analyses showed correlations among the respective Aβ species. Both Aβ1-40 and Aβ1-42 values were strongly correlated with ELISA measurements. No significant differences were observed in Aβ1-38 or Aβ1-40 levels between AD and CU. Aβ1-42 and Aβ1-43 levels were significantly lower, whereas the Aβ1-38/1-42, Aβ1-38/1-43, and Aβ1-40/Aβ1-43 ratios were significantly higher in AD than in CU. The basic assay profiles of the respective Aβ species were adequate for clinical usage.
Conclusion:
A quantitative LC-MS/MS assay of CSF Aβ species is as reliable as specific ELISA for clinical evaluation of CSF biomarkers for AD.
INTRODUCTION
Cerebrospinal fluid (CSF) amyloid-β (Aβ)1-42 is a definite biomarker of Alzheimer’s disease (AD). A decrease in the Aβ1-42 level, which begins 25 years earlier, allows the prediction of the onset and progression of Aβ amyloidosis in the AD brain. CSF Aβ1-42 is the earliest and most reliable biomarker for the prediction and diagnosis of AD [1–3]. Low CSF Aβ1-42 and cortical amyloid PET ligand binding have been adopted as biomarkers of Aβ plaques (labeled “A”) in the ATN classification system of the NIA-AA research framework and have been proposed as diagnostic criteria based on the biological definition of AD for observational and interventional research [4].
γ-Secretase cleaves the β-carboxyl terminal fragment (β-CTF) of the amyloid-β protein precursor (AβPP) at the ɛ-site into long Aβs (Aβ1-49 and Aβ1-48), which are ultimately converted from Aβ1-43 to Aβ1-40 and from Aβ1-42 to Aβ1-38, respectively, by the successive cleavage of tripeptides and tetrapeptides [5, 6]. The half-life of Aβ in the brain is approximately 9 hours. However, the faster turnover of Aβ1-42 than Aβ1-38 and Aβ1-40 in CSF has been reported with aging and AD [7, 8]. γ-Secretase activity in AD is enhanced by the conversion of Aβ1-43 to Aβ1-40 and Aβ1-42 to Aβ1-38, leading to low CSF levels of Aβ1-42 and Aβ1-43 [9]. Aβ1-38 and Aβ1-40 have been shown to attenuate Aβ1-42 toxicity [10]. Aβ1-43 is known to be enriched in the AD brain [11–13] and promotes the rates and extent of protofibril aggregation [14]. CSF Aβ1-43 is of similar diagnostic accuracy to Aβ1-42 [15, 16]. The quantification of Aβ1-38, Aβ1-40, and Aβ1-42 in CSF using mass spectrometry and ELISA has already revealed that the Aβ1-42/1-40 and Aβ1-42/1-38 ratios are superior to CSF Aβ1-42 alone for the detection of amyloid deposition in AD and the differentiation of AD dementia (ADD) from non-AD dementias [17–19]. However, Aβ1-40 and Aβ1-38 have lower discriminative powers [20–23]. Collectively, these findings imply that the precise quantitation of these Aβ species, including Aβ1-38, Aβ1-40, Aβ1-42, and Aβ1-43, is relevant to biomarkers for observational and interventional research.
However, antibody-based immunoassays, such as ELISA, have several disadvantages [24, 25]. Currently available ELISA systems using antibodies against different epitopes or the conformation of Aβ species measure the levels of various forms of Aβ species. The specific characteristics of Aβ with self-aggregation, binding to tubes, post-translational modifications, and cross-reactions with endogenous components of CSF decrease assay sensitivity and lead to variable results depending on the ELISA systems. Therefore, discrepant findings have been reported across each assay procedure and laboratory. This variability represents a major issue for global clinical observational and interventional studies. Commercial ELISA kits and systems are expensive, time-consuming (often include overnight incubations), and indicate the variation of measured values due to the different lots of the ELISA kits.
An approach based on liquid chromatography mass spectrometry (LC-MS/MS) has been developed to overcome these methodological issues [26–29]. The direct confirmation of Aβ1-38, Aβ1-40, Aβ1-42, and Aβ1-43 is possible, and detailed comparisons can be made with advanced LC-MS/MS equipment [8, 17–19]. However, the lower sensitivity and intra-assay variability of this system compared to immunological methods have yet to be reliably improved [26–29]. Therefore, we herein developed and validated a novel LC-MS/MS method to assay CSF Aβ1-38, Aβ1-40, Aβ1-42, and Aβ1-43, and further confirm their contribution as biomarkers for AD pathological changes by comparing the results obtained by the conventional ELISA system for Aβ1-40 and Aβ1-42.
MATERIALS AND METHODS
Subjects
One hundred and twenty CSF samples from 106 patients with neurological diseases and 14 cognitively unimpaired subjects (CU) were examined. The AD group consisted of 4 cases of autosomal inherited ADD with PSEN-1 mutations, 4 of ADD, and 2 of AD due to mild cognitive impairment (ADMCI) based on the criteria of NIA-AA [4, 30, 31]. They were all defined by positive A+T+N+biomarker changes. Clinically diagnosed neurological diseases by the respective recent criteria included 17 cases of amyotrophic lateral sclerosis [32], 9 of corticobasal degeneration [33], 6 of encephalopathy, 3 of frontotemporal dementia [34, 35], 14 of multiple sclerosis and related disorders, 6 of multiple system atrophy [36], 11 of Parkinson’s disease [37], 4 of peripheral neuropathy, 11 of progressive supranuclear palsy [38], and 15 of spinocerebellar degeneration. Basic profiles are summarized in Table 1 and no significant differences were observed in age among the disease groups. CSF samples were taken in polypropylene vials by lumber puncture in the morning. Cell numbers and protein levels were examined in the first 1 mL of CSF. Each 1 mL of remaining CSF sample was transferred into polypropylene vials after centrifugation at 1,500×g for 10 min and stored at –80°C until analysis.
Table 1
Subject profiles. Subjects consisted of 10 cases of Alzheimer’s disease with dementia (ADD) and AD due to MCI (ADMCI), 17 of amyotrophic lateral sclerosis (ALS), and 9 of corticobasal degeneration (CBD). Six cases of encephalopathy (ENC) consisted of meningoencephalitis, Creutzfeldt-Jacob disease, leukoencephalopathy, superficial siderosis, or cerebral angiitis. Three cases of frontotemporal dementia (FTD), 14 cognitively unimpaired healthy controls (CU), 14 cases of multiple sclerosis (MS) and related disorders including neuromyelitis optica in the multiple sclerosis group, 6 of multiple system atrophy (MSA), 11 of Parkinson’s disease (PD), 4 of peripheral neuropathy (PN), 11 of progressive supranuclear palsy (PSP), and 15 of spinocerebellar degeneration (SCD) were analyzed. No significant differences were observed in age among the CU and other groups
| Disease | Number | Mean age | Age range | ||
| Total | Males | Females | |||
| ADD/ADMCI | 10 | 5 | 5 | 59 | 41-80 |
| ALS | 17 | 13 | 4 | 67 | 53-83 |
| CBD | 9 | 4 | 5 | 72 | 67-78 |
| ENC | 6 | 1 | 5 | 60 | 41-78 |
| FTD | 3 | 2 | 1 | 73 | 70-75 |
| CU | 14 | 5 | 9 | 61 | 22-80 |
| MS | 14 | 3 | 11 | 40 | 19-75 |
| MSA | 6 | 2 | 4 | 66 | 58-81 |
| PD | 11 | 6 | 5 | 65 | 49-79 |
| PN | 4 | 2 | 2 | 51 | 30-62 |
| PSP | 11 | 6 | 5 | 74 | 67-82 |
| SCD | 15 | 7 | 8 | 64 | 39-80 |
| Total | 120 | 56 | 64 | 62 | 19–83 |
LC-MS/MS chemicals and reagents
Synthetic human Aβ1-38, Aβ1-40, Aβ1-42, and Aβ1-43 were purchased from the Peptide Institute (Osaka, Japan). Uniformly stable isotope-labeled peptides manufactured by rPeptide (Watkinsville, GA, USA), corresponding to each peptide (Aβ1-38, Aβ1-40, Aβ1-42, and Aβ1-43), were used as internal standards (ISs). Artificial CSF was purchased from Tocris Bioscience (Bristol, UK), and rat plasma was purchased from Charles River Laboratories Japan (Yokohama, Japan). Other materials and reagents were purchased from Kanto Chemical (Tokyo, Japan), Kokusan Chemical (Tokyo, Japan), and Sigma-Aldrich (St. Louis, MO, USA). Ultrapure water was prepared using Milli-Q Integral 10 (Merck, Darmstadt, Germany).
LC-MS/MS sample preparation by solid-phase extraction
Human CSF samples (300μL) and IS solution were mixed in 1500μL of water/propionic acid (PA)/ trifluoroacetic acid (TFA) (950:50:1) and loaded onto an Oasis HLB 96-well plate (Waters Corporation, MA, USA). After loading, the plate was washed with 1000μL of water/Methanol (MeOH)/PA/TFA (900:50:50:1) and then analytes and ISs were eluted with 100μL of EtOH/2,2,2-trifluoroethanol (TF-EtOH)/PA/Ethylene glycol (1:1:1:0.1) twice. Eluates from individual samples were evaporated to dryness at approximately 40°C under nitrogen. The resulting residue was re-dissolved with 100μL of water/MeOH/TF-EtOH/PA (85:5:5:5). Calibration standards were also prepared by spiking standard solutions to 300μL of artificial CSF containing 0.25% rat plasma, with concentration ranges of 50–5000 pmol/L for Aβ1-38, 100–10000 pmol/L for Aβ1-40, 10–1000 pmol/L for Aβ1-42, and 2–200 pmol/L for Aβ1-43.
LC-MS/MS analysis
Chromatographic separation was performed using the Shimadzu Nexera X2 system (Shimadzu Corporation, Kyoto, Japan) with a column of Acquity UPLC BEH C8 (1.7μm, 2.1×100 mm, Waters Corporation, MA, USA) set at 50°C. The mobile phases of (A) water/acetic acid (AA) (8:2) and (B) MeOH/AA (8:2) were used with a linear gradient program as follows (Time – B conc.): 0 min-25%, 3.5 min-55%, 4.0 min-100%, 6.0 min-100%, 6.1 min-25%, and 8.0 min-25%. The flow rate was set at 0.4 mL/min. Mass spectra were obtained by a Qtrap 5500 system (AB Sciex, CA, USA) with the positive electrospray ionization and multiple reaction monitoring (MRM) mode. MRM transitions are shown in Table 2. MS/MS conditions were as follows: ion spray voltage at 5500 V, temperature at 600°C, curtain gas at 10 psi, ion source gas 1 at 90 psi, ion source gas 2 at 90 psi, and collision gas at level 11. Quantification was performed using Analyst 1.6.2 (AB Sciex, Redwood City, CA, USA). Calibration curves were constructed by analyzing calibration standards. The peak area ratios of analytes to the corresponding ISs were plotted against analyte concentrations, and the curves were fit by a linear least-squares regression method (a weighting factor of 1/X2).
Table 2
MRM transitions. Mass spectra were obtained by the Qtrap 5500 system with the positive electrospray ionization (ESI) and multiple reaction monitoring (MRM) mode. MRM transitions are shown, respectively
| Analyte and IS | Precursor ion [M + 5H]5 +(m/z) | Product ion (m/z) |
| Aβ1-38 | 827.3 | 801.1 |
| [15N51]-Aβ1-38 | 837.2 | 810.6 |
| Aβ1-40 | 867.0 | 843.8 |
| [15N53]-Aβ1-40 | 877.2 | 853.6 |
| Aβ1-42 | 903.7 | 863.2 |
| [15N55]-Aβ1-42 | 914.7 | 873.7 |
| Aβ1-43 | 924.1 | 1000.9 |
| [15N56]-Aβ1-43 | 935.1 | 1012.8 |
ELISA
Sandwich ELISA was used to quantify Aβ1-40 and Aβ1-42 levels using Human β Amyloid (1-40) ELISA Kit Wako II and a Human/Rat β Amyloid (1-42) ELISA Kit Wako, High-Sensitive according to the manufacturer’s instructions (Wako Pure Chemical Industries, Ltd., Osaka, Japan). Microplates were pre-coated with monoclonal BAN-50 (IgG, anti-Aβ1-16) and sequentially incubated with 25μL of samples followed by horseradish-peroxidase-conjugated BA27 (anti-Aβ1-40 (Fab’)2, specific for Aβ40) or BC05 (anti-Aβ35-43 (Fab’)2, specific for Aβ42/43) [39]. Sensitivities were 0.019 pmol/L (assay range 1.0–100 pmol/L) in the Aβ1-40 assay and 0.06 pmol/L (assay range 0.01–20.0 pmol/L) in the Aβ1-42 assay. Intra- and inter-assay coefficients of variation were less than 10% in both assay systems.
Data analysis
Simple linear regression models were used in statistical analyses. The linear regression line was drawn by the method of least squares. Comparisons among the groups of assay values were performed using the Kruskal-Wallis test with multiple comparison tests for non-parametric data. Two-tailed p-values less than 0.05 were considered to be significant. These analyses were performed with IBM SPSS Statistics, version 24 (IBM Japan, Tokyo) and GraphPad Prism, version 8 (GraphPad Software, San Diego, CA, USA).
RESULTS
The minimal to maximal LC-MS/MS assay ranges of Aβ1-38, Aβ1-40, Aβ1-42, and Aβ1-43 were 193.231∼1,224.771, 391.624∼3,560.087, 29.326∼328.450, and 0.714∼20.624 pmol/L, respectively (Table 3). CSF levels as mean±standard deviation values of CU were 666±249 pmol/L in Aβ1-38, 2199±725 pmol/L in Aβ1-40, 153.7±79.66±79.7 pmol/L in Aβ1-42, and 9.78±4.58 pmol/L in Aβ1-43. The ratios of Aβ1-38/1-42, Aβ1-38/1-43, Aβ1-40/1-42, Aβ1-40/1-43, and Aβ(1-40/1-43) /Aβ(1-38/1-42) were 4.66±0.94, 71.7±15.8, 15.7±3.7, 241±58, and 53±13, respectively. The ratio of the amounts of Aβ1-38, Aβ1-40, Aβ1-42, and Aβ1-43 was approximately 68:225:16:1 (Table 4).
Table 3
Basic profile of the LC-MS/MS analysis. The minimal to maximal assay ranges, median, mean, and standard deviations of Aβ1-38, Aβ1-40, Aβ1-42, and Aβ1-43 values measured by LC-MS/MS assay and ELISA
| Item | Aβ1-38 | Aβ1-40 | Aβ1-42 | Aβ1-43 | ||
| LC-MS/MS | LC-MS/MS | ELISA | LC-MS/MS | ELISA | LC-MS/MS | |
| Max | 1224.771 | 3560.087 | 3401.273 | 328.450 | 306.233 | 20.624 |
| Min | 193.231 | 391.624 | 634.258 | 29.326 | 41.120 | 0.714 |
| Median | 506.495 | 1739.419 | 1555.430 | 100.789 | 122.838 | 5.798 |
| Mean | 546.038 | 1771.370 | 1619.538 | 111.056 | 126.683 | 6.267 |
| SD | 198.920 | 600.511 | 561.217 | 54.778 | 50.425 | 3.559 |
Table 4
Assay data obtained by LC-MS/MS. Mean±standard values (pmol/L) of Aβ1-38, Aβ1-40, Aβ1-42, and Aβ1-43, and the ratios of Aβ1-38/1-42, Aβ1-38/1-43, Aβ1-40/1-42, Aβ1-40/1-43, and Aβ(1-40/1-43)/Aβ(1-38/1-42) in respective disease groups including with ADD and ADMCI, ALS, CBD, 6 ENC, 3 FTD, MS, MSA, PD, PN, PSP, and SCD
| Disease | mean level±standard deviation pmol/L | ratio±standard deviation | |||||||||
| Aβ1-38 | Aβ1-40 | Aβ1-42 | Aβ1-43 | Aβ1-38/1-42 | Aβ1-38/1-43 | Aβ1-40/1-42 | Aβ1-40/Aβ1-42 + Aβ1-43 | Aβ1-40/1-43 | Aβ1-42/1-43 | Aβ(1-40/1-43)/(1-38/1-42) | |
| ADD/ | 498±166 | 1552±527 | 71.93±27.7**a | 3.15±2.66****b | 7.38±2.28*e | 250.2±184.2***f | 22.5±6.8 | 21.6±6.6 | 759±520**g | 32.5±19.8 | 101±61 |
| ADMCI | |||||||||||
| ALS | 647±260 | 1986±615 | 115.8±44.6 | 6.68±2.75 | 6.06±2.55 | 107.4±48.3 | 19.1±8.3 | 18.0±7.8 | 333±138 | 18.0±4.8 | 57±13 |
| CBD | 474±160 | 1634±526 | 90.4±50.1 | 4.82±2.65 | 6.24±2.54 | 125.1±71.2 | 22.0±10.5 | 20.6±9.1 | 452±324 | 21.7±11.4 | 78±50 |
| ENC | 503±156 | 1571±405 | 107.8±54.4 | 4.39±2.49*c | 5.05±1.19 | 133.7±53.2 | 15.9±3.7 | 15.3±3.6 | 429±199 | 26.2±2.1*h | 85±30 |
| FTD | 671±62 | 2132±438 | 146.4±63.1 | 9.07±4.46 | 5.26±2.36 | 91.4±53.0 | 16.2±5.9 | 15.3±5.6 | 279±134 | 16.8±2.1 | 53±3 |
| CU | 666±249 | 2199±725 | 153.7±79.7 | 9.78±4.58 | 4.66±0.94 | 71.7±15.8 | 15.7±3.7 | 114.7±3.3 | 241±58 | 15.7±3.4 | 53±13 |
| MS | 468±138 | 1604±554 | 97.2±37.6 | 5.58±3.07 | 5.27±2.14 | 120.2±121.7 | 17.8±6.6 | 16.9±6.4 | 393±352 | 20.6±8.5 | 69±26 |
| MSA | 498±191 | 1531±702 | 83.2±33.9 | 5.41±1.61 | 6.42±2.72 | 93.6±33.2 | 19.5±7.9 | 18.2±7.1 | 282±82 | 15.3±4.0 | 46±13 |
| PD | 489±127 | 1702±518 | 97.6±33.9 | 4.98±2.17*d | 5.29±1.23 | 110.7±49.1 | 18.2±4.2 | 17.3±3.9 | 385±181 | 21.2±8.7 | 74±34 |
| PN | 464±165 | 1546±491 | 114.4±48.7 | 7.54±1.94 | 4.30±1.04 | 60.7±10.3 | 14.3±2.9 | 13.3±2.5 | 202±17 | 14.7±4.2 | 50±14 |
| PSP | 537±260 | 1729±830 | 129.6±87.4 | 7.07±5.31 | 4.61±1.42 | 106.5±81.3 | 14.8±4.0 | 14.0±3.8 | 342±262 | 22.6±15.1 | 73±49 |
| SCD | 550±124 | 1759±352 | 118.1±27.2 | 6.67±2.15 | 4.71±0.60 | 86.4±17.8 | 15.2±2.3 | 14.3±2.2 | 284±96 | 18.6±4.7 | 62±29 |
| total | 546±199 | 1771±601 | 111.1±54.8 | 6.27±3.56 | 5.44±1.96 | 111.2±89.1 | 17.7±6.3 | 16.7±5.9 | 370±272 | 20.45±10.2 | 67±35 |
**ap = 0.0066; ****bp < 0.0001; *cp = 0.0297; *dp = 0.0281; *ep = 0.021; ***fp = 0.0004; **gp = 0.0033; *hp = 0.0123. ADD, Alzheimer’s disease with dementia; ADMCI, AD due to MCI; ALS, amyotrophic lateral sclerosis; CBD, corticobasal degeneration; ENC, encephalopathy; FTD, frontotemporal dementia;), CU, cognitively unimpaired; MS, multiple sclerosis; MSA, multiple system atrophy; PD, Parkinson’s disease; PN, peripheral neuropathy; PSP, progressive supranuclear palsy; SCD, spinocerebellar degeneration.
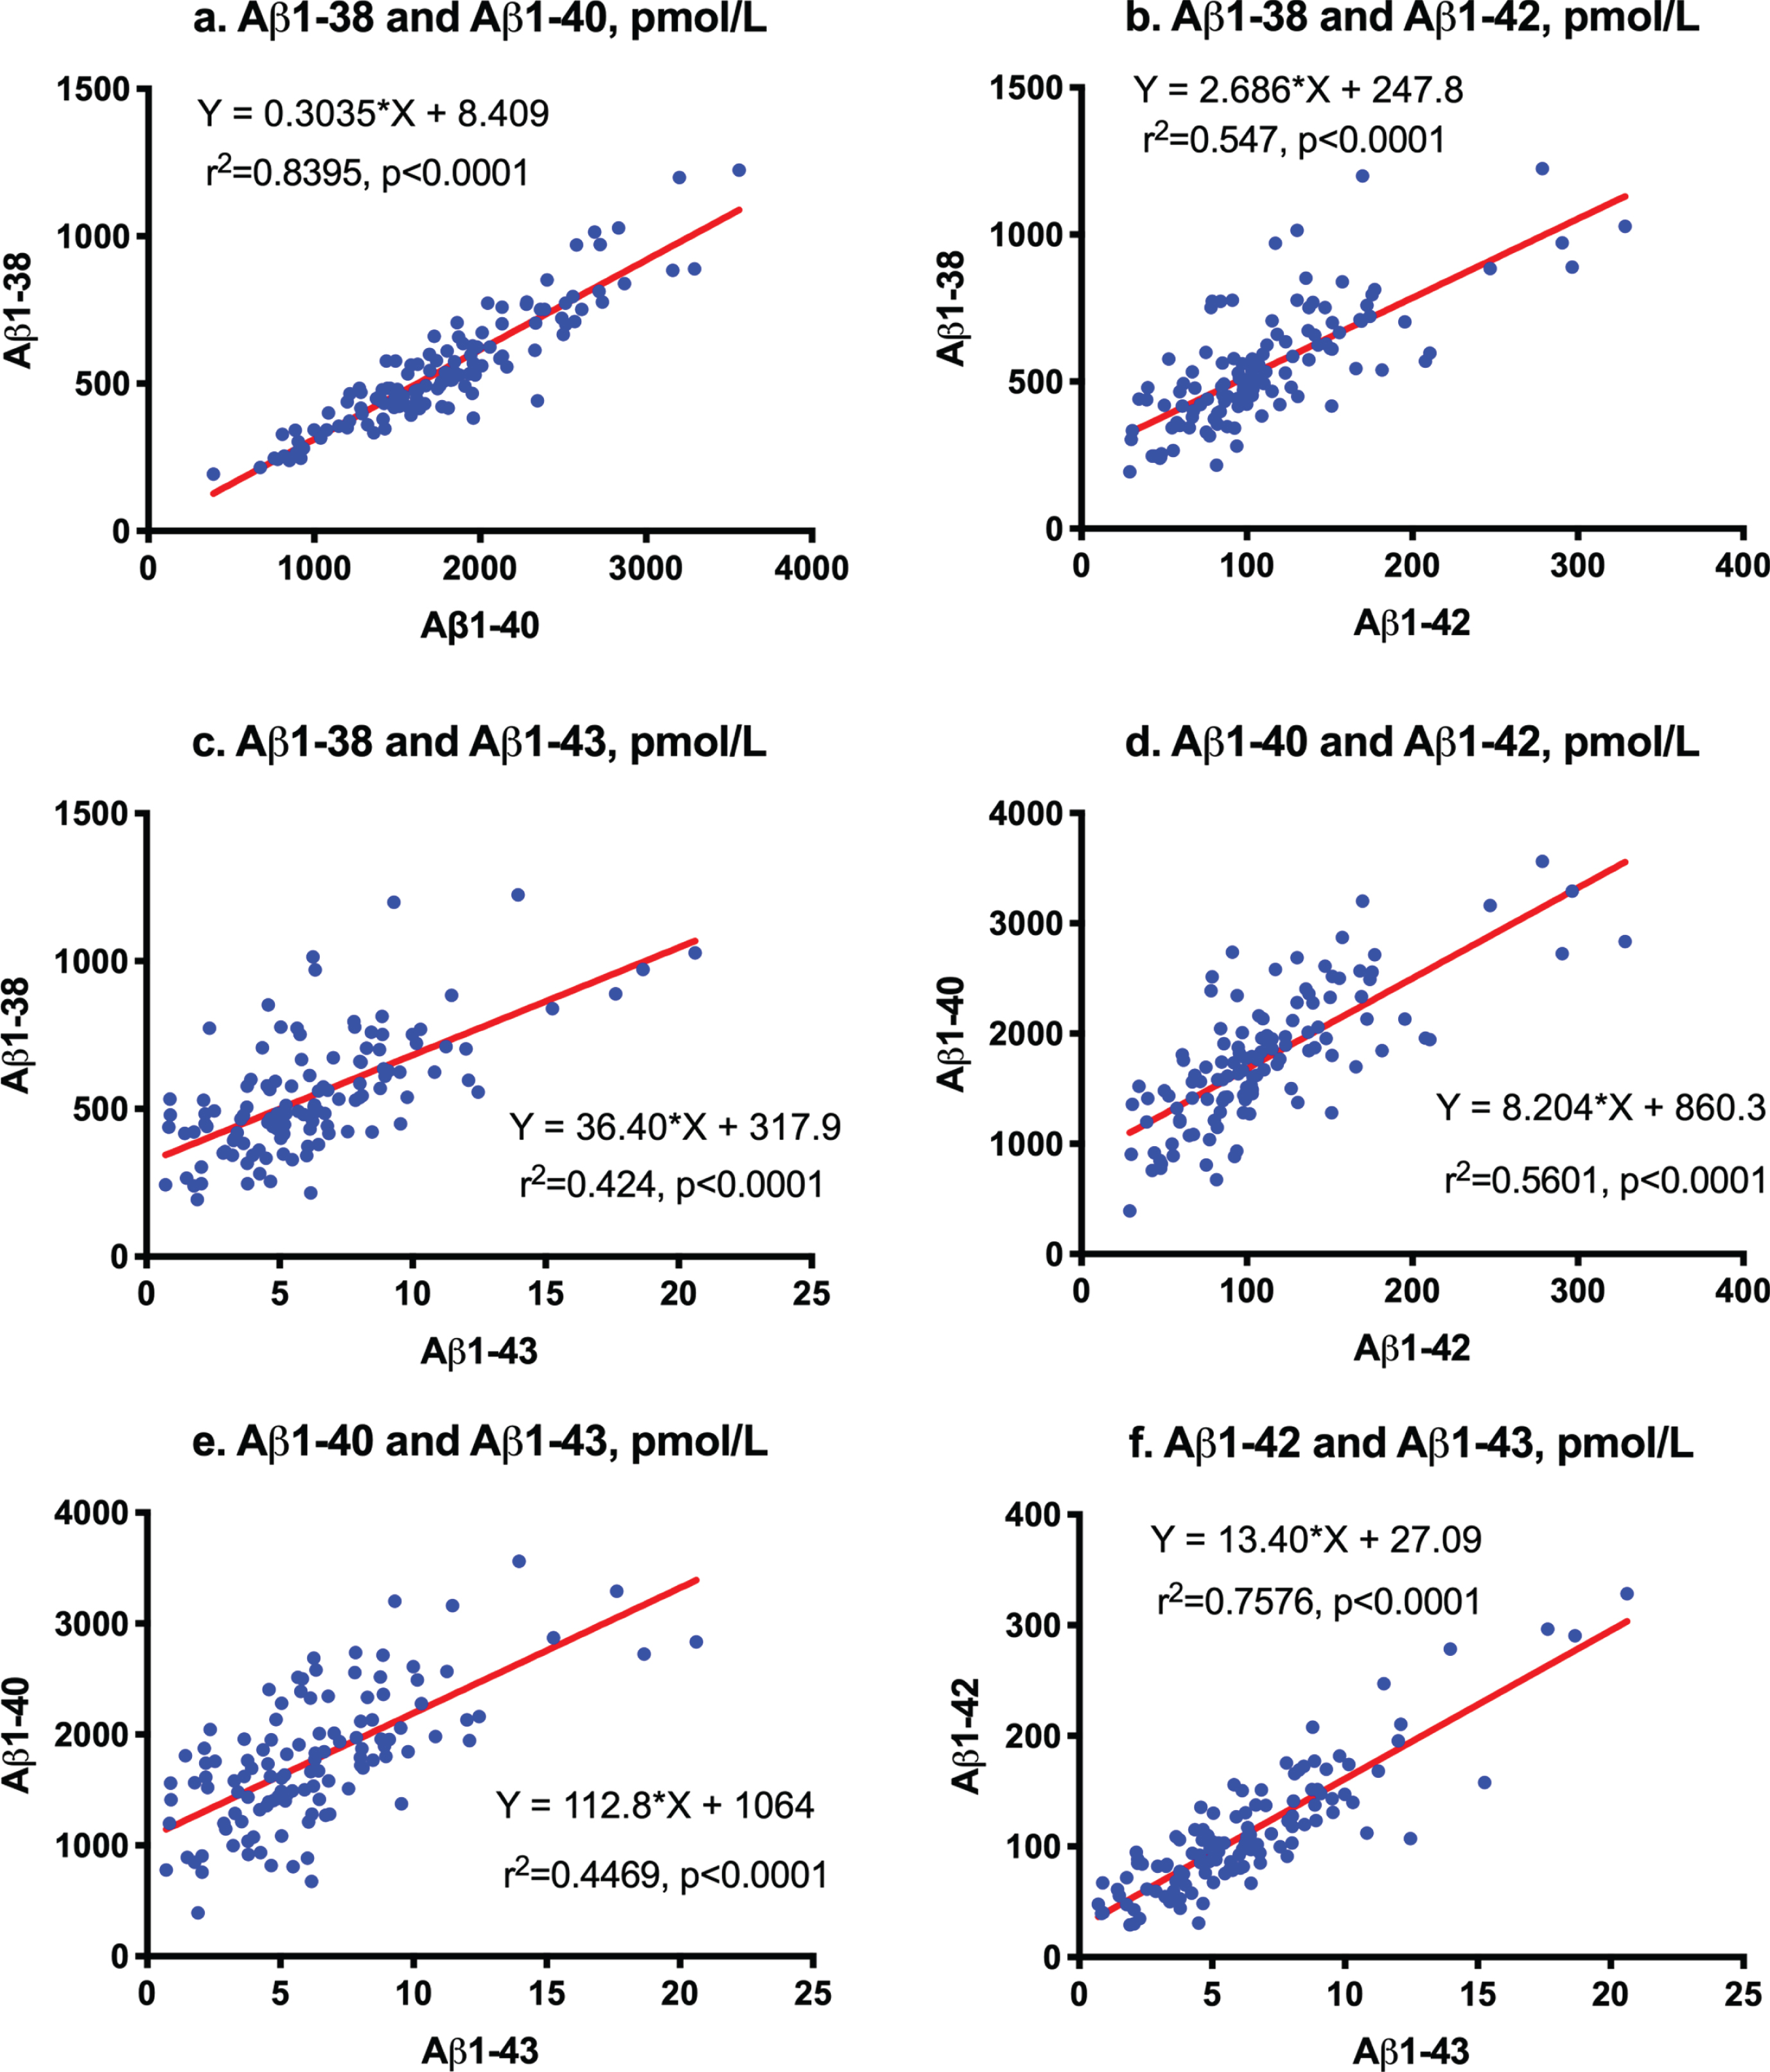
First order regression analysis showed a correlation between Aβ1-38 and Aβ1-40 (Y = 0.3035*X + 8.409; r2 = 0.8395; p < 0.0001, Fig. 1a), between Aβ1-38 and Aβ1-42 (Y = 2.686*X + 247.8; r2 = 0.547; p <0.0001, Fig. 1b), between Aβ1-38 and Aβ1-43 (Y = 36.4*X + 317.9; r2 = 0.424; p < 0.0001, Fig. 1c), between Aβ1-40 and Aβ1-42 (Y = 8.204*X + 860.3; r2 = 0.5601; p < 0.0001, Fig. 1d), between Aβ1-40 and Aβ1-43 (Y = 112.8*X + 1064; r2 = 0.4469; p < 0.0001, Fig. 1e), and between Aβ1-42 and Aβ1-43 (Y = 13.4*X + 27.09; r2 = 0.7576; p < 0.0001, Fig. 1f).
Fig.1
Correlation among Aβ species measured by LC-MS/MS. First order regression analysis between Aβ1-38 and Aβ1-40 (a), between Aβ1-38 and Aβ1-42 (b), between Aβ1-38 and Aβ1-43 (c), between Aβ1-40 and Aβ1-42 (d), between Aβ1-40 and Aβ1-43 (e), and between Aβ1-42 and Aβ1-43 (f).
Aβ1-40 and Aβ1-42 values measured by LC-MS/MS were strongly correlated with those obtained by ELISA. The first order regression analysis was Y = 0.9726*X + 165.9 (r2 = 0.8127, p < 0.0001) for Aβ1-40 values measured by LC-MS/MS and ELISA (Fig. 2a). Regarding Aβ1-42 values, the regression curve was Y = 0.8584*X + 2.545 (r2 = 0.6207, p < 0.0001) between LC-MS/MS and ELISA (Fig. 2b). Thus, these quantitative assays of Aβ1-40 and Aβ1-42 by LC-MS/MS were equivalent to those by specific ELISA. Comparisons between Aβ1-42 + Aβ1-43 levels by LC-MS/MS and Aβ1-42 values by ELISA showed the same relationship as those between LC-MS/MS Aβ1-42 levels and Aβ1-42 by ELISA (Y = 0.9100*X + 2.389, r2 = 0.6245, p < 0.0001; Fig. 2c). These results show that conventional ELISA using BCO5 for Aβ42/43 measures both Aβ1-42 and Aβ1-43 in CSF.
Fig.2
Correlation between LC-MS/MS and ELISA. Aβ1-40, Aβ1-42, and Aβ1-42 + Aβ1-43 values measured by LC-MS/MS were strongly correlated with those obtained by ELISA (a: Y = 0.9726*X + 165.9, r2 = 0.8127, p < 0.0001 for Aβ1-40 values; b: Y = 0.8584*X+2.545, r2 = 0.6207, p < 0.0001 for Aβ1-42; and c: comparisons between Aβ1-42 + Aβ1-43 levels by LC-MS/MS and Aβ1-42 values by ELISA: Y = 0.9100*X + 2.389, r2 = 0.6245, p < 0.0001). The regression curve between the Aβ1-38/1-42 ratio and Aβ1-40/Aβ1-43 ratio measured by LC-MS/MS was almost constant. The ratios of 8 out of 10 AD patients were outside the linear regression curve (d: Red circles  represent sporadic ADD, red triangles
  represent sporadic ADMCI, brown circles
  represent familial AD). Correlation analysis between measured levels by LC-MS/MS and ELISA in Aβ1-40/Aβ1-42 and Aβ1-40/Aβ1-42 + Aβ1-43 showed close relationships, but most values were present in the leftmost regression curve (e and f).
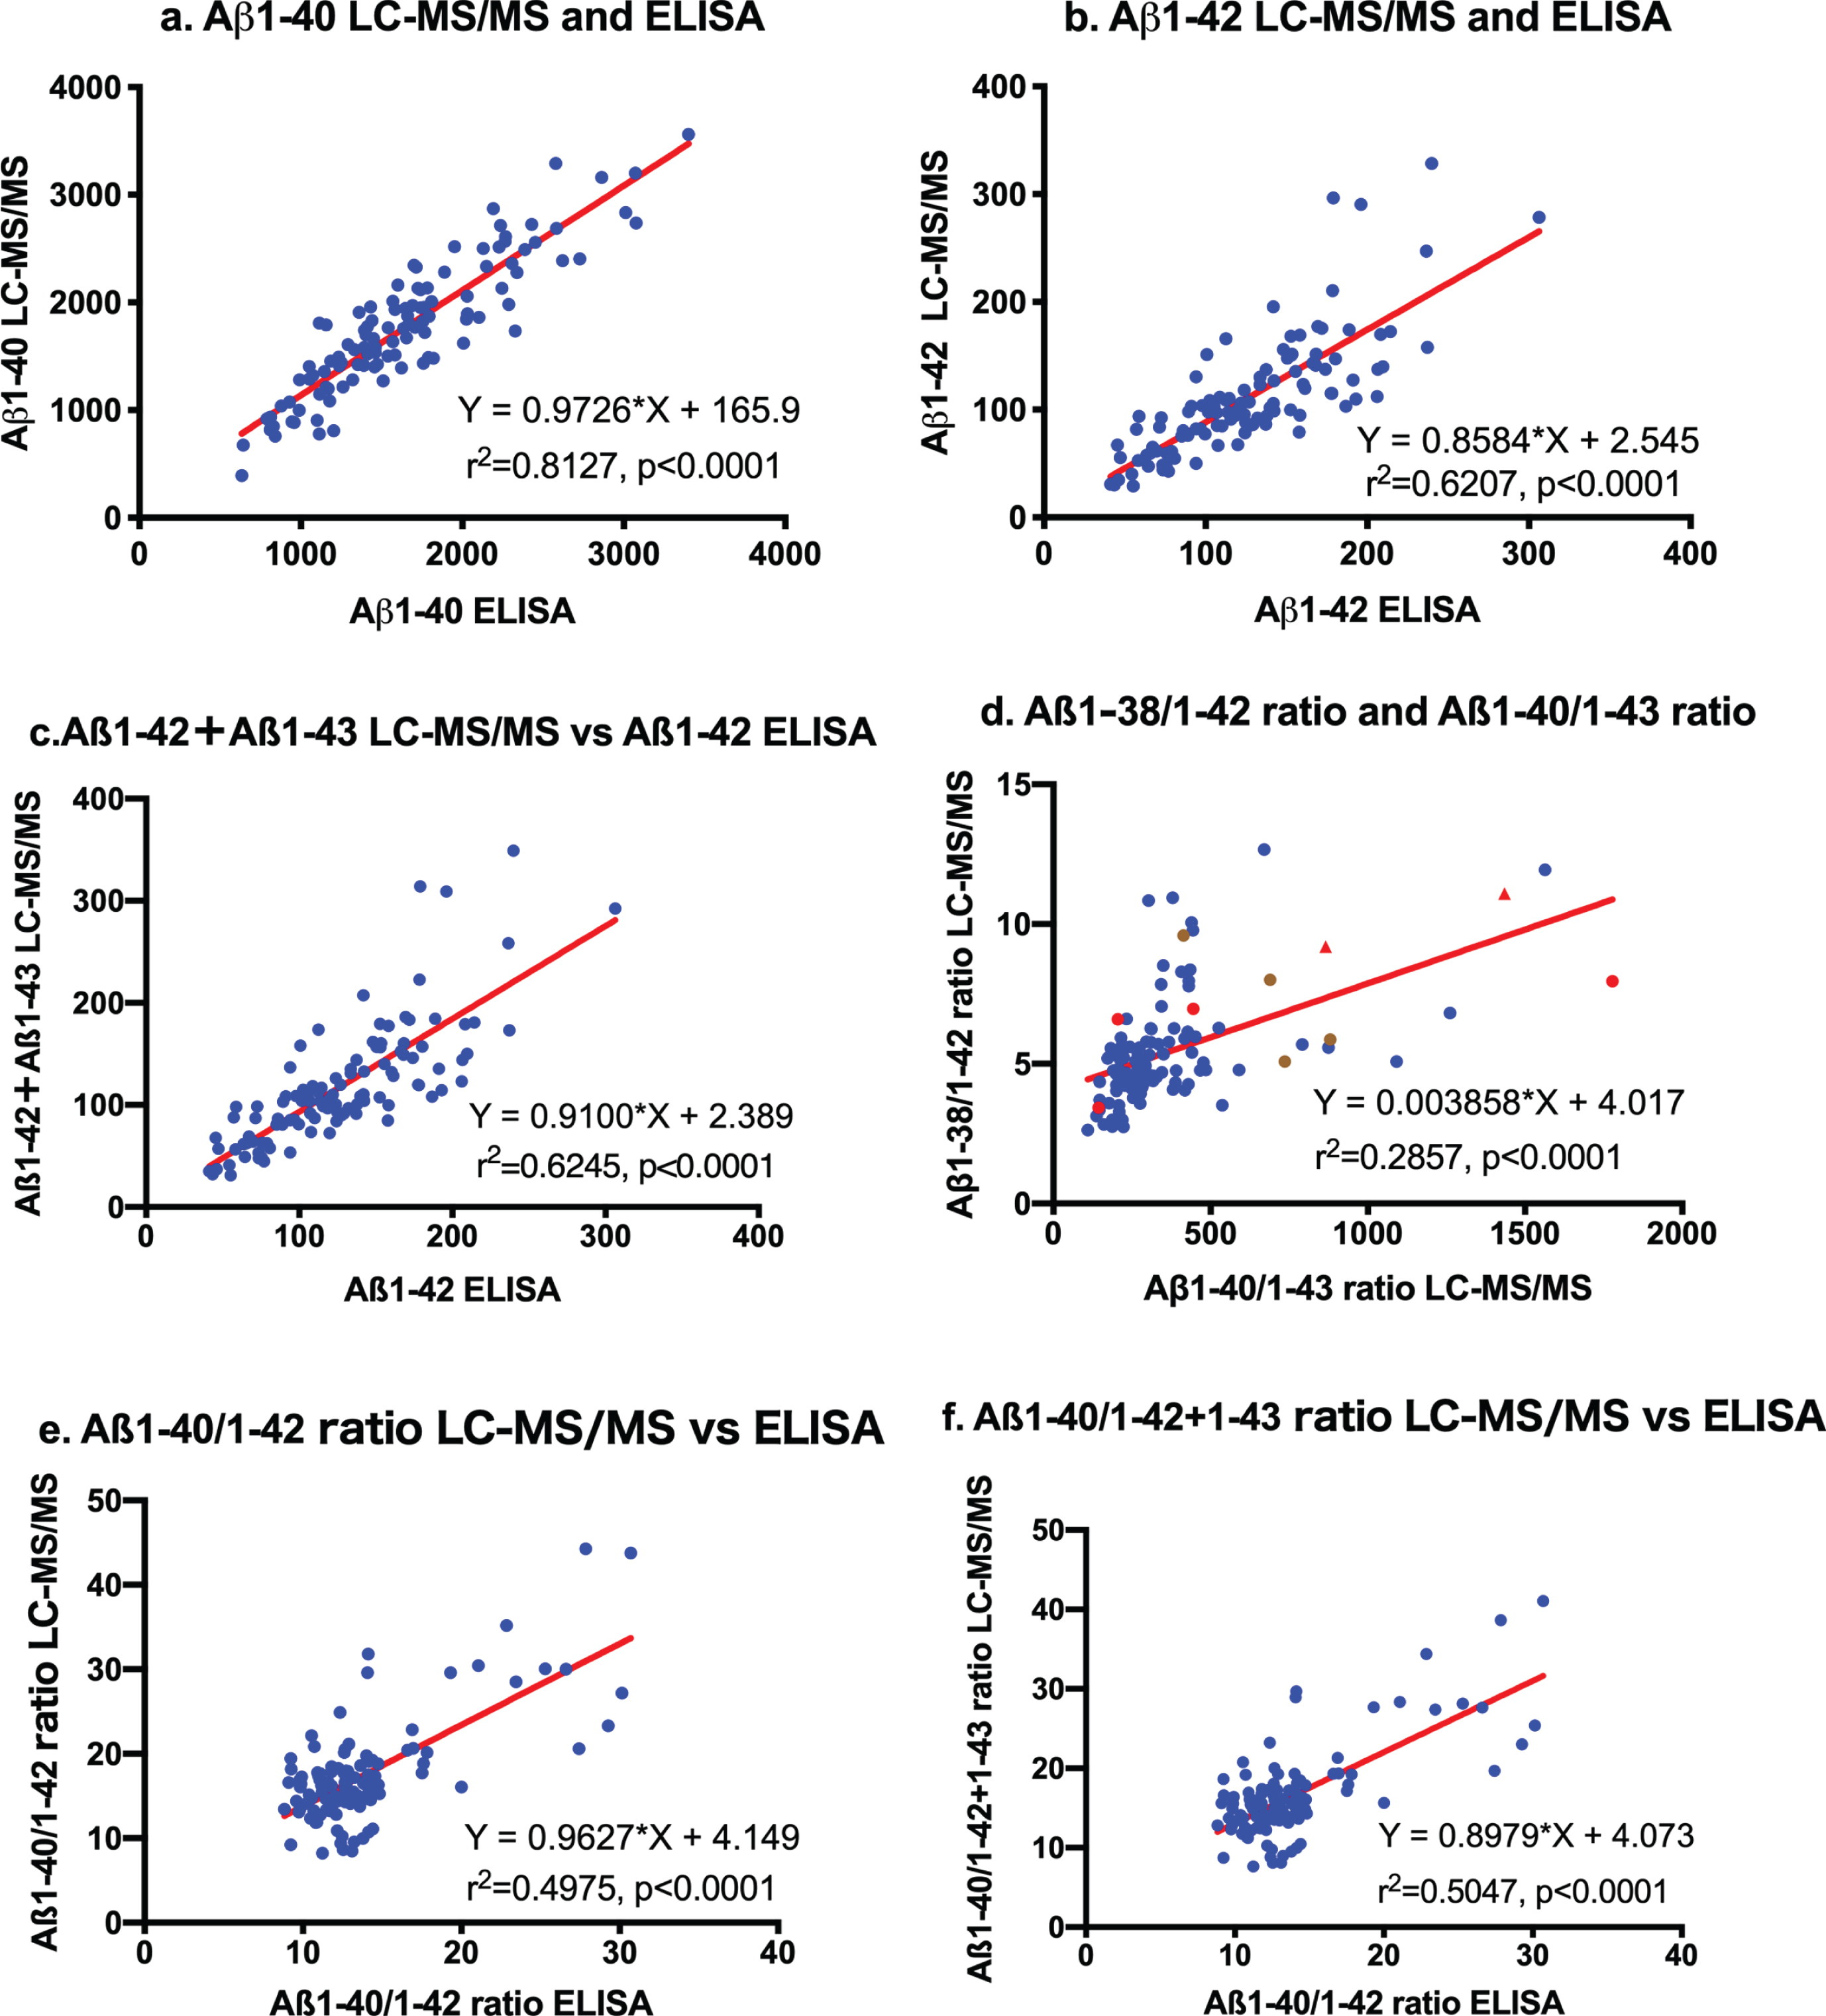
The regression curve between the Aβ1-38/1-42 ratio and Aβ1-40/Aβ1-43 ratio measured by LC-MS/MS was Y = 0.003858*X+4.017 (r2 = 0.2857, p < 0.0001; Fig. 2d), suggesting that this ratio is almost constant. The ratios of 8 out of 10 AD patients were outside the linear regression curve (Fig. 2d: Red circles indicate ADD and triangles indicate ADMCI). Although correlation analysis between measured levels by LC-MS/MS and ELISA in Aβ1-40/Aβ1-42 and Aβ1-40/Aβ1-42 + Aβ1-43 showed close relationships, most values were present in the leftmost regression curve (Fig. 1e, f).
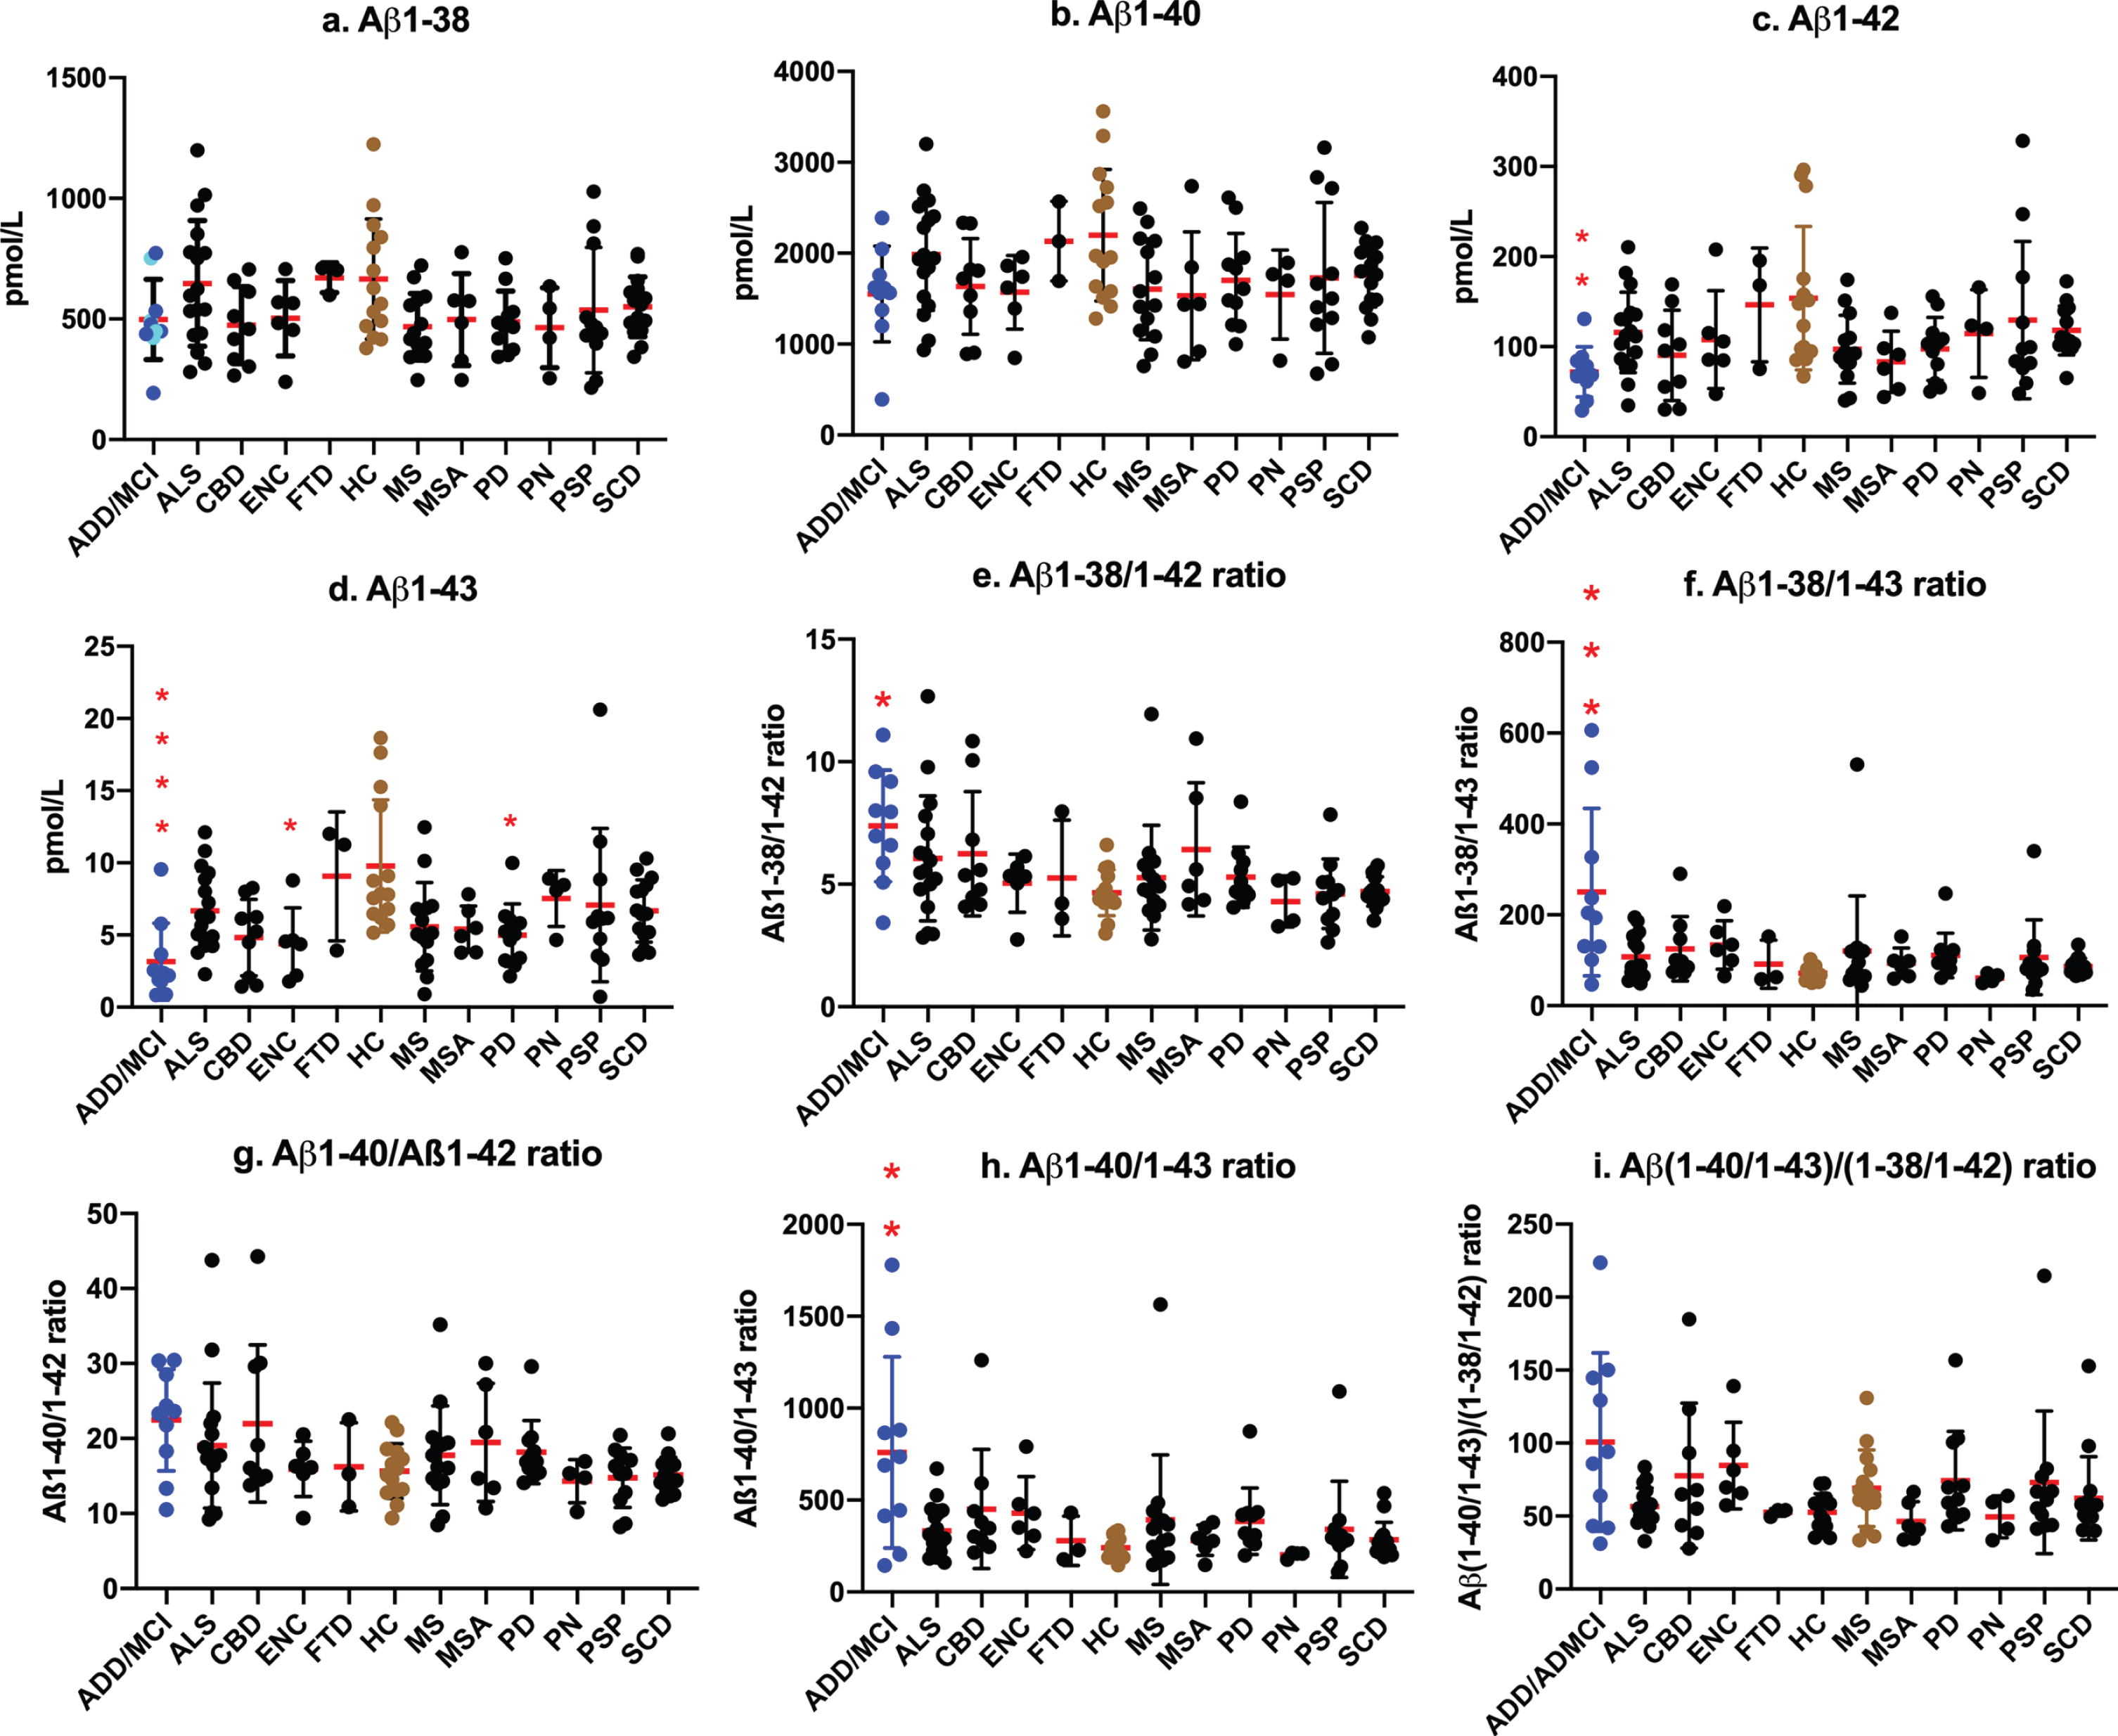
We then examined the efficacy of LC-MS/MS assay values as biomarkers for AD by comparisons with assay values among ADD/ADMCI, CU, and other neurogenerative diseases. No significant differences were observed in Aβ1-38 and Aβ1-40 levels among ADD/ADMCI and other neurological diseases and CU (Fig. 3a, b). Aβ1-42 levels were significantly lower in ADD/ADMCI than in CU (p =0.0066; Fig. 3c). CSF Aβ1-43 values were significantly lower in ADD/ADMCI (Fig. 3d; p < 0.0001), encephalopathy (p = 0.0297), and Parkinson’s disease (p = 0.0281) than in CU. The Aβ1-38/Aβ1-42 and Aβ1-38/Aβ1-43 ratios were significantly higher in ADD/ADMCI than in CU (p = 0.021 in Aβ1-38/1-42, Fig. 3e; p = 0.0004 in Aβ1-38/1-43, Fig. 3f). Increased ratios of Aβ1-40/Aβ1-42 and Aβ1-40/Aβ1-42 + Aβ1-43 were not significant (p = 0.1226 in Aβ1-40/ Aβ1-42 ratio, Fig. 3g; p = 0.0895 in Aβ1-40/Aβ1-42 + Aβ1-43 ratio). The Aβ1-40/Aβ1-43 ratio was significantly increased (p = 0.0033, Fig. 3h). The Aβ(1-40/1-43)/Aβ(1-38/1-42) ratio was not significantly changed in ADD/ADMCI and other diseases. These results imply that successive cleavage from Aβ1-43 to Aβ1-40 and from Aβ1-42 to Aβ1-38 was enhanced in parallel in AD.
Fig.3
Values of CSF Aβ species and ratios among neurological diseases and controls. No significant differences were observed in Aβ1-38 and Aβ1-40 levels among ADD/ADMCI and other neurological diseases and CU (a, b). Aβ1-42 levels were significantly lower in ADD/ADMCI than in CU (p = 0.0066; c). CSF Aβ1-43 values were significantly lower in ADD/ADMCI (d; p < 0.0001), ENC (p = 0.0297), and PD (p = 0.0281) than in CU. The Aβ1-38/Aβ1-42 and Aβ1-38/Aβ1-43 ratios were significantly higher in ADD/ADMCI than in CU (e: p = 0.021; f: p = 0.0004). Ratios of Aβ1-40/Aβ1-42 and Aβ1-40/Aβ1-42 + Aβ1-43 were not significant (g: p = 0.1226 in Aβ1-40/Aβ1-42 ratio; p = 0.0895 in Aβ1-40/Aβ1-42 + Aβ1-43 ratio). The Aβ1-40/Aβ1-43 ratio was significantly increased (h: p = 0.0033). The Aβ (1-40/1-43)/Aβ (1-38/1-42) ratio was not significantly changed in ADD/ADMCI and other diseases (i). (a: Blue circles  represent sporadic ADD and ADMCI, cyan circles
  represent familial AD).
DISCUSSION
Mass spectrometry is a device that is capable of detecting the masses of various substances, as well as accurate peptide sequence lengths. Due to advances in the operability and analytical devices for extremely small amounts, this method has been clinically applied to the measurement of various substances in recent years. MS/MS is the combination of two mass analyzers in one mass spectrometric instrument. The combination with a highly selective separation method by LC allows for more accurate and reliable quantification for clinical application. Therefore, the LC-MS/MS technique has been used to measure Aβ peptides [7–9, 17–19, 26–29]. This method eliminates time-consuming immune assays with a large number of steps and multiple antibodies or immunoprecipitation steps for pre-clinical studies. This approach also allows for performance of a single assay to measure several different Aβ species simultaneously in one sample with selectivity, specificity, and in a high-throughput format, while still achieving the high sensitivity required for low level endogenous Aβ peptides (such as CSF Aβ1-43), plasma Aβ species, and modified tau products.
Comparative assays using the same samples between the LC-MS/MS assay and commonly used ELISA systems for Aβ1-40, Aβ1-42, and Aβ1-42 + Aβ1-43 confirmed a strong correlation (Y = 0.9726* X + 165.9 for Aβ1-40; Y = 0.8584*X + 2.545 for Aβ1-42; Y = 0.9100*X + 2.389 for Aβ1-42 + Aβ43; Fig. 2a–c). These results suggest that this LC-MS/MS assay is as reliable and reproducible a system as conventional ELISA systems. We did not validate Aβ1-38 or Aβ1-43 assay values by comparisons with ELISA systems. This LC-MS/MS assay requires further improvements in sensitivity for lower Aβ1-43 values. However, studies on relationships with the respective Aβ species showed strong linear correlations among Aβ1-38, Aβ1-40, Aβ1-42, and Aβ1-43 (Fig. 1). Reliable ELISA for Aβ1-38 and Aβ1-43 are not commonly available. The present results support the application of the LC-MS/MS assay system for clinical usage, similar to conventional ELISA systems.
We previously proposed that Aβ1-38/1-42 and Aβ1-40/1-43 were distinct product/precursor pairs and reflected γ-secretase activity [9]. Significantly decreased CSF levels of Aβ1-42 and Aβ1-43 accompanied by increased Aβ1-38/1-42 and Aβ1-40/1-43 ratios and an enhanced proportional ratio of Aβ1-40/1-43 versus Aβ1-38/1-42 suggested altered successive cleavage by γ-secretase in AD. In the present study, strong correlations between Aβ1-38 and Aβ1-40 (r2 = 0.8395) and between Aβ1-42 and Aβ1-43 (r2 = 0.7576) also support this cleavage being processed in parallel. The processing ratio from Aβ1-42 to Aβ1-38 was 2.686 (Fig. 1b), and that from Aβ1-43 to Aβ1-40 was 112.8 (Fig. 1f). The accurate ratios of Aβ1-38/1-42 were 4.66 in CU and 7.38 in AD whereas those of Aβ1-40/1-43 were 241 in CU and 795 in AD. Both cleavage processes appear to have been enhanced in parallel twice in AD (Fig. 2d). Recent studies revealed that CNS-derived Aβ is cleared into the CSF [7] and peripheral blood [40], and that the clearance rate decreases in late onset AD [8] and is differently regulated by age, APOE isoforms, and the presence of Aβ amyloidosis [41–44]. Therefore, the measurement of precise amounts of Aβ1-38, Aβ1-40, Aβ1-42, and Aβ1-43 is relevant for clinical application of biomarkers and understanding of the processing of Aβ species in AD.
Comparisons between 66 cases of early-onset AD and 25 of late-onset AD by ELISA showed that CSF Aβ1-43 significantly varied with age in AD. However, Aβ1-43 levels were not superior to Aβ1-42 for diagnostic accuracy [15]. CSF Aβ1-43, but not Aβ1-42, differentiated between patients with amnestic MCI who progressed to AD during a 2-year follow-up [16]. Goda and Kobayashi evaluated dog CSF Aβ1-38, Aβ1-40, Aβ1-42, and Aβ1-43 using peptide adsorption-controlled LC-MS/MS and showed that the Aβ assay was reproducible [17]. Aβ quantitation by LC-MS/MS showed satisfactory intra- and inter-day reproducibility as well as freeze-thaw and room temperature stability [17, 18]. The findings of a recent large study by Janelidze et al. using three different immunoassays revealed that the CSF Aβ42/Aβ40 and Aβ42/38 ratios were significantly better than CSF Aβ42 alone for the detection of brain amyloid deposition in prodromal AD and differentiating AD dementia from non-AD dementias [20]. Widely used ELISA for the quantitation of Aβ1-42/total tau, Aβ1-42/Aβ1-40, Aβ1-42/Aβ1-38, and Aβ1-42 showed the greatest accuracy for identifying amyloid-positive subjects. Aβ1-40 and Aβ1-38 showed significantly lower discriminative powers [21]. The first report of ELISA assays for Aβ1-38, Aβ1-40, and Aβ1-42 showed only decreased levels of Aβ1-42 compared with Aβ1-38 and Aβ1-40 in CSF from AD [22]. CSF Aβ1-42/Aβ1-40 and Aβ1-42/Aβ1-43 were positively correlated with in gait variability and ADL in mild ADD [23]. A UPLC-MS-MS assay of CSF Aβ1-42 showed equivalent diagnostic utility to those of commonly used AlzBio3 ELISA systems [26]. Oe et al. reported that the validated methods had limits of quantitation of 44 fmol/mL for Aβ1-42 and 92 fmol/mL for Aβ1-40 in CSF. A strong correlation was observed between LC/MS/MS and ELISA for Aβ1-42 (r2 = 0.915), and those correlations were weak for Aβ1-40 (r2 = 0.644) [27]. The accuracy and precision of LC-MS/MS will contribute to the clinical diagnosis and monitoring of therapeutic interventions [27].
The present results suggest that the quantitative LC-MS/MS assay for CSF Aβ species is as reliable as specific ELISA for the clinical evaluation of CSF biomarkers for AD. Since the present study was not a large scale or prospective control study, further large-scale studies are necessary. However, the reliable and convenient LC-MS/MS multiple assay of Aβ species is equivalent to specific multiple ELISA assays. Therefore, the LC-MS/MS multiple assay of Aβ species may be applicable and contribute to kinetic [7, 8] and drug monitoring [44] studies on Aβ species. The establishment of a multiple Aβ and tau species assay by LC-MS/MS is warranted.
ACKNOWLEDGMENTS
We thank Yasuhito Wakasaya for his research assistance. This study was supported by the Amyloidosis Research Committee Surveys and Research on Special Diseases, the Longevity Science Committee of the Ministry of Health and Welfare of Japan; Scientific Research (C) (18K07385 MS, 19K07989 T.K.) from the Ministry of Education, Science, and Culture of Japan, the Hirosaki University Institutional Research Grant, and the Center of Innovation Science and Technology-based Radical Innovation and Entrepreneurship Program from the Japan Science and Technology Agency. This study was approved by the Ethics Committee of Hirosaki University (2017-112) and Geriatrics Research Institute and Hospital (2019-78). All participants provided written informed consent.
Authors’ disclosures available online (https://www.j-alz.com/manuscript-disclosures/20-0987r1).
REFERENCES
[1] | Kanai M , Matsubara E , Isoe K , Urakami K , Nakashima K , Arai H , Sasaki H , Abe K , Iwatsubo T , Kosaka T , Watanabe M , Tomidokoro Y , Shizuka M , Mizushima K , Nakamura T , Igeta Y , Ikeda Y , Amari M , Kawarabayashi T , Ishiguro K , Harigaya Y , Wakabayashi K , Okamoto K , Hirai S , Shoji M ((1998) ) Longitudinal study of cerebrospinal fluid levels of tau, A beta1-40, and A beta1-42(43) in Alzheimer’s disease: A study in Japan. Ann Neurol 44: , 17–26. |
[2] | Shaw LM , Vanderstichele H , Knapik-Czajka M , Clark CM , Aisen PS , Petersen RC , Blennow K , Soares H , Simon A , Lewczuk P , Dean R , Siemers E , Potter W , Lee VM , Trojanowski JQ , Alzheimer’s Disease Neuroimaging Initiative ((2009) ) Cerebrospinal fluid biomarker signature in Alzheimer’s disease neuroimaging initiative subjects. Ann Neurol 65: , 403–413. |
[3] | Bateman RJ , Xiong C , Benzinger TL , Fagan AM , Goate A , Fox NC , Marcus DS , Cairns NJ , Xie X , Blazey TM , Holtzman DM , Santacruz A , Buckles V , Oliver A , Moulder K , Aisen PS , Ghetti B , Klunk WE , McDade E , Martins RN , Masters CL , Mayeux R , Ringman JM , Rossor MN , Schofield PR , Sperling RA , Salloway S , Morris JC , Dominantly Inherited Alzheimer Network ((2012) ) Clinical and biomarker changes in dominantly inherited Alzheimer’s disease. N Engl J Med 367: , 795–804. |
[4] | Jack CR Jr , Bennett DA , Blennow K , Carrillo MC , Dunn B , Haeberlein SB , Holtzman DM , Jagust W , Jessen F , Karlawish J , Liu E , Molinuevo JL , Montine T , Phelps C , Rankin KP , Rowe CC , Scheltens P , Siemers E , Snyder HM , Sperling R; Contributors ((2018) ) NIA-AA Research Framework: Toward a biological definition of Alzheimer’s disease. Alzheimers Dement 14: , 535–562. |
[5] | Qi-Takahara Y , Morishima-Kawashima M , Tanimura Y , Dolios G , Hirotani N , Horikoshi Y , Kametani F , Maeda M , Saido TC , Wang R , Ihara Y ((2005) ) Longer forms of amyloid beta protein: Implications for the mechanism of intramembrane cleavage by gamma-secretase. J Neurosci 25: , 436–445 . |
[6] | Takami M , Nagashima Y , Sano Y , Ishihara S , Morishima-Kawashima M , Funamoto S , Ihara Y ((2009) ) γ-Secretase: Successive tripeptide and tetrapeptide release from the transmembrane domain of beta-carboxyl terminal fragment. J Neurosci 29: , 13042–13052. |
[7] | Bateman RJ , Munsell LY , Morris JC , Swarm R , Yarasheski KE , Holtzman DM ((2006) ) Human amyloid-beta synthesis and clearance rates as measured in cerebrospinal fluid in vivo. Nat Med 12: , 856–861. |
[8] | Patterson BW , Elbert DL , Mawuenyega KG , Kasten T , Ovod V , Ma S , Xiong C , Chott R , Yarasheski K , Sigurdson W , Zhang L , Goate A , Benzinger T , Morris JC , Holtzman D , Bateman RJ ((2015) ) Age and amyloid effects on human central nervous system amyloid-beta kinetics. Ann Neurol 78: , 439–453. |
[9] | Kakuda N , Shoji M , Arai H , Furukawa K , Ikeuchi T , Akazawa K , Takami M , Hatsuta H , Murayama S , Hashimoto Y , Miyajima M , Arai H , Nagashima Y , Yamaguchi H , Kuwano R , Nagaike K , Ihara Y ; Japanese Alzheimer’s Disease Neuroimaging Initiative ((2012) ) Altered γ-secretase activity in mild cognitive impairment and Alzheimer’s disease. EMBO Mol Med 4: , 344–352. |
[10] | Moore BD , Martin J , de Mena L , Sanchez J , Cruz PE , Ceballos-Diaz C , Ladd TB , Ran Y , Levites Y , Kukar TL , Kurian JJ , McKenna R , Koo EH , Borchelt DR , Janus C , Rincon-Limas D , Fernandez-Funez P , Golde TE ((2018) ) Short Aβ peptides attenuate Aβ42 toxicity in vivo. J Exp Med 215: , 283–301. |
[11] | Iizuka T , Shoji M , Harigaya Y , Kawarabayashi T , Watanabe M , Kanai M , Hirai S ((1995) ) Amyloid beta-protein ending at Thr43 is a minor component of some diffuse plaques in the Alzheimer’s disease brain, but is not found in cerebrovascular amyloid. Brain Res 702: , 275–278. |
[12] | Welander H , Frånberg J , Graff C , Sundström E , Winblad B , Tjernberg LO ((2009) ) Abeta43 is more frequent than Abeta40 in amyloid plaque cores from Alzheimer disease brains. J Neurochem 110: , 697–706. |
[13] | Sandebring A , Welander H , Winblad B , Graff C , Tjernberg LO ((2013) ) The pathogenic aβ43 is enriched in familial and sporadic Alzheimer disease. PLoS One 8: , e55847. |
[14] | Conicella AE , Fawzi NL ((2014) ) The C-terminal threonine of Aβ43 nucleates toxic aggregation via structural and dynamical changes in monomers and protofibrils. Biochemistry 53: , 3095–3105. |
[15] | Lauridsen C , Sando SB , Møller I , Berge G , Pomary PK , Grøntvedt GR , Salvesen Ø , Bråthen G , White LR ((2017) ) Cerebrospinal fluid Aβ43 is reduced in early-onset compared to late-onset Alzheimer’s disease, but has similar diagnostic accuracy to Aβ42. Front Aging Neurosci 9: , 210. |
[16] | Lauridsen C , Sando SB , Shabnam A , Møller I , Berge G , Grøntvedt GR , Bakken IJ , Salvesen Ø , Bråthen G , White LR ((2016) ) Cerebrospinal fluid levels of amyloid beta 1-43 in patients with amnestic mild cognitive impairment or early Alzheimer’s disease: A 2-year follow-up study. Front Aging Neurosci 8: , 30. |
[17] | Goda R , Kobayashi N ((2012) ) Evaluation of peptide adsorption-controlled liquid chromatography-tandem mass spectrometric (PAC-LC-MS/MS) method for simple and simultaneous quantitation of amyloid β 1-38, 1-40, 1-42 and 1-43 peptides in dog cerebrospinal fluid. J Chromatogr B Analyt Technol Biomed Life Sci 895-896: , 137–145. |
[18] | Lame ME , Chambers EE , Blatnik M ((2011) ) Quantitation of amyloid beta peptides Aβ(1-38), Aβ(1-40), and Aβ(1-42) in human cerebrospinal fluid by ultra-performance liquid chromatography-tandem mass spectrometry. Anal Biochem 419: , 133–139. |
[19] | Pottiez G , Yang L , Stewart T , Song N , Aro P , Galasko DR , Quinn JF , Peskind ER , Shi M , Zhang J ((2017) ) Mass-spectrometry-based method to quantify in parallel tau and amyloid β 1-42 in CSF for the diagnosis of Alzheimer’s disease. J Proteome Res 16: , 1228–1238. |
[20] | Janelidze S , Zetterberg H , Mattsson N , Palmqvist S , Vanderstichele H , Lindberg O , van Westen D , Stomrud E , Minthon L , Blennow K ; Swedish BioFINDER study group, Hansson O ((2016) ) CSF Aβ42/Aβ40 and Aβ42/Aβ38 ratios: Better diagnostic markers of Alzheimer disease. Ann Clin Transl Neurol 3: , 154–165. |
[21] | Adamczuk K , Schaeverbeke J , Vanderstichele HM , Lilja J , Nelissen N , Van Laere K , Dupont P , Hilven K , Poesen K , Vandenberghe R ((2015) ) Diagnostic value of cerebrospinal fluid Aβ ratios in preclinical Alzheimer’s disease. Alzheimers Res Ther 7: , 75. |
[22] | Schoonenboom NS , Mulder C , Van Kamp GJ , Mehta SP , Scheltens P , Blankenstein MA , Mehta PD ((2005) ) Amyloid beta 38, 40, and 42 species in cerebrospinal fluid: More of the same? Ann Neurol 58: , 139–142. |
[23] | Koychev I , Galna B , Zetterberg H , Lawson J , Zamboni G , Ridha BH , Rowe JB , Thomas A , Howard R , Malhotra P , Ritchie C , Lovestone S , Rochester L ((2018) ) Aβ42/Aβ40 and Aβ42/Aβ38 ratios are associated with measures of gait variability and activities of daily living in mild Alzheimer’s disease: A pilot study. J Alzheimers Dis 65: , 1377–1383. |
[24] | Shaw LM , Vanderstichele H , Knapik-Czajka M , Figurski M , Coart E , Blennow K , Soares H , Simon AJ , Lewczuk P , Dean RA , Siemers E , Potter W , Lee VM , Trojanowski JQ ; Alzheimer’s Disease Neuroimaging Initiative ((2011) ) Qualification of the analytical and clinical performance of CSF biomarker analyses in ADNI. Acta Neuropathol 121: , 597–609. |
[25] | Mattsson N , Andreasson U , Persson S , Arai H , Batish SD , Bernardini S , Bocchio-Chiavetto L , Blankenstein MA , Carrillo MC , Chalbot S , Coart E , Chiasserini D , Cutler N , Dahlfors G , Duller S , Fagan AM , Forlenza O , Frisoni GB , Galasko D , Galimberti D , Hampel H , Handberg A , Heneka MT , Herskovits AZ , Herukka SK , Holtzman DM , Humpel C , Hyman BT , Iqbal K , Jucker M , Kaeser SA , Kaiser E , Kapaki E , Kidd D , Klivenyi P , Knudsen CS , Kummer MP , Lui J , Lladó A , Lewczuk P , Li QX , Martins R , Masters C , McAuliffe J , Mercken M , Moghekar A , Molinuevo JL , Montine TJ , Nowatzke W , O’Brien R , Otto M , Paraskevas GP , Parnetti L , Petersen RC , Prvulovic D , de Reus HP , Rissman RA , Scarpini E , Stefani A , Soininen H , Schröder J , Shaw LM , Skinningsrud A , Skrogstad B , Spreer A , Talib L , Teunissen C , Trojanowski JQ , Tumani H , Umek RM , Van Broeck B , Vanderstichele H , Vecsei L , Verbeek MM , Windisch M , Zhang J , Zetterberg H , Blennow K ((2011) ) The Alzheimer’s Association external quality control program for cerebrospinal fluid biomarkers. Alzheimers Dement 7: , 386–395. |
[26] | Korecka M , Waligorska T , Figurski M , Toledo JB , Arnold SE , Grossman M , Trojanowski JQ , Shaw LM ((2014) ) Qualification of a surrogate matrix-based absolute quantification method for amyloid-β in human cerebrospinal fluid using 2D UPLC-tandem mass spectrometry. J Alzheimers Dis 41: , 441–451. |
[27] | Oe T , Ackermann BL , Inoue K , Berna MJ , Garner CO , Gelfanova V , Dean RA , Siemers ER , Holtzman DM , Farlow MR , Blair IA ((2006) ) Quantitative analysis of amyloid beta peptides in cerebrospinal fluid of Alzheimer’s disease patients by immunoaffinity purification and stable isotope dilution liquid chromatography/negative electrospray ionization tandem mass spectrometry. Rapid Commun Mass Spectrom 20: , 3723–3735. |
[28] | Nakamura A , Kaneko N , Villemagne VL , Kato T , Doecke J , Doré V , Fowler C , Li QX , Martins R , Rowe C , Tomita T , Matsuzaki K , Ishii K , Ishii K , Arahata Y , Iwamoto S , Ito K , Tanaka K , Masters CL , Yanagisawa K ((2018) ) High performance plasma amyloid-β biomarkers for Alzheimer’s disease. Nature 554: , 249–254. |
[29] | Lin PP , Chen WL , Yuan F , Sheng L , Wu YJ , Zhang WW , Li GQ , Xu HR , Li XN ((2017) ) An UHPLC-MS/MS method for simultaneous quantification of human amyloid beta peptides Aβ1-38, Aβ1-40 and Aβ1-42 in cerebrospinal fluid using micro-elution solid phase extraction. J Chromatogr B Analyt Technol Biomed Life Sci 1070: , 82–91. |
[30] | McKhann GM , Knopman DS , Chertkow H , Hyman BT , Jack CR Jr , Kawas CH , Klunk WE , Koroshetz WJ , Manly JJ , Mayeux R , Mohs RC , Morris JC , Rossor MN , Scheltens P , Carrillo MC , Thies B , Weintraub S , Phelps CH ((2011) ) The diagnosis of dementia due to Alzheimer’s disease: Recommendations from the National Institute on Aging-Alzheimer’s Association workgroups on diagnostic guidelines for Alzheimer’s disease. Alzheimers Dement 7: , 263–269. |
[31] | Albert MS , DeKosky ST , Dickson D , Dubois B , Feldman HH , Fox NC , Gamst A , Holtzman DM , Jagust WJ , Petersen RC , Snyder PJ , Carrillo MC , Thies B , Phelps CH ((2011) ) The diagnosis of mild cognitive impairment due to Alzheimer’s disease: Recommendations from the National Institute on Aging-Alzheimer’s Association workgroups on diagnostic guidelines for Alzheimer’s disease. Alzheimers Dement 7: , 270–279. |
[32] | de Carvalho M , Dengler R , Eisen A , England JD , Kaji R , Kimura J , Mills K , Mitsumoto H , Nodera H , Shefner J , Swash M ((2008) ) Electrodiagnostic criteria for diagnosis of ALS. Clin Neurophysiol 119: , 497–503. |
[33] | Armstrong MJ , Litvan I , Lang AE , Bak TH , Bhatia KP , Borroni B , Boxer AL , Dickson DW , Grossman M , Hallett M , Josephs KA , Kertesz A , Lee SE , Miller BL , Reich SG , Riley DE , Tolosa E , Tröster AI , Vidailhet M , Weiner WJ ((2013) ) Criteria for the diagnosis of corticobasal degeneration. Neurology 80: , 496–503. |
[34] | Rascovsky K , Hodges JR , Knopman D , Mendez MF , Kramer JH , Neuhaus J , van Swieten JC , Seelaar H , Dopper EG , Onyike CU , Hillis AE , Josephs KA , Boeve BF , Kertesz A , Seeley WW , Rankin KP , Johnson JK , Gorno-Tempini ML , Rosen H , Prioleau-Latham CE , Lee A , Kipps CM , Lillo P , Piguet O , Rohrer JD , Rossor MN , Warren JD , Fox NC , Galasko D , Salmon DP , Black SE , Mesulam M , Weintraub S , Dickerson BC , Diehl-Schmid J , Pasquier F , Deramecourt V , Lebert F , Pijnenburg Y , Chow TW , Manes F , Grafman J , Cappa SF , Freedman M , Grossman M , Miller BL ((2011) ) Sensitivity of revised diagnostic criteria for the behavioural variant of frontotemporal dementia. Brain 134: , 2456–2477. |
[35] | Chare L , Hodges JR , Leyton CE , McGinley C , Tan RH , Kril JJ , Halliday GM ((2014) ) New criteria for frontotemporal dementia syndromes: Clinical and pathological diagnostic implications. J Neurol Neurosurg Psychiatry 85: , 865–70. |
[36] | Gilman S , Wenning GK , Low PA , Brooks DJ , Mathias CJ , Trojanowski JQ , Wood NW , Colosimo C , Dürr A , Fowler CJ , Kaufmann H , Klockgether T , Lees A , Poewe W , Quinn N , Revesz T , Robertson D , Sandroni P , Seppi K , Vidailhet M ((2008) ) Second consensus statement on the diagnosis of multiple system atrophy. Neurology 71: , 670–676. |
[37] | Postuma RB , Berg D , Stern M , Poewe W , Olanow CW , Oertel W , Obeso J , Marek K , Litvan I , Lang AE , Halliday G , Goetz CG , Gasser T , Dubois B , Chan P , Bloem BR , Adler CH , Deuschl G ((2015) ) MDS clinical diagnostic criteria for Parkinson’s disease. Mov Disord 30: , 1591–1601. |
[38] | Höglinger GU , Respondek G , Stamelou M , Kurz C , Josephs KA , Lang AE , Mollenhauer B , Müller U , Nilsson C , Whitwell JL , Arzberger T , Englund E , Gelpi E , Giese A , Irwin DJ , Meissner WG , Pantelyat A , Rajput A , van Swieten JC , Troakes C , Antonini A , Bhatia KP , Bordelon Y , Compta Y , Corvol JC , Colosimo C , Dickson DW , Dodel R , Ferguson L , Grossman M , Kassubek J , Krismer F , Levin J , Lorenzl S , Morris HR , Nestor P , Oertel WH , Poewe W , Rabinovici G , Rowe JB , Schellenberg GD , Seppi K , van Eimeren T , Wenning GK , Boxer AL , Golbe LI , Litvan I ; Movement Disorder Society-endorsed PSP Study Group ((2017) ) Clinical diagnosis of progressive supranuclear palsy: The movement disorder society criteria. Mov Disord 32: , 853–864. |
[39] | Seino Y , Nakamura T , Kawarabayashi T , Hirohata M , Narita S , Wakasaya Y , Kaito K , Ueda T , Harigaya Y , Shoji M ((2019) ) Cerebrospinal fluid and plasma biomarkers in neurodegenerative diseases. J Alzheimers Dis 68: , 395–404. |
[40] | Roberts KF , Elbert DL , Kasten TP , Patterson BW , Sigurdson WC , Connors RE , Ovod V , Munsell LY , Mawuenyega KG , Miller-Thomas MM , Moran CJ , Cross DT 3rd , Derdeyn CP , Bateman RJ ((2014) ) Amyloid-β efflux from the central nervous system into the plasma. Ann Neurol 76: , 837–844. |
[41] | Mawuenyega KG , Sigurdson W , Ovod V , Munsell L , Kasten T , Morris JC , Yarasheski KE , Bateman RJ ((2010) ) Decreased clearance of CNS beta-amyloid in Alzheimer’s disease. Science 330: , 1774. |
[42] | Nakamura T , Kawarabayashi T , Seino Y , Hirohata M , Nakahata N , Narita S , Itoh K , Nakaji S , Shoji M ((2018) ) Aging and APOE-ɛ4 are determinative factors of plasma Aβ42 levels. Ann Clin Transl Neurol 5: , 1184–1191. |
[43] | Swaminathan S , Risacher SL , Yoder KK , West JD , Shen L , Kim S , Inlow M , Foroud T , Jagust WJ , Koeppe RA , Mathis CA , Shaw LM , Trojanowski JQ , Soares H , Aisen PS , Petersen RC , Weiner MW , Saykin AJ ; Alzheimer’s Disease Neuroimaging Initiative ((2014) ) Association of plasma and cortical amyloid beta is modulated by APOE ɛ4 status. Alzheimers Dement 10: , e9–e18. |
[44] | Bateman RJ , Siemers ER , Mawuenyega KG , Wen G , Browning KR , Sigurdson WC , Yarasheski KE , Friedrich SW , Demattos RB , May PC , Paul SM , Holtzman DM ((2009) ) A gamma-secretase inhibitor decreases amyloid-beta production in the central nervous system. Ann Neurol 66: , 48–54. |

