
Alpha Power and Functional Connectivity in Cognitive Decline: A Systematic Review and Meta-Analysis
Abstract
Background:
Mild cognitive impairment (MCI) is a stage between expected age-related cognitive decline and dementia. Dementias have been associated with changes in neural oscillations across the frequency spectrum, including the alpha range. Alpha is the most prominent rhythm in human EEG and is best detected during awake resting state (RS). Though several studies measured alpha power and synchronization in MCI, findings have not yet been integrated.
Objective:
To consolidate findings on power and synchronization of alpha oscillations across stages of cognitive decline.
Methods:
We included studies published until January 2020 that compared power or functional connectivity between 1) people with MCI and cognitively healthy older adults (OA) or people with a neurodegenerative dementia, and 2) people with progressive and stable MCI. Random-effects meta-analyses were performed when enough data was available.
Results:
Sixty-eight studies were included in the review. Global RS alpha power was lower in AD than in MCI (ES = –0.30; 95% CI = –0.51, –0.10; k = 6), and in MCI than in OA (ES = –1.49; 95% CI = –2.69, –0.29; k = 5). However, the latter meta-analysis should be interpreted cautiously due to high heterogeneity. The review showed lower RS alpha power in progressive than in stable MCI, and lower task-related alpha reactivity in MCI than in OA. People with MCI had both lower and higher functional connectivity than OA. Publications lacked consistency in MCI diagnosis and EEG measures.
Conclusion:
Research indicates that RS alpha power decreases with increasing impairment, and could—combined with measures from other frequency bands—become a biomarker of early cognitive decline.
INTRODUCTION
The term mild cognitive impairment (MCI) is used to describe cognitive deficits beyond normal aging but not severe enough to hamper day-to-day activities [1]. These mild deficits often, though not always, progress to dementia [2]. Estimated prevalence of MCI varies between 3 and 24% and is higher in older age groups [3]. With the world’s population aging [4], the number of individuals experiencing pathological cognitive decline is also likely to rise [5]. It would be helpful to identify biomarkers that are sensitive to early stages of cognitive decline and that can be used as measures of disease state, disease progression, and treatment targets.
MCI is a heterogeneous condition with several different etiologies, presentations, and outcomes. While memory impairment was initially a necessary condition for MCI [6], the definition was later revised to include both memory (amnestic MCI, aMCI) and non-memory deficits (non-amnestic MCI, naMCI) [7]. These two subtypes can be broken down further depending on whether the impairment encompasses a single or multiple cognitive domains (single- and multiple-domain MCI) [2]. The majority of people with MCI will not experience further cognitive decline (stable MCI, sMCI) [8], but MCI can be progressive (pMCI). Though MCI has mostly been studied in relation to Alzheimer’s disease (AD), it has also been recognized as a prodromal stage of other neurodegenerative dementias, including dementia with Lewy bodies and dementia due to Parkinson’s disease [9–11], as well as frontotemporal dementia (FTD) [12]. Annual conversion rate is around 10% for dementia due to Parkinson’s disease [13, 14], and from 5 to 20% for AD and dementia with Lewy bodies [8, 15–17]. Conversion rates depend on the subtypes of MCI considered [15, 18], and on whether sampling was clinic- or community-based [8, 19, 20]. However, even according to the lower estimates, people with MCI are at a higher risk of developing dementia than cognitively healthy older adults.
To develop interventions that delay or prevent progression from MCI to dementia, there is a need for affordable, widely accessible, and non-invasive measures of pathology. A promising neurophysiological marker is a change in rhythmic neural activity. These oscillations occur in several frequency bands ranging from slow (delta and theta) to fast (alpha, beta, and gamma) and can be recorded with electroencephalography (EEG). Two of the measures used to describe oscillatory signals are power and synchronization. Power is proportional to the rate of energy change at a specific frequency or frequency band [21]. Oscillations from two or more regions can be synchronized in phase or amplitude, which reflects functional connectivity between them [22, 23]. Power and synchronization of oscillations in different frequency bands are involved in various cognitive and motor processes [21, 24–27]. Activity in each of the bands has been associated with dementia [28–30], and a biomarker specific enough to distinguish between etiologies and outcomes of cognitive decline will likely combine information from several frequency bands and measures. Bands are somewhat arbitrary, and changes in one band are not specific to a particular disorder [31, 32], meaning they need to be interpreted in the context of the whole spectrum. However, reviewing changes in more frequency bands would be beyond the scope of a single paper.
We have therefore decided to take the first step by focusing on the alpha band for three main reasons. First, alpha is the most prominent rhythm during quiet wakefulness [33]. Second, it has large amplitudes ranging from 10 to 50μV [34]. This is in contrast to theta, beta, and gamma waves, which have smaller amplitudes at rest [34–36], and can be best identified using tasks with many repetitions. This makes measuring alpha activity in research and clinical practice highly feasible, as it does not require people with cognitive decline to perform challenging and tiresome tasks. Lastly, lower power and synchronization of alpha oscillations have consistently been associated with neurodegenerative dementias, especially AD [29, 37–39]. These decreases were found to correlate with lower cognitive scores [40, 41], higher atrophy of the hippocampus [42] and higher amyloid burden [43], as well as with genetic susceptibility for AD [44, 45]. Though alpha activity in other neurodegenerative dementias is less well-researched, there is evidence of lower alpha power in people with dementia due to Lewy body disorders [46–49]. Alpha power and synchronization are therefore an important part of the changes in the EEG spectrum associated with cognitive decline.
Though several studies have measured alpha power and synchronization in people with MCI, findings have not yet been integrated. We aim to consolidate findings on power and synchronization of alpha oscillations across stages of cognitive decline, including healthy aging, MCI, and dementia. We will include cross-sectional studies that compared people with MCI with cognitively healthy older adults and with people with a neurodegenerative dementia, as well as longitudinal studies that compared people with MCI who progressed to dementia and those whose cognitive status remained stable.
METHODS
Literature search
This review and meta-analysis were carried out according to PRISMA guidelines [50, 51]. We searched PubMed (k = 549), Web of Science (k = 967), EMBASE (k = 879), PsychINFO (k = 222), and Cochrane (k = 29) for papers published until 24 January 2020. The search terms were: “mild cognitive impairment” AND (eeg OR oscillations). We used broad terms to ensure we captured all relevant papers—titles, abstracts, and keywords often only refer to significant differences in one frequency band, whereas non-significant findings in other bands are only briefly mentioned in the text.
Study selection
Two independent researchers (NL and DIL) reviewed abstracts and full texts. Disagreement was resolved by means of discussion.
The objectives of this paper and the inclusion criteria were framed in terms of the population of interest, comparators, outcomes, and study design (elements of the PICOS model). Abstracts were selected for further screening if they satisfied the following criteria: 1) at least one group with MCI, 2) a comparison group of cognitively healthy older adults or people with a neurodegenerative dementia, or a comparison of people with progressive and stable MCI, 3) used EEG to measure oscillations in awake resting state or during task performance, 4) reported results of alpha power or synchronization analysis, 5) sample size of at least 10 participants per group, and 6) paper published in English.
Studies were only included if the diagnosis of MCI was not related to a medical condition other than a neurodegenerative dementia. Studies on MCI due to cerebrovascular conditions, rapid eye movement sleep behavior disorder, diabetes, or depression were therefore excluded. We excluded conference abstracts, case studies, animal studies, computational models, and reviews and other publications without original data. Because PD itself has been associated with changes in EEG [52–54], we only included studies that compared people with MCI due to Parkinson’s disease (PD-MCI) with cognitively healthy PD patients (PD-CH).
If published data was insufficient or unclear, we contacted the original authors for additional information. When studies were based on overlapping datasets, we only included the most recent publication, the publication with the largest sample size, and/or the most prototypical study. Moreover, we prioritized publications with available means and standard deviations to maximize the amount of studies we could include in meta-analyses. Studies that fulfilled the inclusion criteria but were omitted due to overlapping samples are shown in Supplementary Material 1. We allowed for overlap between studies when they measured different aspects of alpha oscillations. Furthermore, studies were excluded if published data was insufficient to determine whether any differences in alpha activity were found, or if there were inconsistencies within the report and original authors could not be reached or did not provide additional information upon request.
Data extraction
From every included paper, the first author (NL) extracted the following information: 1) first author and year of publication, 2) participant characteristics (diagnosis, sample size, mean age, sex), 3) diagnostic criteria for MCI and dementia, 4) length of follow-up for longitudinal studies, 5) recording conditions (eyes closed or open resting state, or task and cognitive domain), 6) measures of alpha power or synchronization, 7) frequency range, 8) electrodes or sources for which alpha was calculated, 9) whether findings were significant, 10) the direction of significant findings, and 11) the topographic location of significant findings. When available, means and standard deviations, or statistical values that could be used for meta-analysis, were also extracted. Otherwise, original authors were contacted and asked to provide this information. Original authors were also contacted to clarify any uncertainties.
Random-effects meta-analyses
Studies were grouped according to EEG measures (power or synchronization, rest or task-based; brief description of alpha measures can be found in Table 1), participant groups (MCI compared to cognitively healthy older adults, MCI compared to dementia, progressive compared to stable MCI), and alpha definition (full alpha band, lower alpha frequencies, upper alpha frequencies). Meta-analyses were only attempted when we had data of at least five comparable studies, as with a very small number of studies, quantitative analysis does not have added value over the description of individual study results. We were able to perform four meta-analyses: 1) power during awake rest in the full alpha band in people with MCI compared to cognitively healthy older adults, and 2) in people with AD compared to people with MCI; and 3) power during awake rest in lower and 4) upper alpha bands in people with MCI compared to cognitively healthy older adults.
Table 1
An overview of alpha measures included in this review and meta-analysis
| Power at the level of electrodes (sensors) or reconstructed sources | |
| Absolute power | Amplitude of the oscillating waveform squared. It can be calculated for a narrow frequency band or the entire spectrum, and can be averaged over a set of electrodes. |
| Relative power | Absolute power in a narrow frequency band divided by total power. |
| Global field power | Spatial standard deviation across all electrodes that quantifies the amount of whole-brain activity in a frequency band. |
| Current source density | A measure of the strength of sources generating the current recorded by scalp electrodes. |
| ERS/ERD | Event-related synchronization/desynchronization. An increase (ERS) or decrease (ERD) in power in response to a stimulus. |
| Peak-to-peak amplitude | Difference between the highest and the lowest amplitude value. |
| Functional connectivity at the level of electrodes (sensors) or reconstructed sources | |
| Coherence | Degree of linear similarity between the phases of two signals. Based on real and imaginary parts of the cross-spectrum. |
| Imaginary coherence | Coherence based on the imaginary part of the cross-spectrum. |
| Lagged linear connectivity | Coherence between reconstructed activities of cortical sources. It attempts to overcome the problem of volume conduction. |
| Phase lag index | Degree of symmetry between the phase distributions of two signals. It attempts to overcome the problem of volume conduction. |
| Weighted phase lag index | Improved phase lag index. It attempts to overcome the problem of volume conduction. |
| Phase synchronization index | The distribution of phase differences between two signals. |
| Synchronization likelihood | The likelihood that two signals are in the same state at two different times. It detects linear and non-linear interdependencies. |
| Global field synchronization | The percentage of activity across all electrodes that can be explained by a single phase. |
| S-estimator | Synchronization strength based on the interdependent relationship between multi-channel time series in state space. |
| Global synchronization index | Improved S-estimator. |
| Global coupling index | Improved global synchronization index. |
| Amplitude envelope correlation | Synchronization between the magnitude (amplitude) of two signals independent of phase. |
| Source localization methods –estimate the likely location of the sources of EEG signals | |
| Beamforming | |
| Fast Fourier transform (FFT) dipole approximation | |
| Low resolution electromagnetic tomography (LORETA) | |
| Minimum norm estimate | |
| Multivariate autoregressive model-efficient fast independent component analysis (MVAR-EfICA) |
We performed random-effects meta-analyses in Review Manager (RevMan) 5.3 [55]. For 12 out of 13 studies, we used means and standard deviations to calculate standardized mean difference (SMD). If results were reported for each scalp or brain region separately [56–60], we pooled means and standard deviations according to the formulas below [61]. For one study [62], the r value was converted into SMD. See Table 2 for an overview of measures included in meta-analyses.
Table 2
Overview of data included in meta-analyses. MCI diagnoses, power measures used to calculate SMD, and electrodes or sources across which means and standard deviations were pooled
| Paper | Diagnosis | Power measure | Pooled electrodes/sources |
| Babiloni [56] | aMCI | LORETA; current source density | sources: central, frontal, parietal, occipital, temporal, limbic |
| Bonanni [70] | AD-MCI | global relative power | – |
| Caravaglios [62] | aMCI | global absolute power | – |
| Dauwels [71] | AD-MCI | global relative power | – |
| Huang [72] | MCI | FFT dipole approximation; global field power | – |
| Luckhaus [57] | aMCI | absolute power | electrodes: Fz, Cz, Pz |
| Michels [43] | aMCI | beamforming; power at first identified source (angular gyrus) | – |
| Musaeus [58] | MCI | relative power | electrodes: Fp1, Fp2, F3, F4, C3, C4, P3, P4, O1, O2, F7, F8, T3, T4, T5, T6, Fz, Cz, Pz |
| Pons [59] | aMCI | power at the maximum alpha frequency | electrodes: F3, F4, FT7, FT8, C3, C4, TP7, TP8, P3, P4, O1, O2 |
| Poza [69] | AD-MCI | global relative power | – |
| Smailovic [73] | MCI | global field power | – |
| van der Hiele [79] | aMCI | global absolute power | – |
| Ya [60] | AD-MCI | ? power | electrodes: F3, F4, C3, C4, P3, P4, T3, T4, O1, O2 |
MCI, mild cognitive impairment; aMCI, amnestic MCI; AD-MCI, MCI due to Alzheimer’s disease; LORETA, low resolution brain electromagnetic tomography; FFT, fast Fourier transform; question mark indicates information was not reported.
Formulas for pooled mean (above) and standard deviation (it is above) were adapted from the Cochrane Handbook for Systematic Reviews of Interventions [61]. M is mean, SD is standard deviation, N is sample size, and i is iteration. Sample size was assumed to be the same for each scalp or brain region. The number of iterations is equal to the number of regions.
We calculated the overall effect size and 95% confidence intervals (CI). Heterogeneity among studies was examined with I2 [63]. I2 values of 25%, 50%, and 75% were considered low, moderate, and high, respectively [64]. We also calculated power for each study that was included in the meta-analysis with G*Power 3.1 [65]. The primary outcome measure was the difference in EEG power between two groups. Power was estimated given the alpha of 0.05, sample
sizes per group as reported in the original paper, and effect sizes as calculated in RevMan 5.3 [55].
Risk of bias assessment
Risk of bias in individual studies was assessed with a modified Newcastle-Ottawa scale. The modified scale and the assessment of each study are given in Supplementary Material 2.
Potential publication bias was assessed with funnel plot asymmetry. We did not perform Egger’s regression test [66] because the number of studies in each meta-analysis was lower than 10 [67]. Funnel plots are given in Supplementary Material 3.
RESULTS
Study selection
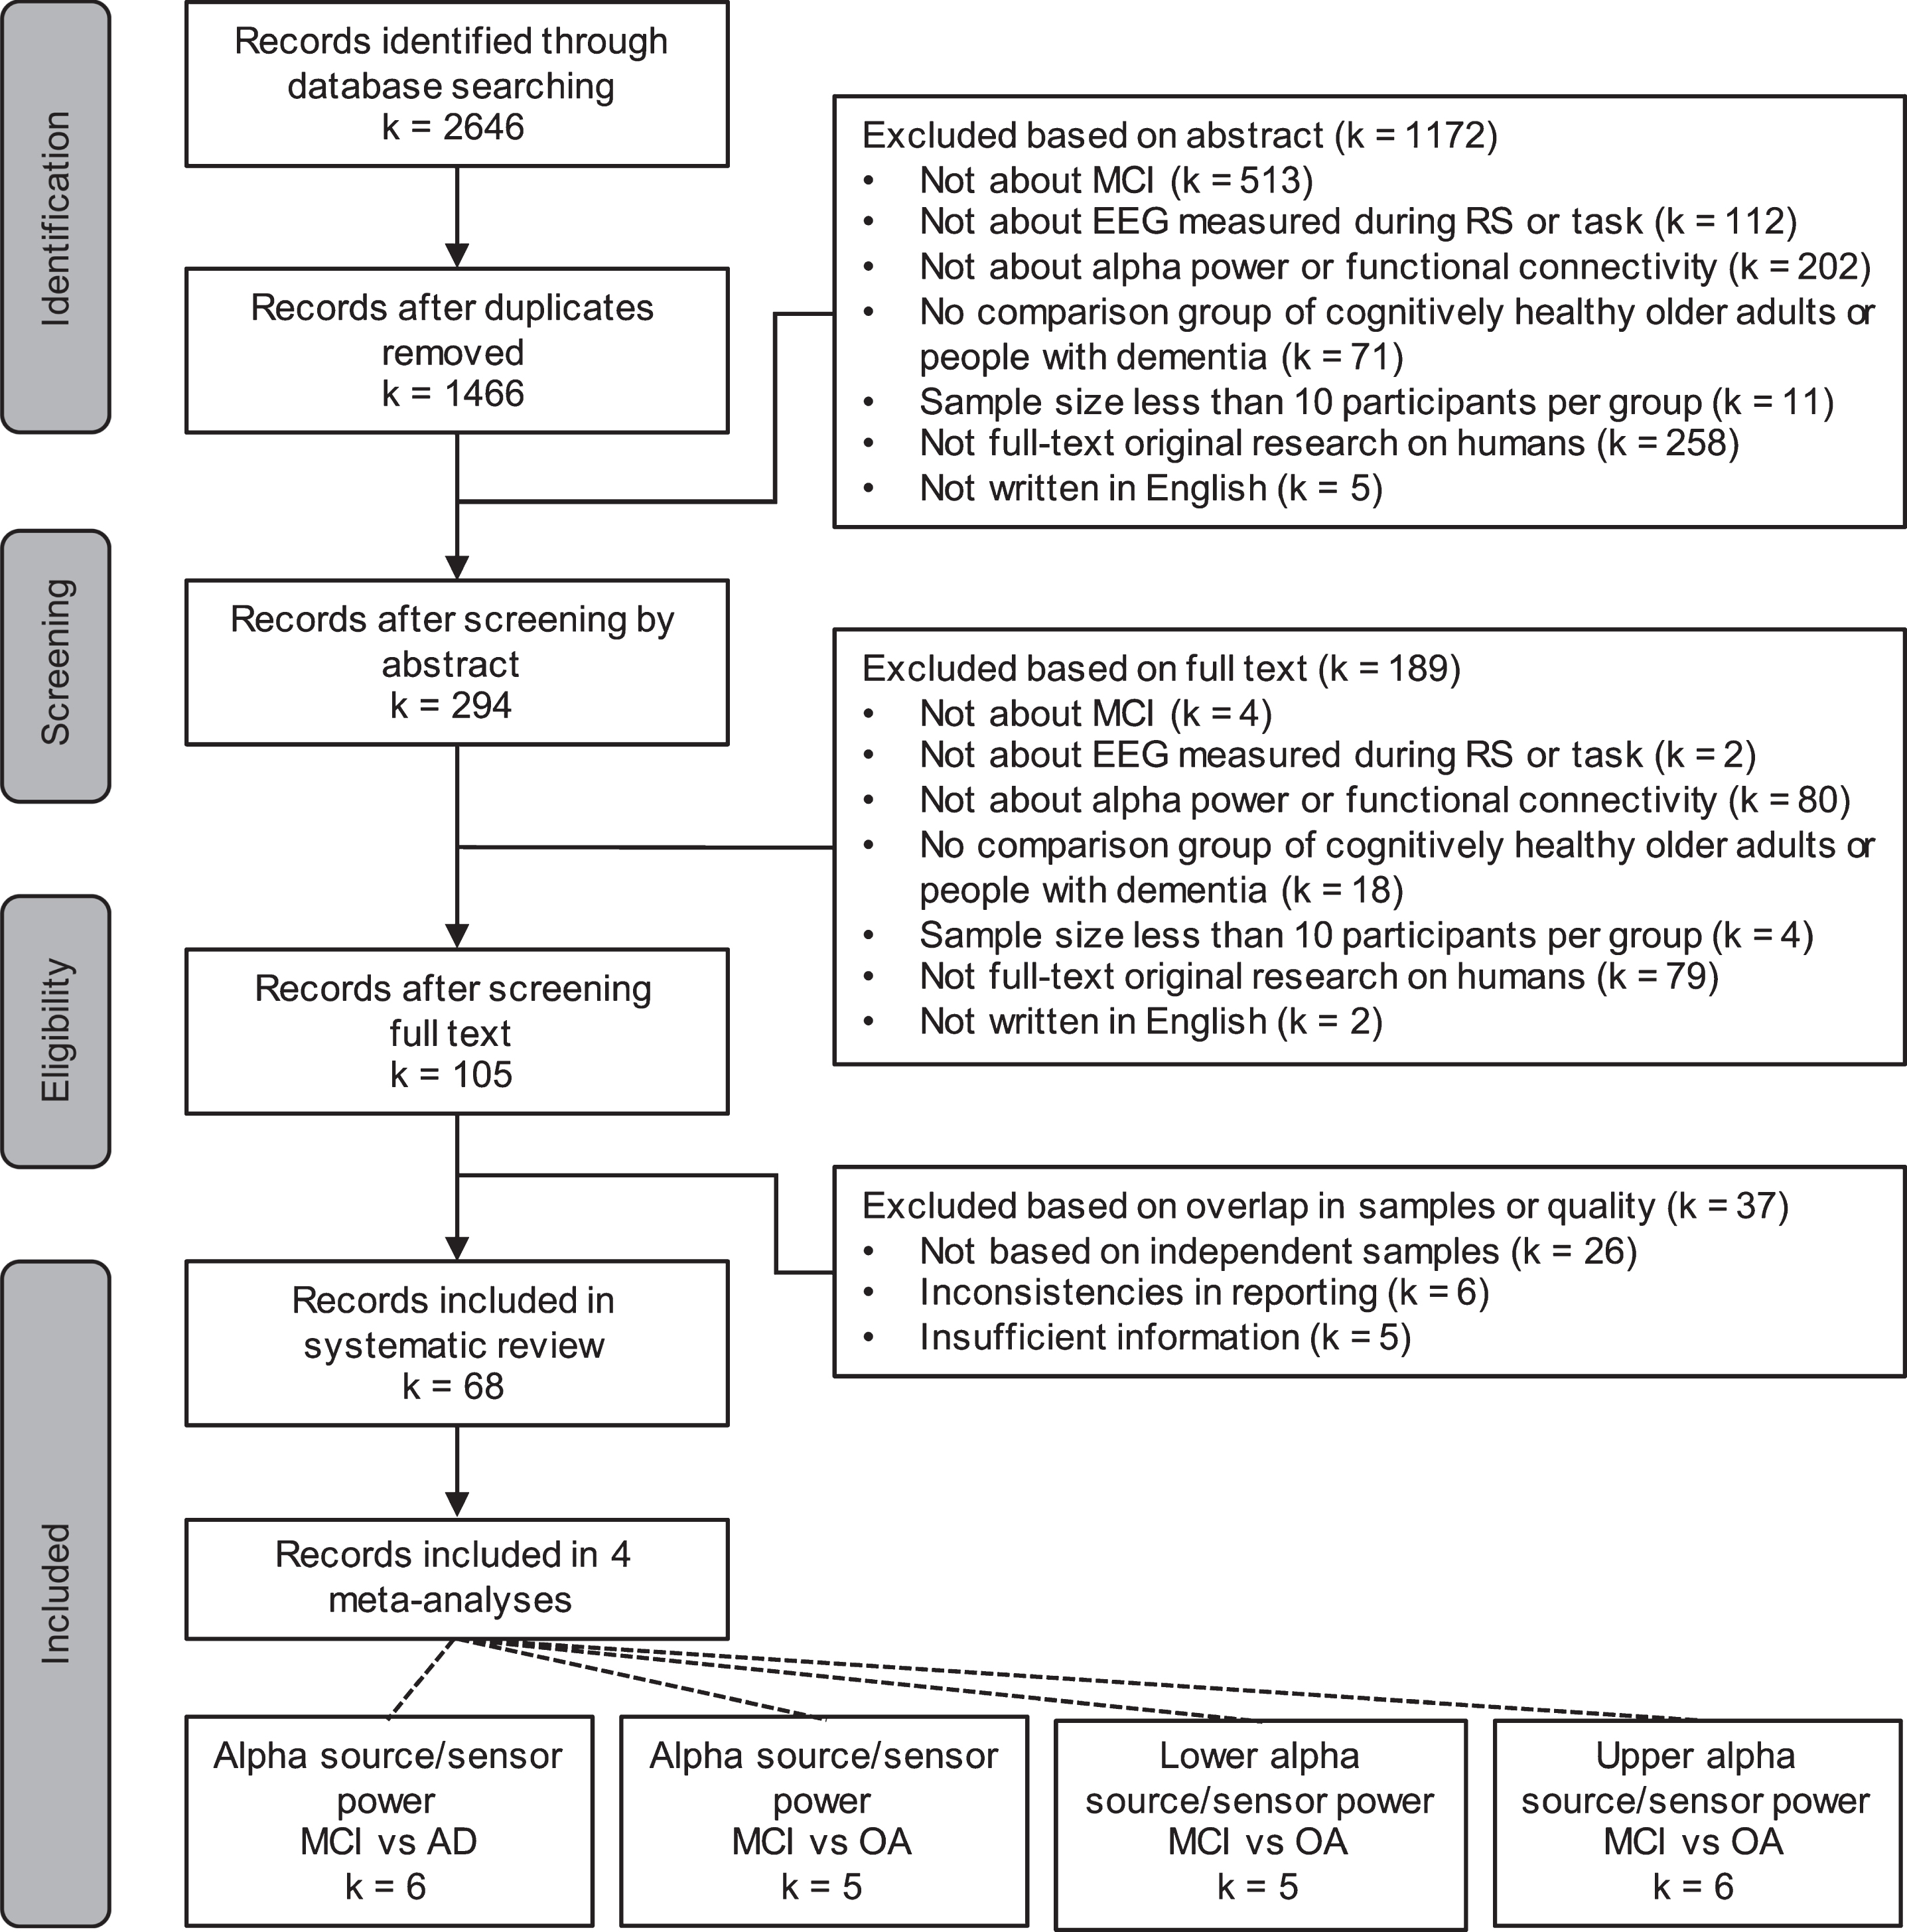
A total of 2,646 records were identified, and after removing duplicates, 1,466 remained. Sixty-eight records were included in the systematic review, some of which reported on more than one measure of interest. The selection procedure is shown in Fig. 1.
Fig. 1
PRISMA flow diagram. MCI, mild cognitive impairment; EEG, electroencephalography; RS, resting state; AD, Alzheimer’s disease; OA, cognitively healthy older adults
Alpha power and functional connectivity during wakeful rest
Cross-sectional studies comparing people with MCI to cognitively healthy older adults and people with AD
Power. In most studies that investigated awake resting state alpha power, participants with MCI were diagnosed with the amnestic subtype (see Table 3 for details). Four studies included people with MCI due to AD (AD-MCI). AD-MCI was either diagnosed according to the 2011 clinical National Institute on Aging and Alzheimer’s Association criteria (NIA-AA: [68]) [60, 69] or confirmed by later conversion to AD [70, 71]. Three studies did not specify the MCI subtype or ascribe MCI to a particular dementia, but did compare people with MCI to people with AD [58, 72, 73]. Sharma et al. [74] did not specify the MCI subtype or the type or dementia, and based their diagnoses solely on the Mini-Mental State Examination score. Jelic et al. [75] included participants with “objective memory disturbances”, but their diagnostic criteria were in line with those that were later developed for aMCI [6]. In other studies, MCI was diagnosed according to widely accepted criteria (e.g., [6, 7, 68, 76]). In all of the studies, EEG was measured with eyes closed. Power was mostly reported as relative power, absolute power, or current source density (see Table 3 for details). For one study [60], it was not clearly stated whether power was relative or absolute.
In four studies, alpha power in the full band was lower in people with MCI than in cognitively healthy older adults (OA; Michels et al. [43], n = 17 aMCI, 17 OA; Musaeus et al. [58], n = 117 AD, 117 MCI, 138 OA; Bonanni et al. [70], n = 50 AD, 14 AD-MCI, 50 OA; Roh et al. [77], n = 41 AD, 38 aMCI, 39 OA), and in two of these, alpha power decreased with increasing impairment (Musaeus et al. [58], n = 117 AD, 117 MCI, 138 OA; Roh et al. [77], n = 41 AD, 38 aMCI, 39 OA). Three additional studies found lower alpha power in people with AD than in people with MCI (Huang et al. [72], n = 38 AD, 31 MCI, 24 OA; Smailovic et al. [73], n = 197 AD, 230 MCI; Jelic et al. [75], n = 18 AD, 19 aMCI, 16 OA). Though decreases were also reported for global measures [70, 72, 73] and for all areas of the scalp, they were most often found in posterior (temporal, parietal, and occipital) areas [43, 58, 72, 75, 77].
Table 3
Power in awake resting state at the level of electrodes and sources of neural activity in people with aMCI, MCI, and MCI due to AD
| Paper | Groups | Diagnosis | n | Age (y) | Sex (% F) | EEG measure | Alpha (Hz) | Results | Electrodes/sources | Location of significant differences | |
| MCI versus OA | AD versus MCI | ||||||||||
| Musaeus [58] | AD | DSM-IV-TR, McKhann [?] | 117 | 75.5 (7.7 SD) | 60.7 | Welch’s relative power | 9–12.99 | ↓ | ↓ | electrodes: 19 | OA > MCI: F7, T5, F8, T4, T6, O2 |
| MCI | Winblad [7] | 117 | 70.2 (8.1 SD) | 53 | (eyes closed) | OA > MCI | MCI > AD | MCI > AD: F7, T3, T5, F8, T4, T6, P4, O2 | |||
| OA | 138 | 66.6 (7.6 SD) | 60.1 | ||||||||
| Roh [77] | AD | McKhann [204] | 41 | 73.8 (5.8 SD) | 87.8 | FFT relative power | 8–12 | ↓ | ↓ | electrodes: 19 | left and right parieto-occipital (P3/P7/O1, P4/P8/O2) |
| aMCI | Petersen [6] | 38 | 72.2 (5.7 SD) | 65.8 | (eyes closed) | OA > aMCI | aMCI > AD | ||||
| OA | 39 | 72.7 (4.3 SD) | 69.2 | ||||||||
| Bonanni [70] | AD | McKhann [204] CSF biomarker (Aβ42, tau, Ptau) positive | 50 | 71.3 (4.4 SD) | 60 | FFT relative power | 9–12 | ↓ | x | electrodes: 19 | global averaged |
| AD-MCI | Petersen [6], conversion | 14 | 71.9 (9.7 SD) | 50 | (eyes closed) | OA > AD-MCI | |||||
| OA | 50 | 72.6 (5.4 SD) | 48 | ||||||||
| Michels [43] | aMCI | ?, 6 APOE ɛ4 allele | 17 | 72.1 (4.6 SD) | 29.4 | beamforming; | 8–13 | ↓ | – | electrodes: 60 | angular gyrus |
| source power | OA > aMCI | sources: whole brain | |||||||||
| OA | 5 APOE ɛ4 allele | 17 | 71.8 (4.6 SD) | 29.4 | (eyes closed) | ||||||
| Jelic [75] | AD | McKhann [204] | 18 | 61.1 (5.5 SD) | 66.7 | FFT relative power | 8–13 | x | ↓ | electrodes: 12 | all regions: left and right frontal (F3/C3, F4/C4), left and right temporal (T3/T5, T4/T6), left and right parieto-occipital (P3/O1, P4/O2) |
| aMCI | similar to Petersen | 19 | 61.5 (7.0 SD) | 66.7 | (eyes closed) | aMCI > AD | |||||
| OA | 16 | 64.3 (10.8 SD) | 43.8 | ||||||||
| Huang [72] | AD | McKhann [204] | 38 | 62.7 (7.1 SD) | 55.3 | FFT relative power | 8–11.5 | x | ↓ | electrodes: 16 | all regions: left and right fronto-central (F3/C3, F4/C4), left and right temporal (T3/T5, T4/T6), left and right centro-parietal (C3/P3, C4/P4), and left and right temporo-occipital (T5/O1, T6/O2) |
| MCI > AD | |||||||||||
| MCI | similar to Petersen | 31 | 61.2 (8.0 SD) | 51.6 | FFT dipole approximation; | x | ↓ | global | |||
| global field power | MCI > AD | electrodes: 20 | |||||||||
| OA | 24 | 63.4 (9.8 SD) | 62.5 | (eyes closed) | sources: whole brain | ||||||
| Poza [69] | AD | McKhann [205] | 37 | 79.2 (6.9 SD) | 64.9 | CWT relative power | 8–13 | x | x | electrodes: 19 | |
| AD-MCI | Albert [68] | 19 | 76.5 (7.5 SD) | 57.9 | (eyes closed) | ||||||
| OA | 29 | 76.6 (7.2 SD) | 69 | ||||||||
| Sharma [74] | dementia | HMSE score < 18 | 15 | 61.1 (? SD) | ? | Welch’s absolute power | 8.6–12.6 | x | x | electrodes: 21 | |
| MCI | HMSE score 18–24 | 16 | 58.4 (? SD) | ? | (eyes closed) | ||||||
| OA | 13 | 52.1 (? SD) | ? | ||||||||
| Kwak [132] | AD | McKhann [204] | 146 | 76.4 (8.1 SD) | 64.4 | FFT relative power | 8–13 | x | ? | electrodes: 20 | |
| aMCI | Petersen [76] | 14 | 72.5 (6.0 SD) | 71.4 | (eyes closed) | ||||||
| OA | 34 | 73.5 (8.4 SD) | 47.1 | ||||||||
| Smailovic [73] | AD | ICD-10 | 197 | 67.8 (9.2 SD) | 63.5 | FFT global field power | 8–11.5 | – | ↓ | electrodes: ? | global |
| MCI | Winblad [7] | 230 | 65.9 (8.2 SD) | 52.6 | (eyes closed) | MCI > AD | |||||
| Luckhaus [57] | AD | McKhann [204] | 42 | 69.1 (10.7 SD) | 43.2 | FFT absolute power | 8–11.5 | – | x | electrodes: 3 | |
| aMCI | Petersen [6] | 88 | 65.9 (9.6 SD) | 52.3 | (eyes closed) | Fz, Cz, Pz | |||||
| Scrascia [206] | mild AD | McKhann [205] | 18 | 75.3 (1.7 SD) | 44.4 | Welch’s absolute power | 8–12 | – | x | electrodes: 19 | |
| moderate AD | 8 | 77.0 (2.5 SD) | 50 | (eyes closed) | |||||||
| aMCI | Petersen [76] | 12 | 74.3 (2.1 SD) | 25 | |||||||
| Hsiao [207] | AD | DSM-IV, McKhann [204] | 21 | 82.7 (7.5 SD) | 71.4 | minimum norm estimate; | 8–13 | – | x | electrodes: 19 | |
| source power | sources: sensorimotor network | ||||||||||
| aMCI | Petersen [1] | 21 | 80.4 (5.6 SD) | 61.9 | (eyes closed) | ||||||
| Vecchio [81] | AD | DSM-IV-TR, McKhann [205], MRI biomarker positive | 174 | 73.2 (0.6 SE) | 71.3 | sLORETA; | 8–10.5 | ↓ | ↓ | electrodes: 19 | parietal, occipital, limbic |
| aMCI | Petersen [76] | 154 | 71.5 (0.6 SE) | 55.8 | current source density | OA > aMCI | aMCI > AD | sources: | |||
| (eyes closed) | 10.5–13 | ↓ | ↓ | whole brain | occipital | ||||||
| OA | 50 | 72.9 (1.0 SE) | 50 | OA > aMCI | aMCI > AD | ||||||
| Babiloni [80] | AD | DSM-IV, McKhann [204] | 73 | 74.1 (1.0 SE) | 47.9 | FFT relative power | 8–10 | ↓ | ↓ | electrodes: 9 | left, right, central parietal (P3, P4, Pz) |
| aMCI | Petersen [76], Portet [208] | 69 | 74.1 (0.8 SE) | 55.1 | OA > aMCI | aMCI > AD | |||||
| 10–12 | x | x | |||||||||
| OA | 64 | 73.7 (0.9 SE) | 50 | ||||||||
| Babiloni [56] | AD | DSM-IV, McKhann [204] | 108 | 71.0 (0.8 SE) | ? | LORETA; | 8–10.5 | ↓ | ↓ | electrodes: 19 | parietal, occipital, limbic, global |
| aMCI | Petersen [76], Portet [208] | 102 | 69.4 (1.0 SE) | ? | current source density | OA > aMCI | aMCI > AD | sources: | |||
| (eyes closed) | 10.5–13 | x | x | whole brain | |||||||
| OA | 57 | 73.4 (0.9 SE) | ? | ||||||||
| McBride [78] | AD | ?, no APOE ɛ4 allele | 17 | 76.7 (5.2 SD) | 60 | Welch’s relative power | 7.5–9.5 | x | x | electrodes: 30 | |
| aMCI | ?, no APOE ɛ4 allele | 16 | 74.6 (9.0 SD) | 25 | (eyes closed) | ||||||
| 9.5–12.5 | x | x | |||||||||
| OA | 15 | 75.7 (5.5 SD) | 50 | ||||||||
| Ya [60] | AD | Albert [68] | 40 | 73.5 (7.3 SD) | 37.5 | ? power | 8–10.9 | x | x | electrodes: 10 | |
| AD-MCI | Albert [68] | 40 | 71.9 (7.9 SD) | 42.5 | (eyes closed) | ||||||
| 11–13.9 | x | x | |||||||||
| OA | 40 | 70.4 (7.1 SD) | 45 | ||||||||
| Dauwels [71] | AD-MCI | conversion, postmortem examination | 22 | 71.9 (10.2 SD) | ? | DFT relative power | 8–10 | x | – | electrodes: 21 | |
| OA | 38 | 71.7 (8.3 SD) | ? | (eyes closed) | 10–12 | x | |||||
| van der Hiele [79] | aMCI | Petersen [6] | 12 | 74.0 (6.0 SD) | 41.7 | FFT absolute power | 8–10.5 | x | – | electrodes: 17 | |
| OA | 16 | 72.0 (5.0 SD) | 56.3 | (eyes closed) | 10.5–13 | x | |||||
| Pons [59] | aMCI | Petersen [6] | 30 | 66.8 (4.7 SD) | 30 | power at maximum alpha frequency | 7–9 | → | – | electrodes: 12 | left and right central (C3, C4), parietal (P3, P4, TP8), occipital (O1, O2) |
| (eyes closed) | aMCI > OA | ||||||||||
| OA | 30 | 68.4 (6.1 SD) | 30 | 9.1–11 | ↓ | left and right occipital (O1, O2) | |||||
| OA > aMCI | |||||||||||
| Caravaglios [62] | aMCI | Albert [68] | 27 | 70.6 (6.6 SD) | 70.3 | FFT absolute power | upper alpha individually determined | → | – | electrodes: 21 | all electrodes |
| OA | 15 | 67.3 (6.5 SD) | 53.3 | (eyes closed) | aMCI > OA | ||||||
| Hsiao [94] | AD | DSM-IV, McKhann [204] | 21 | 82.7 (7.5 SD) | 71.4 | minimum norm estimate; | lower alpha individually determined | – | ↓ | electrodes: 19 | left medial temporal cortex, right inferior parietal cortex, bilateral PCC |
| source power | aMCI > AD | sources: default mode network | |||||||||
| aMCI | Petersen [1] | 21 | 80.4 (5.6 SD) | 61.9 | (eyes closed) | upper alpha individually determined | ↓ | bilateral medial frontal cortex, ACC, inferior parietal cortex, PCC, precuneus, left medial temporal cortex | |||
| aMCI > AD | |||||||||||
| Hsiao [94] | AD | DSM-IV, McKhann [204] | 21 | 82.7 (7.5 SD) | 71.4 | minimum norm estimate; source power (eyes closed) | lower alpha individually determined | – | ↓ aMCI > AD | electrodes: 19 sources: default mode network | left medial temporal cortex, right inferior parietal cortex, bilateral PCC |
| aMCI | Petersen [1] | 21 | 80.4 (5.6 SD) | 61.9 | upper alpha individually determined | ↓ aMCI > AD | bilateral medial frontal cortex, ACC, inferior parietal cortex, PCC, precuneus, left medial temporal cortex |
Arrows indicate whether power in the more cognitively impaired group was significantly lower or higher than in the less impaired group and crosses mark non-significant findings. Dashes indicate that differences between the two groups were not investigated, and question marks that information was not reported or was unclear. AD, Alzheimer’s disease; MCI, mild cognitive impairment; aMCI, amnestic MCI; OA, cognitively healthy older adults; SD, standard deviation; SE, standard error; FFT, fast Fourier transform; DFT, discrete Fourier transform; CWT, continuous wavelet transform; (s)LORETA, standardized low resolution brain electromagnetic tomography; PCC, posterior cingulate cortex; ACC, anterior cingulate cortex; DSM, Diagnostic and Statistical Manual of Mental Disorders; ICD, International Classification of Diseases; CSF, cerebrospinal fluid; Ptau, phosphorylated-tau; HMSE, Hindi version of the Mini-Mental State Exam.
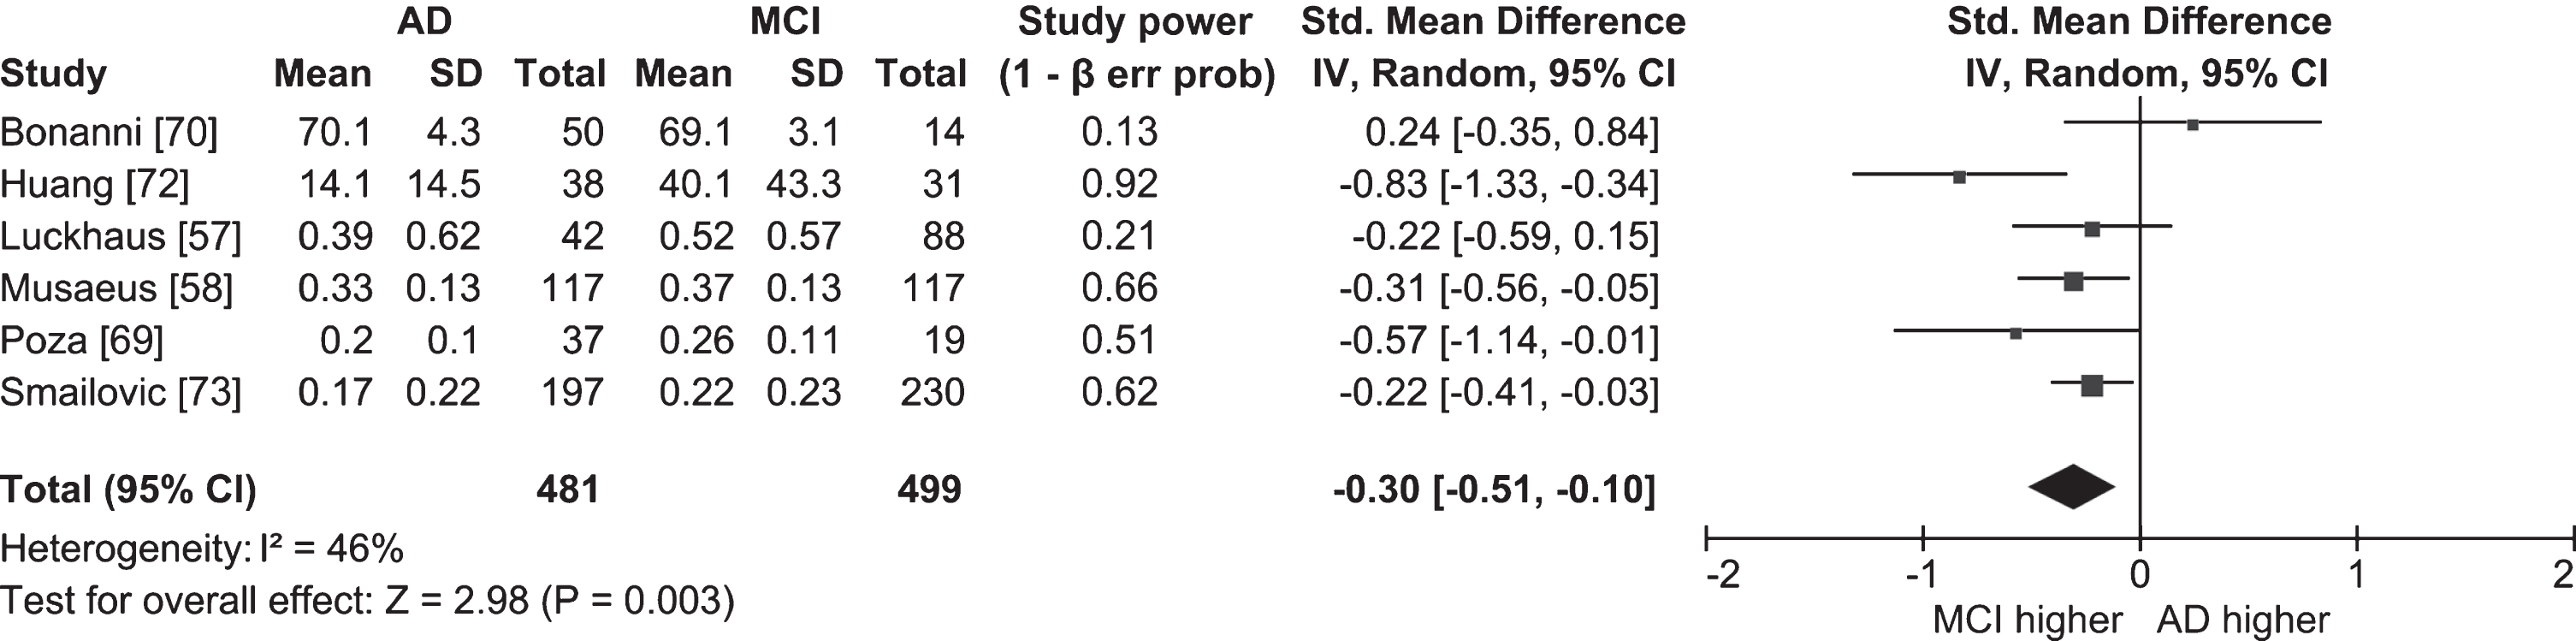
We performed separate meta-analyses comparing resting state power in the full alpha band in people with MCI and cognitively healthy older adults (Fig. 2; k = 5; n = 198 MCI, 258 OA), and in people with MCI and people with AD (Fig. 3; k = 6; n = 481 AD, 499 MCI). The overall effect sizes indicated that people with MCI have lower resting state alpha power than cognitively healthy older adults (ES = –1.49; 95% CI = –2.69, –0.29; p = 0.02), and that people with AD have lower resting state alpha power than people with MCI (ES = –0.30; 95% CI = –0.51, –0.10; p = 0.003). However, because the meta-analysis comparing people with MCI and cognitively healthy older adults included studies with highly heterogeneous outcomes (I2 = 96%), the result should be interpreted with caution. The two studies that contributed most to the heterogeneity were Michels et al. [43] and Bonanni et al. [70], both of which had very high effect sizes (–5.84 and –2.86, respectively) indicating resting state alpha power was lower in people with MCI than in cognitively healthy older adults. Michels et al. [43] only compared power at the strongest source (angular gyrus), which likely inflated the result compared to other studies where power was compared globally [58, 69, 70, 72]. In addition, Bonanni et al. [70] only included participants who later converted to AD. Given the findings of longitudinal studies (see below) that found alpha power was lower in converters than non-converters, it is possible that participants in Bonanni et al. [70] had lower alpha power than participants in studies where converters and non-converters were grouped together.
Fig. 2
Table and forest plot of effect sizes for power in awake resting state in the full alpha band in people with MCI versus cognitively healthy older adults (OA). The table shows mean, standard deviation (SD) and sample size (Total) for each participant group, and power for each study. Standardized mean difference and 95% confidence intervals (CI) for each study are shown in the table and in the forest plot as squares. The size of the square represents the weight of the study, and the whiskers the CI. Standardized mean difference was calculated by subtracting the mean alpha power of the OA group from that of the MCI group and dividing it by the standard deviation of alpha power among both groups. The overall effect size and 95% CI are shown in the table and in the forest plot as a diamond. The width of the diamond represents 95% CI. Statistical significance of the overall effect was calculated with the z-test.
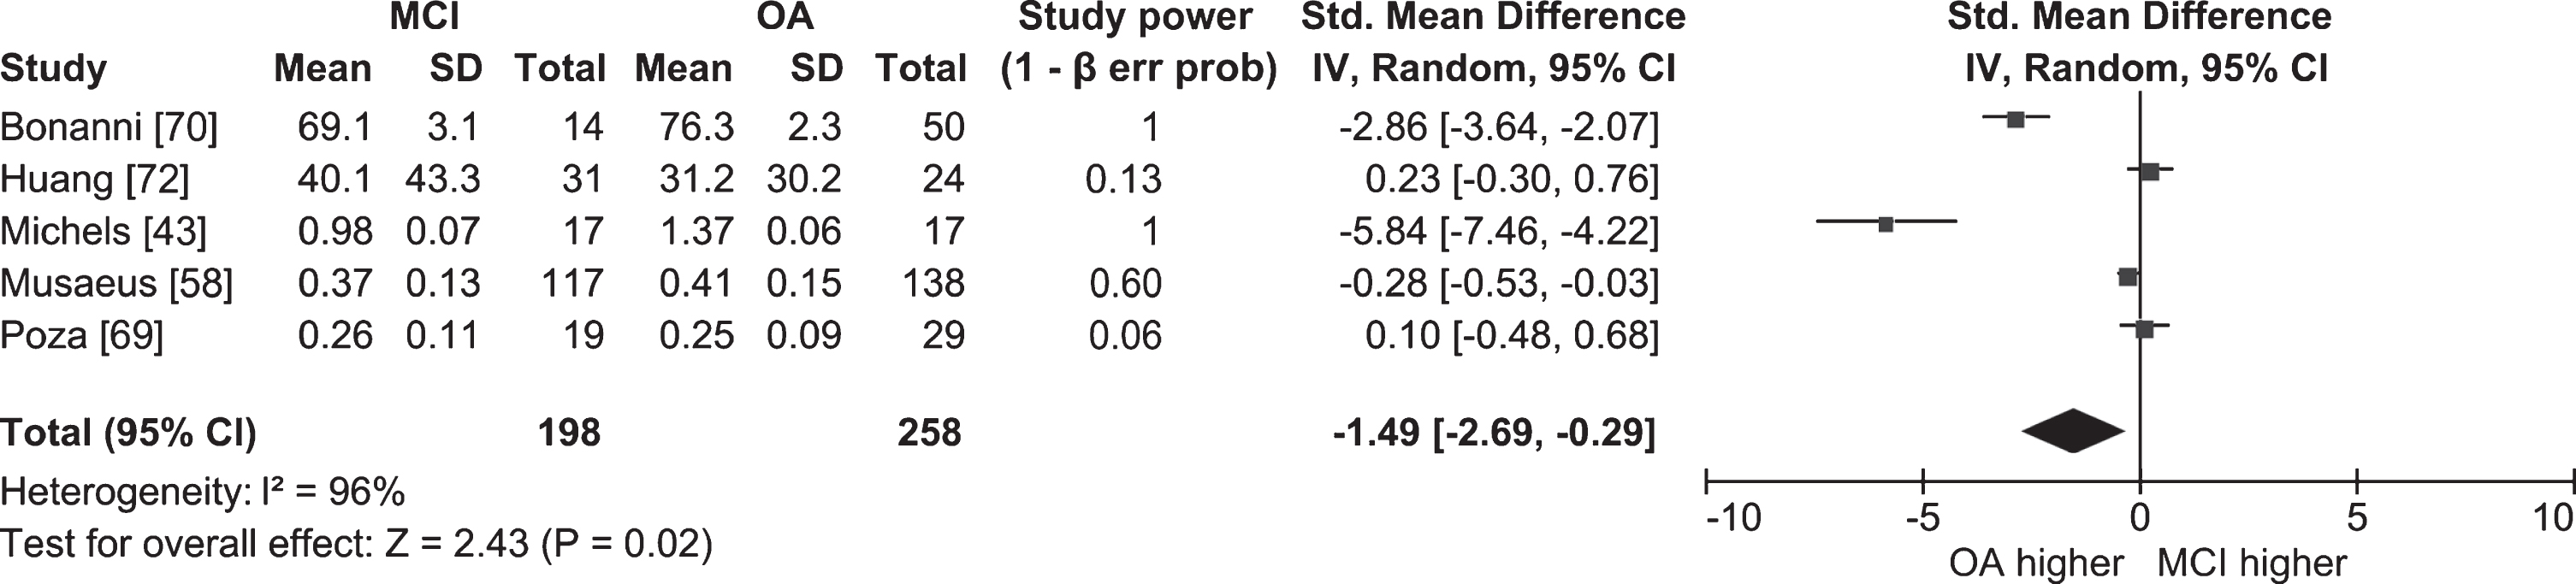
Fig. 3
Table and forest plot of effect sizes for power in awake resting state in the full alpha band in people with AD versus people with MCI. Standardized mean difference was calculated by subtracting the mean alpha power of the MCI group from that of the AD group and dividing it by the standard deviation of alpha power among both groups. For the explanation of the table and the plot, see Fig. 2.
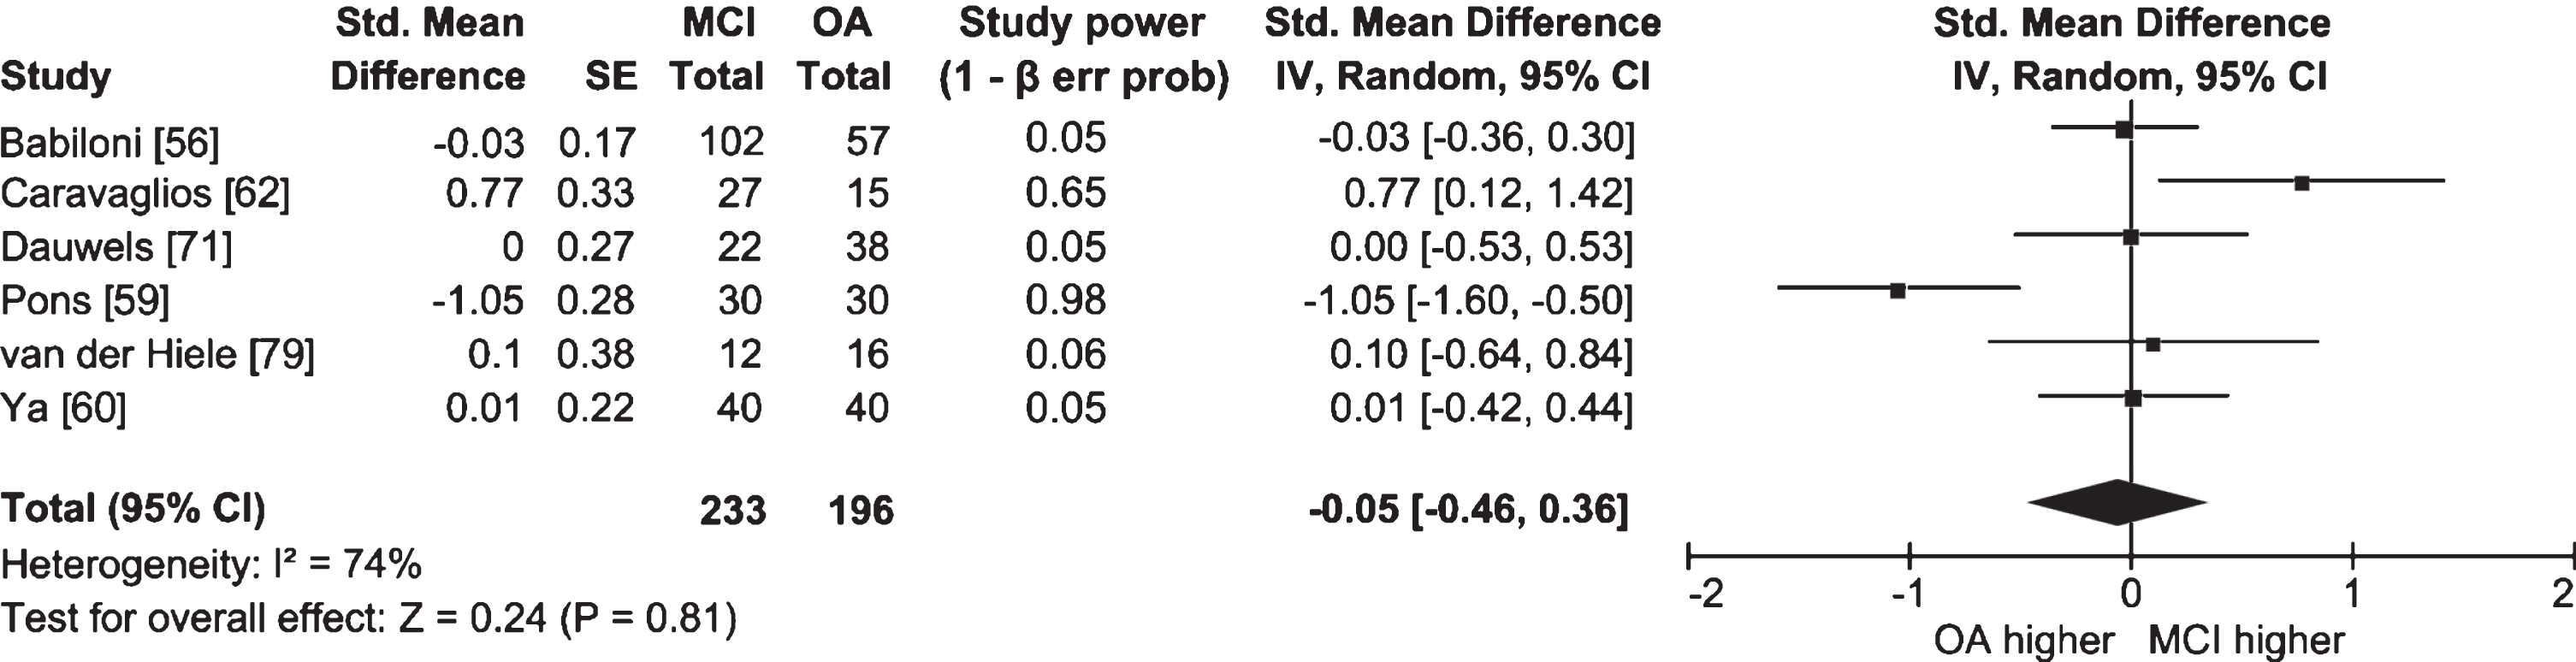
Half of the studies in which lower and upper alpha bands were examined separately did not find significant differences between people with MCI and cognitively healthy older adults (Ya et al. [60], n = 40 AD, 40 AD-MCI, 40 OA; Dauwels et al. [71], n = 22 AD-MCI, 38 OA; McBride et al. [78], n = 17 AD, 16 aMCI, 15 OA; van der Hiele et al. [79], n = 12 aMCI, 16 OA). Meta-analyses for each band were also non-significant, and I2 values indicated high heterogeneity between studies (lower alpha: Fig. 4; k = 5; n = 206 MCI, 181 OA; ES = 0.23; 95% CI = –0.34, 0.81; p = 0.42; I2 = 85%; upper alpha: Fig. 5; k = 6; n = 233 MCI, 196 OA; ES = –0.05; 95% CI = –0.46, 0.36; p = 0.81; I2 = 74%). Studies that did report significant differences had conflicting findings (Pons et al. [59], n = 30 aMCI, 30 OA; Caravaglios et al. [62], n = 27 aMCI, 15 OA; Babiloni et al. [80], n = 73 AD, 69 aMCI, 64 OA; Vecchio et al. [81], n = 174 AD, 154 aMCI, 50 OA) that could be explained by differences in methodology and the definition of alpha. Whereas studies by Babiloni et al. [80] and Vecchio et al. [81] had large sample sizes, studies by Pons et al. [59] and Caravaglios et al. [62] had smaller samples. In addition, results of the study by Pons et al. [59] could be affected by an overlap between alpha and theta activity. Though alpha band is usually defined as ranging from 8 to 13 Hz [82], Pons et al. [59] measured lower alpha power in the 7–9 Hz range, which includes frequencies belonging to the theta band. They measured power only at the individually determined peak alpha frequency in the 7–9 Hz range, and found that it was higher in people with MCI than in cognitively healthy older adults. For some people with MCI, the peak could have been in the theta band, which—contrary to alpha—was found to have higher power in MCI [58] and AD [29].
Fig. 4
Table and forest plot of effect sizes for power in awake resting state in the lower alpha band in people with MCI versus cognitively healthy older adults (OA). For the explanation of the table and the plot, see Fig. 2.
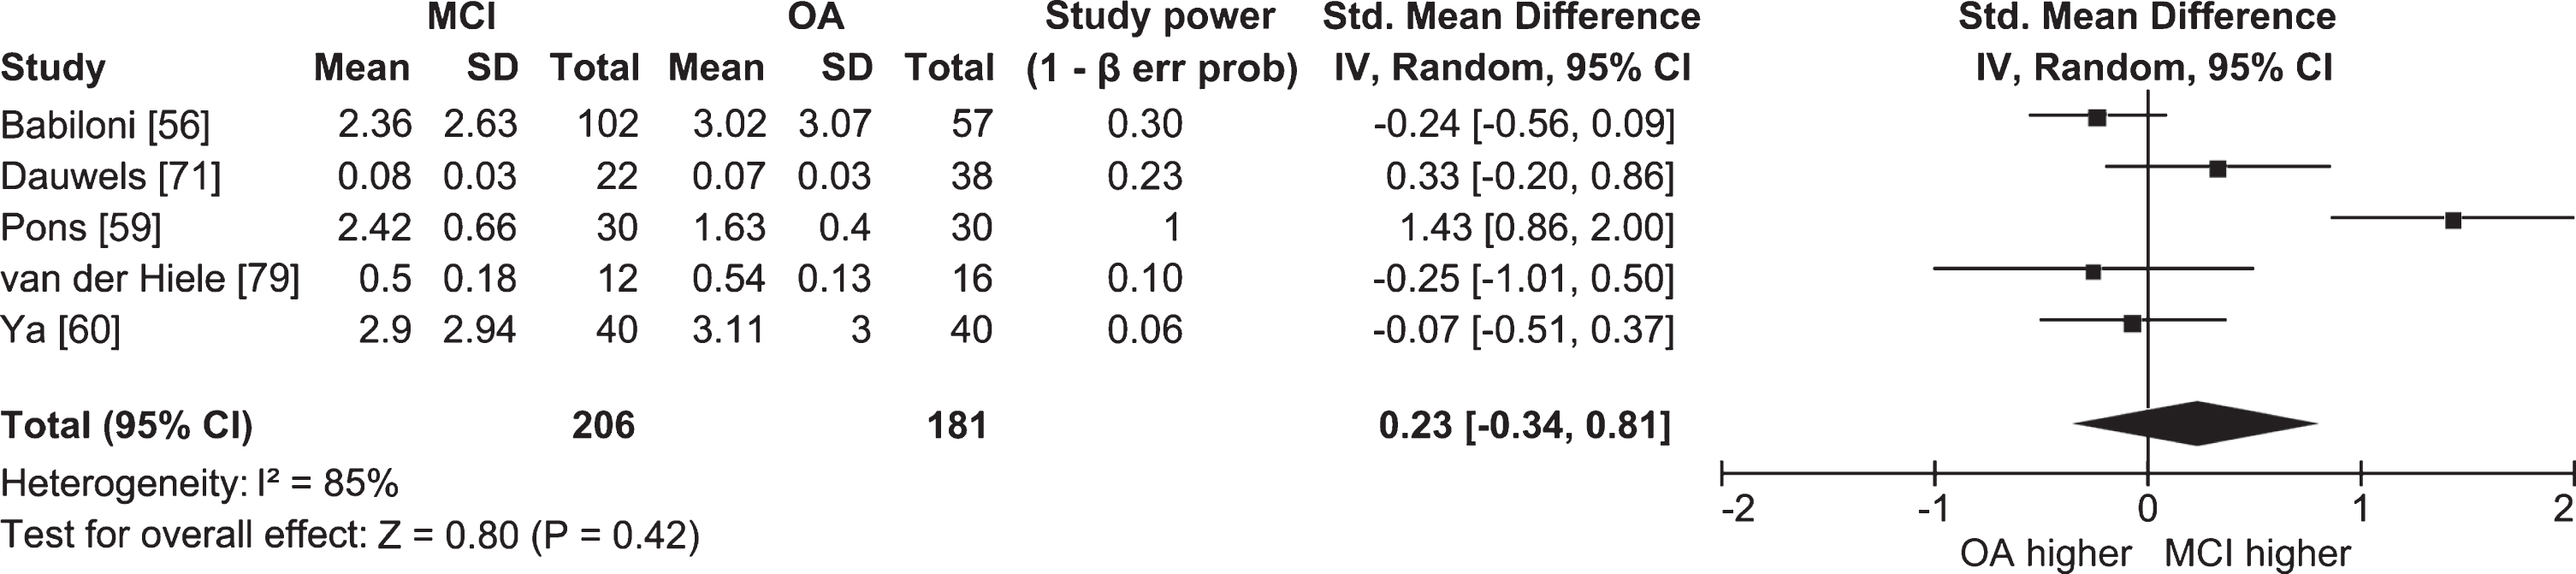
Fig. 5
Table and forest plot of effect sizes for power in awake resting state in the upper alpha band in people with MCI versus cognitively healthy older adults (OA). The table shows sample size (Total) for each participant group. For the explanation of the table and the plot, see Fig. 2.
Overall, resting state alpha activity was lower in people with AD than in people with MCI, and in people with MCI than in cognitively healthy older adults. However, several studies did not report significant findings, indicating differences might be too subtle to be detected in smaller samples, or when the alpha band is split in half. Effect sizes were diverse in magnitude and sometimes in direction, which might reflect different EEG measures and sample characteristics.
Synchronization. A short explanation of functional connectivity measures can be found in Table 1. Thirteen studies included people with aMCI, three people with AD-MCI, and five did not specify the subtype (see Table 4 for details).
Table 4
Functional connectivity in awake resting state at the level of electrodes and sources of neural activity in people with aMCI, MCI, and MCI due to AD
| Paper | Groups | Diagnosis | n | Age (y) | Sex (% F) | EEG measure | Alpha (Hz) | Results | Electrodes/sources | Location of significant differences | |
| MCI versus OA | AD versus MCI | ||||||||||
| Musaeus [84] | AD | DSM-IV-TR, McKhann [204] | 117 | 75.5 (7.7 SD) | 60.7 | coherence | 8–12.99 | ↓ | ↓ | electrodes: 19 | widespread (see paper for details) |
| OA > MCI | MCI > AD | ||||||||||
| (→ for one pair only) | |||||||||||
| MCI | Winblad [7] | 117 | 70.2 (8.1 SD) | 53 | imaginary coherence | ↓ and → | ↓ and → | OA > MCI: mostly inter-hemispheric | |||
| OA > MCI | MCI > AD | MCI > OA: mostly with right temporal areas | |||||||||
| MCI > OA | AD > MCI | MCI > AD: mostly with parieto-occipital areas | |||||||||
| AD > MCI: mostly between frontal areas | |||||||||||
| (see paper for details) | |||||||||||
| OA | 135 | 66.4 (7.6 SD) | 60.7 | weighted phase lag index | ↓ and → | ↓ and → | OA > MCI: widespread | ||||
| (eyes closed) | OA > MCI | MCI > AD | MCI > OA: mostly with fronto-central areas | ||||||||
| MCI > OA | AD > MCI | MCI > AD: mostly fronto-central, centro-occipital | |||||||||
| AD > MCI: left temporo-parietal | |||||||||||
| (see paper for details) | |||||||||||
| Jelic [75] | AD | McKhann [204] | 18 | 61.1 (5.5 SD) | 50 | coherence | 8–13 | x | ↓ | electrodes: 12 | left-right temporal, parietal (T3-T4, T5-T6, P3-P4) |
| aMCI | similar to Petersen [6] | 19 | 61.5 (7.0 SD) | 73.7 | (eyes closed) | aMCI > AD | |||||
| OA | 16 | 64.3 (10.8 SD) | 43.8 | ||||||||
| Koenig [87] | New York: | global field synchronization | 8–12 | x | ↓ | electrodes: 19 | global | ||||
| AD | DSM-III-R, GDS stages 4–7 | 148 | 72.1 (? SD) | ? | (eyes closed) | MCI > AD | |||||
| MCI | GDS stage 3 | 51 | 70.7 (? SD) | ? | |||||||
| OA | 25 | 67.1 (? SD) | ? | ||||||||
| Stockholm | |||||||||||
| AD | DSM-III-R, McKhann [204], SPECT biomarker positive | 63 | 63.5 (? SD) | ? | |||||||
| MCI | similar to Winblad [7] | 41 | 61.0 (? SD) | ? | |||||||
| OA | 21 | 63.4 (? SD) | ? | ||||||||
| Núñez [88] | AD | McKhann [205] | 45 | 79.5 [74.7 : 82.4] | 55.6 | amplitude envelope correlation | 8–13 | x | ↓ | electrodes: 19 | left-right temporal (F7/T3/T5-F8/T4/T6), left temporo-central (F7/T3/T5-Fz/C3/C4/Pz), right temporo-central (Fz/C3/C4/Pz-F8/T4/T6), fronto-central (Fp1/Fp2/F3/F4-Fz/C3/C4/Pz), centro-parietal (Fz/C3/C4/Pz-P3/P4/O1/O2), fronto-parietal (Fp1/Fp2/F3/F4-P3/P4/O1/O2), left and right temporo-parietal (F7/T3/T5-P3/P4/O1/O2, F8/T4/T6-P3/P4/O1/O2) |
| AD-MCI | Albert [68] | 51 | 77.2 [69.6 : 79.8] | 58.8 | (eyes closed) | AD-MCI > AD | |||||
| OA | 36 | 75.9 [74.1 : 78.6] | 69.4 | ||||||||
| Smailovic [73] | AD | ICD-10 | 197 | 67.8 (9.2 SD) | 63.5 | global field synchronization | 8–11.5 | – | ↓ | electrodes: ? | global |
| MCI | Winblad [7] | 230 | 65.9 (8.2 SD) | 52.6 | (eyes closed) | MCI > AD | |||||
| Hsiao [207] | AD | DSM-IV, McKhann [204] | 21 | 82.7 (7.5 SD) | 71.4 | minimum norm estimate; coherence | 8–13 | – | x | electrodes: 19 | |
| (eyes closed) | sources: | ||||||||||
| aMCI | Petersen [1] | 21 | 80.4 (5.6 SD) | 61.9 | motor network | ||||||
| van der Hiele [126] | AD | McKhann [204] | 16 | 78.0 (8.0 SD) | 43.8 | coherence | 8–13 | x | x | electrodes: 21 | |
| aMCI | Petersen [6] | 18 | 74.0 (5.0 SD) | 61.1 | (eyes closed) | ||||||
| OA | 22 | 70.0 (5.0 SD) | 68.2 | ||||||||
| Gonzalez-Escamilla [83] | aMCI | Petersen [6] | 29 | 70.1 (6.8 SD) | 34.5 | phase lag index | alpha peak frequency±0.5 | ↓ | – | electrodes: 40 | left temporal-right parietal (FT7/T7/TP7-Cp6/CP4/Cp2/P8/P6/P4/P2), left-right parietal (Cp5/CP3/Cp1/P7/P5/P3/P1- Cp6/CP4/Cp2/P8/P6/P4/P2), right temporo-parietal (FT8/T8/TP8-Cp6/CP4/Cp2/P8/P6/P4/P2), within right parietal |
| OA | 26 | 66.5 (4.9 SD) | 57.7 | (eyes closed) | OA > aMCI | ||||||
| Teipel [85] | aMCI | Petersen [1] | 16 | 73.6 (7.8 SD) | 43.8 | coherence | 8–12 | ↓ | – | electrodes: 14 | left-right central, temporal, parietal (C3-C4, T3-T4, T5-T6, P3-P4) |
| OA | 20 | 67.0 (7.3 SD) | 45 | (eyes closed) | OA > aMCI | ||||||
| Wen [86] | MCI | DSM-IV | 12 | 75.2 (7.1 SD) | 50 | global coupling index, | 8–12 | ↓ | – | electrodes: 10 | global |
| global synchronization index, | OA > MCI | ||||||||||
| S-estimator | |||||||||||
| OA | 12 | 73.0 (6.5 SD) | 58.3 | (eyes closed) | |||||||
| Michels [43] | aMCI | ?, 6 APOE ɛ4 allele | 17 | 72.1 (4.6 SD) | 29.4 | beamforming; coherence | 8–13 | ↓ | – | electrodes: 60 | primary motor cortex, primary visual cortex, PCC, angular gyrus, BA 46 |
| (eyes closed) | OA > aMCI | sources: | |||||||||
| OA | 5 APOE ɛ4 allele | 17 | 71.8 (4.6 SD) | 29.4 | whole brain | ||||||
| Ruiz-Gómez [209] | AD-MCI | McKhann [205] | 51 | 85.5 (7.3 SD) | 70.6 | weighted phase lag index | 8–13 | x | – | electrodes: 19 | |
| OA | 51 | 80.1 (7.1 SD) | 49 | (eyes closed) | |||||||
| Babiloni [93] | AD | DSM-IV, McKhann [204] | 33 | 70.9 (1.73 SE) | 75.8 | coherence | 8–10 | x | ↓ | electrodes: 19 | global averaged |
| aMCI | Petersen [1] | 52 | 72.3 (0.75 SE) | 51.9 | (eyes closed) | aMCI > AD | |||||
| 10–13 | x | x | |||||||||
| OA | 47 | 74.7 (0.90 SE) | 46.8 | ||||||||
| Babiloni [89] | AD-MCI | Albert [68], CSF/FDG-PET/MRI biomarker positive | 75 | 70.1 (0.7 SE) | 54.7 | eLORETA; lagged linear connectivity | lower alpha individually determined | → | – | electrodes: 19 | inter-hemispheric: parietal, occipital, temporal |
| (eyes closed) | OA > AD-MCI | sources: | intra-hemispheric: global | ||||||||
| OA | 75 | 70.1 (0.8 SE) | 52 | upper alpha individually determined | → | whole brain | inter-hemispheric: parietal, occipital, temporal | ||||
| OA > AD-MCI | intra-hemispheric: global | ||||||||||
| Moretti [91] | MCI | Petersen [76] | 85 | 69.8 (7.9 SD) | 65.9 | coherence | lower alpha individually determined | ↓ | – | electrodes: 6 | inter-hemispheric: temporal (T3-T4) |
| (eyes closed) | intra-hemispheric | intra-hemispheric: left and right fronto-parietal (F3-P3, F4-P4) | |||||||||
| OA > MCI | |||||||||||
| → inter-hemispheric | |||||||||||
| MCI > OA | |||||||||||
| OA | 31 | 68.9 (5.1 SD) | 35.5 | upper alpha individually determined | ↓ | inter-hemispheric: temporal (T3-T4) | |||||
| intra-hemispheric | intra-hemispheric: left and right fronto-parietal (F3-P3, F4-P4) | ||||||||||
| OA > MCI | |||||||||||
| → inter-hemispheric | |||||||||||
| MCI > OA | |||||||||||
| Xu [90] | aMCI | Petersen [76] | 11 | 75.50 (7.39 SD) | 45.5 | coherence | ? | ↓ | x | electrodes: 21 | fronto-occipital (Fpz-Oz) |
| (eyes closed) | (vertex reference) | ||||||||||
| OA > aMCI | |||||||||||
| OA | 14 | 74.04 (6.85 SD) | 57.1 | ? | ↓ | x | within frontal, fronto-parietal (see paper for details) | ||||
| (vertex, zero, average reference) | |||||||||||
| OA > aMCI | |||||||||||
| Pons [59] | aMCI | Petersen [6] | 30 | 66.8 (4.7 SD) | 30 | phase lag index | 7–9 | → | – | electrodes: 12 | right occipito-central (C4-O2) |
| (eyes closed) | aMCI > OA | ||||||||||
| OA | 30 | 68.4 (6.1 SD) | 33.3 | 9.1–11 | x | ||||||
| Cantero [92] | aMCI | Petersen [1], 9 APOE ɛ4 allele | 20 | 68.4 (6.1 SD) | 45 | MVAR-EfICA; phase synchronization index | 7.5–10 | → | – | electrodes: 59 | thalamus, cuneus, precuneus |
| (eyes closed) | aMCI > OA | sources: | |||||||||
| OA | 4 APOE ɛ4 allele | 20 | 66.8 (4.7 SD) | 50 | 10.1–12.5 | x | whole brain | ||||
| Hsiao [94] | AD | DSM-IV, McKhann [204] | 21 | 82.7 (7.5 SD) | 71.4 | minimum norm estimate; | lower alpha individually determined | – | ↓ | electrodes: 19 | left PCC-right precuneus, left PCC-left ACC |
| imaginary coherence | MCI > AD | sources: | |||||||||
| aMCI | Petersen [1] | 21 | 80.4 (5.6 SD) | 61.9 | (eyes closed) | upper alpha individually determined | ↓ | default mode network | left PCC-right precuneus | ||
| MCI > AD | |||||||||||
| Pijnenburg [95] | AD | McKhann [204] | 14 | 76.4 (13.6 SD) | 50 | synchronization likelihood | 8–10 | – | x | electrodes: 19 | |
| aMCI | Petersen [6] | 11 | 78.4 (6.4 SD) | 90.9 | (eyes closed) | 10–12 | x | ||||
| Stam [96] | AD | McKhann [204] | 10 | 76.2 (9.3 SD) | 80 | synchronization likelihood | 6–10 | – | x | electrodes: 21 | |
| (eyes ?) |
Arrows indicate whether functional connectivity in the more cognitively impaired group was significantly lower or higher than in the less impaired group. When the original paper reported age range but not SD or SE, age range is included in square brackets. eLORETA, exact low resolution brain electromagnetic tomography; MVAR-EfICA, multivariate autoregressive model-efficient fast independent component analysis; GDS, Global Deterioration Scale; SPECT, single-photon emission computerized tomography; FDG-PET, fluorodeoxyglucose positron emission tomography; MRI, magnetic resonance imaging. For other abbreviations and the explanation of symbols, see Table 3.
Five of the twelve studies that compared functional connectivity in the full alpha band between people with MCI and cognitively healthy older adults found lower connectivity in people with MCI (Michels et al. [43], n = 17 aMCI, 17 OA; Gonzalez-Escamilla et al. [83], n = 29 aMCI, 29 OA; Musaeus et al. [84], n = 117 AD, 117 MCI, 135 OA; Teipel et al. [85], n = 16 aMCI, 20 OA; Wen et al. [86], n = 12 aMCI, 12 OA). Connectivity was lower mainly within temporo-parietal areas [43, 83, 85] or between temporo-parietal and other areas [43]. The study with the largest sample (Koenig et al. [87], n(NY) = 148 AD, 51 MCI, 25 OA; n(Stockholm) = 63 AD, 41 MCI, 21 OA) did not find significant differences between people with MCI and cognitively healthy older adults, but there was significantly lower global connectivity in people with AD than in people with MCI. Lower connectivity in people with AD than in people with MCI was also reported by Smailovic et al. [73] (n = 197 AD, 230 MCI), Jelic et al. [75] (n = 18 AD, 19 aMCI, 16 OA), Musaeus et al. [84] (n = 117 AD, 117 MCI, 135 OA), and Núñez et al. [88] (n = 45 AD, 51 AD-MCI, 36 OA). In the studies that did not measure connectivity at the global level, differences between people with MCI and people with AD were mostly found in temporo-parietal areas [75, 84, 88].
In addition to finding the expected pattern of lower connectivity in more cognitively impaired groups, Musaeus et al. [84] also found higher connectivity in people with MCI than in cognitively healthy older adults, and in people with AD than in people with MCI. They used three different measures of connectivity and found that whereas coherence decreased with increasing impairment, the imaginary part of coherence and weighted phase lag index showed both lower and higher connectivity in more cognitively impaired groups.
Findings for lower and upper alpha bands were even less uniform than for the full band. Babiloni et al. [89] (n = 75 AD-MCI, 75 OA) found less posterior inter-hemispheric and global intra-hemispheric connectivity in people with AD-MCI than in cognitively healthy older adults in both lower and upper alpha bands. Similarly, Xu et al. [90] (n = 10 aMCI, 10 OA) and Moretti et al. [91] (n = 85 MCI, 31 OA) found that people with MCI had less fronto-parietal connectivity in both bands. Xu et al. [90] additionally reported less inter-hemispheric frontal connectivity in the upper alpha band in people with aMCI compared to cognitively healthy older adults. However, in the study by Xu et al. [90], the frequency range for each band was not reported, meaning this study may not be comparable to others. Moreover, findings for the lower band differed based on the choice of the reference electrode.
Three studies reported higher connectivity in the lower alpha band in people with MCI than in cognitively healthy older adults. Moretti et al. [91] (n = 85 MCI, 31 OA) found more temporal inter-hemispheric connectivity in both bands, and Pons et al. [59] (n = 30 aMCI, 30 OA) more right occipito-central connectivity in the lower alpha band in people with MCI. In the study by Cantero et al. [92] (n = 20 aMCI, 20 OA), people with aMCI had higher connectivity between the thalamus, cuneus, and precuneus.
Compared to people with MCI, people with AD had less global connectivity in the lower alpha band (Babiloni et al. [93], n = 33 AD, 52 aMCI, 47 OA), and less connectivity between left posterior areas and other areas of the default mode network in both alpha bands (Hsiao et al. [94], n = 21 aMCI, 21 AD). Two studies with smaller sample sizes failed to find significant differences between the two groups in either band (Pijnenburg et al. [95], n = 14 AD, 11 aMCI; Stam et al. [96], 10 AD, 17 aMCI).
Findings on differences in alpha synchronization between people with MCI and cognitively healthy older adults and between people with MCI and people with AD are difficult to reconcile due to differences in analysis and reporting. Included studies differed in connectivity measures, and in electrode clusters or brain regions for which results are reported, precluding meta-analyses or direct comparisons. In two studies, results derived from the same sample differed depending on the reference electrode [90] and the measure of connectivity [84], raising questions about comparability of synchronization studies.
Cross-sectional studies on people with MCI due neurodegenerative dementias other than AD
Power. Ten studies investigated alpha power in people with MCI due to Lewy body disorders, meaning either due to Parkinson’s disease (PD-MCI) or due to dementia with Lewy bodies (DLB-MCI). All measured EEG at rest with eyes closed, and except three studies, all reported relative power (see Table 5 for details). Two studies (Caviness et al. [97], n = 31 PD-D, 28 PD-MCI, 75 PD-CH; Mostile et al. [98], n = 46 PD-MCI, 56 PD-CH) found that people with PD-MCI had lower alpha power than cognitively healthy PD patients. Lower alpha power was also found in people with DLB-MCI when they were compared to cognitively healthy older adults (Bonanni et al. [70], n = 50 DLB, 20 DLB-aMCI, 50 OA); however, the difference between the two groups in this study was extremely large (22.2% (±10.6) of power was in the alpha band for people with DLB-MCI and 76.3% (±2.3) for OA) and should be interpreted with caution. In other studies, alpha power in the full band did not differ significantly between people with PD-MCI and cognitively healthy PD patients (Caviness et al. [47], n = 16 PD-MCI, 42 PD-CH; Fonseca et al. [48], n = 10 PD-MCI, 15 PD-CH; Chaturvedi et al. [99], n = 27 PD-MCI, 43 PD-CH; He et al. [100], n = 61 PD-MCI, 74 PD-CH).
Table 5
Power in awake resting state at the level of electrodes and sources of neural activity in people with MCI due to Lewy body disorders and MCI due to FTD
| Paper | Groups | Diagnosis | n | Age (y) | Sex (% F) | EEG measure | Alpha (Hz) | Results | Electrodes/sources | Location of significant differences | |
| MCI versus PD-CH/OA | Dementia versus MCI | ||||||||||
| Caviness [97] | PD-D | Emre [210] | 31 | 78.9 (6.6 SD) | 26 | FFT relative power | 8–12.9 | ↓ | ↓ | electrodes: ? | global averaged |
| PD-MCI | Litvan [10] | 28 | 76.7 (6.6 SD) | 25 | (eyes closed) | PD-CH > PD-MCI | PD-MCI > PD-D | ||||
| PD-CH | 75 | 74.4 (9.2 SD) | 44 | ||||||||
| Caviness [47] | PD-MCI | Petersen [6] | 16 | 80.4 (8.8 SD) | ? | FFT relative power | 8–12.9 | x | – | electrodes: 15 | |
| PD-CH | 42 | 74.6 (8.6 SD) | ? | (eyes closed) | |||||||
| Fonseca [48] | PD-MCI | Portet [208] | 10 | 70.3 (? SD) | ? | FFT relative power | 8.2–12.5 | x | – | electrodes: 17 | |
| PD-CH | 15 | 63.5 (9.6 SD) | ? | (eyes closed) | |||||||
| He [100] | PD-MCI | Petersen [76] | 61 | 60.2 (10.6 SD) | 47.5 | ? relative power | 8–13 | x | – | electrodes: 12 | |
| PD-CH | 74 | 59.2 (12.4 SD) | 37.8 | (eyes closed) | |||||||
| Chaturvedi [99] | PD-MCI | Litvan [10], level II criteria | 27 | 67.0 [53 : 84] | 22.2 | FT relative power | 8–13 | x | – | electrodes: 214 | |
| PD-CH | 43 | 67.0 [46 : 82] | 39.5 | (eyes closed) | |||||||
| Mostile [98] | PD-MCI | Litvan [10], level II criteria | 46 | 66.1 (8.1 SD) | 45.6 | Welch’s absolute power | 8–12 | ↓ | – | electrodes: 10 | occipital (O1, O2) |
| PD-CH > PD-MCI | |||||||||||
| PD-CH | 56 | 65.4 (8.7 SD) | 48 | LORETA ICA | ↓ | electrodes: 19 | occipital lobe (lingual gyrus) | ||||
| (eyes closed) | PD-CH > PD-MCI | sources: | |||||||||
| whole brain | |||||||||||
| Bonanni [70] | DLB | McKeith [211] | 50 | 70.3 (4.9 SD) | 46 | FFT relative power | 9–12 | ↓ | x | electrodes: 19 | global averaged |
| DLB-aMCI | Petersen [6], 1 core DLB symptom, conversion | 20 | 74.1 (7.0 SD) | 35 | (eyes closed) | OA > DLB-MCI | |||||
| OA | 50 | 72.6 (5.4 SD) | 48 | ||||||||
| Bousleiman [102] | PD-MCI | Litvan [10], level II criteria | 41 | ? | ? | Welch’s relative power | 8–10 | ↓ | – | electrodes: 256 | global averaged, left frontal, left central, left and right temporal, right occipital |
| (eyes closed) | PD-CH > PD-MCI | ||||||||||
| PD-CH | 12 | ? | ? | 10–13 | x | ||||||
| Chaturvedi [99] | PD-MCI | Litvan [10], level II criteria | 27 | 67.0 [53 : 84] | 22.2 | FT relative power | 8–10 | x | – | electrodes: 214 | |
| PD-CH | 43 | 67.0 [46 : 82] | 39.5 | (eyes closed) | 10–13 | x | |||||
| Babiloni [101] | PD-D | similar to Emre [210], impairment in 1 domain enough | 35 | 73.8 (1.2 SE) | 60 | eLORETA; | lower alpha individually determined | ↓ | x | electrodes: 19 | occipital |
| PD-MCI | Litvan [10] | 50 | 71.5 (1.0 SE) | 58 | current source density | PD-CH > PD-MCI | sources: | ||||
| (eyes closed) | upper alpha individually determined | → | → | whole brain | PD-MCI > PD-CH: temporal | ||||||
| PD-CH | 35 | 71.3 (1.2 SE) | 51.4 | PD-MCI > PD-CH | PD-D > PD-MCI | PD-D > PD-MCI: frontal, central, temporal | |||||
| Babiloni [103] | DLB-MCI | McKeith [211, 212], SPECT (DaTscan) biomarker positive | 23 | 75.7 (1.4 SE) | 39.1 | eLORETA; | lower alpha individually determined | ↓ | – | electrodes: 19 | temporal, limbic, occipital |
| current source density | OA > DLB-MCI | sources: | |||||||||
| OA | 30 | 74.7 (0.8 SE) | 40 | (eyes closed) | upper alpha individually determined | ↓ | whole brain | occipital | |||
| OA > DLB-MCI | |||||||||||
| Moretti [107] | FTD | Neary [213], Gorno-Tempini [214], Rascovsky [215], 8 GRN mutation | 28 | 66.8 (9.1 SD) | ? | Welch’s global field power | 8–10.5 | – | x | electrodes: 19 | |
| FTD-MCI | ? | 11 | 64.8 (4.2 SD) | ? | (eyes closed) | 10.5–14 | → | global averaged | |||
| FTD > FTD-MCI |
PD, Parkinson’s disease; PD-D, dementia due to PD; PD-MCI, MCI due to PD; PD-CH, cognitively healthy people with PD; DLB, dementia with Lewy bodies; DLB-(a)MCI, (amnestic) MCI due to DLB; FTD, frontotemporal dementia; FTD-MCI, MCI due to FTD; ICA, independent components analysis; GRN, granulin precursor gene. For other abbreviations and the explanation of symbols, see Tables 3 and 4.
Three of the studies that split alpha into lower and upper frequencies found less lower alpha power in people with PD-MCI compared to cognitively healthy PD patients (Babiloni et al. [101], n = 35 PD-D, 50 PD-MCI, 35 PD-CH; Bousleiman et al. [102], n = 41 PD-MCI, 12 PD-CH) and in people with DLB-MCI compared to cognitively healthy older adults (Babiloni et al. [103], n = 23 DLB-MCI, 30 OA). Babiloni et al. also observed less upper alpha power in people with DLB-MCI compared to cognitively healthy older adults (Babiloni et al. [103], n = 23 DLB-MCI, 30 OA), but more upper alpha power in people with PD-MCI compared to cognitively healthy PD patients and in people with PD-D compared to those with PD-MCI (Babiloni et al. [101], n = 35 PD-D, 50 PD-MCI, 35 PD-CH). The latter study was the only one that investigated alpha power in PD-MCI in individually defined alpha bands. Given that aging and PD duration have been associated with changes in alpha rhythms [104–106], this method might be more sensitive to changes due to cognitive impairment.
The only study on people with MCI due to FTD (FTD-MCI; Table 5) [107] (n = 11 FTD-MCI, 28 FTD) found that they had lower alpha power than people with FTD.
Synchronization. Three studies compared synchronization between people with PD-MCI and cognitively healthy PD patients (Table 6). Whereas two did not find any significant differences (Chaturvedi et al. [99], n = 27 PD-MCI, 43 PD-CH; Utianski et al. [108], n = 13 PD-MCI, 57 PD-CH), one found more synchronization in the upper alpha band in people with PD-MCI (Carmona Arroyave et al. [109], n = 14 PD-MCI, 22 PD-CH). The only study that compared people with DLB-MCI to cognitively healthy older adults found less synchronization in lower and upper alpha bands in people with DLB-MCI (Babiloni et al. [110], n = 23 DLB-MCI, 30 OA).
Table 6
Functional connectivity in awake resting state at the level of electrodes and sources of neural activity in people with MCI due to Lewy body disorders
| Paper | Groups | Diagnosis | n | Age (y) | Sex (% F) | EEG measure | Alpha (Hz) | Results | Electrodes/sources | Location of significant differences |
| Carmona Arroyave [109] | PD-MCI | Litvan [10], level I criteria | 14 | 66.1 (7.4 SD) | 28.6 | coherence (eyes closed) | 8–10 | x | electrodes: 36 | |
| PD-CH | 22 | 61.8 (8.0 SD) | 36.4 | 10–13 | ↑ PD-MCI>PD-CH | left and right fronto-parietal (AF3/F1/F3/FC1/FC3-CP1/CP3/P1/P3, AF4/F2/F4/FC2/FC4-CP2/CP4/P2/P4) | ||||
| Chaturvedi [99] | PD-MCI | Litvan [10], level II criteria | 27 | 67.0 [53:84] | 22.2 | phase lag index (eyes closed) | 8–13 | x | electrodes: 214 | |
| 8–10 | x | |||||||||
| PD-CH | 43 | 67.0 [46:82] | 39.5 | |||||||
| 10–13 | x | |||||||||
| Utianski [108] | PD-MCI | Litvan [10] | 13 | 77.0 (5.2 SD) | ? | phase lag index (eyes closed) | 8–10 | x | electrodes: 21 | |
| PD-CH | 57 | 74.9 (8.2 SD) | ? | 10–13 | x | |||||
| Babiloni [110] | DLB-MCI | McKeith [211, 212], SPECT (DaTscan) biomarker positive | 23 | 75.7 (1.4 SE) | 39.1 | eLORETA; lagged linear connectivity (eyes closed) | lower alpha individually determined | ↓ OA > DLB-MCI | electrodes: 19 sources: whole brain | whole brain |
| OA | 30 | 74.7 (0.8 SE) | 40.0 | upper alpha individually determined | ↓ OA > DLB-MCI | whole brain |
For abbreviations and the explanation of symbols, see Tables 3–5.
Longitudinal studies comparing people with MCI who progress to AD to people with MCI whose cognitive status remains stable
Power. We identified seven studies that compared alpha power in people with progressive and stable MCI (Table 7). In six of them, progression was defined as the diagnosis of clinical AD at follow-up [72, 111–115], and in one study as a 4-point increase in the total score on the cognitive subscale of the Alzheimer’s Disease Assessment Scale [57].
Table 7
Power in awake resting state at the level of electrodes and sources of neural activity in people with MCI who eventually progress to AD and in people with MCI whose cognitive status remains stable
| Paper | Groups | Diagnosis | n | Age (y) | Sex (% F) | Follow-up (y) | EEG measure | Alpha (Hz) | Results | Electrodes/ sources | Location of significant differences |
| Gouw [111] | AD-PMCI | AD: ?; MCI: Albert [68]; both Aβ42 positive | 83 (79 AD) | 68.0 (8.0 SD) | 52.0 | ≥1, median 2.2 | FFT relative power (eyes closed) | 8–13 | ↓ SMCI > PMCI | electrodes: 21 | parietal (P3/P4/Pz), occipital (O1/O2), temporal lobe (T3/T4/T5/T6/A1/A2) |
| AD-SMCI | 59 | 68.0 (7.0 SD) | 46.0 | ||||||||
| Huang [72] | AD-PMCI | AD: McKhann [204]; MCI: similar to Petersen [6] | 14 | ? | ? | 1–4, mean 2.1 | FFT relative power | 8–11.5 | ↓ SMCI > PMCI | electrodes: 16 | right temporal (T4/T6), right temporo-occipital (T6/O2), left and right centro-parietal (C3/P3, C4/P4) |
| SMCI | 17 | ? | ? | FFT dipole approximation; global field power (eyes closed) | ↓ SMCI > PMCI | electrodes: 20 sources: whole brain | global | ||||
| Luckhaus [57] | PaMCI | MCI: Petersen [6]; progression: 4-point increase in ADAS-cog score | 16 | ? | ? | 1 | FFT absolute power (eyes closed) | 8–11.5 | ↓ SMCI > PMCI | electrodes: 3 (Fz, Cz, Pz) | Pz |
| SaMCI | 72 | ? | ? | ||||||||
| Poil [114] | AD-PaMCI | AD: McKhann [204]; MCI: Petersen [6] | 25 | 69.0 [67:72] | 44.0 | ≤2, mean 1.9 | ? relative power (eyes closed) | 8–13 | ↓ SMCI > PMCI | electrodes: 23 | median across F3, Fz, F4, T7, C3, Cz, C4, P3, Pz, P8, O1 |
| SaMCI | 39 | 67.0 [65:71] | 28.2 | ||||||||
| Jelic [112] | AD-PMCI | AD: McKhann [204]; MCI: similar to Petersen [6] | 14 | 58.2 (5.9 SD) | 64.3 | 1–3.25, mean 1.75 | FFT relative power (eyes closed) | 8–13 | x | electrodes: 12 | |
| SMCI | 13 | 58.5 (7.9 SD) | 69.2 | ||||||||
| Musaeus [113] | AD-PMCI | AD: McKhann [205]; MCI: Winblad [7] | 11 | ? | ? | 2 | Welch’s relative power (eyes closed) | 8–12.99 | x | electrodes: 19 | |
| SMCI | 13 | ? | ? | ||||||||
| Rossini [115] | AD-PaMCI | AD: McKhann [204]; MCI: Petersen [216, 76] | 24 | 72.7 (1.1 SE) | 50.0 | mean 1.2 years | LORETA; current source density (eyes closed) | 8–10.5 | ↑ PMCI > SMCI | electrodes: 19 sources: whole brain | central, parietal, occipital, temporal, limbic |
| SaMCI | 45 | 70.0 (1.1 SE) | 64.4 | 10.5–13 | x |
Arrows indicate whether power in people with progressive MCI was higher or lower than in people whose cognitive status remained stable. P(a)MCI, progressive (amnestic) MCI; S(a)MCI, stable (amnestic) MCI; AD-PMCI, MCI that progressed to Alzheimer’s disease; AD-SMCI, stable MCI due to Alzheimer’s disease. For other abbreviations and the explanation of symbols, see Tables 3 and 4.
Four studies found lower alpha relative power (Huang et al. [72], n = 14 AD-PMCI, 17 SMCI, mean follow-up after 2.1 years; Gouw et al. [111], n = 83 AD-PMCI, 59 AD-SMCI, median follow-up after 2.2 years; Poil et al. [114], n = 25 AD-PaMCI, 39 SaMCI, mean follow-up after 1.9 years), absolute power (Luckhaus et al. [57], n = 16 PaMCI, 72 SaMCI, follow-up after 1 year), or global field power of reconstructed sources (Huang et al. [72], n = 14 AD-PMCI, 17 SMCI, mean follow-up after 2.1 years) in people with progressive than in those with stable MCI. In three of these studies [57, 72, 111], significant differences were only found for posterior electrodes. The two studies that did not report significant differences had the smallest samples (Jelic et al. [112], n = 14 AD-PMCI, 13 SMCI, mean follow-up after 1.75 years; Musaeus et al. [113], n = 11 AD-PMCI, 13 SMCI, follow-up after 2 years) and may not have had enough power to detect between-group differences.
Only one study investigated lower and upper alpha bands separately (Rossini et al. [115], n = 24 AD-PaMCI, 45 SaMCI, mean follow-up after 1.2 years), and found that people with MCI who eventually progressed to dementia had more power in posterior sources in the lower alpha band.
Synchronization. We only identified three studies that compared alpha synchronization in people with progressive and stable MCI (Table 8). All studies defined progression as a diagnosis of clinical AD at follow-up. Whereas Jelic et al. [112] (n = 14 AD-PMCI, 13 SMCI, mean follow-up after 1.75 years) did not find significant differences between the two groups in the full alpha band, Musaeus et al. [116] (n = 11 AD-PMCI, 13 SMCI, follow-up after 2 years) found both lower and higher connectivity in people who progressed to AD. Rossini et al. [115] (n = 24 AD-PaMCI, 45 SaMCI, mean follow-up after 1.2 years) reported higher lower and upper alpha connectivity in people who progressed to AD.
Table 8
Functional connectivity in awake resting state at the electrode level in people with MCI who eventually progress to dementia and in people with MCI whose cognitive status remains stable
| Paper | Groups | Diagnosis | n | Age (y) | Sex (% F) | Follow-up (y) | EEG measure | Alpha (Hz) | Results | Electrodes | Location of significant differences |
| Jelic [112] | AD-PMCI | AD: McKhann [204]; MCI: similar to Petersen [6] | 14 | 58.2 (5.9 SD) | 64.3 | 1–3.25, mean 1.75 | coherence (eyes closed) | 8–13 | x | 12 | |
| SMCI | 13 | 58.5 (7.9 SD) | 69.2 | ||||||||
| Musaeus [116] | AD-PMCI | AD: McKhann [205]; MCI: Winblad [7] | 11 | 70.3 (6.6 SD) | 18.2 | 2 | coherence | 8–12.99 | ↓ and ↑ SMCI > PMCI PMCI > SMCI | 19 | SMCI>PMCI: right fronto-temporal (F4-T6), left central-right temporal (C3-T6), left central-right occipital (C3-O2) PMCI > SMCI: right frontal (Fp2-F4) |
| SMCI | 13 | 72.4 (6.1 SD) | 30.8 | imaginary coherence (eyes closed) | ↑ PMCI > SMCI | left central (C3-Cz) | |||||
| Rossini [115] | AD-PaMCI | AD: McKhann [204]; MCI: Petersen [216, 76] | 24 | 72.7 (1.1 SE) | 50.0 | mean 1.2 years | coherence (eyes closed) | 8–10.5 | ↑ PMCI > SMCI | 6 | left, right, central fronto-parietal (F3-P3, Fz-Pz, F4-P4) |
| SaMCI | 45 | 70.0 (1.1 SE) | 64.4 | 10.5–13 | ↑ PMCI > SMCI | left, right, central fronto-parietal (F3-P3, Fz-Pz, F4-P4) |
Alpha power and functional connectivity during task performance
Alpha power and functional connectivity during tasks of executive functions
Power. We identified 12 reports that compared changes in alpha power during tasks of executive functions. Seven studies used a task of working memory, five a task of attention, and one a task of inhibition (see Table 9 for details). All but two studies included participants with aMCI, and one [117] further divided the group into single (sd-aMCI) and multiple domain aMCI (md-aMCI). It should be noted that event-related synchronization (ERS) and event-related desynchronization (ERD) represent power increase and decrease, respectively, that is synchronized with the event of interest, and not changes in synchronization between two regions.
Table 9
Changes in power at the level of electrodes and sources of neural activity during task performance in people with aMCI, MCI, and MCI due to AD
| Paper | Groups | Diagnosis | n | Age (y) | Sex (% F) | EEG measure | Time window (ms) | Task | Alpha (Hz) | Results | Electrodes /sources | Location of significant differences | |
| MCI versus OA | AD versus MCI | ||||||||||||
| working memory | |||||||||||||
| Fodor [119] | aMCI | Petersen [1] | 17 | 69.2 (7.0 SD) | 47.0 | ERS/ERD | learning: 800–1500 retention: 600–1000 | Sternberg | 7–14 | learning: ↓ ERS OA > aMCI | – | electrodes: 128 | right central |
| OA | 21 | 64.9 (5.2 SD) | 66.7 | eLORETA; current source density | x | electrodes: 128 sources: whole brain | |||||||
| Fraga [118] | AD | McKhann [204] | 15 | 79.7 (1.3 SE) | 33.3 | ERS/ERD | –300–1700 in 2 s increments | n-back | 8–12 | 1-back, match: ↓ ERD OA > aMCI | x | electrodes: 29 | frontal (Fz, F4), central (C3, Cz, C4), occipital (O1, O2) |
| aMCI | Winblad [7], Petersen [217] | 21 | 79.9 (1.1 SE) | 47.6 | |||||||||
| 2-back, non-match: OA ERS, aMCI ERD | frontal (Fp1, Fpz, Fp2, F7, F3, Fz, F4) | ||||||||||||
| OA | 27 | 77.6 (1.0 SE) | 59.3 | ||||||||||
| Deiber [117] | sd-aMCI | Petersen [76], Petersen [218] | 16 | 65.8 (5.4 SD) | 43.8 | ERS/ERD | encoding: 200-–1000 in 10 ms increments | delayed-match-to-sample | 7.5–12.5 | ignored letters: ↓ ERS OA > md-aMCI | – | electrodes: 3 (P4 for attended faces, P7 for attended letters, C4 for ignored faces and letters) | C4 |
| md-aMCI | 27 | 64.0 (5.3 SD) | 55.6 | ||||||||||
| OA | 36 | 64.7 (6.6 SD) | 66.7 | ||||||||||
| van der Hiele [121] | AD | McKhann [204] | 11 | 75.0 (8.0 SD) | 45.5 | % change from eyes closed | / | picture retention | 8–13 | x | x | electrodes: 21 | |
| aMCI | Petersen [6] | 13 | 73.0 (5.0 SD) | 53.8 | |||||||||
| OA | 13 | 73.0 (5.0 SD) | 76.9 | ||||||||||
| Goodman [120] | AD | DSM- IV–TR, McKhann [204] | 29 | 76.3 (6.3 SD) | 48.3 | post-stimulus power divided by pre-stimulus power | post-stimulus: 0–1500 pre-stimulus: -1500–0 | n-back | 7.5–12 | x | x | electrodes: 64 | |
| MCI | DSM-5 | 100 | 71.9 (5.8 SD) | 51.0 | |||||||||
| OA | 40 | 72.5 (5.7 SD) | 70.0 | ||||||||||
| van der Hiele [79] | aMCI | Petersen [6] | 12 | 74.0 (6.0 SD) | 41.7 | % change from eyes closed | / | word and picture retention | 8–10.5 | picture retention: ↓ ERD OA > aMCI | – | electrodes: 17 | all regions: left and right frontal (F7/F3, F4/F8), left and right temporal (T3/T5, T4/T6), left and right centro-parietal (C3/P3, C4/P4), occipital (O1/O2), midline (Fz, Cz, Pz) |
| OA | 16 | 72.0 (5.0 SD) | 56.3 | ||||||||||
| 10.5–13 | x | ||||||||||||
| McBride [78] | AD | ?, no APOE ɛ4 allele | 17 | 76.7 (5.2 SD) | 60.0 | Welch’s relative power | / | counting backwards | 7.5–9.5 | x | x | electrodes: 30 | |
| aMCI | ?, no APOE ɛ4 allele | 16 | 74.6 (9.0 SD) | 25.0 | |||||||||
| 9.5–12.5 | x | x | |||||||||||
| OA | 15 | 75.7 (5.5 SD) | 60.0 | ||||||||||
| other executive functions | |||||||||||||
| Nguyen [125] | aMCI | Albert [68] | 22 | 68.7 (7.7 SD) | 63.6 | ERS/ERD | 0–600 | inhibition; go/no-go | 8–10 | ↓ ERD (go) OA > aMCI; | |||
| go–no-go difference aMCI > OA | – | electrodes: 9 | parietal (P1/Pz/P2) | ||||||||||
| frontal (F1/Fz/F2) | |||||||||||||
| OA | 22 | 65.3 (6.8 SD) | 72.7 | 11–13 | go–no-go difference aMCI > OA | frontal (F1/Fz/F2) | |||||||
| Caravaglios [62] | aMCI | Albert [68] | 27 | 70.6 (6.6 SD) | 59.3 | ERS/ERD | pre-motor 1: -1000–-500 pre-motor 2: -500-–0 post-stimulus: 0–500 | attention; omitted tone detection | upper alpha individually determined | pre-motor 2: OA ERD, aMCI ERS | – | electrodes: 24 | global |
| OA | 15 | 67.3 (6.5 SD) | 53.3 | ||||||||||
| Sharma [74] | dementia | HMSE score < 18 | 15 | 61.1 (? SD) | ? | Welch’s absolute power | / | attention; continuous performance test | 8.6–12.6 | x | ? | electrodes: 21 | global |
| MCI | HMSE score 18–24 | 16 | 58.4 (? SD) | ? | |||||||||
| OA | 13 | 52.1 (? SD) | ? | ||||||||||
| Kurt [122] | aMCI | similar to Petersen [6] | 22 | 74.0 (7.0 SD) | 40.9 | peak-to-peak amplitude | 0–500 | attention; auditory oddball paradigm | 8–13 | x | – | electrodes: 14 | |
| OA | 21 | 70.3 (6.5 SD) | 61.9 | ||||||||||
| Yener [123] | aMCI | Petersen [6], 4 later converted to AD | 18 | 70.5 (5.6 SD) | 38.9 | peak-to-peak amplitude | 0–300 | attention; visual oddball paradigm | 8–13 | x | – | electrodes: 12 | |
| OA | 18 | 68.2 (5.6 SD) | 50.0 | ||||||||||
| Yener [124] | aMCI | Albert [68] | 30 | 70.5 (5.5 SD) | 33.3 | ERS/ERD (peak power) | 0–400 | attention; visual oddball paradigm | 8–13 | x | – | electrodes: 12 | |
| OA | 28 | 68.0 (5.7 SD) | 32.1 | ||||||||||
| memory | |||||||||||||
| Prieto del Val [127] | AD-aMCI | Albert [68], 16 later converted to AD | 34 | 69.0 (6.8 SD) | 64.7 | ERS/ERD | encoding and retrieval: 0–1000 ms | associative memory | 8–12 | x | – | electrodes: 59 | |
| OA | 26 | 66.7 (4.9 SD) | 50.0 | ||||||||||
| van der Hiele [79] | aMCI | Petersen [6] | 12 | 74.0 (6.0 SD) | 41.7 | % change from eyes closed | / | semantic memory; animal fluency | 8–10.5 | x | – | electrodes: 17 | |
| OA | 16 | 72.0 (5.0 SD) | 56.3 | 10.5–13 | x |
Arrows indicate whether the change in power in the more cognitively impaired group was significantly lower or higher than in the less impaired group. sd-aMCI, single domain aMCI; md-aMCI, multiple domain aMCI; ERS, event-related synchronization; ERD, event-related desynchronization. For other abbreviations and the explanation of symbols, see Tables 3 and 4.
Several studies reported that people with aMCI had attenuated responses to task stimuli during working memory tasks compared to cognitively healthy older adults. People with aMCI were found to have less ERD during the processing of target stimuli in a 1-back task in the full alpha band (Fraga et al. [118], n = 15 AD, 21 aMCI, 27 OA) and during picture retention in the lower alpha band (van der Hiele et al. [79], n = 12 aMCI, 16 OA). They also had lower ERS in the full alpha band during the learning period of the Sternberg task (Fodor et al. [119], n = 17 aMCI, 21 OA), and during the processing of ignored distractors in the delayed-match-to-sample task (Deiber et al. [117], n = 16 sd-aMCI, 27 md-aMCI, 36 OA). However, the latter was only true for people with md-aMCI. Three other studies did not find significant differences between people with aMCI and cognitively healthy older adults (McBride et al. [78], n = 17 AD, 16 aMCI, 15 OA; Goodman et al. [120], n = 29 AD, 100 MCI, 40 OA; van der Hiele et al. [121], n = 11 AD, 13 aMCI, 13 OA).
In addition to the differences in the magnitude of power increase or decrease, Fraga et al. [118] (n = 15 AD, 21 aMCI, 27 OA) also found differences in the direction of power change between cognitively healthy older adults and those with aMCI. While viewing the non-target stimuli of the 2-back task, frontal alpha activity was increased (ERS) in the former but decreased (ERD) in the latter group.
A diverging pattern of alpha reactivity has also been observed during a pre-response period of an omitted tone detection task of attention (Caravaglios et al. [62], n = 27 aMCI, 15 OA). Whereas upper alpha power decreased (ERD) for cognitively healthy older adults, it increased (ERS) for people with aMCI. On the other hand, Sharma et al. [74], (n = 15 dementia, 16 MCI, 13 OA), (Kurt et al. [122], (n = 22 aMCI, 21 OA), and Yener et al. ([123], (n = 18 aMCI, 18 OA); [124], (n = 30 aMCI, 28 OA) did not find significant differences between people with MCI and cognitively healthy older adults during tasks of attention. Sharma et al. [74] did find a difference between people with MCI and people with dementia, but the direction of the difference was unclear, and dementia and MCI were not diagnosed according to widely accepted criteria. The only study that focused on inhibition found that compared to cognitively healthy older adults, people with aMCI had lower ERD during the processing of go trials in the lower alpha band (Nguyen et al. [125], n = 22 aMCI, 22 OA).
None of the four studies that compared changes in alpha activity during tasks of working memory between people with MCI and people with AD reported significant differences between the two groups (McBride et al. [78], n = 17 AD, 16 aMCI, 15 OA; Fraga et al. [118], n = 15 AD, 21 aMCI, 27 OA; Goodman et al. [120], n = 29 AD, 100 MCI, 40 OA; van der Hiele et al. [121], n = 11 AD, 13 aMCI, 13 OA).
Synchronization. Both studies on alpha synchronization (Table 10) used a picture retention task of working memory. They did not find significant differences between people with aMCI and cognitively healthy older adults (van der Hiele et al. [126], n = 16 AD, 18 aMCI, 22 OA) or between people with aMCI and people with AD (Pijnenburg et al. [95], n = 14 AD, 11 aMCI; van der Hiele et al. [126], n = 16 AD, 18 aMCI, 22 OA).
Table 10
Functional connectivity during performance of a working memory task at the electrode level in people with aMCI
| Paper | Groups | Diagnosis | n | Age (y) | Sex (% F) | EEG measure | Time window (ms) | Task | Alpha (Hz) | Results MCI versus OA | AD versus MCI | Electrodes |
| van der Hiele [126] | AD | McKhann [204] | 16 | 78.0 (8.0 SD) | 43.8 | coherence | / | picture retention | 8–13 | x | x | 17 |
| aMCI | Petersen [6] | 18 | 74.0 (5.0 SD) | 61.1 | ||||||||
| OA | 22 | 70.0 (5.0 SD) | 68.2 | |||||||||
| Pijnenburg [95] | AD | McKhann [204] | 14 | 76.4 (13.6 SD) | 50.0 | synchronization likelihood | / | picture retention | 8–10 | – | x | 19 |
| aMCI | Petersen [6] | 11 | 78.4 (6.4 SD) | 90.9 | 10–12 | x |
For abbreviations and the explanation of symbols, see Table 3.
Alpha power and functional connectivity during other cognitive tasks
Only a few studies examined alpha power in people with MCI during tasks that tap into cognitive processes other than executive functions (Table 9). van der Hiele et al. [79] (n = 12 aMCI, 16 OA) did not find any differences between people with aMCI and cognitively healthy older adults during a task of semantic memory, and Prieto Del Val et al. [127] (n = 34 AD-aMCI, 26 OA, follow-up after 2 years) did not find any differences between the two groups during a task of associative memory. They did, however, find that people with aMCI who eventually progressed to AD had lower alpha ERD during encoding and retrieval of associative memories (Table 11; Prieto del Val et al. [127], n = 16 AD-PaMCI, 18 AD-SaMCI, follow-up after 2 years).
Table 11
Changes in power at the level of electrodes and sources of neural activity during task performance in people with MCI who eventually progress to dementia and in people with MCI whose cognitive status remains stable
| Paper | Groups | n | Diagnosis | Age (y) | Sex (% F) | Follow-up (y) | EEG measure | Time window (ms) | Cognitive domain/task | Alpha (Hz) | Results | Electrodes/ sources | Location of significant differences |
| Mazaheri [128] | AD-PaMCI | 15 | AD: McKhann [204]; MCI Petersen [1] | 75.2 (7.1 SD) | 37.5 | ≤3, mean 1.62 | change from baseline | lexical and semantic processing: 500–1000 | language comprehension; semantic judgment task | 9–11 | x | electrodes: Pz (lexical processing), Cz (semantic processing) | |
| SaMCI | 10 | 71.1 (7.5 SD) | 40.0 | ||||||||||
| Prieto del Val [127] | AD-PaMCI | 16 | AD: DSM-IV, McKhann [?]; MCI: Albert [68] | 69.7 (6.5 SD) | 56.3 | 2 | ERS/ERD | encoding and retrieval: 0–1000 | associative memory | 8–12 | retrieval: ↓ ERD SMCI > PMCI | electrodes: 59 | left and right temporo-parietal |
| AD-SaMCI | 18 | 68.4 (7.1 SD) | 72.2 | beam-forming; ERS/ERD | encoding and retrieval: 500–1000 | encoding and retrieval: ↓ ERD SMCI > PMCI | electrodes: 59sources: whole brain | encoding: bilateral frontal and parietal lobes, left lateral and medial temporal lobe retrieval: similar as above plus right posterior lateral regions |
A study that compared alpha power in people with progressive and stable MCI during a task of language comprehension (Table 11) did not find significant differences between the two groups (Mazaheri et al. [128], n = 15 AD-PaMCI, 10 SaMCI, mean follow-up after 1.62 years).
DISCUSSION
The aim of this review and meta-analysis was to integrate findings of studies that compared power and functional connectivity of alpha oscillations between 1) people with MCI and cognitively healthy older adults, 2) people with MCI and people with a neurodegenerative dementia, and 3) people with MCI who progress to dementia and those whose cognitive status remains stable. Overall, there is evidence for 1) a gradual decrease of alpha power in awake resting state as people move along the continuum of cognitive decline, 2) lower alpha power in awake resting state in people with MCI who eventually progress to AD than in those whose cognitive status remains stable, and 3) lower alpha reactivity during tasks of executive functions in people with aMCI than in cognitively healthy older adults (see Fig. 6). There is also some evidence of lower functional connectivity in people with MCI than in cognitively healthy older adults, and in people with AD than in people with MCI. Findings of lower global resting state alpha power in people with AD than in people with MCI, and in people with MCI than in cognitively healthy older adults were supported by meta-analyses. However, these results should be interpreted with caution due to the small number of studies in both meta-analyses, and highly heterogeneous outcomes with high I2 in the analysis comparing people with MCI and cognitively healthy older adults.
Fig. 6
Schematic summary of most consistent findings showing lower power of alpha oscillations and connectivity of parietal areas during rest in people who are further along the continuum of cognitive decline (top panel), and lower reactivity to task stimuli in people with aMCI compared to cognitively healthy older adults (bottom panel). Arrows represent functional connectivity, and the amplitude of waves the power of alpha oscillations. Dashed arrows represent lower functional connectivity.
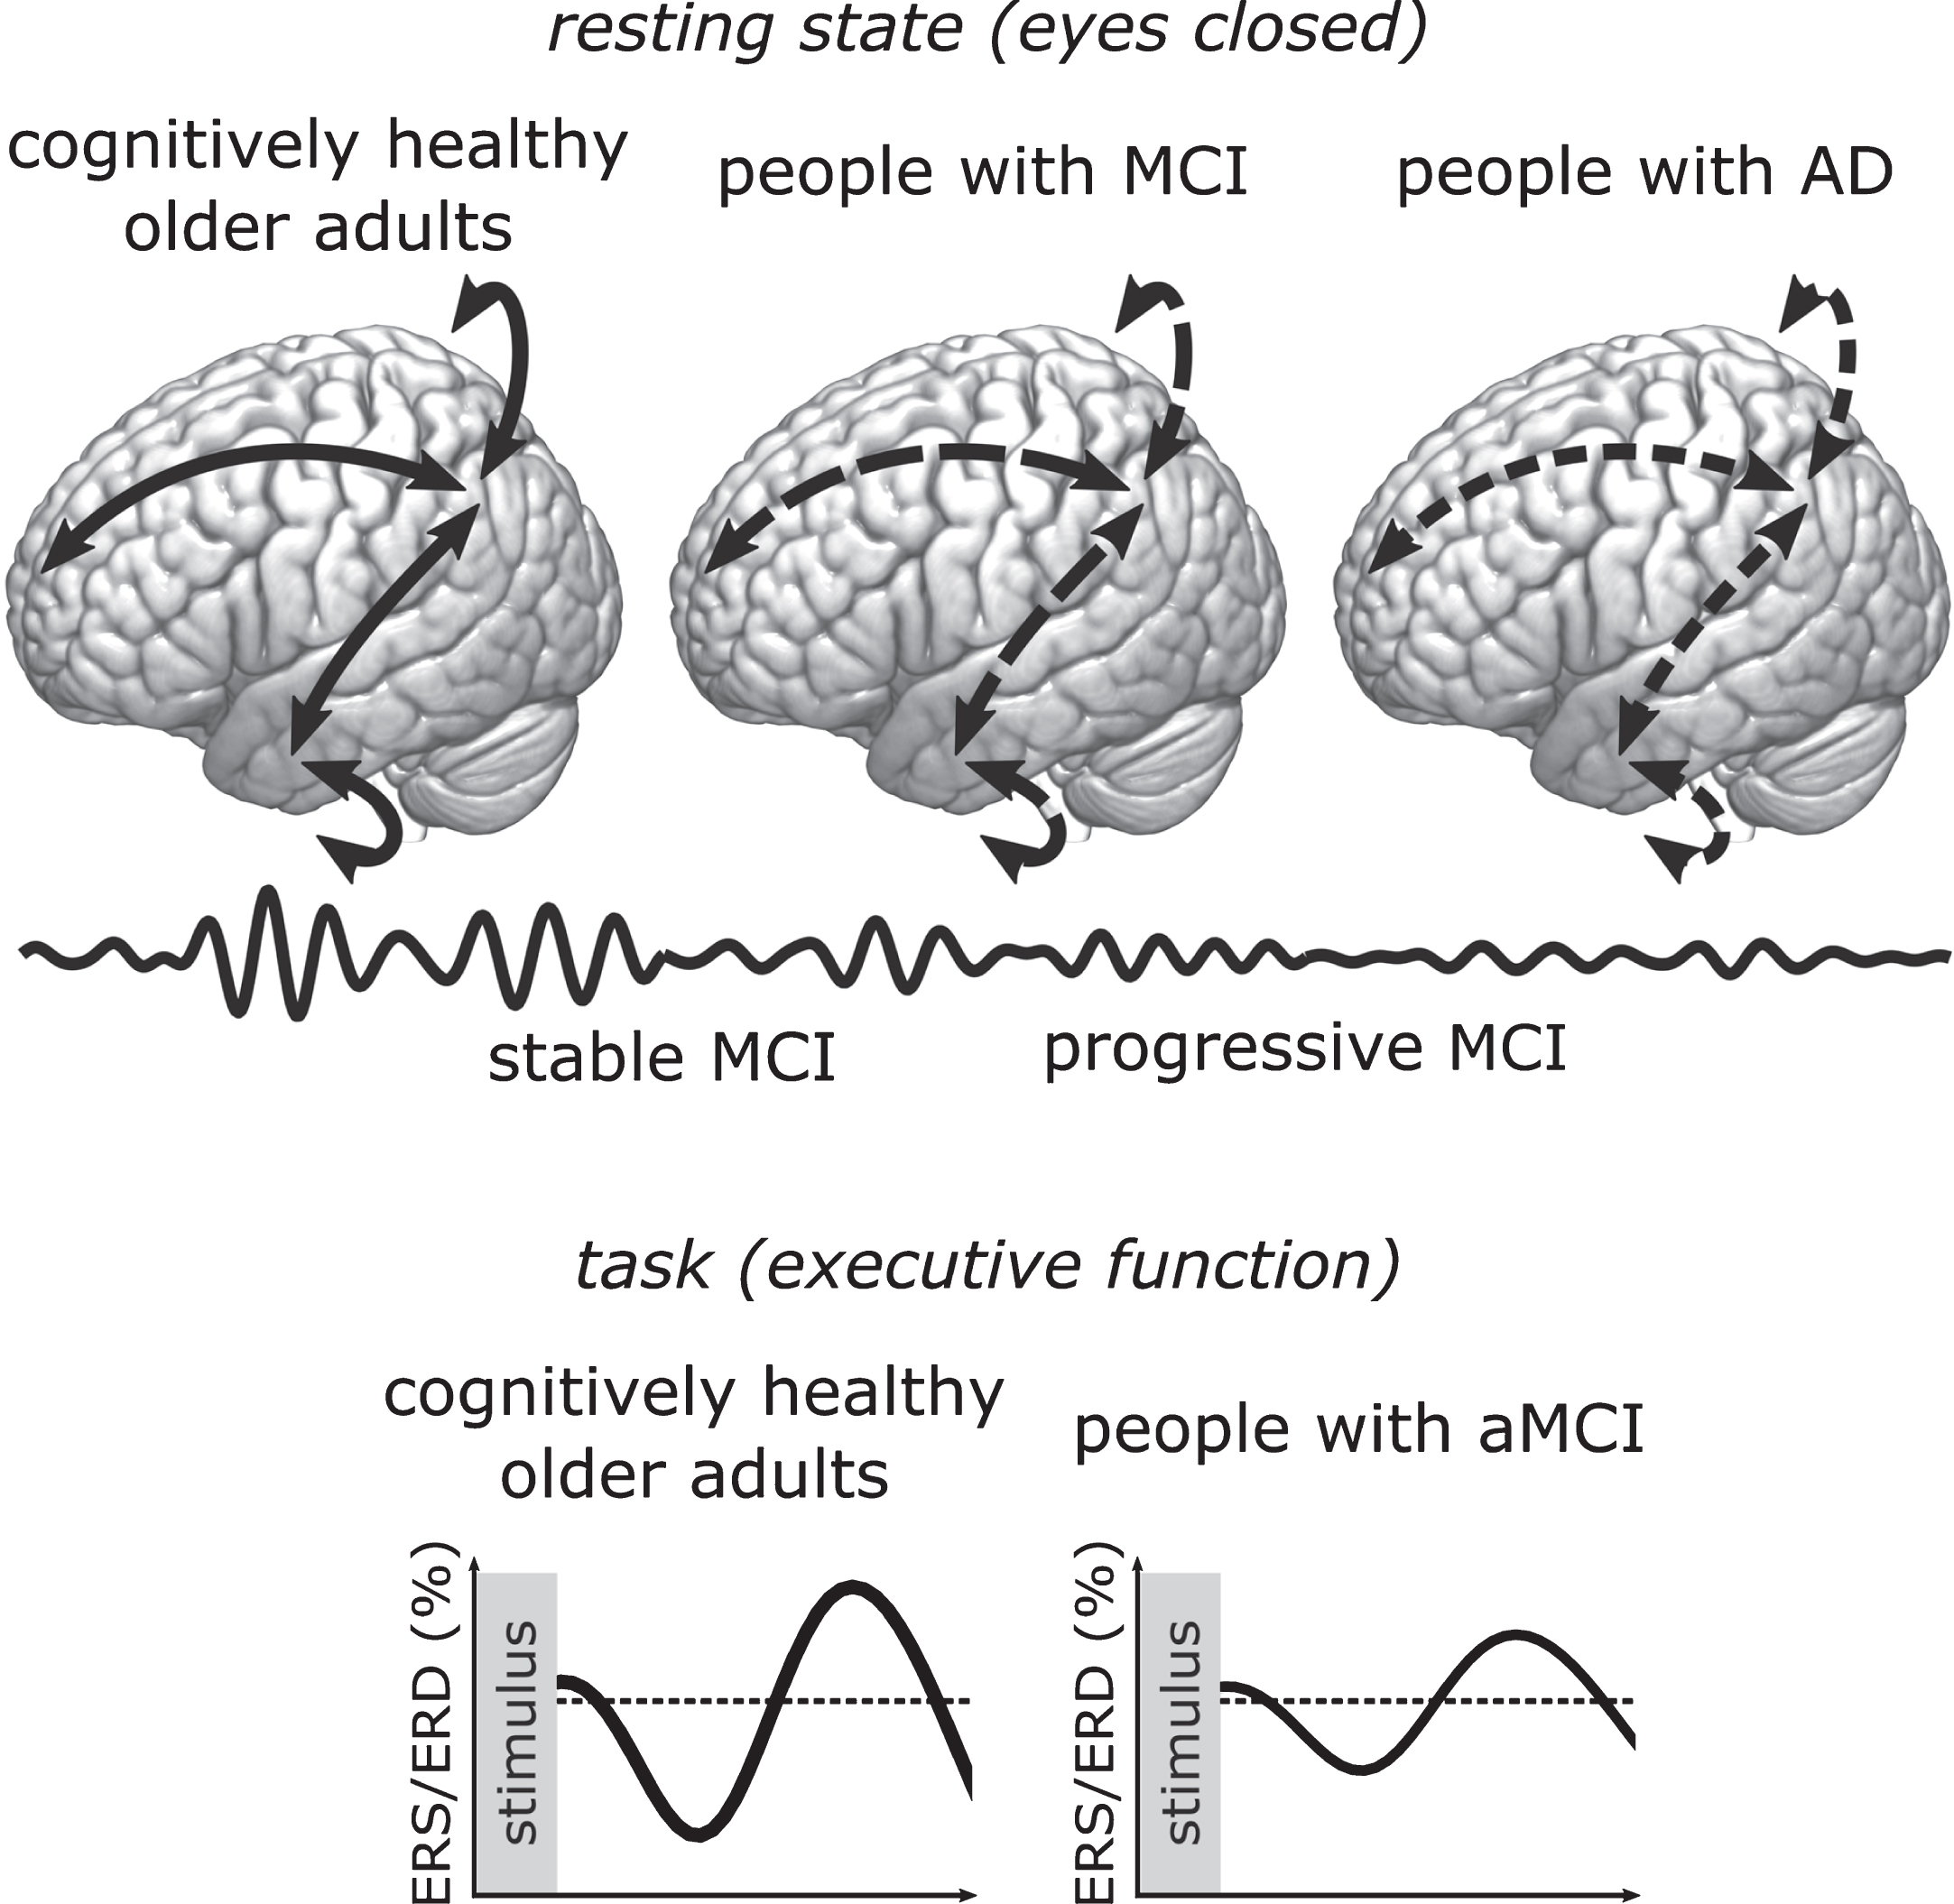
Our review indicates that resting state alpha activity, globally and in posterior regions, reduces gradually as people progress from healthy aging to MCI to AD. Several studies that reported significant differences found lower alpha power in people with AD than in people with MCI, and in people with MCI than in cognitively healthy older adults [43, 58, 70, 72, 73, 75, 77, 80, 81, 94]. Though findings on MCI due to Lewy body disorders are scarce, they suggest that it might also be characterized by a lowering of resting state alpha power [70, 97, 98, 102, 103]. Moreover, four out of six longitudinal studies reported lower alpha power in people with MCI that eventually progressed to AD [57, 72, 111, 114]. In healthy people, alpha is the dominant resting state rhythm that is strongest in posterior parts of the brain [129, 130]. In people with MCI and those with AD, alpha activity was found to shift toward lower frequencies [29, 59, 62, 131–133], and in AD also toward more anterior brain regions [129, 134]. Consistent with these findings, studies that reconstructed sources of electrical activity found that the loss of alpha power in people with MCI was mostly localized to posterior regions [43, 56, 81, 94].
Lower resting state alpha power has been reported in several neurodegenerative diseases [135–138] and may be associated with cholinergic dysfunction. Due to its inverse relationship with neuronal activity [139–141], alpha was initially considered to reflect cortical idling or rest [142], but is now recognized to have an active role in inhibition, selective attention, and executive control [143, 144]. Alpha oscillations originate from thalamo-cortical and cortico-cortical interactions [145–147] that are modulated by the neurotransmitter acetylcholine [145, 148–150]. Cholinergic dysfunction has been described in neurodegenerative diseases such as AD, PD, dementia with Lewy bodies, Huntington’s disease, and FTD [151–157], as well as in people with MCI, especially those who later progressed to AD [158–161]. Interestingly, cholinergic drugs that are used to treat symptoms of dementia were also found to affect oscillations in people with AD and dementia due to PD. Drug-induced changes included an increase in resting state alpha and beta power, and a decrease in theta and delta power [162–164], meaning that cholinergic drugs can counteract the slowing of oscillations that is characteristic of AD [29]. Cholinergic dysfunction could thus be related to observed changes in alpha activity, and in turn impairments in attention, inhibition, and executive functioning in people with neurodegenerative cognitive impairment.
Studies that measured alpha activity during task performance suggest that impaired executive functioning in people with aMCI [165] is underpinned by an inefficient recruitment of neural resources. Compared to cognitively healthy older adults, people with aMCI had lower event-related synchronization (ERS) [117, 119] and desynchronization (ERD) [79, 118, 125] during tasks of executive functions. Alpha ERS has been associated with the inhibition of task-irrelevant areas and learned responses, and ERD with cognitive processing [166], suggesting that people with aMCI have a reduced ability to recruit task-relevant areas and to inhibit task-irrelevant information. This interpretation was supported by Fraga et al. [118] who found ERS in cognitively healthy older adults but ERD in people with MCI in response to stimuli that require response inhibition. Similarly, in a study by Caravaglios et al. [62], only cognitively healthy older adults showed a lowering of alpha power due to anticipatory attention. The studies that compared alpha reactivity between people with MCI and people with AD did not find any differences. Whereas task activation differs between cognitively healthy older adults and those that are experiencing cognitive decline, aMCI and AD might be characterized by similarly inefficient cognitive processing.
Studies on alpha synchronization found mostly lower, but also higher, resting state functional connectivity in people with MCI than in cognitively healthy older adults. AD has long been considered a disconnection syndrome [167, 168], and although connectivity in other neurodegenerative dementias is less well-researched, they have also been associated with network disruption [169]. The pattern of amyloid deposition in AD overlaps with default mode network (DMN) topography [170], and there is evidence of reduced connectivity between regions of the DMN in people with AD [167, 169] and aMCI [171]. Similarly, Hsiao et al. [94] found lower coherence between the left posterior cingulate cortex and other areas of the DMN in AD than in MCI. Several other studies also reported lower synchronization within parietal and between parietal and frontal or temporal regions in people with MCI and AD [43, 75, 83, 85, 88–90].
There were some findings of higher connectivity in people with MCI compared to cognitively healthy older adults [59, 84, 91, 92], and in people with progressive compared to stable MCI [115, 116], which might suggest recruitment of compensatory mechanisms [172]. In fMRI studies, people with aMCI were found to have higher connectivity between the posterior cingulate cortex and frontal [173–175], parahippocampal, and hippocampal regions [174] than cognitively healthy older adults. Zhou et al. [176] compared people with the behavioral variant of FTD (bvFTD) and people with AD and found that these two groups were characterized by the opposite pattern of connectivity changes. While people with AD had lower connectivity in the DMN and higher connectivity in the salience network, people with bvFTD had enhanced DMN but reduced salience network connectivity. Hyper-connectivity between some areas might serve to compensate for the loss of connectivity caused by neurodegeneration and amyloid deposition between others [172–177].
Taken together, findings indicate that people with MCI and people with AD have disrupted alpha activity at rest and during task performance. Though findings on MCI due to Lewy body disorders are scarce, they suggest it could be characterized by similar changes in resting state alpha power. People with neurodegenerative cognitive decline may be less vigilant to incoming stimuli in the resting state, and less able to recruit relevant brain areas when performing a task. Exchange of information that is necessary for fast and efficient processing may be impaired due to hypoconnectivity of posterior regions, and possibly due to maladaptive compensatory hyperconnectivity.
Limitations and future directions
We identified several limitations at review- and outcome-levels that could have affected our results. Most had to do with the diversity in outcomes, which is likely a consequence of the heterogeneous nature of MCI and the diversity of reported alpha measures. Moreover, though we took the first step in integrating findings of EEG studies across healthy aging, MCI, and dementia by focusing on the alpha band, changes in other frequency bands should not be overlooked.
We took several steps to avoid biased or spurious findings at the review-level. We used broad search terms to avoid missing any relevant results. We also contacted original authors if means and standard deviations were not reported, but were often unsuccessful. Despite our efforts, we cannot exclude the possibility that our results were affected by publication bias. Funnel plots (Supplementary Material 3), especially those for meta-analyses comparing alpha and lower alpha power in people with MCI and cognitively healthy older adults, were asymmetrical, but we cannot ascertain whether this is due to publication bias, spurious effects in smaller studies, or heterogeneity of outcomes [178].
Results of meta-analyses comparing people with MCI and cognitively healthy older adults need to be interpreted with caution due to highly heterogeneous outcomes and a small number of included studies. These meta-analyses had high I2 values and included only five to six studies each, which could affect the estimation of the overall mean difference when using a random-effects model. A random-effects model takes the between-study variance into account and usually gives a more conservative estimation of significance when heterogeneity between outcomes is high [179–181]. However, when heterogeneity is high and the number of studies is small, the estimation of between-study variance is imprecise, which in turn affects the summary estimate [179]. Though the minimum number of studies for a random-effects model is not defined, it may be higher than five. Moreover, studies in a random-effects model are weighed more equally, meaning smaller studies can have a larger effect than they would in a fixed-effects model [178]. This could cause an inflated standardized mean difference in the meta-analysis comparing alpha power in people with MCI and cognitively healthy older adults. We therefore repeated the three meta-analyses with large heterogeneity with a fixed-effects model (Supplementary Material 4). Meta-analyses comparing lower and upper alpha power in people with MCI and cognitively healthy older adults remained non-significant. The meta-analysis comparing power in the full alpha band had a smaller effect size but remained significant.
High heterogeneity likely arose from diversity in EEG measures and samples in the original studies. To make outcomes more comparable, we combined means and standard deviations across electrodes or sources into a global measure. However, the number of electrodes or sources that data was available for ranged from three [57] to 19 [58]. Unfortunately, this pooling procedure was not suitable for measures of synchronization, as the data was often only available for certain electrode- or region-pairs. In a recent systematic review on the use of resting state EEG for the diagnosis and prognosis of AD and MCI, Cassani et al. [182] similarly identified large differences in experimental setups and reported EEG features between studies. We also observed that EEG was mostly recorded with a small number of electrodes, which could lead to imprecise measures of alpha power and connectivity in source space, and alpha connectivity in sensor space. Most studies that measured alpha at reconstructed sources used 19 or 20 electrodes [56, 72, 81, 89, 94, 98, 101, 103, 110, 115, 207], which is, according to COBIDAS-MEEG guidelines [82], not sufficient for precise source localization. Furthermore, when connectivity is measured in sensor space with a small number of electrodes and without spatial filters, it can lead to spurious connections. This could explain variable and inconsistent findings of studies that investigated alpha connectivity. Using a small number of electrodes saves time and effort, which is advantageous especially in clinical settings, but not ideal for source reconstruction and connectivity analyses.
Though most studies diagnosed MCI according to widely accepted criteria, samples likely differed in etiology, presentation, and the eventual outcome of impairment. Several studies compared people with MCI to people with AD, but only a few diagnosed AD-MCI according to the 2011 NIA-AA criteria [68], followed-up, or assessed amyloid biomarkers. It is possible that some people were mislabeled as having MCI due to AD while their impairment instead originated from Lewy body, vascular, or other pathology. Of the studies that included people with aMCI, only one [117] made a distinction between single (sd-aMCI) and multiple domain (md-aMCI) subtypes. Compared to people with sd-aMCI, those with md-aMCI were found to have lower resting state occipital alpha power [183] and lower ERS during encoding of attended faces [117]. There is some evidence suggesting that people with md-aMCI are further along the continuum of cognitive decline [184] and are more likely to progress to AD [185].
Cross-sectional studies inevitably grouped people with MCI who later developed different dementias, those who remained stable, and potentially those who reverted to healthy cognition [186]. According to our review of longitudinal studies, resting state alpha power may be lower in people who will progress to AD than in people with stable MCI. Moreover, as noted in our assessment of the quality of individual studies (Supplementary Material 2), some did not explicitly mention whether cognitively healthy older adults were free of cognitive complaints, meaning their results could be affected by the inclusion of people with subjective cognitive decline. Measures of alpha band could also be affected by factors other than cognitive impairment, such as drowsiness. However, all except two studies (Caravaglios et al. [62], van der Hiele et al. [79]) included in meta-analyses reported controlling participants’ vigilance during resting state recording. In both of these studies, upper alpha power was higher in people with MCI than in cognitively healthy older adults. Given that alpha power, especially in upper alpha frequencies, is lower in drowsiness than in alert wakefulness [187], it is unlikely this affected the outcomes. Using more rigorous diagnostic criteria and following-up on participants, as well as standardizing methodology and reporting of EEG measures, would enhance comparability, enable cross-validation between studies, and increase the reliability of results.
While this paper focused on the alpha band, a valid diagnostic and prognostic biomarker will likely be a combination of multiple characteristics of the power spectrum. Theta and gamma bands are well-known for their involvement in memory [35, 188–190]. Activity in these bands, especially during task performance, was found to differ in people with MCI and cognitively healthy older adults [120, 125, 191–194], and activity in the theta band was found to predict progression to AD [112, 116, 195–197]. Task-related changes in delta power have also been identified as a potential biomarker of early cognitive decline [122, 123, 198–200]. Though the role of beta oscillations in MCI is less well-researched, some evidence suggests that beta activity differs in people with MCI and cognitively healthy older adults [119, 201, 202]. To account for the heterogeneity of MCI and for intra-individual differences in EEG activity [203], and to achieve good specificity, all of these changes will need to be taken into account. The present paper is therefore only the first step, and future reviews and meta-analyses should focus on findings from other frequency bands.
Conclusions
We investigated alpha power and functional connectivity in people at different stages of cognitive decline. Findings mostly indicated a lowering of resting state alpha power as people progress from cognitive health to MCI to AD. During task performance, people with MCI and AD had smaller alpha responses than cognitively healthy older adults. Studies on functional connectivity had mixed findings, reporting both lower and higher connectivity in people with MCI than in cognitively healthy older adults. Our review also highlights the diversity of EEG measures, alpha definitions, and cognitive profiles of participants in the studies conducted so far, and points toward the need to choose parameters that will allow for replicable and comparable research. If supported by a larger body of research, resting state alpha power could, perhaps combined with measures from other frequency bands, become a biomarker of early cognitive decline.
ACKNOWLEDGMENTS
This work was supported by ZonMw Memorabel (grant number 733050836). The authors thank N. M. Maurits for her comments on earlier versions of the manuscript.
Authors’ disclosures available online (https://www.j-alz.com/manuscript-disclosures/20-0962r1).
SUPPLEMENTARY MATERIAL
[1] The supplementary material is available in the electronic version of this article: https://dx.doi.org/10.3233/JAD200962.
REFERENCES
[1] | Petersen RC ((2004) ) Mild cognitive impairment as a diagnostic entity. J Intern Med 256: , 183–194. |
[2] | Petersen RC , Caracciolo B , Brayne C , Gauthier S , Jelic V , Fratiglioni L ((2014) ) Mild cognitive impairment: A concept in evolution. J Intern Med 275: , 214–228. |
[3] | Ward A , Arrighi HM , Michels S , Cedarbaum JM ((2012) ) Mild cognitive impairment: Disparity of incidence and prevalence estimates. Alzheimers Dement 8: , 14–21. |
[4] | Lutz W , Goujon A , KC S , Stonawski M , Stilianakis N ((2018) ) Demographic and human capital scenarios for the 21st century: 2018 assessment for 201 countries, Publications Office of the European Union. |
[5] | Prince M , Ali GC , Guerchet M , Prina AM , Albanese E , Wu YT ((2016) ) Recent global trends in the prevalence and incidence of dementia, and survival with dementia. Alzheimers Res Ther 8: , 23. |
[6] | Petersen RC , Smith GE , Waring SC , Ivnik RJ , Tangalos EG , Kokmen E ((1999) ) Mild cognitive impairment: Clinical characterization and outcome. Arch Neurol 56: , 303–308. |
[7] | Winblad B , Palmer K , Kivipelto M , Jelic V , Fratiglioni L , Wahlund LO , Nordberg A , Bäckman L , Albert M , Almkvist O , Arai H ((2004) ) Mild cognitive impairment–beyond controversies, towards a consensus: Report of the International Working Group on Mild Cognitive Impairment. J Intern Med 256: , 240–246. |
[8] | Mitchell AJ , Shiri-Feshki M ((2009) ) Rate of progression of mild cognitive impairment to dementia–meta-analysis of 41 robust inception cohort studies. Acta Psychiatr Scand 119: , 252–265. |
[9] | Aarsland D ((2016) ) Cognitive impairment in Parkinson’s disease and dementia with Lewy bodies. Parkinsonism Relat Disord 22: , S144–S148. |
[10] | Litvan I , Goldman JG , Tröster AI , Schmand BA , Weintraub D , Petersen RC , Mollenhauer B , Adler CH , Marder K , Williams-Gray CH , Aarsland D ((2012) ) Diagnostic criteria for mild cognitive impairment in Parkinson’s disease: Movement Disorder Society Task Force guidelines. Mov Disord 27: , 349–356. |
[11] | Tröster AI ((2008) ) Neuropsychological characteristics of dementia with Lewy bodies and Parkinson’s disease with dementia: Differentiation, early detection, and implications for “mild cognitive impairment” and biomarkers. Neuropsychol Rev 18: , 103–119. |
[12] | de Mendonça A , Ribeiro F , Guerreiro M , Garcia C ((2004) ) Frontotemporal mild cognitive impairment. J Alzheimers Dis 6: , 1–9. |
[13] | Hobson P , Meara J ((2015) ) Mild cognitive impairment in Parkinson’s disease and its progression onto dementia: A 16-year outcome evaluation of the Denbighshire cohort. Int J Geriatr Psychiatry 30: , 1048–1055. |
[14] | Pedersen KF , Larsen JP , Tysnes OB , Alves G ((2017) ) Natural course of mild cognitive impairment in Parkinson disease: A 5-year population-based study. Neurology 88: , 767–774. |
[15] | Ferman TJ , Smith GE , Kantarci K , Boeve BF , Pankratz VS , Dickson DW , Graff-Radford NR , Wszolek Z , Van Gerpen J , Uitti R , Pedraza O ((2013) ) Nonamnestic mild cognitive impairment progresses to dementia with Lewy bodies. Neurology 81: , 2032–2038. |
[16] | Fischer P , Jungwirth S , Zehetmayer S , Weissgram S , Hoenigschnabl S , Gelpi E , Krampla W , Tragl KH ((2007) ) Conversion from subtypes of mild cognitive impairment to Alzheimer dementia. Neurology 68: , 288–291. |
[17] | Lehrner J , Gufler R , Guttmann G , Maly J , Gleiß A , Auff E , Dal-Bianco P ((2005) ) Annual conversion to Alzheimer disease among patients with memory complaints attending an outpatient memory clinic: The influence of amnestic mild cognitive impairment and the predictive value of neuropsychological testing. Wien Klin Wochenschr 117: , 629–635. |
[18] | Palmer K , Bäckman L , Winblad B , Fratiglioni L ((2008) ) Mild cognitive impairment in the general population: Occurrence and progression to Alzheimer disease. Am J Geriatr Psychiatry 16: , 603–611. |
[19] | Bruscoli M , Lovestone S ((2004) ) Is MCI really just early dementia? A systematic review of conversion studies. Int Psychogeriatr 16: , 129–140. |
[20] | Farias ST , Mungas D , Reed BR , Harvey D , DeCarli C ((2009) ) Progression of mild cognitive impairment to dementia in clinic-vs community-based cohorts. Arch Neurol 66: , 1151–1157. |
[21] | Ward LM ((2003) ) Synchronous neural oscillations and cognitive processes. Trends Cogn Sci 7: , 553–559. |
[22] | Friston KJ ((2011) ) Functional and effective connectivity: A review. Brain Connect 1: , 13–36. |
[23] | Siegel M , Donner TH , Engel AK ((2012) ) Spectral fingerprints of large-scale neuronal interactions. Nat Rev Neurosci 13: , 121–134. |
[24] | Colgin LL ((2013) ) Mechanisms and functions of theta rhythms. Annu Rev Neurosci 36: , 295–312. |
[25] | Engel AK , Fries P ((2010) ) Beta-band oscillations—signalling the status quo? Curr Opin Neurobiol 20: , 156–165. |
[26] | Klimesch W , Doppelmayr M , Russegger H , Pachinger T , Schwaiger J ((1998) ) Induced alpha band power changes in the human EEG and attention. Neurosci Lett 244: , 73–76. |
[27] | Başar E , Başar-Eroglu C , Karakaş S , Schürmann M ((2001) ) Gamma, alpha, delta, and theta oscillations govern cognitive processes. Int J Psychophysiol 39: , 241–248. |
[28] | de Haan W , Stam CJ , Jones BF , Zuiderwijk IM , van Dijk BW , Scheltens P ((2008) ) Resting-state oscillatory brain dynamics in Alzheimer disease. J Clin Neurophysiol 25: , 187–193. |
[29] | Jeong J ((2004) ) EEG dynamics in patients with Alzheimer’s disease. Clin Neurophysiol 115: , 1490–1505. |
[30] | Yener GG , Başar E ((2010) ) Sensory evoked and event related oscillations in Alzheimer’s disease: A short review. Cogn Neurodyn 4: , 263–274. |
[31] | Başar E , Güntekin B ((2008) ) A review of brain oscillations in cognitive disorders and the role of neurotransmitters. Brain Res 1235: , 172–193. |
[32] | Başar E , Güntekin B ((2013) ) Review of delta, theta, alpha, beta, and gamma response oscillations in neuropsychiatric disorders. Suppl Clin Neurophysiol 62: , 303–341. |
[33] | Britton JW , Frey LC , Hopp JL , Korb P , Koubeissi MZ , Lievens WE , Pestana-Knight EM , St EL ((2016) ) Electroencephalography (EEG): An introductory text and atlas of normal and abnormal findings in adults, children, and infants, American Epilepsy Society, Chicago, https://www.ncbi.nlm.nih.gov/books/NBK390343/, Accessed on 25 May 2020. |
[34] | Herrmann CS , Demiralp T ((2005) ) Human EEG gamma oscillations in neuropsychiatric disorders. Clin Neurophysiol 116: , 2719–2733. |
[35] | Klimesch W ((1999) ) EEG alpha and theta oscillations reflect cognitive and memory performance: A review and analysis. Brain Res Rev 29: , 169–195. |
[36] | Kropotov JD ((2010) ) Quantitative EEG, event-related potentials and neurotherapy, Academic Press. |
[37] | Adler G , Brassen S , Jajcevic A ((2003) ) EEG coherence in Alzheimer’s dementia. J Neural Transm 110: , 1051–1058. |
[38] | Locatelli T , Cursi M , Liberati D , Franceschi M , Comi G ((1998) ) EEG coherence in Alzheimer’s disease. Electroencephalogr Clin Neurophysiol 106: , 229–237. |
[39] | Uhlhaas PJ , Singer W ((2006) ) Neural synchrony in brain disorders: Relevance for cognitive dysfunctions and pathophysiology. Neuron 52: , 155–168. |
[40] | Babiloni C , Binetti G , Cassetta E , Dal Forno G , Del Percio C , Ferreri F , Ferri R , Frisoni G , Hirata K , Lanuzza B , Miniussi C ((2006) ) Sources of cortical rhythms change as a function of cognitive impairment in pathological aging: A multicenter study. Clin Neurophysiol 117: , 252–268. |
[41] | Stam CJ , Jones BF , Manshanden I , van Cappellen-van Walsum AM , Montez T , Verbunt JP , de Munck JC , van Dijk BW , Berendse HW , Scheltens P ((2006) ) Magnetoencephalographic evaluation of resting-state functional connectivity in Alzheimer’s disease. Neuroimage 32: , 1335–1344. |
[42] | Babiloni C , Frisoni GB , Pievani M , Vecchio F , Lizio R , Buttiglione M , Geroldi C , Fracassi C , Eusebi F , Ferri R , Rossini PM ((2009) ) Hippocampal volume and cortical sources of EEG alpha rhythms in mild cognitive impairment and Alzheimer disease. Neuroimage 44: , 123–135. |
[43] | Michels L , Muthuraman M , Anwar AR , Kollias S , Leh SE , Riese F , Unschuld PG , Siniatchkin M , Gietl AF , Hock C ((2017) ) Changes of functional and directed resting-state connectivity are associated with neuronal oscillations, ApoE genotype and amyloid deposition in mild cognitive impairment. Front Aging Neurosci 9: , 304. |
[44] | Babiloni C , Benussi L , Binetti G , Bosco P , Busonero G , Cesaretti S , Dal Forno G , Del Percio C , Ferri R , Frisoni G , Ghidoni R ((2006) ) Genotype (cystatin C) and EEG phenotype in Alzheimer disease and mild cognitive impairment: A multicentric study. Neuroimage 29: , 948–964. |
[45] | Jelic V , Julin P , Shigeta M , Nordberg A , Lannfelt L , Winblad B , Wahlund LO ((1997) ) Apolipoprotein E ɛ4 allele decreases functional connectivity in Alzheimer’s disease as measured by EEG coherence. J Neurol Neurosurg Psychiatry 63: , 59–65. |
[46] | Andersson M , Hansson O , Minthon L , Rosén I , Londos E ((2008) ) Electroencephalogram variability in dementia with Lewy bodies, Alzheimer’s disease and controls. Dement Geriatr Cogn Disord 26: , 284–290. |
[47] | Caviness JN , Hentz JG , Evidente VG , Driver-Dunckley E , Samanta J , Mahant P , Connor DJ , Sabbagh MN , Shill HA , Adler CH ((2007) ) Both early and late cognitive dysfunction affects the electroencephalogram in Parkinson’s disease. Parkinsonism Relat Disord 13: , 348–354. |
[48] | Fonseca LC , Tedrus GMAS , Letro GH , Bossoni AS ((2009) ) Dementia, mild cognitive impairment and quantitative EEG in patients with Parkinson’s disease. Clin EEG Neurosci 40: , 168–172. |
[49] | Tanaka H , Koenig T , Pascual-Marqui RD , Hirata K , Kochi K , Lehmann D ((2000) ) Event-related potential and EEG measures in Parkinson’s disease without and with dementia. Dement Geriatr Cogn Disord 11: , 39–45. |
[50] | Moher D , Liberati A , Tetzlaff J , Altman DG , The PRISMA Group ((2009) ) Preferred reporting items for systematic reviews and meta-analyses: The PRISMA statement. PLoS Med 6: , e1000097. |
[51] | Liberati A , Altman DG , Tetzlaff J , Mulrow C , Gøtzsche PC , Ioannidis JP , Clarke M , Devereaux PJ , Kleijnen J , Moher D ((2009) ) The PRISMA statement for reporting systematic reviews and meta-analyses of studies that evaluate health care interventions: Explanation and elaboration. PLoS Med 6: , e1000100. |
[52] | Chaturvedi M , Hatz F , Gschwandtner U , Bogaarts JG , Meyer A , Fuhr P , Roth V ((2017) ) Quantitative EEG (QEEG) measures differentiate Parkinson’s disease (PD) patients from healthy controls (HC). Front Aging Neurosci 9: , 3. |
[53] | Han CX , Wang J , Yi GS , Che YQ ((2013) ) Investigation of EEG abnormalities in the early stage of Parkinson’s disease. Cogn Neurodyn 7: , 351–359. |
[54] | Moazami-Goudarzi M , Sarnthein J , Michels L , Moukhtieva R , Jeanmonod D ((2008) ) Enhanced frontal low and high frequency power and synchronization in the resting EEG of parkinsonian patients. Neuroimage 41: , 985–997. |
[55] | The Cochrane Collaboration (2014) Review Manager (RevMan). Version 5.3. |
[56] | Babiloni C , Carducci F , Lizio R , Vecchio F , Baglieri A , Bernardini S , Cavedo E , Bozzao A , Buttinelli C , Esposito F , Giubilei F ((2013) ) Resting state cortical electroencephalographic rhythms are related to gray matter volume in subjects with mild cognitive impairment and Alzheimer’s disease. Hum Brain Mapp 34: , 1427–1446. |
[57] | Luckhaus C , Grass-Kapanke B , Blaeser I , Ihl R , Supprian T , Winterer G , Zielasek J , Brinkmeyer J ((2008) ) Quantitative EEG in progressing vs stable mild cognitive impairment (MCI): Results of a 1-year follow-up study. Int J Geriatr Psychiatry 23: , 1148–1155. |
[58] | Musaeus CS , Engedal K , Høgh P , Jelic V , Mørup M , Naik M , Oeksengaard AR , Snaedal J , Wahlund LO , Waldemar G , Andersen BB ((2018) ) EEG theta power is an early marker of cognitive decline in dementia due to Alzheimer’s disease. J Alzheimers Dis 64: , 1359–1371. |
[59] | Pons AJ , Cantero JL , Atienza M , Garcia-Ojalvo J ((2010) ) Relating structural and functional anomalous connectivity in the aging brain via neural mass modeling. Neuroimage 52: , 848–861. |
[60] | Ya M , Xun W , Wei L , Ting H , Hong Y , Yuan Z ((2015) ) Is the electroencephalogram power spectrum valuable for diagnosis of the elderly with cognitive impairment? Int J Gerontol 9: , 196–200. |
[61] | Higgins JPT , Li T , Deeks JJ , eds ((2019) ) Chapter 6: Choosing effect measures and computing estimates of effect. In Cochrane Handbook for Systematic Reviews of Interventions version 6.0, Higgins JPT, Thomas J, Chandler J, Cumpston M, Li T, Page MJ, Welch VA, eds. Cochrane, https://www.training.cochrane.org/handbook, Last updated July 2019, Accessed June 4, 2020. |
[62] | Caravaglios G , Muscoso EG , Di Maria G , Costanzo E ((2015) ) Patients with mild cognitive impairment have an abnormal upper-alpha event-related desynchronization/synchronization (ERD/ERS) during a task of temporal attention. J Neural Transm 122: , 441–453. |
[63] | Higgins JP , Thompson SG ((2002) ) Quantifying heterogeneity in a meta-analysis. Stat Med 21: , 1539–1558. |
[64] | Higgins JP , Thompson SG , Deeks JJ , Altman DG ((2003) ) Measuring inconsistency in meta-analyses. BMJ 327: , 557–560. |
[65] | Faul F , Erdfelder E , Lang AG , Buchner A ((2007) ) G*Power 3: A flexible statistical power analysis program for the social, behavioral, and biomedical sciences. Behav Res Methods 39: , 175–191. |
[66] | Egger M , Smith GD , Schneider M , Minder C ((1997) ) Bias in meta-analysis detected by a simple, graphical test. BMJ 315: , 629–634. |
[67] | Page MJ , Higgins JPT , Sterne JAC ((2019) ) Chapter 13: Assessing risk of bias due to missing results in a synthesis. In Cochrane Handbook for Systematic Reviews of Interventions version 6.0, Higgins JPT, Thomas J, Chandler J, Cumpston M, Li T, Page MJ, Welch VA, eds. Cochrane, https://www.training.cochrane.org/handbook, Last updated July 2019, Accessed on June 3, 2020. |
[68] | Albert MS , DeKosky ST , Dickson D , Dubois B , Feldman HH , Fox NC , Gamst A , Holtzman DM , Jagust WJ , Petersen RC , Snyder PJ ((2011) ) The diagnosis of mild cognitive impairment due to Alzheimer’s disease: Recommendations from the National Institute on Aging-Alzheimer’s Association workgroups on diagnostic guidelines for Alzheimer’s disease. Alzheimers Dement 7: , 270–279. |
[69] | Poza J , Gomez C , Garcia M , A Tola-Arribas M , Carreres A , Cano M , Hornero R ((2017) ) Spatio-temporal fluctuations of neural dynamics in mild cognitive impairment and Alzheimer’s disease. Curr Alzheimer Res 14: , 924–936. |
[70] | Bonanni L , Perfetti B , Bifolchetti S , Taylor JP , Franciotti R , Parnetti L , Thomas A , Onofrj M ((2015) ) Quantitative electroencephalogram utility in predicting conversion of mild cognitive impairment to dementia with Lewy bodies. Neurobiol Aging 36: , 434–445. |
[71] | Dauwels J , Srinivasan K , Ramasubba Reddy M , Musha T , Vialatte FB , Latchoumane C , Jeong J , Cichocki A ((2011) ) Slowing and loss of complexity in Alzheimer’s EEG: Two sides of the same coin? Int J Alzheimers Dis 2011: , 539621. |
[72] | Huang C , Wahlund LO , Dierks T , Julin P , Winblad B , Jelic V ((2000) ) Discrimination of Alzheimer’s disease and mild cognitive impairment by equivalent EEG sources: A cross-sectional and longitudinal study. Clin Neurophysiol 111: , 1961–1967. |
[73] | Smailovic U , Koenig T , Kåreholt I , Andersson T , Kramberger MG , Winblad B , Jelic V ((2018) ) Quantitative EEG power and synchronization correlate with Alzheimer’s disease CSF biomarkers. Neurobiol Aging 63: , 88–95. |
[74] | Sharma N , Kolekar MH , Jha K , Kumar Y ((2019) ) EEG and cognitive biomarkers based mild cognitive impairment diagnosis. IRBM 40: , 114–121. |
[75] | Jelic V , Shigeta M , Julin P , Almkvist O , Winblad B , Wahlund LO ((1996) ) Quantitative electroencephalography power and coherence in Alzheimer’s disease and mild cognitive impairment. Dement Geriatr Cogn Disord 7: , 314–323. |
[76] | Petersen RC , Doody R , Kurz A , Mohs RC , Morris JC , Rabins PV , Ritchie K , Rossor M , Thal L , Winblad B ((2001) ) Current concepts in mild cognitive impairment. Arch Neurol 58: , 1985–1992. |
[77] | Roh JH , Park MH , Ko D , Park KW , Lee DH , Han C , Jo SA , Yang KS , Jung KY ((2011) ) Region and frequency specific changes of spectral power in Alzheimer’s disease and mild cognitive impairment.. Clin Neurophysiol 122: , 2169–2176. |
[78] | McBride JC , Zhao X , Munro NB , Smith CD , Jicha GA , Hively L , Broster LS , Schmitt FA , Kryscio RJ , Jiang Y ((2014) ) Spectral and complexity analysis of scalp EEG characteristics for mild cognitive impairment and early Alzheimer’s disease. Comput Methods Programs Biomed 114: , 153–163. |
[79] | van der Hiele K , Vein AA , Kramer CG , Reijntjes RH , van Buchem MA , Westendorp RG , Bollen EL , van Dijk JG , Middelkoop HA ((2007) ) Memory activation enhances EEG abnormality in mild cognitive impairment. Neurobiol Aging 28: , 85–90. |
[80] | Babiloni C , Ferri R , Binetti G , Vecchio F , Frisoni GB , Lanuzza B , Miniussi C , Nobili F , Rodriguez G , Rundo F , Cassarino A ((2009) ) Directionality of EEG synchronization in Alzheimer’s disease subjects. Neurobiol Aging 30: , 93–102. |
[81] | Vecchio F , Miraglia F , Marra C , Quaranta D , Vita MG , Bramanti P , Rossini PM ((2014) ) Human brain networks in cognitive decline: A graph theoretical analysis of cortical connectivity from EEG data. J Alzheimers Dis 41: , 113–127. |
[82] | Pernet CR , Garrido M , Gramfort A , Maurits N , Michel C , Pang E , Salmelin R , Schoffelen JM , Valdes-Sosa PA , Puce A ((2018) ) Best Practices in Data Analysis and Sharing in Neuroimaging using MEEG, https://osf.io/a8dhx/, Last updated August 9, 2018, Accessed on August 9, 2018. |
[83] | Gonzalez-Escamilla G , Atienza M , Garcia-Solis D , Cantero JL ((2016) ) Cerebral and blood correlates of reduced functional connectivity in mild cognitive impairment. Brain Struct Funct 221: , 631–645. |
[84] | Musaeus CS , Engedal K , Høgh P , Jelic V , Mørup M , Naik M , Oeksengaard AR , Snaedal J , Wahlund LO , Waldemar G , Andersen BB ((2019) ) Oscillatory connectivity as a diagnostic marker of dementia due to Alzheimer’s disease. Clin Neurophysiol 130: , 1889–1899. |
[85] | Teipel SJ , Pogarell O , Meindl T , Dietrich O , Sydykova D , Hunklinger U , Georgii B , Mulert C , Reiser MF , Möller HJ , Hampel H ((2009) ) Regional networks underlying interhemispheric connectivity: An EEG and DTI study in healthy ageing and amnestic mild cognitive impairment. Hum Brain Mapp 30: , 2098–2119. |
[86] | Wen D , Xue Q , Lu C , Guan X , Wang Y , Li X ((2014) ) A global coupling index of multivariate neural series with application to the evaluation of mild cognitive impairment. Neural Netw 56: , 1–9. |
[87] | Koenig T , Prichep L , Dierks T , Hubl D , Wahlund LO , John ER , Jelic V ((2005) ) Decreased EEG synchronization in Alzheimer’s disease and mild cognitive impairment. Neurobiol Aging 26: , 165–171. |
[88] | Núñez P , Poza J , Gómez C , Rodríguez-González V , Hillebrand A , Tola-Arribas MA , Cano M , Hornero R ((2019) ) Characterizing the fluctuations of dynamic resting-state electrophysiological functional connectivity: Reduced neuronal coupling variability in mild cognitive impairment and dementia due to Alzheimer’s disease. J Neural Eng 16: , 056030. |
[89] | Babiloni C , Del Percio C , Lizio R , Noce G , Lopez S , Soricelli A , Ferri R , Pascarelli MT , Catania V , Nobili F , Arnaldi D ((2018) ) Functional cortical source connectivity of resting state electroencephalographic alpha rhythms shows similar abnormalities in patients with mild cognitive impairment due to Alzheimer’s and Parkinson’s diseases. Clin Neurophysiol 129: , 766–782. |
[90] | Xu P , Xiong XC , Xue Q , Tian Y , Peng Y , Zhang R , Li PY , Wang YP ((2014) ) Recognizing mild cognitive impairment based on network connectivity analysis of resting EEG with zero reference. Physiol Meas 35: , 1279–1298. |
[91] | Moretti DV , Frisoni GB , Pievani M , Rosini S , Geroldi C , Binetti G , Rossini PM ((2008) ) Cerebrovascular disease and hippocampal atrophy are differently linked to functional coupling of brain areas: An EEG coherence study in MCI subjects. J Alzheimers Dis 14: , 285–299. |
[92] | Cantero JL , Atienza M , Cruz-Vadell A , Suarez-Gonzalez A , Gil-Neciga E ((2009) ) Increased synchronization and decreased neural complexity underlie thalamocortical oscillatory dynamics in mild cognitive impairment. Neuroimage 46: , 938–948. |
[93] | Babiloni C , Frisoni G , Vecchio F , Lizio R , Pievani M , Geroldi C , Fracassi C , Vernieri F , Ursini F , Rodriguez G , Nobili F ((2009) ) Global functional coupling of resting EEG rhythms is abnormal in mild cognitive impairment and Alzheimer’s disease: A multicenter EEG study. J Psychophysiol 23: , 224–234. |
[94] | Hsiao FJ , Wang YJ , Yan SH , Chen WT , Lin YY ((2013) ) Altered oscillation and synchronization of default-mode network activity in mild Alzheimer’s disease compared to mild cognitive impairment: An electrophysiological study. PloS One 8: , e68792. |
[95] | Pijnenburg YA , van der Made Y , van Cappellen-van Walsum AM , Knol DL , Scheltens P , Stam CJ ((2004) ) EEG synchronization likelihood in mild cognitive impairment and Alzheimer’s disease during a working memory task. Clin Neurophysiol 115: , 1332–1339. |
[96] | Stam CJ , van der Made Y , Pijnenburg YAL , Scheltens PH ((2003) ) EEG synchronization in mild cognitive impairment and Alzheimer’s disease. Acta Neurol Scand 108: , 90–96. |
[97] | Caviness JN , Utianski RL , Hentz JG , Beach TG , Dugger BN , Shill HA , Driver-Dunckley ED , Sabbagh MN , Mehta S , Adler CH ((2015) ) Differential spectral quantitative electroencephalography patterns between control and Parkinson’s disease cohorts. Eur J Neurol 23: , 387–392. |
[98] | Mostile G , Giuliano L , Monastero R , Luca A , Cicero CE , Donzuso G , Dibilio V , Baschi R , Terranova R , Restivo V , Sofia V ((2019) ) Electrocortical networks in Parkinson’s disease patients with mild cognitive impairment. The PaCoS study. Parkinsonism Relat Disord 64: , 156–162. |
[99] | Chaturvedi M , Bogaarts JG , Kozak VV , Hatz F , Gschwandtner U , Meyer A , Fuhr P , Roth V ((2019) ) Phase lag index and spectral power as QEEG features for identification of patients with mild cognitive impairment in Parkinson’s disease. Clin Neurophysiol 130: , 1937–1944. |
[100] | He X , Zhang Y , Chen J , Xie C , Gan R , Wang L , Wang L ((2017) ) Changes in theta activities in the left posterior temporal region, left occipital region and right frontal region related to mild cognitive impairment in Parkinson’s disease patients. Int J Neurosci 127: , 66–72. |
[101] | Babiloni C , Del Percio C , Lizio R , Noce G , Lopez S , Soricelli A , Ferri R , Pascarelli MT , Catania V , Nobili F , Arnaldi D ((2019) ) Levodopa may affect cortical excitability in Parkinson’s disease patients with cognitive deficits as revealed by reduced activity of cortical sources of resting state electroencephalographic rhythms. Neurobiol Aging 73: , 9–20. |
[102] | Bousleiman H , Zimmermann R , Ahmed S , Hardmeier M , Hatz F , Schindler C , Roth V , Gschwandtner U , Fuhr P ((2014) ) Power spectra for screening parkinsonian patients for mild cognitive impairment. Ann Clin Transl Neurol 1: , 884–890. |
[103] | Babiloni C , Del Percio C , Lizio R , Noce G , Lopez S , Soricelli A , Ferri R , Pascarelli MT , Catania V , Nobili F , Arnaldi D ((2018) ) Abnormalities of resting state cortical EEG rhythms in subjects with mild cognitive impairment due to Alzheimer’s and Lewy body diseases. J Alzheimers Dis 62: , 247–268. |
[104] | Babiloni C , Binetti G , Cassarino A , Dal Forno G , Del Percio C , Ferreri F , Ferri R , Frisoni G , Galderisi S , Hirata K , Lanuzza B ((2006) ) Sources of cortical rhythms in adults during physiological aging: A multicentric EEG study. Hum Brain Mapp 27: , 162–172. |
[105] | Knyazeva MG , Barzegaran E , Vildavski VY , Demonet JF ((2018) ) Aging of human alpha rhythm. Neurobiol Aging 69: , 261–273. |
[106] | Stoffers D , Bosboom JLW , Deijen JB , Wolters EC , Berendse HW , Stam CJ ((2007) ) Slowing of oscillatory brain activity is a stable characteristic of Parkinson’s disease without dementia. Brain 130: , 1847–1860. |
[107] | Moretti DV , Benussi L , Fostinelli S , Ciani M , Binetti G , Ghidoni R ((2016) ) Progranulin mutations affects brain oscillatory activity in fronto-temporal dementia. Front Aging Neurosci 8: , 35. |
[108] | Utianski RL , Caviness JN , van Straaten EC , Beach TG , Dugger BN , Shill HA , Driver-Dunckley ED , Sabbagh MN , Mehta S , Adler CH , Hentz JG ((2016) ) Graph theory network function in Parkinson’s disease assessed with electroencephalography. Clin Neurophysiol 127: , 2228–2236. |
[109] | Carmona Arroyave JA , Tobón Quintero CA , Suárez Revelo JJ , Ochoa Gómez JF , García YB , Gómez LM , Pineda Salazar DA ((2019) ) Resting functional connectivity and mild cognitive impairment in Parkinson’s disease. An electroencephalogram study. Future Neurol 14: , 2. |
[110] | Babiloni C , Del Percio C , Pascarelli MT , Lizio R , Noce G , Lopez S , Rizzo M , Ferri R , Soricelli A , Nobili F , Arnaldi D ((2019) ) Abnormalities of functional cortical source connectivity of resting-state electroencephalographic alpha rhythms are similar in patients with mild cognitive impairment due to Alzheimer’s and Lewy body diseases. Neurobiol Aging 77: , 112–127. |
[111] | Gouw AA , Alsema AM , Tijms BM , Borta A , Scheltens P , Stam CJ , van der Flier WM ((2017) ) EEG spectral analysis as a putative early prognostic biomarker in nondemented, amyloid positive subjects. Neurobiol Aging 57: , 133–142. |
[112] | Jelic V , Johansson SE , Almkvist O , Shigeta M , Julin P , Nordberg A , Winblad B , Wahlund LO ((2000) ) Quantitative electroencephalography in mild cognitive impairment: Longitudinal changes and possible prediction of Alzheimer’s disease. Neurobiol Aging 21: , 533–540. |
[113] | Musaeus CS , Nielsen MS , Østerbye NN , Høgh P ((2018) ) Decreased parietal beta power as a sign of disease progression in patients with mild cognitive impairment. J Alzheimers Dis 65: , 475–487. |
[114] | Poil SS , de Haan W , van der Flier WM , Mansvelder HD , Scheltens P , Linkenkaer-Hansen K ((2013) ) Integrative EEG biomarkers predict progression to Alzheimer’s disease at the MCI stage. Front Aging Neurosci 5: , 58. |
[115] | Rossini PM , Del Percio C , Pasqualetti P , Cassetta E , Binetti G , Dal Forno G , Ferreri F , Frisoni G , Chiovenda P , Miniussi C , Parisi L ((2006) ) Conversion from mild cognitive impairment to Alzheimer’s disease is predicted by sources and coherence of brain electroencephalography rhythms. Neuroscience 143: , 793–803. |
[116] | Musaeus CS , Nielsen MS , Høgh P ((2019) ) Altered low-frequency EEG connectivity in mild cognitive impairment as a sign of clinical progression. J Alzheimers Dis 68: , 947–960. |
[117] | Deiber MP , Ibáñez V , Herrmann F , Rodriguez C , Emch J , Missonnier P , Millet P , Gold G , Giannakopoulos P ((2011) ) Face short-term memory-related electroencephalographic patterns can differentiate multi-versus single-domain amnestic mild cognitive impairment. J Alzheimers Dis 26: , 157–169. |
[118] | Fraga FJ , Mamani GQ , Johns E , Tavares G , Falk TH , Phillips NA ((2018) ) Early diagnosis of mild cognitive impairment and Alzheimer’s with event-related potentials and event-related desynchronization in N-back working memory tasks. Comput Methods Programs Biomed 164: , 1–13. |
[119] | Fodor Z , Sirály E , Horváth A , Salacz P , Hidasi Z , Csibri É , Szabó Á , Csukly G ((2018) ) Decreased event-related beta synchronization during memory maintenance marks early cognitive decline in mild cognitive impairment. J Alzheimers Dis 63: , 489–502. |
[120] | Goodman MS , Zomorrodi R , Kumar S , Barr MS , Daskalakis ZJ , Blumberger DM , Fischer CE , Flint A , Mah L , Herrmann N , Pollock BG ((2019) ) Changes in theta but not alpha modulation are associated with impairment in working memory in Alzheimer’s disease and mild cognitive impairment. J Alzheimers Dis 68: , 1085–1094. |
[121] | van der Hiele K , Reijntjes RH , Vein AA , Westendorp RG , van Buchem MA , Bollen EL , Middelkoop HA , van Dijk JG ((2011) ) Electromyographic activity in the EEG in Alzheimer’s disease: Noise or signal? Int J Alzheimers Dis 2011: , 547024. |
[122] | Kurt P , Emek-Savaş DD , Batum K , Turp B , Güntekin B , Karşıdağ S , Yener GG ((2014) ) Patients with mild cognitive impairment display reduced auditory event-related delta oscillatory responses. Behav Neurol 2014: , 268967. |
[123] | Yener GG , Kurt P , Emek-Savaş DD , Güntekin B , Başar E ((2013) ) Reduced visual event-related delta oscillatory responses in amnestic mild cognitive impairment. J Alzheimers Dis 37: , 759–767. |
[124] | Yener GG , Fide E , Özbek Y , Emek-Savaş DD , Aktürk T , Çakmur R , Güntekin B ((2019) ) The difference of mild cognitive impairment in Parkinson’s disease from amnestic mild cognitive impairment: Deeper power decrement and no phase-locking in visual event-related responses. Int J Psychophysiol 139: , 48–58. |
[125] | Nguyen LT , Mudar RA , Chiang HS , Schneider JM , Maguire MJ , Kraut MA , Hart J Jr ((2017) ) Theta and alpha alterations in amnestic mild cognitive impairment in semantic Go/NoGo tasks. Front Aging Neurosci 9: , 160. |
[126] | van der Hiele K , Vein AA , Reijntjes RH , Westendorp RG , Bollen EL , van Buchem MA , van Dijk JG , Middelkoop HA ((2007) ) EEG correlates in the spectrum of cognitive decline. Clin Neurophysiol 118: , 1931–1939. |
[127] | Prieto del Val L , Cantero JL , Atienza M ((2016) ) Atrophy of amygdala and abnormal memory-related alpha oscillations over posterior cingulate predict conversion to Alzheimer’s disease. Sci Rep 6: , 31859. |
[128] | Mazaheri A , Segaert K , Olichney J , Yang JC , Niu YQ , Shapiro K , Bowman H ((2018) ) EEG oscillations during word processing predict MCI conversion to Alzheimer’s disease. Neuroimage Clin 17: , 188–197. |
[129] | Osipova D , Ahveninen J , Jensen O , Ylikoski A , Pekkonen E ((2005) ) Altered generation of spontaneous oscillations in Alzheimer’s disease. Neuroimage 27: , 835–841. |
[130] | Barzegaran E , Vildavski VY , Knyazeva MG ((2017) ) Fine structure of posterior alpha rhythm in human EEG: Frequency components, their cortical sources, and temporal behavior. Sci Rep 7: , 8249. |
[131] | Garcés P , Vicente R , Wibral M , Pineda Pardo JA , López ME , Aurtenetxe S , Marcos A , de Andrés ME , Yus M , Sancho M , Maestú F ((2013) ) Brain-wide slowing of spontaneous alpha rhythms in mild cognitive impairment. Front Aging Neurosci 5: , 100. |
[132] | Kwak YT ((2006) ) Quantitative EEG findings in different stages of Alzheimer’s disease. J Clin Neurophysiol 23: , 457–462. |
[133] | Clark CR , Veltmeyer MD , Hamilton RJ , Simms E , Paul R , Hermens D , Gordon E ((2004) ) Spontaneous alpha peak frequency predicts working memory performance across the age span. Int J Psychophysiol 53: , 1–9. |
[134] | Ishii R , Canuet L , Kurimoto R , Ikezawa K , Aoki Y , Azechi M , Takahashi H , Nakahachi T , Iwase M , Kazui H , Takeda M ((2010) ) Frontal shift of posterior alpha activity is correlated with cognitive impairment in early Alzheimer’s disease: A magnetoencephalography–beamformer study. Psychogeriatrics 10: , 138–43. |
[135] | Nimmrich V , Draguhn A , Axmacher N ((2015) ) Neuronal network oscillations in neurodegenerative diseases. Neuromolecular Med 17: , 270–284. |
[136] | Chan F , Lax NZ , Davies CH , Turnbull DM , Cunningham MO ((2016) ) Neuronal oscillations: A physiological correlate for targeting mitochondrial dysfunction in neurodegenerative diseases? Neuropharmacology 102: , 48–58. |
[137] | Rossini PM , Rossi S , Babiloni C , Polich J ((2007) ) Clinical neurophysiology of aging brain: From normal aging to neurodegeneration. Prog Neurobiol 83: , 375–400. |
[138] | Assenza G , Capone F , di Biase L , Ferreri F , Florio L , Guerra A , Marano M , Paolucci M , Ranieri F , Salomone G , Tombini M ((2017) ) Oscillatory activities in neurological disorders of elderly: Biomarkers to target for neuromodulation. Front Aging Neurosci 9: , 189. |
[139] | Goldman RI , Stern JM , Engel J Jr , Cohen MS ((2002) ) Simultaneous EEG and fMRI of the alpha rhythm. Neuroreport 13: , 2487–2492. |
[140] | Laufs H , Kleinschmidt A , Beyerle A , Eger E , Salek-Haddadi A , Preibisch C , Krakow K ((2003) ) EEG-correlated fMRI of human alpha activity. Neuroimage 19: , 1463–1476. |
[141] | Sauseng P , Klimesch W , Gerloff C , Hummel FC ((2009) ) Spontaneous locally restricted EEG alpha activity determines cortical excitability in the motor cortex. Neuropsychologia 47: , 284–288. |
[142] | Pfurtscheller G , Stancak A Jr , Neuper C ((1996) ) Event-related synchronization (ERS) in the alpha band—an electrophysiological correlate of cortical idling: A review. Int J Psychophysiol 24: , 39–46. |
[143] | Sadaghiani S , Kleinschmidt A ((2016) ) Brain networks and α-oscillations: Structural and functional foundations of cognitive control. Trends Cogn Sci 20: , 805–817. |
[144] | Klimesch W ((2012) ) Alpha-band oscillations, attention, and controlled access to stored information. Trends Cogn Sci 16: , 606–617. |
[145] | Suffczynski P , Kalitzin S , Pfurtscheller G , Da Silva FL ((2001) ) Computational model of thalamo-cortical networks: Dynamical control of alpha rhythms in relation to focal attention. Int J Psychophysiol 43: , 25–40. |
[146] | Lopes da Silva FH , Vos JE , Mooibroek J , Rotterdam AV ((1980) ) Relative contributions of intracortical and thalamo-cortical processes in the generation of alpha rhythms, revealed by partial coherence analysis. Electroencephalogr Clin Neurophysiol 50: , 449–456. |
[147] | Hindriks R , van Putten MJ ((2013) ) Thalamo-cortical mechanisms underlying changes in amplitude and frequency of human alpha oscillations. Neuroimage 70: , 150–163. |
[148] | Vijayan S , Kopell NJ ((2012) ) Thalamic model of awake alpha oscillations and implications for stimulus processing. Proc Natl Acad Sci U S A 109: , 18553–18558. |
[149] | Lörincz ML , Crunelli V , Hughes SW ((2008) ) Cellular dynamics of cholinergically induced α (8–13 Hz) rhythms in sensory thalamic nuclei In Vitro. J Neurosci 28: , 660–671. |
[150] | Eckart C , Woźniak-Kwaśniewska A , Herweg NA , Fuentemilla L , Bunzeck N ((2016) ) Acetylcholine modulates human working memory and subsequent familiarity based recognition via alpha oscillations. Neuroimage 137: , 61–69. |
[151] | Hampel H , Mesulam MM , Cuello AC , Farlow MR , Giacobini E , Grossberg GT , Khachaturian AS , Vergallo A , Cavedo E , Snyder PJ , Khachaturian ZS ((2018) ) The cholinergic system in the pathophysiology and treatment of Alzheimer’s disease. Brain 141: , 1917–1933. |
[152] | Zanardi A , Leo G , Biagini G , Zoli M ((2002) ) Nicotine and neurodegeneration in ageing. Toxicol Lett 127: , 207–215. |
[153] | O’Neill MJ , Murray TK , Lakics V , Visanji NP , Duty S . The role of neuronal nicotinic acetylcholine receptors in acute and chronic neurodegeneration. CNS Neurol Disord Drug Targets 1: , 399–411. |
[154] | Tata AM , Velluto L , D’Angelo C , Reale M ((2014) ) Cholinergic system dysfunction and neurodegenerative diseases: Cause or effect? CNS Neurol Disord Drug Targets 13: , 1294–1303. |
[155] | Holzgrabe U , Kapková P , Alptüzün V , Scheiber J , Kugelmann E ((2007) ) Targeting acetylcholinesterase to treat neurodegeneration. Expert Opin Ther Targets 11: , 161–179. |
[156] | Francis PT , Perry EK ((2007) ) Cholinergic and other neurotransmitter mechanisms in Parkinson’s disease, Parkinson’s disease dementia, and dementia with Lewy bodies. Mov Disord 22: , S351–S357. |
[157] | Murley AG , Rowe JB ((2018) ) Neurotransmitter deficits from frontotemporal lobar degeneration. Brain 141: , 1263–1285. |
[158] | Haense C , Kalbe E , Herholz K , Hohmann C , Neumaier B , Krais R , Heiss WD ((2012) ) Cholinergic system function and cognition in mild cognitive impairment. Neurobiol Aging 33: , 867–877. |
[159] | Sabri O , Kendziorra K , Wolf H , Gertz HJ , Brust P ((2008) ) Acetylcholine receptors in dementia and mild cognitive impairment. Eur J Nucl Med Mol Imaging 35: , 30–45. |
[160] | Kendziorra K , Wolf H , Meyer PM , Barthel H , Hesse S , Becker GA , Luthardt J , Schildan A , Patt M , Sorger D , Seese A ((2011) ) Decreased cerebral α4β2* nicotinic acetylcholine receptor availability in patients with mild cognitive impairment and Alzheimer’s disease assessed with positron emission tomography. Eur J Nucl Med Mol Imaging 38: , 515–525. |
[161] | Herholz K , Weisenbach S , Kalbe E , Diederich NJ , Heiss WD ((2005) ) Cerebral acetylcholine esterase activity in mild cognitive impairment. Neuroreport 16: , 1431–1434. |
[162] | Babiloni C , Del Percio C , Bordet R , Bourriez JL , Bentivoglio M , Payoux P , Derambure P , Dix S , Infarinato F , Lizio R , Triggiani AI ((2013) ) Effects of acetylcholinesterase inhibitors and memantine on resting-state electroencephalographic rhythms in Alzheimer’s disease patients. Clin Neurophysiol 124: , 837–850. |
[163] | Bosboom JL , Stoffers D , Stam CJ , Berendse HW , Wolters EC ((2009) ) Cholinergic modulation of MEG resting-state oscillatory activity in Parkinson’s disease related dementia. Clin Neurophysiol 120: , 910–915. |
[164] | Fogelson N , Kogan E , Korczyn AD , Giladi N , Shabtai H , Neufeld MY ((2003) ) Effects of rivastigmine on the quantitative EEG in demented Parkinsonian patients. Acta Neurol Scand 107: , 252–255. |
[165] | Saunders NL , Summers MJ ((2011) ) Longitudinal deficits to attention, executive, and working memory in subtypes of mild cognitive impairment.. Neuropsychology 25: , 237–248. |
[166] | Klimesch W , Sauseng P , Hanslmayr S ((2007) ) EEG alpha oscillations: The inhibition–timing hypothesis. Brain Res Rev 53: , 63–88. |
[167] | Brier MR , Thomas JB , Ances BM ((2014) ) Network dysfunction in Alzheimer’s disease: Refining the disconnection hypothesis. Brain Connect 4: , 299–311. |
[168] | Delbeuck X , van der Linden M , Collette F ((2003) ) Alzheimer’s disease as a disconnection syndrome? Neuropsychol Rev 13: , 79–92. |
[169] | Pievani M , de Haan W , Wu T , Seeley WW , Frisoni GB ((2011) ) Functional network disruption in the degenerative dementias. Lancet Neurol 10: , 829–843. |
[170] | Buckner RL , Snyder AZ , Shannon BJ , LaRossa G , Sachs R , Fotenos AF , Sheline YI , Klunk WE , Mathis CA , Morris JC , Mintun MA ((2005) ) Molecular, structural, and functional characterization of Alzheimer’s disease: Evidence for a relationship between default activity, amyloid, and memory. J Neurosci 25: , 7709–7717. |
[171] | Yan H , Zhang Y , Chen H , Wang Y , Liu Y ((2013) ) Altered effective connectivity of the default mode network in resting-state amnestic type mild cognitive impairment. J Int Neuropsychol Soc 19: , 400–409. |
[172] | Hillary FG , Roman CA , Venkatesan U , Rajtmajer SM , Bajo R , Castellanos ND ((2015) ) Hyperconnectivity is a fundamental response to neurological disruption. Neuropsychology 29: , 59–75. |
[173] | Bai F , Watson DR , Yu H , Shi Y , Yuan Y , Zhang Z ((2009) ) Abnormal resting-state functional connectivity of posterior cingulate cortex in amnestic type mild cognitive impairment. Brain Res 1302: , 167–174. |
[174] | Gardini S , Venneri A , Sambataro F , Cuetos F , Fasano F , Marchi M , Crisi G , Caffarra P ((2015) ) Increased functional connectivity in the default mode network in mild cognitive impairment: A maladaptive compensatory mechanism associated with poor semantic memory performance. J Alzheimers Dis 45: , 457–470. |
[175] | Zhang HY , Wang SJ , Liu B , Ma ZL , Yang M , Zhang ZJ , Teng GJ ((2010) ) Resting brain connectivity: Changes during the progress of Alzheimer disease. Radiology 256: , 598–606. |
[176] | Zhou J , Greicius MD , Gennatas ED , Growdon ME , Jang JY , Rabinovici GD , Kramer JH , Weiner M , Miller BL , Seeley WW ((2010) ) Divergent network connectivity changes in behavioral variant frontotemporal dementia and Alzheimer’s disease. Brain 133: , 1352–136. |
[177] | Qi Z , Wu X , Wang Z , Zhang N , Dong H , Yao L , Li K ((2010) ) Impairment and compensation coexist in amnestic MCI default mode network. Neuroimage 50: , 48–55. |
[178] | Sterne JA , Sutton AJ , Ioannidis JP , Terrin N , Jones DR , Lau J , Carpenter J , Rücker G , Harbord RM , Schmid CH , Tetzlaff J ((2011) ) Recommendations for examining and interpreting funnel plot asymmetry in meta-analyses of randomised controlled trials. BMJ 343: , d4002. |
[179] | Borenstein M , Hedges LV , Higgins JP , Rothstein HR ((2010) ) A basic introduction to fixed-effect and random-effects models for meta-analysis. Res Synth Methods 1: , 97–111. |
[180] | Higgins JPT , Green S ((2011) ) Cochrane Handbook for Systematic Reviews of Interventions Version 5.1.0. The Cochrane Collaboration, https://www.handbook.cochrane.org. |
[181] | Riley RD , Higgins JP , Deeks JJ ((2011) ) Interpretation of random effects meta-analyses. BMJ 342: , 964–967. |
[182] | Cassani R , Estarellas M , San-Martin R , Fraga FJ , Falk TH ((2018) ) Systematic review on resting-state EEG for Alzheimer’s disease diagnosis and progression assessment. Dis Markers 2018: , 5174815. |
[183] | López ME , Cuesta P , Garcés P , Castellanos PN , Aurtenetxe S , Bajo R , Marcos A , Delgado ML , Montejo P , López-Pantoja JL , Maestú F ((2014) ) MEG spectral analysis in subtypes of mild cognitive impairment. Age 36: , 9624. |
[184] | Brambati SM , Belleville S , Kergoat MJ , Chayer C , Gauthier S , Joubert S ((2009) ) Single-and multiple-domain amnestic mild cognitive impairment: Two sides of the same coin. Dement Geriatr Cogn Disord 28: , 541–549. |
[185] | Tabert MH , Manly JJ , Liu X , Pelton GH , Rosenblum S , Jacobs M , Zamora D , Goodkind M , Bell K , Stern Y , Devanand DP ((2006) ) Neuropsychological prediction of conversion to Alzheimer disease in patients with mild cognitive impairment. Arch Gen Psychiatry 63: , 916–924. |
[186] | Koepsell TD , Monsell SE ((2012) ) Reversion from mild cognitive impairment to normal or near-normal cognition: Risk factors and prognosis. Neurology 79: , 1591–1598. |
[187] | Cantero JL , Atienza M , Salas RM ((2002) ) Human alpha oscillations in wakefulness, drowsiness period, and REM sleep: Different electroencephalographic phenomena within the alpha band. Neurophysiol Clin 32: , 54–71. |
[188] | Nyhus E , Curran T ((2010) ) Functional role of gamma and theta oscillations in episodic memory. Neurosci Biobehav Rev 34: , 1023–1035. |
[189] | Sauseng P , Griesmayr B , Freunberger R , Klimesch W ((2010) ) Control mechanisms in working memory: A possible function of EEG theta oscillations. Neurosci Biobehav Rev 34: , 1015–1022. |
[190] | Lisman J ((2010) ) Working memory: The importance of theta and gamma oscillations. Curr Biol 20: , R490–R492. |
[191] | Goodman MS , Kumar S , Zomorrodi R , Ghazala Z , Cheam AS , Barr MS , Daskalakis ZJ , Blumberger DM , Fischer C , Flint A , Mah L ((2018) ) Theta-gamma coupling and working memory in Alzheimer’s dementia and mild cognitive impairment. Front Aging Neurosci 10: , 101. |
[192] | Cummins TD , Broughton M , Finnigan S ((2008) ) Theta oscillations are affected by amnestic mild cognitive impairment and cognitive load. Int J Psychophysiol 70: , 75–81. |
[193] | Caravaglios G , Muscoso EG , Di Maria G , Costanzo E ((2013) ) Theta responses are abnormal in mild cognitive impairment: Evidence from analysis of theta event-related synchronization during a temporal expectancy task. J Neural Transm 120: , 1093–1107. |
[194] | Park JY , Lee KS , An SK , Lee J , Kim JJ , Kim KH , Namkoong K ((2012) ) Gamma oscillatory activity in relation to memory ability in older adults. Int J Psychophysiol 86: , 58–65. |
[195] | Deiber MP , Ibañez V , Missonnier P , Herrmann F , Fazio-Costa L , Gold G , Giannakopoulos P ((2009) ) Abnormal-induced theta activity supports early directed-attention network deficits in progressive MCI. Neurobiol Aging 30: , 1444–1452. |
[196] | Missonnier P , Gold G , Herrmann FR , Fazio-Costa L , Michel JP , Deiber MP , Michon A , Giannakopoulos P ((2006) ) Decreased theta event-related synchronization during working memory activation is associated with progressive mild cognitive impairment. Dement Geriatr Cogn Disord 22: , 250–259. |
[197] | Moretti DV , Frisoni GB , Fracassi C , Pievani M , Geroldi C , Binetti G , Rossini PM , Zanetti O ((2011) ) MCI patients’ EEGs show group differences between those who progress and those who do not progress to AD. Neurobiol Aging 32: , 563–571. |
[198] | Yener GG , Emek-Savaş DD , Güntekin B , Başar E ((2014) ) The visual cognitive network, but not the visual sensory network, is affected in amnestic mild cognitive impairment: A study of brain oscillatory responses. Brain Res 1585: , 141–149. |
[199] | Yener GG , Emek-Savaş DD , Lizio R , Çavuşoğlu B , Carducci F , Ada E , Güntekin B , Babiloni CC , Başar E ((2016) ) Frontal delta event-related oscillations relate to frontal volume in mild cognitive impairment and healthy controls. Int J Psychophysiol 103: , 110–117. |
[200] | Güntekin B , Hanoğlu L , Güner D , Yılmaz NH , Çadırcı F , Mantar N , Aktürk T , Emek-Savaş DD , Özer FF , Yener G , Başar E ((2018) ) Cognitive impairment in parkinson’s disease is reflected with gradual decrease of EEG delta responses during auditory discrimination. Front Psychol 9: , 170. |
[201] | Güntekin B , Emek-Savaş DD , Kurt P , Yener GG , Başar E ((2013) ) Beta oscillatory responses in healthy subjects and subjects with mild cognitive impairment. Neuroimage Clin 3: , 39–46. |
[202] | Caravaglios G , Castro G , Muscoso EG , Crivelli D , Balconi M ((2018) ) Beta responses in healthy elderly and in patients with amnestic mild cognitive impairment during a task of temporal orientation of attention. Clin EEG Neurosci 49: , 258–271. |
[203] | GonÇalves SI , De Munck C , Pouwels PJ , Schoonhoven R , Kuijer JP , Maurits NM , Hoogduin JM , Van Someren EJ , Heethaar RM , Da Silva FL ((2006) ) Correlating the alpha rhythm to BOLD using simultaneous EEG/fMRI: Inter-subject variability. Neuroimage 30: , 203–213. |
[204] | McKhann G , Drachman D , Folstein M , Katzman R , Price D , Stadlan EM ((1984) ) Clinical diagnosis of Alzheimer’s disease: Report of the NINCDS-ADRDA Work Group* under the auspices of Department of Health and Human Services Task Force on Alzheimer’s Disease. Neurology 34: , 939–944. |
[205] | McKhann GM , Knopman DS , Chertkow H , Hyman BT , Jack CR Jr , Kawas CH , Klunk WE , Koroshetz WJ , Manly JJ , Mayeux R , Mohs RC ((2011) ) The diagnosis of dementia due to Alzheimer’s disease: Recommendations from the National Institute on Aging-Alzheimer’s Association workgroups on diagnostic guidelines for Alzheimer’s disease. Alzheimers Dement 7: , 263–269. |
[206] | Scrascia F , Curcio G , Ursini F , Trotta L , Quintiliani L , Migliore S , Altamura C , Pitocco F , Altavilla R , Melgari JM , Quattrocchi CC ((2014) ) Relationship among diffusion tensor imaging, EEG activity, and cognitive status in mild cognitive impairment and Alzheimer’s disease patients. J Alzheimers Dis 38: , 939–950. |
[207] | Hsiao FJ , Chen WT , Wang YJ , Yan SH , Lin YY ((2014) ) Altered source-based EEG coherence of resting-state sensorimotor network in early-stage Alzheimer’s disease compared to mild cognitive impairment. Neurosci Lett 558: , 47–52. |
[208] | Portet F , Ousset PJ , Visser PJ , Frisoni GB , Nobili F , Scheltens P , Vellas B , Touchon J ; MCI Working Group of the European Consortium on Alzheimer’s Disease (EADC) ((2006) ) Mild cognitive impairment (MCI) in medical practice: A critical review of the concept and new diagnostic procedure. Report of the MCI Working Group of the European Consortium on Alzheimer’s Disease. J Neurol Neurosurg Psychiatry 77: , 714–718. |
[209] | Ruiz-Gómez SJ , Hornero R , Poza J , Maturana-Candelas A , Pinto N , Gómez C ((2019) ) Computational modeling of the effects of EEG volume conduction on functional connectivity metrics. Application to Alzheimer’s disease continuum. J Neural Eng 16: , 066019. |
[210] | Emre M , Aarsland D , Brown R , Burn DJ , Duyckaerts C , Mizuno Y , Broe GA , Cummings J , Dickson DW , Gauthier S , Goldman J ((2007) ) Clinical diagnostic criteria for dementia associated with Parkinson’s disease. Mov Disord 22: , 1689–1707. |
[211] | McKeith IG , Dickson DW , Lowe J , Emre M , O’brien JT , Feldman H , Cummings J , Duda JE , Lippa C , Perry EK , Aarsland D ((2005) ) Diagnosis and management of dementia with Lewy bodies: Third report of the DLB Consortium. Neurology 65: , 1863–1872. |
[212] | McKeith IG , Boeve BF , Dickson DW , Halliday G , Taylor JP , Weintraub D , Aarsland D , Galvin J , Attems J , Ballard CG , Bayston A ((2017) ) Diagnosis and management of dementia with Lewy bodies: Fourth consensus report of the DLB Consortium. Neurology 89: , 88–100. |
[213] | Neary D , Snowden JS , Gustafson L , Passant U , Stuss D , Black SA , Freedman M , Kertesz A , Robert PH , Albert M , Boone K ((1998) ) Frontotemporal lobar degeneration: A consensus on clinical diagnostic criteria. Neurology 51: , 1546–1554. |
[214] | Gorno-Tempini ML , Hillis AE , Weintraub S , Kertesz A , Mendez M , Cappa SF , Ogar JM , Rohrer JD , Black S , Boeve BF , Manes F ((2011) ) Classification of primary progressive aphasia and its variants. Neurology 76: , 1006–1014. |
[215] | Rascovsky K , Hodges JR , Knopman D , Mendez MF , Kramer JH , Neuhaus J , Van Swieten JC , Seelaar H , Dopper EG , Onyike CU , Hillis AE ((2011) ) Sensitivity of revised diagnostic criteria for the behavioural variant of frontotemporal dementia. Brain 134: , 2456–2477. |
[216] | Petersen RC , Smith GE , Ivnik RJ , Tangalos EG , Schaid DJ , Thibodeau SN , Kokmen E , Waring SC , Kurland LT ((1995) ) Apolipoprotein E status as a predictor of the development of Alzheimer’s disease in memory-impaired individuals. JAMA 273: , 1274–1278. |
[217] | Petersen RC , Roberts RO , Knopman DS , Boeve BF , Geda YE , Ivnik RJ , Smith GE , Jack CR ((2009) ) Mild cognitive impairment: Ten years later. Arch Neurol 66: , 1447–1455. |
[218] | Petersen RC , Morris JC ((2005) ) Mild cognitive impairment as a clinical entity and treatment target. Arch Neurol 62: , 1160–1163. |

