
Predicting On-Road Driving Skills, Fitness to Drive, and Prospective Accident Risk in Older Drivers and Drivers with Mild Cognitive Impairment: The Importance of Non-Cognitive Risk Factors
Abstract
Background:
On-road driving behavior can be impaired in older drivers and particularly in drivers with mild cognitive impairment (MCI).
Objective:
To determine whether cognitive and non-cognitive risk factors for driving safety may allow an accurate and economic prediction of on-road driving skills, fitness to drive, and prospective accident risk in healthy older drivers and drivers with MCI, we examined a representative combined sample of older drivers with and without MCI (N = 74) in an observational on-road study. In particular, we examined whether non-cognitive risk factors improve predictive accuracy provided by cognitive factors alone.
Methods:
Multiple and logistic hierarchical regression analyses were utilized to predict different driving outcomes. In all regression models, we included cognitive predictors alone in a first step and added non-cognitive predictors in a second step.
Results:
Results revealed that the combination of cognitive and non-cognitive risk factors significantly predicted driving skills (R2adjusted = 0.30) and fitness to drive (81.2% accuracy) as well as the number (R2adjusted = 0.21) and occurrence (88.3% accuracy) of prospective minor at-fault accidents within the next 12 months. In all analyses, the inclusion of non-cognitive risk factors led to a significant increase of explained variance in the different outcome variables.
Conclusion:
Our findings suggest that a combination of the most robust cognitive and non-cognitive risk factors may allow an economic and accurate prediction of on-road driving performance and prospective accident risk in healthy older drivers and drivers with MCI. Therefore, non-cognitive risk factors appear to play an important role.
INTRODUCTION
Healthy older drivers
Aging is associated with increasing cognitive, motor, and sensory impairments. These impairments can affect various domains, some of which are closely related to driving skills. As a result, driving skills also decline with increasing age as being reflected by impaired on-road driving performance [1, 2] and accident rates [3] in older compared to middle-aged drivers.
Drivers with dementia and mild cognitive impairment
The problems described above become more significant in the case of dementia. Nevertheless, more than 40% of people with dementia still drive, with an accident risk being 2–5 times higher than in healthy older drivers [4]. Nearly half of the patients have experienced one or more crashes within the three years before diagnosis [5]. Meta-analytical evidence suggests a more than 10-fold increased risk in drivers with dementia to fail an on-road assessment [6]. While there is consensus that people with severe or moderate dementia are no longer fit to drive [7], drivers with mild dementia (Clinical Dementia Rating (CDR) scores of 0.5 or 1) may still be able to drive under certain circumstances. Dependent on the type of dementia, however, increased accident risk and on-road fail rates are reported even for drivers with mild dementia [8].
Actually, there is evidence for driving difficulties already in the prodromal stage of the disease. This prodromal stage includes a stage called mild cognitive impairment (MCI). In MCI, cognitive impairments are detectable by neuropsychological tests, but do not lead to severely restricted daily routines [9]. For drivers with MCI, results suggest lower safety ratings compared to healthy older drivers in on-road tests [10] and twice as many driving errors in simulated driving [11]. Driving difficulties in MCI are reflected by increased avoidance behavior [12] and driving cessation within 3 years of diagnosis [13]. In a study by Fuermaier and colleagues, a third of these patients failed an on-road assessment [14], compared to 11% of their healthy peers [15].
Assessment of driving fitness
Together, the above reasons indicate that driving can be impaired in healthy older drivers and even more in drivers with MCI. The identification of unfit drivers in these groups is an important goal for several reasons. Besides the safety issues, it offers the chance to preserve or recover driving fitness by individual training programs. Moreover, it provides the basis for an adequate consultation of unfit drivers including the timely organization of possible transport alternatives. In addition, an early detection may facilitate a sensitive guidance of driving cessation to minimize the risk for future psychosocial problems such as reductions in mobility, autonomy, functionality, social participation, or mental health [16–18]. On-road driving assessments are often regarded as the gold standard to evaluate fitness to drive. However, on-road test standardization is limited by the local driving conditions (e.g., weather, traffic, pedestrians). Moreover, on-road tests require appropriate equipment, professional competence, and sufficient human, financial, and time resources exceeding the resources of most clinical care facilities. Hence, neuropsychological tests are often utilized to predict driving fitness in clinical practice. Although several review articles and meta-analyses provided evidence for robust correlations between driving behavior and neuropsychological tests, these tests alone are insufficient to accurately differentiate between fit and unfit drivers. A possible reason for this insufficient diagnostic accuracy is the undervaluation of other, non-cognitive, factors such as driving practice and physical health. Hence, experts increasingly recommend multifactorial approaches [19].
Predictors of driving fitness
Such multifactorial approaches should consider both the most robust cognitive and non-cognitive predictors of practical driving behavior. The former particularly involve attention (e.g., processing speed), executive functions (e.g., cognitive flexibility), and visuospatial skills [20–22]. Meta-analytic data indicate that neuropsychological tests assessing these domains are the best predictors of on-road driving behavior [23–25]. Hird and colleagues, for example, who analyzed the most relevant on-road driving outcomes (driving skills, fitness to drive, crash risk) in healthy older drivers and drivers with MCI or dementia, reported the highest effect sizes for the Trail-Making-Test A and B (TMT-A/B) as well as for maze tasks (all d > 0.6) [26].
Besides these cognitive predictors, there are some robust non-cognitive risk factors, such as advanced age [20, 27, 28], avoidance behavior [19, 29, 30], relatives‘ reports of unsafe driving [19, 31], the number of accidents in the past years [19, 27, 32], and reduced driving practice [19, 33, 34]. Moreover, visual impairments [35–38], impaired cervical spine mobility [20, 39, 40], and other indicators of poor physical health status [20, 28, 41] were reported to be relevant predictors of impaired driving. So far, non-cognitive risk factors have received less attention than cognitive factors in both practice and research, but could probably improve the accuracy of predicting on-road driving performance.
Rationale of the study
The aim of the current work was to develop an accurate, valid, and economic method to predict different driving outcomes in an observational on-road study involving a mixed sample of healthy older drivers and drivers with MCI. Based on the theoretical considerations described above, we postulate that the combination of the most relevant and robust cognitive and non-cognitive risk factors (Table 1) may allow the prediction of on-road driving skills, fitness to drive, and prospective accident risk. In all predictive models, we postulate that the inclusion of non-cognitive risk factors improves the predictive accuracy provided by cognitive factors alone.
Table 1
The most robust evidence-based cognitive and non-cognitive predictors of practical driving behavior in healthy older drivers and drivers with MCI
| Cognitive predictors | Tests | References |
| Psychomotor speed | TMT-A | Hird et al., 2016 [26] |
| Visual scanning | Papandonatos et al., 2015 [25] | |
| Mathias & Lucas, 2009 [21] | ||
| Cognitive flexibility | TMT-B | Hird et al., 2016 [26] |
| Visual scanning | Ball et al., 2006 [23] | |
| Mathias & Lucas, 2009 [21] | ||
| Attention | Maze | Hird et al., 2016 [26] |
| Visuospatial abilities | Snellgrove, 2005 [22] | |
| Planning | Ott et al., 2008 [24] | |
| Anticipation | ||
| Non-cognitive predictors | ||
| Age | Years of age | Kosuge et al., 2017 [27] |
| Anstey et al., 2005 [20] | ||
| Pottgiesser et al., 2012 [28] | ||
| Health status | e.g., diseases, medication | Pottgiesser et al., 2012 [28] |
| Poschadel, 2012 [41] | ||
| Anstey et al., 2005 [20] | ||
| Driving practice | Annual/weekly mileage | Langford et al., 2006 [33] |
| Iverson et al., 2010 [19] | ||
| Piersma et al., 2016 [34] | ||
| Accidents in the past | Number of accidents in the last years | Kosuge et al., 2017 [27] |
| Emerson et al., 2012 [32] | ||
| Iverson et al., 2010 [19] | ||
| External concerns | Relatives' reports of unsafe driving/Passenger feels unsafe | Iverson et al., 2010 [19] |
| Brown et al., 2005 [31] | ||
| Vision | Impaired visual acuity or field of view | Owsley et al., 1998 [38],1999 [35] |
| Ball et al., 1998 [36] | ||
| Bowers et al., 2013 [37] | ||
| Motor skills | Restricted cervical spine mobility | Marottoli et al., 1998 [39] |
| Anstey et al, 2005 [20] | ||
| Mosimann et al., 2012 [40] | ||
| Avoidance behavior | Avoidance of certain traffic situations | Iverson et al., 2010 [19] |
| Baldock et al., 2006 [29] | ||
| Schulz et al., 2019 [30] |
METHODS
Recruitment
Our sample included healthy older drivers and drivers with MCI. Participants were recruited via newspaper and in our memory clinic. All participants joined voluntarily in the study. Before study participation, all participants provided informed written consent. The study protocol was in accordance with the Declaration of Helsinki and approved by the institutional review board of Muenster University. Parts of the subgroup of healthy older drivers participated in a previous study [30].
Inclusion and exclusion criteria
All drivers with MCI met the Peterson criteria of clinical MCI [42], such as cognitive complaints being not normal for age (1.5 standard deviations below population mean), cognitive decline, no dementia, and essentially normal functional activities. Inclusion criteria required a valid drivers’ license, an age of ≥65 years, fluent German language, and active driving within the three months before study participation at least. Exclusion criteria were current diagnoses precluding fitness-to-drive [43], current infections, current mental disorders (i.e., substance abuse, psychosis) as explored by the screening questions from the structured clinical interview for DSM-IV, the intake of medication severely affecting fitness to drive (category III) as identified by the driving under the influence of drugs, alcohol and medicines (DRUID) checklist [44], psychiatric or neurological diagnosis within the last 5 years (healthy older drivers) other than MCI (drivers with MCI), and participation in other on-road studies within the last six months.
Study design
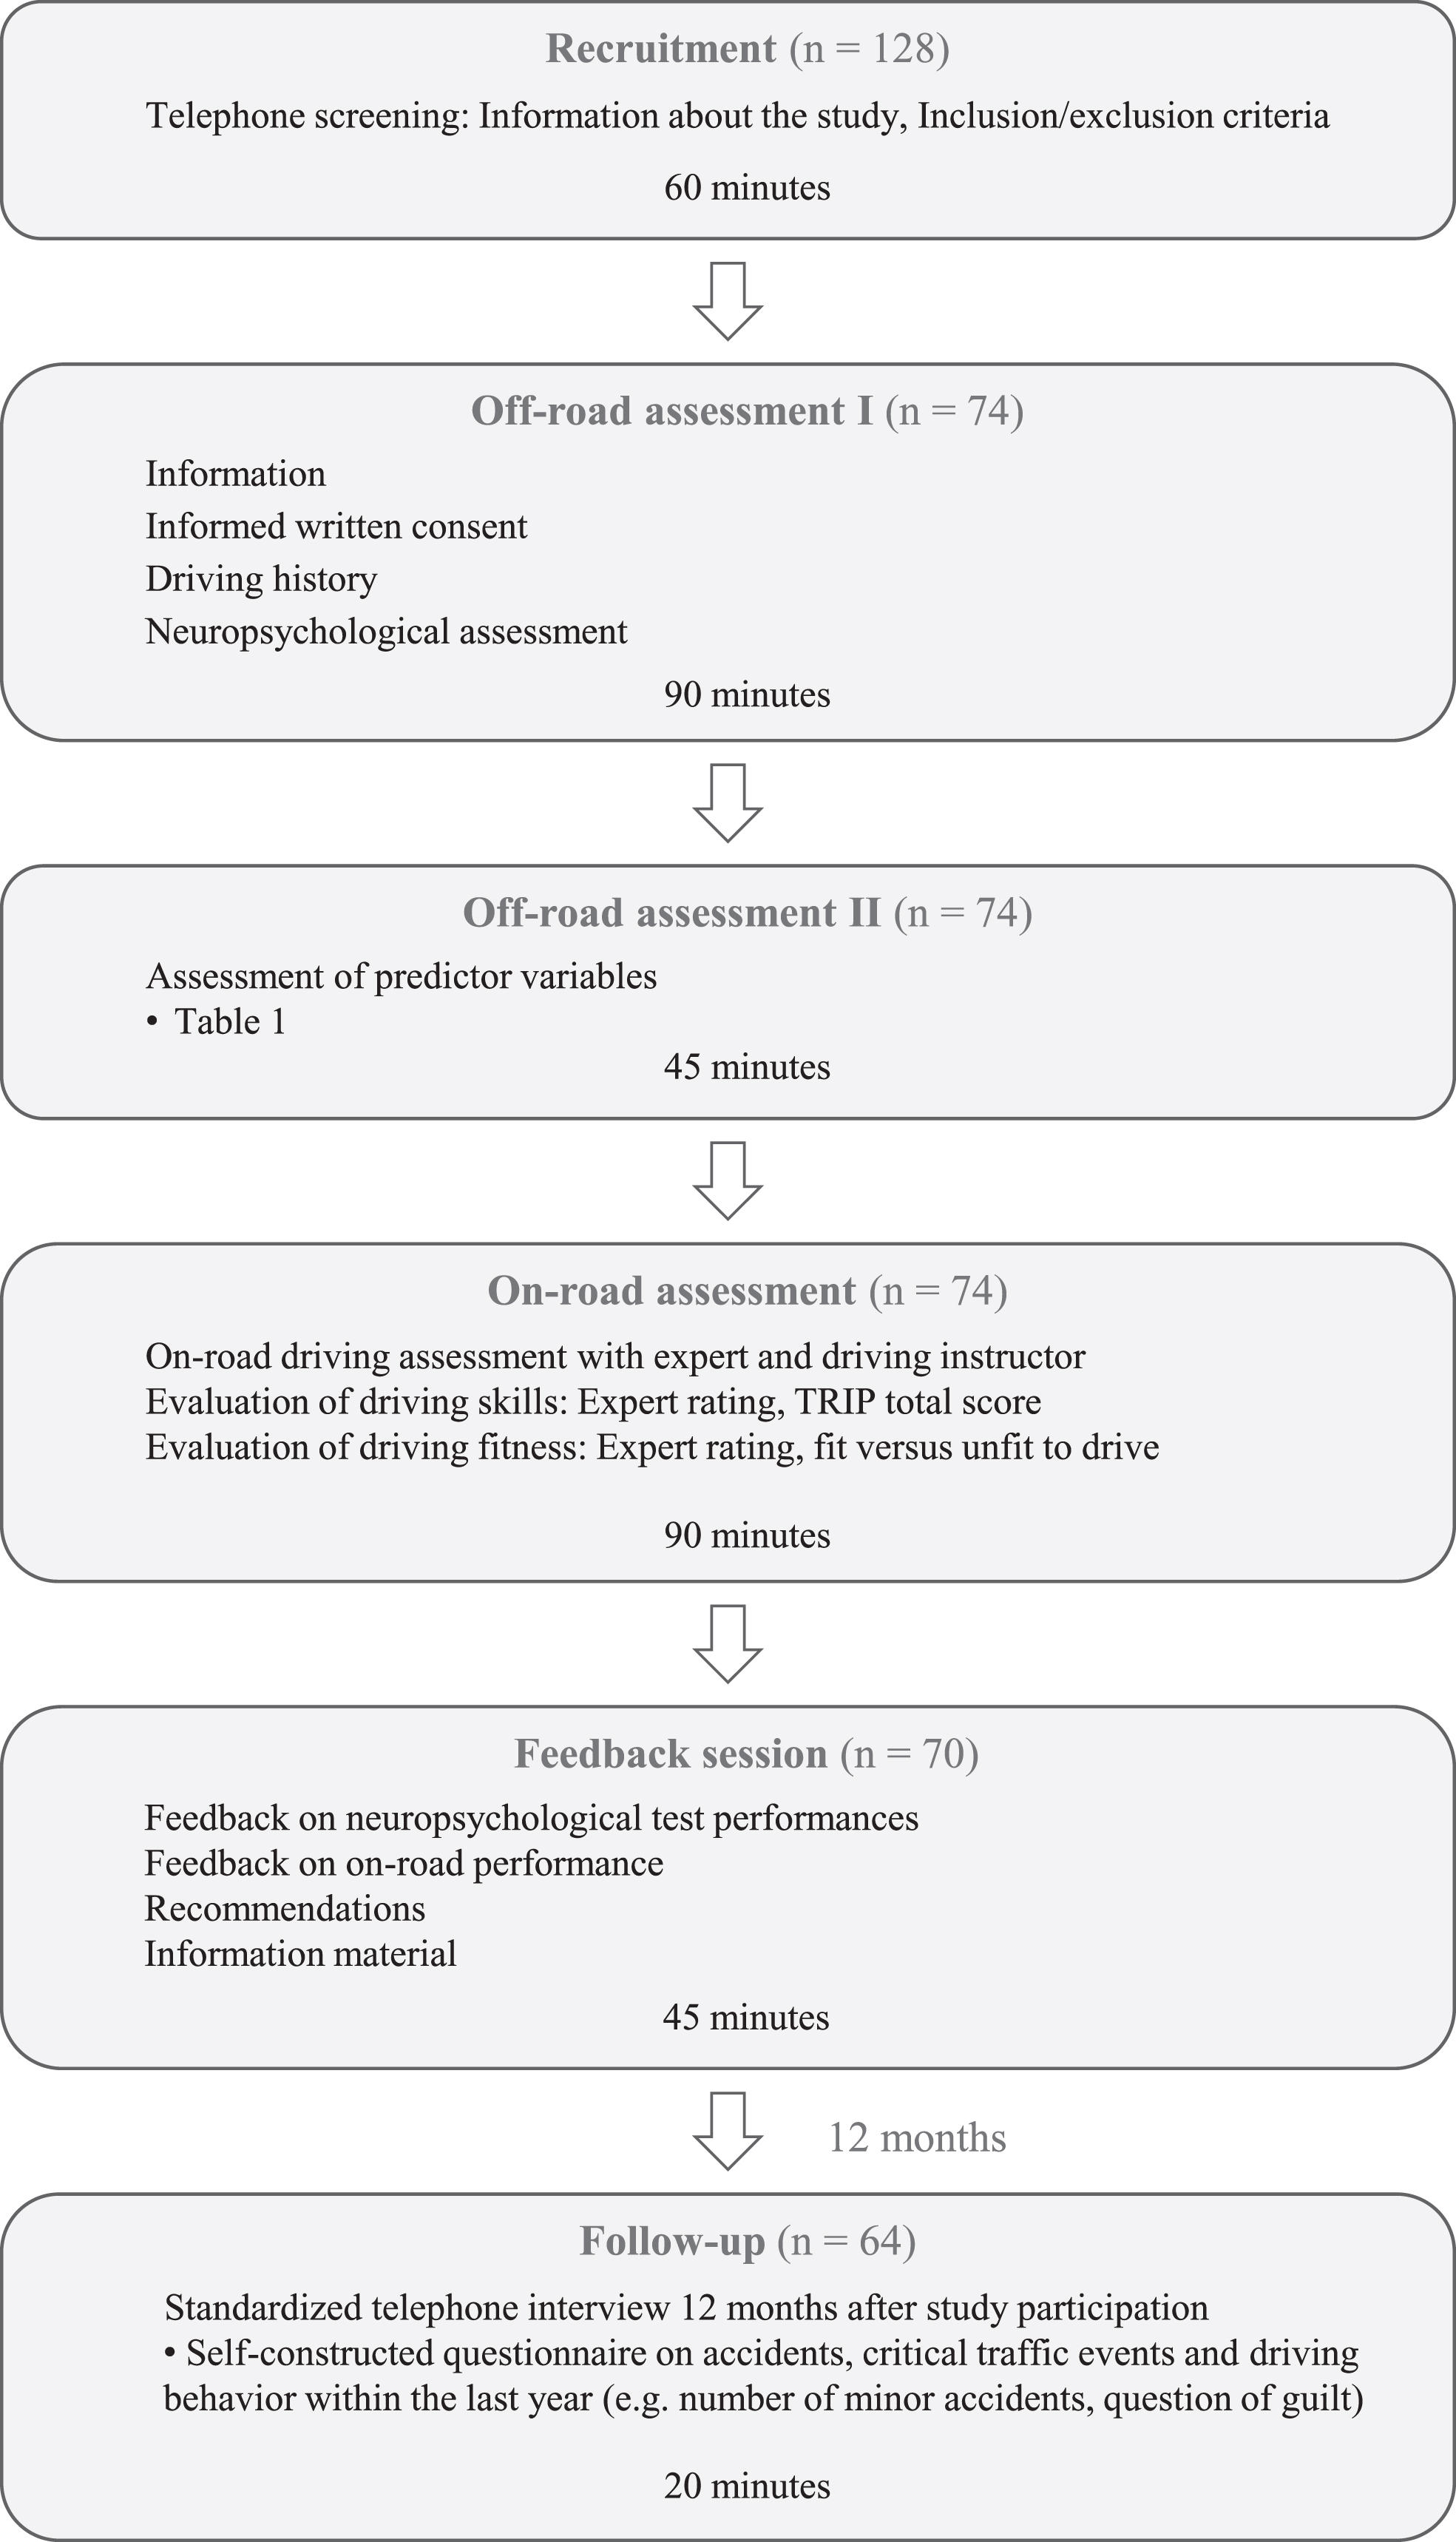
First, we interviewed eligible participants on the telephone to collect basic data and to screen for inclusion and exclusion criteria. In two subsequent off-road sessions, we assessed the predictor variables (Table 1). Moreover, these sessions involved the collection of driving-relevant information and a neuropsychological assessment (next section). During a third session, standardized on-road assessments were conducted. In a 30–45 minute feedback session 14 days later, we informed the participants about their neuropsychological test results and their driving performance as rated by the driving expert (see below). Additionally, feedback sessions involved recommendations provided by the driving expert and the provision of informational material (e.g., basic information about driving fitness, information about transportation alternatives, and contact information of organizations providing driving training or driving assessments). Twelve months after study participation, we interviewed participants on the telephone to collect information about critical traffic events in the meantime. The study design is illustrated in Fig. 1.
Fig. 1
Study design.
Off-road measures
Off-road measures involved the assessment of the different predictor variables (Table 1). Cognitive predictors included TMT-A, TMT-B, and Maze processing time (in seconds). Non-cognitive predictor variables were years of age, number of prescription drugs, annual mileage (in kilometers), self-reported accidents within the last two years (yes/no), external concerns (relatives‘ reports of unsafe driving) (yes/no), impaired uncompensated vision (e.g. visual acuity <60% or visual field <140°) (yes/no), impaired cervical spine mobility (e.g., <45°) (yes/no), and avoidance behavior (total score in a situational avoidance questionnaire [30]). In MCI patients, kind and number of prescription drugs were taken from the patient file in our memory clinic. Kind and number of prescription drugs in healthy older drivers were collected based upon the initial in-depth telephone interview (please see Study design), during which the participants were asked to pick out their medications and read out the names.
Beyond these predictor variables, we utilized additional established neuropsychological tests to specify the cognitive profiles of the participants, to exclude severe cognitive deficits in healthy participants, and to quantify cognitive deficits in drivers MCI (1.5 standard deviations below population mean). Supplementary Table 1 provides an overview of assessed functions and applied tests.
On-road driving skills and fitness to drive
The three most important outcome variables of practical driving behavior are practical driving skills, fitness to drive, and accident risk. While we examined the prospective accident risk by a standardized telephone interview 12 months after study participation (see below), the evaluation of on-road driving skills and fitness to drive based on standardized on-road driving assessments being accompanied by a driving instructor and an approved expert on fitness to drive (German postgraduate professional education for psychologists, so-called “traffic psychologist”). The standardized driving route involved a demanding 18-kilometer track through accident black spots (i.e., accident locations in the last years registered in the city’s official register) with a driving time of about 50 min. The route led through the inner city and an expressway of a German city with 330,000 inhabitants and included numerous complex traffic situations. To ensure maximum driving safety, all participants drove a driving school car that allowed the driving instructor to intervene in emergencies. Depending on their private vehicle use, cars with manual or automatic transmission were available to keep adaptation difficulties to the new vehicle to a minimum. To control for possible effects of traffic density (e.g., traffic jams in the rush hour), driving assessments took place in a constant time window on Thursdays (8:30 am–3:30 pm). Both driving instructor and expert were blinded toward group affiliation (healthy, MCI), health status, demographics, and any off-road measures. During the assessment, the driving instructor in the front passenger seat gave instructions and ensured road safety, while the expert was sitting in the back right of the car and evaluated the participants’ practical driving behavior with the Test Ride for Investigating Practical fitness-to-drive (TRIP) protocol [45, 46]. The TRIP is an established protocol for the evaluation of different competence areas of practical driving behavior and includes 12 scales with a total of 91 items (and additional 6 items with global ratings that we did not use in the current study). Each item was rated by the expert on a 4-point scale as either 1 = insufficient, 2 = doubtful, 3 = sufficient, or 4 = good. The sum score of these ratings served as continuous criterion for practical driving skills. The internal consistency of the TRIP was very high with a Cronbachs’ alpha of 0.99. Neither the starting time of the on-road assessment, nor type of transmission, weather condition (dry versus wet road), or familiarity with the route were significantly associated with the TRIP total score (all ps > 0.05).
Moreover, the expert rated fitness to drive on a 4-point scale with the categories 1 = fit to drive, 2 = fit to drive, but driving training proposed, 3 = not fit to drive, but possibly fit to drive after driving training, or 4 = unfit to drive despite driving training. For further analyses, we recoded this rating into a dichotomous item differentiating between drivers who are currently fit to drive (1 + 2) and drivers who are currently unfit to drive (3 + 4). This rating served as binary criterion for fitness to drive (0 = unfit to drive, 1 = fit to drive). Interrater-reliability between the ratings of expert and driving instructor was high with a Kappa coefficient of k = 0.78 (p < 0.001).
Prospective accident risk
In a standardized telephone interview 12 months after study participation, we applied a self-construc-ted questionnaire on accidents, critical traffic events, and driving behavior within the last year (e.g., number of accidents, question of guilt, personal injuries). Since accidents involving personal injuries did not occur within this period, the number of self-reported minor at-fault accidents (i.e., damage to the car body) during the 12-month follow-up period served as continuous criterion for prospective accident risk. In addition, the occurrence of self-reported minor at-fault accidents served as binary criterion for prospective accident risk (one or more accidents versus no accidents).
Data analyses
Data analyses included descriptive statistics of the total sample and each subgroup (healthy older drivers, drivers with MCI). Due to unequal group sizes, we examined differences between subgroups with non-parametric tests (Mann-Whitney U and χ2 tests, respectively). Correlations between the different outcome variables were analyzed with bivariate Pearson correlations across both sub groups.
Moreover, data analysis included four hierarchical regression models with simultaneous variable entry method. Two of these models were hierarchical multiple regressions. Outcome variables were driving skills (TRIP total score) and the number of minor at-fault accidents during the 12-month follow-up period. Predictor variables were evidence-based cognitive and non-cognitive risk factors for driving safety, as displayed in Table 1 and operationalized as described in the Off-road measures section. In the first step of each analysis, we included the cognitive predictors. In the second step, the non-cognitive predictors were included to determine whether the inclusion of these variables significantly increased (compared to step 1) the amount of explained variance in the outcome variables.
Additionally, we conducted two hierarchical logistic regression models with the same predictors. Outcome variables were fitness to drive (currently fit versus currently unfit to drive) and the occurrence of minor at-fault accidents during the 12-month follow-up period (one or more accidents versus no accidents). Again, we included the cognitive predictors in a first step. In the second step, the non-cognitive predictors were included to examine whether the inclusion of these variables significantly increased overall diagnostic accuracy in differentiating between currently fit and unfit drivers (fitness to drive) and between drivers with and without minor at-fault accidents during the 12-month follow-up period (occurrence of accidents).
Statistical evaluation of the different regression models indicated variance inflation factors between 1.06 and 1.86 with tolerance values between 0.53 and 0.94 indicating limited multicollinearity between the different predictors. Hence, a misinterpretation due to multicollinearity is very unlikely here [47].
In all analyses, we set the critical α at 0.05 using two-tailed tests. To account for missing data, we chose the listwise deletion method. Data were analyzed using IBM SPSS Statistics 25.
RESULTS
Participants
Initially, 102 older drivers and 26 drivers with suspected MCI were screened for eligibility. Out of these 128 possible participants, 35 were immediately excluded due to the intake of category III medication (n = 8), severe daytime sleepiness (n = 2), insufficient somatic health (n = 6), current mental disorders (n = 2), a withdrawal of interest (n = 15), an age of < 60 years (n = 1), or a failed official on-road-assessment prior to the study (n = 1). During the further course of the study, another 19 drivers had to be excluded due to somatic complications (n = 1), fear of the on-road assessment (n = 1), mental health issues (n = 4), a withdrawal of interest (n = 1), suspected dementia (n = 4), or other neurological disorders (n = 2). Furthermore, six healthy older drivers were excluded because they showed very poor neuropsychological test performances, but did not meet the criteria of MCI. Overall, 54 participants (40 healthy older drivers and 14 patients) had to be eliminated from analyses.
The 74 remaining participants involved 62 healthy older drivers and 12 older drivers with MCI. Given an MCI prevalence of 18.9% in the general population [48], the composition of our sample with 16.2% MCI patients appears to be quite representative. The MCI sample included eight drivers with single-domain amnestic MCI, 3 drivers with multi-domain amnestic MCI, and 1 driver with single-domain non-amnestic MCI. None of the drivers with MCI took cholinesterase inhibitors. Ten participants (nine older drivers and one driver with MCI) were not available for the 12-month follow-up interview.
Demographics and driving-related data
Across all participants, 25 of 74 drivers (34%) were classified as currently unfit to drive (Table 2). Sub group comparisons between healthy older drivers and drivers with MCI revealed significantly higher annual mileage (U = 215.5, p = 0.021) and marginally better on-road driving skills (TRIP total score) (U = 258.5, p = 0.096) in healthy older drivers compared to drivers with MCI. Moreover, results revealed a significantly higher proportion of currently unfit drivers (χ2 = 3.86, p = 0.049) in the MCI group compared to the group of healthy older drivers (58% versus 29%). Groups did not differ with respect to sex, age, years of school education, general cognitive status (MMSE score), years of having a driving license and self-reported at-fault accidents during the 12-month follow-up period. Demographic and relevant driving-related data are presented in Table 2.
Table 2
Sample Characteristics
| Healthy | MCI | Total sample | |
| N | 62 | 12 | 74 |
| Sex (female/male) | 22/40 | 5/7 | 27/47 |
| Age (SD/range)1 | 76.9 (5.4) | 80.1 (7.4) | 77.4 (5.8) |
| Age range1 | 67 –91 | 68 –94 | 67 –94 |
| School education (SD)1 | 10.1 (2.0) | 9.2 (1.3) | 10.0 (1.9) |
| School education range1 | 4 –14 | 6 –10 | 4 –14 |
| MMSE (SD) | 28.5 (1.1) | 27.7 (2.2) | 28.4 (1.4) |
| Number of prescription drugs | 2.4 (1.8) | 4.1 (2.5) | 2.7 (2.0) |
| Number of prescription drugs range | 0 –7 | 1 –9 | 0 –9 |
| Annual mileage (SD) in km | 11,159 (7,098) | 6,334 (3,415)* | 10,377 (6,860) |
| Driving license since (SD)1 | 54.4 (6.4) | 54.6 (15.8) | 54.4 (8.3) |
| TRIP total score (SD) | 284.7 (51.7) | 258.6 (49.9)+ | 280.5 (51.9) |
| Currently unfit to drive | 18/62 (29%) | 7/12 (58%)* | 25/74 (34%) |
| Number of minor at-fault accidents during the 12-month follow-up (SD) | 0.25 (0.6) | 0.36 (0.7) | 0.27 (0.6) |
| Number of minor accidents range | 0 –3 | 0 –2 | 0 –3 |
| Drivers with minor at-fault accidents during the 12-month follow-up | 11/53 (21%) | 3/11 (27%) | 14/64 (22%) |
1in years; +p < 0.10; *p < 0.05; SD, standard deviation; MMSE, Mini Mental State Examination; TRIP, Test Ride for Investigating Practical fitness-to-drive protocol; MCI, mild cognitive impairment.
Association between different outcome variables
Correlational analyses revealed a strong positive correlation between on-road driving skills (TRIP total score) and fitness to drive (r = 0.767, p < 0.001). Moreover, driving skills showed moderate inverse correlations with the number (r = –0.381, p = 0.002) and occurrence (r = –0.351, p = 0.005) of self-reported minor at-fault accidents during the 12-month follow-up period. Fitness to drive inversely correlated with number (r = –0.398, p = 0.001) and occurrence (r = –0.377, p = 0.002) of prospective accidents as well. Number and occurrence of accidents showed a strong positive correlation (r = 0.887, p < 0.001).
On-road driving skills
The first step of our analysis (Table 3) involving cognitive predictors for on-road driving skills (TRIP total score), failed to reach statistical sig-nificance (F (3,65) = 1.47, p = 0.232). The inclusion of non-cognitive predictors (F (11,57) = 3.67, p =0.001,
Table 3
Results of the hierarchical multiple regression analyses with driving skills (TRIP total score) as outcome variable, being predicted by the most robust evidence-based cognitive and non-cognitive risk factors in older drivers and drivers with MCI (independent variables)
| On-road driving skills (TRIP total score) | |||
| Model 1 |
| ||
| Cognitive factors | B | β | CI (B) |
| TMT-A1 | –0.16 | –0.05 | –1.20 –0.87 |
| TMT-B1 | 0.04 | 0.04 | –0.22 –0.30 |
| Maze1 | –1.20+ | –0.24+ | –2.56 –0.16 |
| Model 2 |
| ||
| Cognitive factors | B | β | CI (B) |
| TMT-A1 | 0.16 | 0.05 | –0.79 –1.11 |
| TMT-B1 | 0.06 | 0.07 | –0.17 –0.30 |
| Maze1 | –0.75 | –0.15 | –1.97 –0.48 |
| Non-cognitive factors | |||
| Age (y) | –0.51 | –0.06 | –2.83 –1.81 |
| Number of prescription drugs | –3.91 | –0.15 | –9.87 –2.05 |
| Annual mileage (km) | 0.002* | 0.27* | 0.0002 –0.004 |
| Accidents in the last 2 years2 | 4.19 | 0.03 | –28.53 –36.91 |
| External concerns2 | 41.58 | 0.14 | –22.28 –105.44 |
| Impaired vision2 | –16.58 | –0.04 | –115.25 –82.09 |
| Restricted CS mobility2 | –29.37 | –0.15 | –76.31 –17.57 |
| Avoidance behavior (sum score) | –2.50** | –0.38** | –3.99 ––1.01 |
1processing time (seconds); 2yes = 1, no = 0;
Fitness to drive
The first step of our analysis (Table 4) involving cognitive predictors (Table 1) for fitness to drive (currently fit versus currently unfit to drive), allowed a marginally significant prediction of fitness to drive (χ2 = 6.40, p = 0.094) with an overall accuracy of 72.5% and with maze processing time as significant predictor (p = 0.042). The inclusion of non-cognitive predictors (χ2 = 35.86, p < 0.001) led to a significant increase of predictive accuracy to 81.2% (Δ χ2 = 29.46, p < 0.001) with restricted cervical spine mobility (p = 0.034) and avoidance behavior (p = 0.009) as significant predictors and with maze processing time (p = 0.099) and annual mileage (p = 0.096) as marginally significant predictors.
Table 4
Results of the hierarchical logistic regression analyses with driving fitness (currently fit versus currently unfit to drive) as binary outcome variable, being predicted by the most robust evidence-based cognitive and non-cognitive risk factors in older drivers and drivers with MCI (independent variables)
| Fitness to drive (fit = 1 versus unfit = 0) | |||
| Model 1 | Accuracy = 72.5% χ2 = 6.40+ Δ χ2 = 6.40+ | ||
| Cognitive factors | B | OR | CI (OR) |
| TMT-A1 | –0.002 | 0.998 | 0.96 –1.04 |
| TMT-B1 | –0.0003 | 0.005 | 0.99 –1.01 |
| Maze1 | –0.06* | 0.94* | 0.88 –1.00 |
| Model 2 | Accuracy = 81.2 % χ2 = 35.86*** Δ χ2 = 29.46*** | ||
| Cognitive factors | B | OR | CI (OR) |
| TMT-A1 | –0.009 | 0.99 | 0.93 –1.05 |
| TMT-B1 | 0.002 | 1.00 | 0.99 –1.02 |
| Maze1 | –0.084+ | 0.92+ | 0.83 –1.02 |
| Non-cognitive factors | |||
| Age (y) | –0.039 | 0.96 | 0.83 –1.11 |
| Number of prescription drugs | –0.202 | 0.82 | 0.55 –1.22 |
| Annual mileage (km) | 0.00013+ | 1.0001+ | 0.99998 –1.0003 |
| Accidents in the last 2 years2 | 2.24 | 9.34 | 0.54 –161.6 |
| External concerns2 | 21.32 | 1808931630 | 0.00 |
| Impaired vision2 | –18.08 | 1.4122E-8 | 0.00 |
| Restricted CS mobility2 | –3.19* | 0.04* | 0.002 –0.79 |
| Avoidance behavior (sum score) | –0.19** | 0.82** | 0.71 –0.95 |
1processing time (seconds); 2yes = 1, no = 0; Δ χ2 = change in χ2; +p < 0.10; *p < 0.05; **p < 0.01; ***p < 0.001; y, years; km, kilometers; CS, cervical spine; TRIP, Test Ride for Investigating Practical fitness-to-drive protocol; MCI, mild cognitive impairment; B, unstandardized coefficients; OR, odd ratios; CI, confidence interval.
Prospective accident risk
Number of accidents
The first step of our analysis (Table 5) involving cognitive predictors (Table 1) for the number of self-reported minor at-fault accidents during the follow-up, failed to reach statistical significance (F (3,56) =0.53, p = 0.666). The inclusion of non-cognitive predictors (F (11,48) = 2.48, p = 0.016,
Table 5
Results of the hierarchical multiple regression analyses with the number of self-reported minor at-fault accidents during the 12-month follow-up period as outcome variable, being predicted by the most robust evidence-based cognitive and non-cognitive risk factors in older drivers and drivers with MCI (independent variables)
| Number of accidents (during the 12-month follow-up period) | |||
| Model 1 |
| ||
| Cognitive factors | B | β | CI (B) |
| TMT-A1 | 0.005 | 0.12 | –0.01 –0.02 |
| TMT-B1 | –0.002 | –0.17 | –0.01 –0.001 |
| Maze1 | 0.005 | 0.10 | –0.01 –0.02 |
| Model 2 |
| ||
| Cognitive factors | B | β | CI (B) |
| TMT-A1 | 0.002 | 0.06 | –0.01 –0.01 |
| TMT-B1 | –0.001 | –0.15 | –0.004 –0.002 |
| Maze1 | 0.001 | 0.01 | –0.02 –0.02 |
| Non-cognitive factors | |||
| Age (y) | –0.002 | –0.03 | –0.03 –0.03 |
| Number of prescription drugs | 0.07+ | 0.23+ | –0.01 –0.15 |
| Annual mileage (km) | 5.002E-6 | 0.06 | –0.000018 –0.000028 |
| Accidents in the last 2 years2 | –0.05 | –0.03 | –0.45 –0.35 |
| External concerns2 | 0.33 | 0.10 | –0.44 –1.10 |
| Impaired vision2 | 0.01 | 0.002 | –1.20 –1.22 |
| Restricted CS mobility2 | 0.93** | 0.40** | 0.27 –1.58 |
| Avoidance behavior (sum score) | 0.03** | 0.45** | 0.01 –0.05 |
1processing time (seconds); 2yes = 1, no = 0;
Occurrence of accidents
The first step of our analysis (Table 6) involving cognitive predictors (Table 1) for the occurrence of self-reported minor at-fault accidents during the 12-month follow-up period (one or more accidents versus no accidents) did not reach statistical significance (χ2 = 2.36, p = 0.501). The inclusion of non-cognitive predictors (χ2 = 22.66, p = 0.020) led to a significant increase of predictive accuracy to 88.3% (Δ χ2 = 20.30, p = 0.009) with avoidance behavior as significant predictor (p = 0.005).
Table 6
Results of the hierarchical logistic regression analyses with the occurrence of self-reported minor at-fault accidents during the 12-month follow-up period (accidents versus no accidents) as binary outcome variable, being predicted by the most robust evidence-based cognitive and non-cognitive risk factors in older drivers and drivers with MCI (independent variables)
| Occurrence of accidents(during the 12-month follow-up period)2 | |||
| Model 1 | Accuracy = 78.3% χ2 = 2.36 Δ χ2 = 2.36 | ||
| Cognitive factors | B | OR | CI (OR) |
| TMT-A1 | 0.031 | 1.03 | 0.98 –1.08 |
| TMT-B1 | –0.009 | 0.99 | 0.98 –1.01 |
| Maze1 | 0.012 | 1.01 | 0.95 –1.08 |
| Model 2 | Accuracy = 88.3% χ2 = 22.66* Δ χ2 = 20.30** | ||
| Cognitive factors | B | OR | CI (OR) |
| TMT-A1 | 0.041 | 1.04 | 0.96 –1.13 |
| TMT-B1 | –0.015 | 0.99 | 0.96 –1.01 |
| Maze1 | 0.010 | 1.01 | 0.91 –1.12 |
| Non-cognitive factors | |||
| Age (y) | –0.011 | 0.99 | 0.84 –1.17 |
| Number of prescription drugs | 0.326 | 1.39 | 0.86 –2.23 |
| Annual mileage (in km) | –0.000003 | 0.999997 | 0.999860 –1.000134 |
| Accidents in the last 2 years2 | –1.52 | 0.22 | 0.01 –3.77 |
| External concerns2 | 2.36 | 10.63 | 0.03 –4460 |
| Impaired vision2 | 21.56 | 2317324453 | 0.00 |
| Restricted CS mobility2 | 2.15 | 8.55 | 0.39 –189.6 |
| Avoidance behavior (sum score) | 0.184** | 1.20** | 1.06 –1.37 |
1processing time (seconds); 2yes = 1, no = 0; Δ χ2 = change in χ2; +p < 0.10; *p < 0.05; **p < 0.01; ***p < 0.001; y years; km, kilometers; CS, cervical spine; TRIP, Test Ride for Investigating Practical fitness-to-drive protocol; MCI, mild cognitive impairment; B, unstandardized coefficients; OR, odd ratios; CI, confidence interval.
DISCUSSION
The results of the current work indicate that a combination of the most robust cognitive and non-cognitive risk factors for driving safety may allow an economic and accurate prediction of practical driving skills, fitness to drive, and prospective accident risk in a mixed sample of healthy older drivers and drivers with MCI. Therefore, particularly non-cognitive factors as avoidance behavior, driving practice (annual mileage), and somatic health (i.e., cervical spine mobility and number of prescription drugs) appear to be relevant.
Across all participants, the expert rated 34% of the drivers as currently unfit to drive and 66% as currently fit to drive. The proportion of currently unfit drivers was higher in the MCI subgroup (58%) than in the subgroup of healthy older drivers (29%). Noteworthy, fail rates vary across studies. Fuermaier and colleagues, for example, recently reported that 33.3% of drivers with MCI [14] and 11% of healthy older drivers [15] failed an on-road driving assessment. Meta-analytical evidence even suggests fail rates of only 13.6% in drivers with MCI and 1.6% in healthy older drivers [26]. Possible reasons for these inconsistent numbers are that fail rates are strongly dependent on the mean age of the sample, the definition of the criterion, the difficulty of the route, and the expertise of the driving assessor. The meta-analysis of Hird and colleagues [26], for example, involved samples that were younger than the sample of Fuermaier and colleagues and the sample of the current work. Moreover, Fuermaier and colleagues defined a doubtful driving performance as failed on-road test, because these drivers would have lost their driving license if the assessment had been part of an official relicensing procedure [15]. If those doubtful drivers had been classified as currently unfit to drive in the meta-analysis of Hird and colleagues as well, the fail rate of drivers with MCI/very mild Alzheimer’s disease dementia (CDR = 0.5) would rise to 43.5% and the fail rate of healthy older drivers to 20%. Fail rates in our study may have been higher, because the driving route was relatively long (50 minutes) and demanding (along accident black spots). However, the driving instructor and expert provided congruent ratings of fitness to drive. Moreover, expert ratings of driving skills and fitness to drive showed high correlations with each other and moderate correlations with occurrence and number of prospective accidents. Together, these results suggest a reliable and valid evaluation of on-road driving performance in the current work.
Prediction of different on-road driving outcomes
As expected, our results revealed that a combination of the most relevant evidence-based cognitive and non-cognitive risk factors allowed an economical and accurate prediction of on-road driving skills and fitness to drive. With 30% explained variance in the criterion (TRIP total score), our model provided a high effect size for the prediction of on-driving skills. Moreover, the combination of predictors was able to differentiate between currently fit and unfit drivers with an overall accuracy of 81.2%. These results are in line with previous studies reporting that a combination of cognitive, sensory, health, and driving-related variables is able to differentiate between fit and unfit drivers [34, 49–51]. Piersma and colleagues [34], for example, showed that the combination of clinical interviews, neuropsychological data, and driving simulator performance allowed a differentiation between fit and unfit older drivers suffering from Alzheimer’s disease dementia with sensitivity and specificity scores of 96.3% and 89.3%. Obviously, this accuracy rate exceeds the accuracy rate in our study. However, we included predictor variables simultaneously in our prediction model (forced entry method) and selected these variables based upon robust previous findings. Instead, studies reporting a nearly perfect differentiation between fit and unfit drivers often use automatic statistical modeling procedures (e.g., forward or backward entering methods) in which only those variables are included that show the highest correlations with the outcome variables in the same sample. Such automatic modeling procedures might be susceptible to bias (e.g., due to overfitting) [47]. Moreover, a nearly perfect differentiation between fit and unfit drivers requires immense resources and effort. By contrast, our prediction model appears to be very economical, since the assessment of the different predictor variables is both time- and cost-efficient. Of course, the evaluation of these risk factors cannot replace an official on-road assessment, but may certainly provide a first estimation of driving safety if an on-road assessment exceeds clinical resources.
Importantly, the combination of cognitive and non-cognitive risk factors in our study was also associated with the number and occurrence of self-reported minor at-fault accidents within the next 12 months. With 21% explained variance in the criterion, our model accurately predicted the number of prospective accidents (
Cognitive and non-cognitive predictors
In all analyses, the inclusion of non-cognitive risk factors led to a significant increase of explained variance in the different driving outcomes as compared to the prediction based on cognitive factors alone. In fact, cognitive factors appeared not be as predictive of on-road performance and accident risk in healthy older drivers and drivers with MCI as in drivers suffering from dementia [34]. Still, maze task processing time was a marginally significant predictor of driving fitness confirming that cognitive functions such as attention, visuospatial abilities, planning, and anticipation are important cognitive prerequisites to be fit to drive. However, maze task performance was not associated with the other outcome variables (driving skills, prospective accident risk) and neither were the other cognitive parameters in our model (TMT-A/B). Instead, our findings highlight the relevance of non-cognitive risk factors that are often undervalued in clinical practice. Among these non-cognitive factors, particularly avoidance behavior, driving practice (annual mileage), and somatic factors such as cervical spine mobility and general health status (i.e., number of prescription drugs) appear to be highly relevant. These findings are in line with previous results indicating associations of avoidance behavior, driving practice, and somatic health with on-road driving performance [19, 20, 30, 33, 34].
Although the validity of our results was not affected by the problem of multicollinearity between the different predictor variables, the above factors are associated with each other to some extent. This relationship may be reciprocal or even circular [30]: Age-related cognitive, motor, and somatic changes lead to impaired driving skills. Consequently, certain traffic conditions may be avoided leading to a reduction of driving practice (e.g., reduced driving space, range, and/or distance). Reduced driving practice leads to reduced driving skills that again provoke increased avoidance behavior. All of these complex relations must be considered when evaluating fitness to drive in an individual.
Next to increased avoidance behavior and reduced driving practice, restricted cervical spine mobility was found to be a relevant predictor of reduced driving fitness and prospective accident frequency in the current work. These results illustrate the importance of motor functions for driving safety [20, 39, 40], since rapid and flexible head movements facilitate fast and adequate reactions in complex and unexpected traffic situations. For example, drivers with restricted cervical spine mobility might avoid complicated parking processes, which was recently reported to be associated with reduced on-road driving performance [30]. Finally, the number of prescription drugs was a marginally significant predictor of prospective accident frequency, confirming an association between somatic health and on-road driving performance [19, 33, 34].
Limitations and future perspectives
Importantly, the current study has some limitations that may restrict generalizability of the results. For example, the subgroup of drivers with MCI was very small (n = 12). However, given an MCI prevalence of 18.9% in the general population [48], our total sample appears to be quite representative (16.2% drivers with MCI). Furthermore, number and occurrence of accidents during the 12-month follow-up period relied on self-reports. To increase the validity of these results, future studies may involve the analysis of officially registered accidents, if reliable data is available. In Germany, for example, only accidents with personal injuries and severe material damage are officially registered, whereas minor accidents (e.g., accidents with minor damage to the car body, but without personal injury) are often not.
Such matters are commonly negotiated between the different parties and the insurance companies, but without the police. Consequently, there is a huge number of unreported cases. Finally, we analyzed the number and occurrence of minor at-fault accidents here (i.e., crashes just causing damage to the car body). Noteworthy, accidents involving personal injuries are very rare incidents that are difficult to assess during a 12-month observation period. However, even minor driving errors can have serious consequences (e.g., if pedestrians or bicyclists are involved).
Importantly, longitudinal designs involving larger samples and more and longer follow-up periods are needed to be able to draw more valid conclusions about the adequacy of specific cognitive and non-cognitive risk factors in predicting on-road driving performance and future accident risk in healthy older drivers and drivers with MCI. Moreover, future research endeavors may consider additional cognitive and non-cognitive risk factors to further improve predictive accuracy (e.g., Useful Field of View Test, traffic sign comprehension, personality traits, self-judgement).
ACKNOWLEDGMENTS
We gratefully thank the Vistec AG (Olching, Germany) and the DEKRA e.V. (Dresden, Germany) for the support of the on-road assessments.
Authors’ disclosures available online (https://www.j-alz.com/manuscript-disclosures/20-0943r2).
SUPPLEMENTARY MATERIAL
[1] The supplementary material is available in the electronic version of this article: https://dx.doi.org/10.3233/JAD-200943.
REFERENCES
[1] | Anstey KJ , Wood J ((2011) ) Chronological age and age-related cognitive deficits are associated with an increase in multiple types of driving errors in late life. Neuropsychology 25: , 613–621. |
[2] | Kenntner-Mabiala R , Kaussner Y , Hoffmann S , Volk M ((2016) ) Driving performance of elderly drivers in comparison to middle-aged drivers during a representative, standardized driving test in real traffic. ZVS 62: , 73–76. |
[3] | StatistischesBundesamt (2018) Unfälle von Senioren im Straßenverkehr 2017, Wiesbaden. |
[4] | Kim YJ , An H , Kim B , Park YS , Kim KW ((2017) ) An international comparative study on driving regulations on people with dementia. J Alzheimers Dis 56: , 1007–1014. |
[5] | Meuleners LB , Ng J , Chow K , Stevenson M ((2016) ) Motor vehicle crashes and dementia: A population-based study. J Am Geriatr Soc 64: , 1039–1045. |
[6] | Chee JN , Rapoport MJ , Molnar F , Herrmann N , O’Neill D , Marottoli R , Mitchell S , Tant M , Dow J , Ayotte D , Lanctot KL , McFadden R , Taylor JP , Donaghy PC , Olsen K , Classen S , Elzohairy Y , Carr DB ((2017) ) Update on the risk of motor vehicle collision or driving impairment with dementia: A collaborative international systematic review and meta-analysis. Am J Geriatr Psychiatry 25: , 1376–1390. |
[7] | Rapoport MJ , Chee JN , Carr DB , Molnar F , Naglie G , Dow J , Marottoli R , Mitchell S , Tant M , Herrmann N , Lanctot KL , Taylor JP , Donaghy PC , Classen S , O’Neill D ((2018) ) An international approach to enhancing a national guideline on driving and dementia. Curr Psychiatry Rep 20: , 16. |
[8] | Toepper M , Falkenstein M ((2019) ) Driving fitness in different forms of dementia: An update. J Am Geriatr Soc 67: , 2186–2192. |
[9] | Albert MS , DeKosky ST , Dickson D , Dubois B , Feldman HH , Fox NC , Gamst A , Holtzman DM , Jagust WJ , Petersen RC , Snyder PJ , Carrillo MC , Thies B , Phelps CH ((2011) ) The diagnosis of mild cognitive impairment due to Alzheimer’s disease: Recommendations from the National Institute on Aging-Alzheimer’s Association workgroups on diagnostic guidelines for Alzheimer’s disease. Alzheimers Dement 7: , 270–279. |
[10] | Anstey KJ , Eramudugolla R , Chopra S , Price J , Wood JM ((2017) ) Assessment of driving safety in older adults with mild cognitive impairment. J Alzheimers Dis 57: , 1197–1205. |
[11] | Hird MA , Vesely KA , Fischer CE , Graham SJ , Naglie G , Schweizer TA ((2017) ) Investigating simulated driving errors in amnestic single- and multiple-domain mild cognitive impairment. J Alzheimers Dis 56: , 447–452. |
[12] | O’Connor ML , Edwards JD , Bannon Y ((2013) ) Self-rated driving habits among older adults with clinically-defined mild cognitive impairment, clinically-defined dementia, and normal cognition. Accid Anal Prev 61: , 197–202. |
[13] | Connors MH , Ames D , Woodward M , Brodaty H ((2017) ) Mild cognitive impairment and driving cessation: A 3-year longitudinal study. Dement Geriatr Cogn Disord 44: , 63–70. |
[14] | Fuermaier AB , Piersma D , de Waard D , Davidse RJ , de Groot J , Doumen MJ , Bredewoud RA , Claesen R , Lemstra AW , Scheltens P , Vermeeren A , Ponds R , Verhey F , Brouwer WH , Tucha O ((2017) ) Assessing fitness to drive-A validation study on patients with mild cognitive impairment. Traffic Inj Prev 18: , 145–149. |
[15] | Fuermaier AB , Piersma D , de Waard D , Davidse RJ , de Groot J , Doumen MJA , Bredewoud RA , Claesen R , Lemstra AW , Scheltens P , Vermeeren A , Ponds R , Verhey F , De Deyn PP , Brouwer WH , Tucha O ((2019) ) Driving difficulties among patients with Alzheimer’s disease and other neurodegenerative disorders. J Alzheimers Dis 69: , 1019–1030. |
[16] | Chihuri S , Mielenz TJ , DiMaggio CJ , Betz ME , DiGuiseppi C , Jones VC , Li G ((2016) ) Driving cessation and health outcomes in older adults. J Am Geriatr Soc 64: , 332–341. |
[17] | Fonda SJ , Wallace RB , Herzog AR ((2001) ) Changes in driving patterns and worsening depressive symptoms among older adults. J Gerontol B Psychol Sci Soc Sci 56: , S343–351. |
[18] | Pristavec T ((2018) ) Social participation in later years: The role of driving mobility. J Gerontol B Psychol Sci Soc Sci 73: , 1457–1469. |
[19] | Iverson DJ , Gronseth GS , Reger MA , Classen S , Dubinsky RM , Rizzo M ((2010) ) Practice parameter update: Evaluation and management of driving risk in dementia: Report of the Quality Standards Subcommittee of the American Academy of Neurology. Neurology 74: , 1316–1324. |
[20] | Anstey KJ , Wood J , Lord S , Walker JG ((2005) ) Cognitive, sensory and physical factors enabling driving safety in older adults. Clin Psychol Rev 25: , 45–65. |
[21] | Mathias JL , Lucas LK ((2009) ) Cognitive predictors of unsafe driving in older drivers: A meta-analysis. Int Psychogeriatr 21: , 637–653. |
[22] | Snellgrove CA ((2005) )Cognitive screening for the safe driving competence of older people with mild cognitive impairment or early dementia. Australian Safety Bureau,Canberra. |
[23] | Ball K , Roenker DL , Wadley VG , Edwards JD , Roth DL , McGwin G , Raleigh R , Joyce J , Cissell GM , Dube T ((2006) ) Can high-risk older drivers be identified through performance-based measures in a Department of Motor Vehicles setting? J Am Geriatr Soc 54: , 77–84. |
[24] | Ott BR , Festa EK , Amick MM , Grace J , Davis JD , Heindel WC ((2008) ) Computerized maze navigation and on-road performance by drivers with dementia. J Geriatr Psychiatry Neurol 21: , 18–25. |
[25] | Papandonatos GD , Ott BR , Davis JD , Barco PP , Carr DB ((2015) ) Clinical utility of the trail-making test as a predictor of driving performance in older adults. J Am Geriatr Soc 63: , 2358–2364. |
[26] | Hird MA , Egeto P , Fischer CE , Naglie G , Schweizer TA ((2016) ) A systematic review and meta-analysis of on-road simulator and cognitive driving assessment in Alzheimer’s disease and mild cognitive impairment. J Alzheimers Dis 53: , 713–729. |
[27] | Kosuge R , Okamura K , Kihira M , Nakano Y , Fujita G ((2017) ) Predictors of driving outcomes including both crash involvement and driving cessation in a prospective study of Japanese older drivers. Accid Anal Prev 106: , 131–140. |
[28] | Pottgiesser S , Kleinemas U , Dohmes K , Spiegel L , Schädlich M , Rudinger G ((2012) ) Profile von Senioren mit Autounfällen (PROSA), Wirtschaftsverlag NW, Verlag für neue Wissenschaft, Bremerhaven. |
[29] | Baldock MR , Mathias JL , McLean AJ , Berndt A ((2006) ) Self-regulation of driving and its relationship to driving ability among older adults. Accid Anal Prev 38: , 1038–1045. |
[30] | Schulz P , Beblo T , Spannhorst S , Labudda K , Wagner T , Bertke V , Boedeker S , Driessen M , Kreisel SH , Toepper M ((2019) ) Avoidance behavior is an independent indicator of poorer on-road driving skills in older adults. J Gerontol B Psychol Sci Soc Sci 75: , 2152–2161. |
[31] | Brown LB , Ott BR , Papandonatos GD , Sui Y , Ready RE , Morris JC ((2005) ) Prediction of on-road driving performance in patients with early Alzheimer’s disease. J Am Geriatr Soc 53: , 94–98. |
[32] | Emerson JL , Johnson AM , Dawson JD , Uc EY , Anderson SW , Rizzo M ((2012) ) Predictors of driving outcomes in advancing age. Psychol Aging 27: , 550–559. |
[33] | Langford J , Methorst R , Hakamies-Blomqvist L ((2006) ) Older drivers do not have a high crash risk–a replication of low mileage bias. Accid Anal Prev 38: , 574–578. |
[34] | Piersma D , Fuermaier AB , de Waard D , Davidse RJ , de Groot J , Doumen MJ , Bredewoud RA , Claesen R , Lemstra AW , Vermeeren A , Ponds R , Verhey F , Brouwer WH , Tucha O ((2016) ) Prediction of fitness to drive in patients with Alzheimer’s dementia. PLoS One 11: , e0149566. |
[35] | Owsley C , Stalvey B , Wells J , Sloane ME ((1999) ) Older drivers and cataract: Driving habits and crash risk. J Gerontol A Biol Sci Med Sci 54: , M203–211. |
[36] | Ball K , Owsley C , Stalvey B , Roenker DL , Sloane ME , Graves M ((1998) ) Driving avoidance and functional impairment in older drivers. Accid Anal Prev 30: , 313–322. |
[37] | Bowers AR , Anastasio RJ , Sheldon SS , O’Connor MG , Hollis AM , Howe PD , Horowitz TS ((2013) ) Can we improve clinical prediction of at-risk older drivers? Accid Anal Prev 59: , 537–547. |
[38] | Owsley C , Ball K , McGwin G Jr , Sloane ME , Roenker DL , White MF , Overley ET ((1998) ) Visual processing impairment and risk of motor vehicle crash among older adults. JAMA 279: , 1083–1088. |
[39] | Marottoli RA , Richardson ED , Stowe MH , Miller EG , Brass LM , Cooney LM Jr , Tinetti ME ((1998) ) Development of a test battery to identify older drivers at risk for self-reported adverse driving events. J Am Geriatr Soc 46: , 562–568. |
[40] | Mosimann UP , Bächli-Biétry J , Boll J , Bopp-Kistler I , Donati F , Kressig RW , Martensson B , Monsch AU , Müri R , Nef T , Rothenberger A , Seeger R , Gunten A , Wirz U ((2012) ) Konsensusempfehlungen zur Beurteilung der medizinischen Mindestanforderungen für Fahreignung bei kognitiver Beeinträchtigung. Praxis 101: , 451–464. |
[41] | Poschadel S ((2012) ) Verkehrssicherheitsrelevante Leistungspotenziale, Defizite und Kompensationsmä Autofahrer, Wirtschaftsverlag NW, Verl. für neue Wissenschaft, Bremerhaven. |
[42] | Petersen RC ((2004) ) Mild cognitive impairment as a diagnostic entity. J Intern Med 256: , 183–194. |
[43] | Gräcmann N , Albrecht M ((2014) ) Begutachtungsleitlinien zur Kraftfahreignung, Bundesanstalt fur Straßenwesen, Bergisch Gladbach, gültig ab 01. Mai 2014, Fachverlag NW in der Carl Schünemann Verlag GmbH, Bremen. |
[44] | Gómez-Talegón T , Fierro I , Del Río MC , Álvarez FJ ((2011) ) Classification of medicinal drugs and driving: coordination and synthesis report. In Driving under the Influence of Drugs, Alcohol and Medicines (DRUID). https://www.bast.de/Druid/EN/deliverales-list/downloads/Deliverable_4_4_1.pdf;jsessionid=3D046BDBFB34379A5F5D81B5F0ABAD5B.live11293?__blob=publicationFile&v=1. |
[45] | De Raedt R , Ponjaert-Kristoffersen I ((2001) ) Predicting at-fault car accidents of older drivers. Accid Anal Prev 33: , 809–819. |
[46] | Poschadel S , Boenke D , Bloebaum A , Rabczinski S ((2012) ) Ältere Autofahrer: Erhalt, Verbesserung und Verlängerung der Fahrkompetenz durch Training. |
[47] | Field A ((2014) ) Discovering statistics using IBM SPSS Satistics, SAGE, London. |
[48] | Petersen RC , Caracciolo B , Brayne C , Gauthier S , Jelic V , Fratiglioni L ((2014) ) Mild cognitive impairment: A concept in evolution. J Intern Med 275: , 214–228. |
[49] | Hoggarth PA , Innes CR , Dalrymple-Alford JC , Jones RD ((2013) ) Predicting on-road assessment pass and fail outcomes in older drivers with cognitive impairment using a battery of computerized sensory-motor and cognitive tests. J Am Geriatr Soc 61: , 2192–2198. |
[50] | O’Connor MG , Kapust LR , Lin B , Hollis AM , Jones RN ((2010) ) The 4Cs (crash history, family concerns, clinical condition, and cognitive functions): A screening tool for the evaluation of the at-risk driver. J Am Geriatr Soc 58: , 1104–1108. |
[51] | Wood JM , Anstey KJ , Kerr GK , Lacherez PF , Lord S ((2008) ) A multidomain approach for predicting older driver safety under in-traffic road conditions. J Am Geriatr Soc 56: , 986–993. |


