
Validation of Random Forest Machine Learning Models to Predict Dementia-Related Neuropsychiatric Symptoms in Real-World Data
Abstract
Background:
Neuropsychiatric symptoms (NPS) are the leading cause of the social burden of dementia but their role is underestimated.
Objective:
The objective of the study was to validate predictive models to separately identify psychotic and depressive symptoms in patients diagnosed with dementia using clinical databases representing the whole population to inform decision-makers.
Methods:
First, we searched the electronic health records of 4,003 patients with dementia to identify NPS. Second, machine learning (random forest) algorithms were applied to build separate predictive models for psychotic and depressive symptom clusters in the training set (N = 3,003). Third, calibration and discrimination were assessed in the test set (N = 1,000) to assess the performance of the models.
Results:
Neuropsychiatric symptoms were noted in the electronic health record of 58% of patients. The area under the receiver operating curve reached 0.80 for the psychotic cluster model and 0.74 for the depressive cluster model. The Kappa index and accuracy also showed better discrimination in the psychotic model. Calibration plots indicated that both types of model had less predictive accuracy when the probability of neuropsychiatric symptoms was <25%. The most important variables in the psychotic cluster model were use of risperidone, level of sedation, use of quetiapine and haloperidol and the number of antipsychotics prescribed. In the depressive cluster model, the most important variables were number of antidepressants prescribed, escitalopram use, level of sedation, and age.
Conclusion:
Given their relatively good performance, the predictive models can be used to estimate prevalence of NPS in population databases.
1INTRODUCTION
Neuropsychiatric symptoms (NPS) are the leading cause of the social burden of dementia as they constitute the key factor in both loss of quality of life in patients and caregivers and families’ giving up on keeping patients at home [1, 2]. It could be thought that they are well acknowledged as 8% of new drugs currently under evaluation for Alzheimer’s disease are intended to treat NPS [3]. On the other hand, their population impact is underestimated as they are not well coded in health records [4– 6], implying inadequate clinical management [7]. In order to break the vicious circle established by the underestimation of the impact and the lack of proper recording of these symptoms, there is a need for tools providing information to monitor intervention plans from a population perspective [1, 8, 9].
The prevalence of NPS has been measured in clinical samples using questionnaires such as the Neuropsychiatric Inventory (NPI) that are rarely applied in clinical practice [4, 10], and the prevalence found varies between 56% and 98% [1, 11]. The problem with these figures is that they cannot be extrapolated to populations as a whole due to their heterogeneous distribution of dementia stages [9]. This distribution could be measured by analyzing a random sample of the general population using a door-to-door survey [4]. Notably, however, another study design is now feasible based on anonymized databases built from electronic health records (EHRs). This approach based on real-world data (RWD) has already been used to validate the diagnosis of dementia [12, 13] and the presence of agitation [6] but not to explore rates of NPS. On the other hand, validation studies are required in order to systematically use RWD as a source of epidemiological information [7, 14]. RWD have been described in an Organisation for Economic Co-operation and Development report as “broad data” because they cover large populations but include limited amounts of outcome and exposure data [15]. In line with this, machine learning (ML) tools have been postulated as having more capacity to predict complex clinical conditions like NPS [15] and being able to convert RWD into “smart data” [15, 16]. An example of this would be the calculation of the prevalence of NPS in population samples. While this design has been previously applied in cardiovascular research [17] and Alzheimer’s disease neuroimaging [18, 19], no examples have been reported of its use to measure features of dementia-related NPS at population level [20]. Therefore, the objective of this study was to construct and validate predictive models based on ML tools to identify the presence of psychotic and/or depressive symptoms in dementia-diagnosed patients from administrative and clinical databases that cover entire populations to inform social care and healthcare provision for NPS.
2MATERIALS AND METHODS
2.1Design
We carried out a retrospective study to evaluate the validity of EHRs to identify dementia-related NPS by collecting data from the diagnosis of dementia until the end of the follow-up. Data were obtained from a population registry of dementia cases built using the Basque Health Service’s institutional database, Oracle Business Intelligence (OBI), containing administrative and clinical records for primary, inpatient, emergency, and outpatient care in an anonymized form with all the diagnoses assigned to patients coded according to the International Classification of Diseases, Tenth Revision (ICD-10) [4, 12]. The study protocol was approved by the Clinical Research Ethics Committee (CEIC) of the Basque Country (registration number PI2018143 EPA-OD).
The registry included all patients diagnosed with dementia in OBI but our target population consisted only of individuals alive on 31 December 2018 (n = 31,000). The validation of the diagnosis of dementia in this registry evidenced adequate predictive values (positive and negative predictive values of 95.1% and 99.4%, respectively) [12]. Criteria used for the diagnosis of dementia are described in the Supplementary Material. As previously noted, NPS are poorly coded but they are recorded as text in EHRs [4]. Given the full deployment of electronic prescriptions from 2008, medication prescribing is highly accurately recorded in OBI. Our hypothesis was that drug prescriptions together with other clinical variables could be used to build a predictive model to identify dementia-related NPS in our institutional database. Therefore, we carried out a validation study classifying NPS into two patterns characterized, on the one hand, by depressive symptoms, the depressive cluster, and on the other, by psychotic symptoms, the psychotic cluster [4]. The dataset used and analyzed during the current study is available from the corresponding author on reasonable request.
2.2Validation study
The use of text mining algorithms was not feasible because EHR notes were not available in electronic format at the time. In a random sample of 4,003 patients with dementia, the EHRs were individually reviewed by a trained clinical coding technician, supervised by a psychiatrist, looking within physicians’ notes for evidence of the presence of the two types of symptoms. The technician and the psychiatrist were blinded to the OBI diagnostic codes. The terms apathy, bradypsychia, psychomotor slowness, sadness, depression, anxiety, and negativism were sought as markers for the depressive cluster, and psychotic symptoms, agitation, irritability, aggressiveness, restlessness, screams, visual or auditory hallucinations, delusions, alterations of behavior, erratic wandering, escape attempts, disinhibition, and rejection of care as markers for the psychotic cluster. We explored the correlation between presence of NPS in the EHR and NPI score in a small sample of patients (50 cases) diagnosed with dementia and living in the community. The EHR showed less sensitivity than the NPI but not less specificity (Supplementary Tables 1– 3).
2.3Variables
The EHR review supplied data on the two response variables used in the predictive models, namely, the presence of terms associated with depressive and/or psychotic symptoms. The following were considered as potential explanatory variables: age, sex, institutionalization status, concomitant diagnoses (diabetes mellitus, hypertension, dyslipidemia, thyroid disease, Parkinson’s disease, stroke, cardiovascular disease, head trauma, depressive disorder, and psychotic disorder) and pharmacological treatment. We collected data on all prescriptions of medications in the following specific Anatomical Therapeutic Chemical Classification System subgroups: N06D (donepezil, rivastigmine and galantamine, and memantine), N06A (antidepressants), N05A and NO6C (antipsychotics). As the hypothesis that the prescribing of antidepressants and antipsychotics can be used to detect NPS in population databases was the rationale for the current study, all the prescriptions and changes in prescriptions involving the aforementioned subgroups were recorded. This data collection process resulted in a longitudinal dataset with n data instances per participant, n being the number of different drug prescriptions issued to them over time. This longitudinal information was then used to create new summarizing variables to obtain a single data instance per participant. These summarizing variables included baseline features, concomitant diagnoses over time, sedative effects (highest level of sedation ever prescribed to the patient), drug prescriptions and changes therein (number of distinct antidepressants prescribed, number of distinct antipsychotics prescribed, number of changes from antidepressants to antipsychotics and number of changes from antipsychotics to antidepressants) and the two response variables (depressive cluster and psychotic cluster documented in the EHR notes) (Supplementary Table 4). The level of sedation produced by each drug was categorized (0: none; 1: minimal; 2: mild; 3: moderate; or 4: deep) as set out in Supplementary Table 5 according to expert opinion. When the patient took more than one drug, the level of sedation of the drug with the strongest effect was considered.
All the preprocessing of the dataset and predictive modelling was done in R version 3.6.1. and its libraries Caret, randomForest, and pROC.
2.4Machine learning
The sample (N) was randomly divided into a training set (N1 = 0.75 * N) and a test set (N2 = 0.25 * N). It was checked that patient characteristics did not differ between training and test sets. The ML random forest approach, fully described in the Supplementary Material, was applied to build predictive models [21]. The random forest algorithm [21] is a stochastic ensemble method that uses bagging, a combination of bootstrapping and aggregation of weak learners, more specifically, decision trees, seeking to detect patterns in data and use these to predict outcomes, in our case, NPS [19].
In the training set, we followed a stepwise process beginning with baseline models whose performance was improved by adding other explanatory variables in an iterative way to assess their contribution. Mean decrease accuracy was used to assess the relative feature importance of the variables in the models [22]. This technique computes the accuracy of the trees that build the model for the out-of-the bag sample of each tree. Then, for each variable, it permutes the values of the variables one after another and measures how much the accuracy changes. Any decrease in accuracy resulting from this permutation is averaged over all trees, and used as a measure of the importance of each variable in the random forest model. All the predictive models were evaluated in the training set using a k-fold cross-validation approach, with k = 10 and 10 repetitions. The main advantage of this evaluation technique is that it maximizes the availability of data for training the models, as it allows all the data instances to be used both for training and validation purposes in different iterations. In addition, it gives accurate estimates of the performance of the prediction models for unseen data. The same process was carried out separately for the psychotic and depressive symptom models for which discriminatory power was assessed.
Discriminatory power refers to the ability of a prediction model to distinguish between two outcome classes. In order to evaluate the classification ability of the models, the following statistics were calculated for each model: the area under the receiver operating curve (AUC), sensitivity, specificity, accuracy, no-information rate, and Kappa index. The AUC gives an overview of a model’s ability to discriminate between positive and negative classes, independently of their prevalence, and is therefore suitable for imbalanced datasets. Sensitivity or the true positive rate is defined as the number of cases from the positive class that were predicted correctly by the model, while specificity or the true negative rate refers to the number of cases from the negative class that were actually predicted as negative. The no-information rate is the accuracy that could be expected without the model, and accuracy refers to the percentage of correct classifications the model provides. The Kappa index measures the agreement between two approaches to classify mutually exclusive categories, agreement being characterized as slight (for values of 0– 0.20), fair (0.21– 0.40), moderate (0.41– 0.60), or substantial (0.61– 0.80) [23].
2.5Evaluation of model performance in the test dataset
Model performance was measured by assessing both calibration and discrimination in the test set [24– 26]. Calibration is related to goodness-of-fit, which reflects the agreement between observed outcomes and predictions. To assess this, a calibration curve was drawn by plotting the predicted probabilities for groups on the x-axis and the mean observed values on the y-axis. Finally, discriminatory power was assessed with the same statistics as in the training set.
Table 1
Characteristics of patients disaggregated by psychotic and depressive disorder based on health record review
| EHR psychotic cluster | HER depressive cluster | |||||
| Symptoms | No symptoms | Symptoms | No symptoms | Total | ||
| N = 2,307 | N = 1,696 | N = 2,356 | N = 1,647 | N = 4,003 | N | |
| Sex: female | 1,572 (68.1%) | 1,230 (72.5%) | 1,717 (72.9%) | 1,085 (65.9%) | 2,802 (70.0%) | 4,003 |
| Age* | 86 [81;90] | 85 [79;89] | 84 [79;89] | 87 [82;90] | 85 [80;89] | 4,003 |
| Nursing home | 697 (30.2%) | 246 (14.5%) | 576 (24.4%) | 367 (22.3%) | 943 (23.6%) | 4,003 |
| Hypertension | 1,392 (60.3%) | 1,006 (59.3%) | 1,413 (60.0%) | 985 (59.8%) | 2398 (59.9%) | 4,003 |
| Diabetes mellitus | 616 (26.7%) | 428 (25.2%) | 584 (24.8%) | 460 (27.9%) | 1044 (26.1%) | 4,003 |
| Dyslipidemia | 1,173 (50.8%) | 886 (52.2%) | 1,282 (54.4%) | 777 (47.2%) | 2059 (51.4%) | 4,003 |
| Thyroid disease | 433 (18.8%) | 331 (19.5%) | 472 (20.0%) | 292 (17.7%) | 764 (19.1%) | 4,003 |
| Parkinson’s disease | 146 (6.33%) | 47 (2.77%) | 141 (5.98%) | 52 (3.16%) | 193 (4.82%) | 4,003 |
| Stroke | 724 (31.4%) | 488 (28.8%) | 705 (29.9%) | 507 (30.8%) | 1212 (30.3%) | 4,003 |
| Cardiovascular disease | 478 (20.7%) | 312 (18.4%) | 453 (19.2%) | 337 (20.5%) | 790 (19.7%) | 4,003 |
| Traumatic brain injury | 426 (18.5%) | 230 (13.6%) | 385 (16.3%) | 271 (16.5%) | 656 (16.4%) | 4,003 |
| Antipsychotic treatment | 1,628 (70.6%) | 467 (27.5%) | 1,337 (56.7%) | 758 (46.0%) | 2095 (52.3%) | 4,003 |
| No. of antipsychotics prescribed | 1 [1;2] | 1 [1;1] | 1 [1;2] | 1 [1;2] | 1 [1;2] | 2,095 |
| Changes from antipsychotic to antidepressant | 2,095 | |||||
| No changes | 256 (15.7%) | 114 (24.4%) | 165 (12.3%) | 205 (27.0%) | 370 (17.7%) | |
| ≥1 change | 1,372 (84.3%) | 353 (75.6%) | 1,172 (87.7%) | 553 (73.0%) | 1,725 (82.3%) | |
| No. of changes from antipsychotic to antidepressant | 1 [1;2] | 1 [1;1] | 1 [1;2] | 1 [1;1] | 1 [1;1] | 1,725 |
| Antidepressant treatment | 1,731 (75.0%) | 988 (58.3%) | 1890 (80.2%) | 829 (50.3%) | 2719 (67.9%) | 4,003 |
| No. of antidepressants prescribed | 1 [1;2] | 1 [1;2] | 2 [1;2] | 1 [1;2] | 1 [1;2] | 2,719 |
| Changes from antidepressant to antipsychotic: | 2,719 | |||||
| No changes | 699 (40.4%) | 764 (77.3%) | 958 (50.7%) | 505 (60.9%) | 1,463 (53.8%) | |
| ≥1 change | 1,032 (59.6%) | 224 (22.7%) | 932 (49.3%) | 324 (39.1%) | 1,256 (46.2%) | |
| No. of changes from antidepressant to antipsychotic | 1 [1;2] | 1 [1;1] | 1 [1;2] | 1 [1;1] | 1 [1;1] | 1,256 |
| Level of sedation: | 4,003 | |||||
| None | 383 (16.6%) | 843 (49.7%) | 579 (24.6%) | 647 (39.3%) | 1,226 (30.6%) | |
| Minimal | 55 (2.38%) | 160 (9.43%) | 109 (4.63%) | 106 (6.44%) | 215 (5.37%) | |
| Mild | 761 (33.0%) | 570 (33.6%) | 842 (35.7%) | 489 (29.7%) | 1,331 (33.3%) | |
| Moderate | 1,088 (47.2%) | 121 (7.13%) | 809 (34.3%) | 400 (24.3%) | 1,209 (30.2%) | |
| Deep | 20 (0.87%) | 2 (0.12%) | 17 (0.72%) | 5 (0.30%) | 22 (0.55%) | |
*Median [interquartile range]; HER, electronic health record.
Table 2
Performance of models for psychotic symptoms and depressive symptoms in the training and validation datasets
| Psychotic cluster model | N(v) | AUC (CI) | Sens. | Spec. | Accuracy | No-info. rate | Kappa |
| Base case (≥1 antipsychotic prescribed) | 1 | 0.706 | 0.725 | ||||
| Training set | |||||||
| 1: antipsychotics + antidepressants | 2 | 0.741 (0.711– 0.741) | 0.712 | 0.722 | 0.716 | 0.587 | 0.425 |
| 2: distinct antipsychotics + distinct antidepressants | 21 | 0.802 (0.775– 0.802) | 0.653 | 0.857 | 0.737 | 0.587 | 0.485 |
| 3 : 2 + changes in prescriptions | 23 | 0.797 (0.77– 0.797) | 0.660 | 0.848 | 0.737 | 0.587 | 0.484 |
| 4 : 3 + age + sex + sedation + comorbidities + nursing home | 35 | 0.807 (0.781– 0.807) | 0.692 | 0.802 | 0.737 | 0.587 | 0.477 |
| Test set | |||||||
| 4: psychotic cluster model | 35 | 0.807 (0.780– 0.807) | 0.693 | 0.806 | 0.740 | 0.587 | 0.482 |
| Depressive cluster model | N(v) | AUC (CI) | Sens. | Spec. | Accuracy | No-info. rate | Kappa |
| Base case (≥1 antidepressant prescribed) | 1 | 0.802 | 0.497 | ||||
| Training set | |||||||
| 1: antipsychotics + antidepressants | 2 | 0.665 (0.633– 0.665) | 0.823 | 0.495 | 0.693 | 0.604 | 0.331 |
| 2: distinct antipsychotics + distinct antidepressants | 21 | 0.719 (0.687– 0.719) | 0.707 | 0.659 | 0.688 | 0.604 | 0.359 |
| 3 : 2 + changes in prescriptions | 23 | 0.715 (0.682– 0.715) | 0.699 | 0.683 | 0.693 | 0.604 | 0.373 |
| 4 : 3 + age + sex + sedation + comorbidities + nursing home | 35 | 0.739 (0.708– 0.739) | 0.759 | 0.627 | 0.706 | 0.604 | 0.386 |
| Test set | |||||||
| 4: depressive cluster model | 35 | 0.74 (0.709– 0.74) | 0.75 | 0.629 | 0.702 | 0.604 | 0.378 |
N(v), number of variables; AUC, area under the receiver operating curve; Sens., sensitivity; Spec., specificity.
3RESULTS
The resulting dataset contained 62 variables and 4,003 cases, the main features of which are described in Table 1. Psychotic symptoms were documented in the EHR of 58% of the population and depressive symptoms in 59%. Psychotic symptoms were more common in men than in women. The pattern with age was different: the group with psychotic disorders being older in age and those with depressive disorder younger. Living in a nursing home was strongly associated with both types of symptoms. The dataset was randomly divided into a training set (N1 = 3003) and a test set (N2 = 1000). Supplementary Table 6 summarizes the pharmacological treatments given based on data from the EHR review by type of symptom, while Supplementary Table 7 compares patient characteristics in training and test sets.
Fig.1
Importance of variables in selected models predicting psychotic and depressive symptoms.
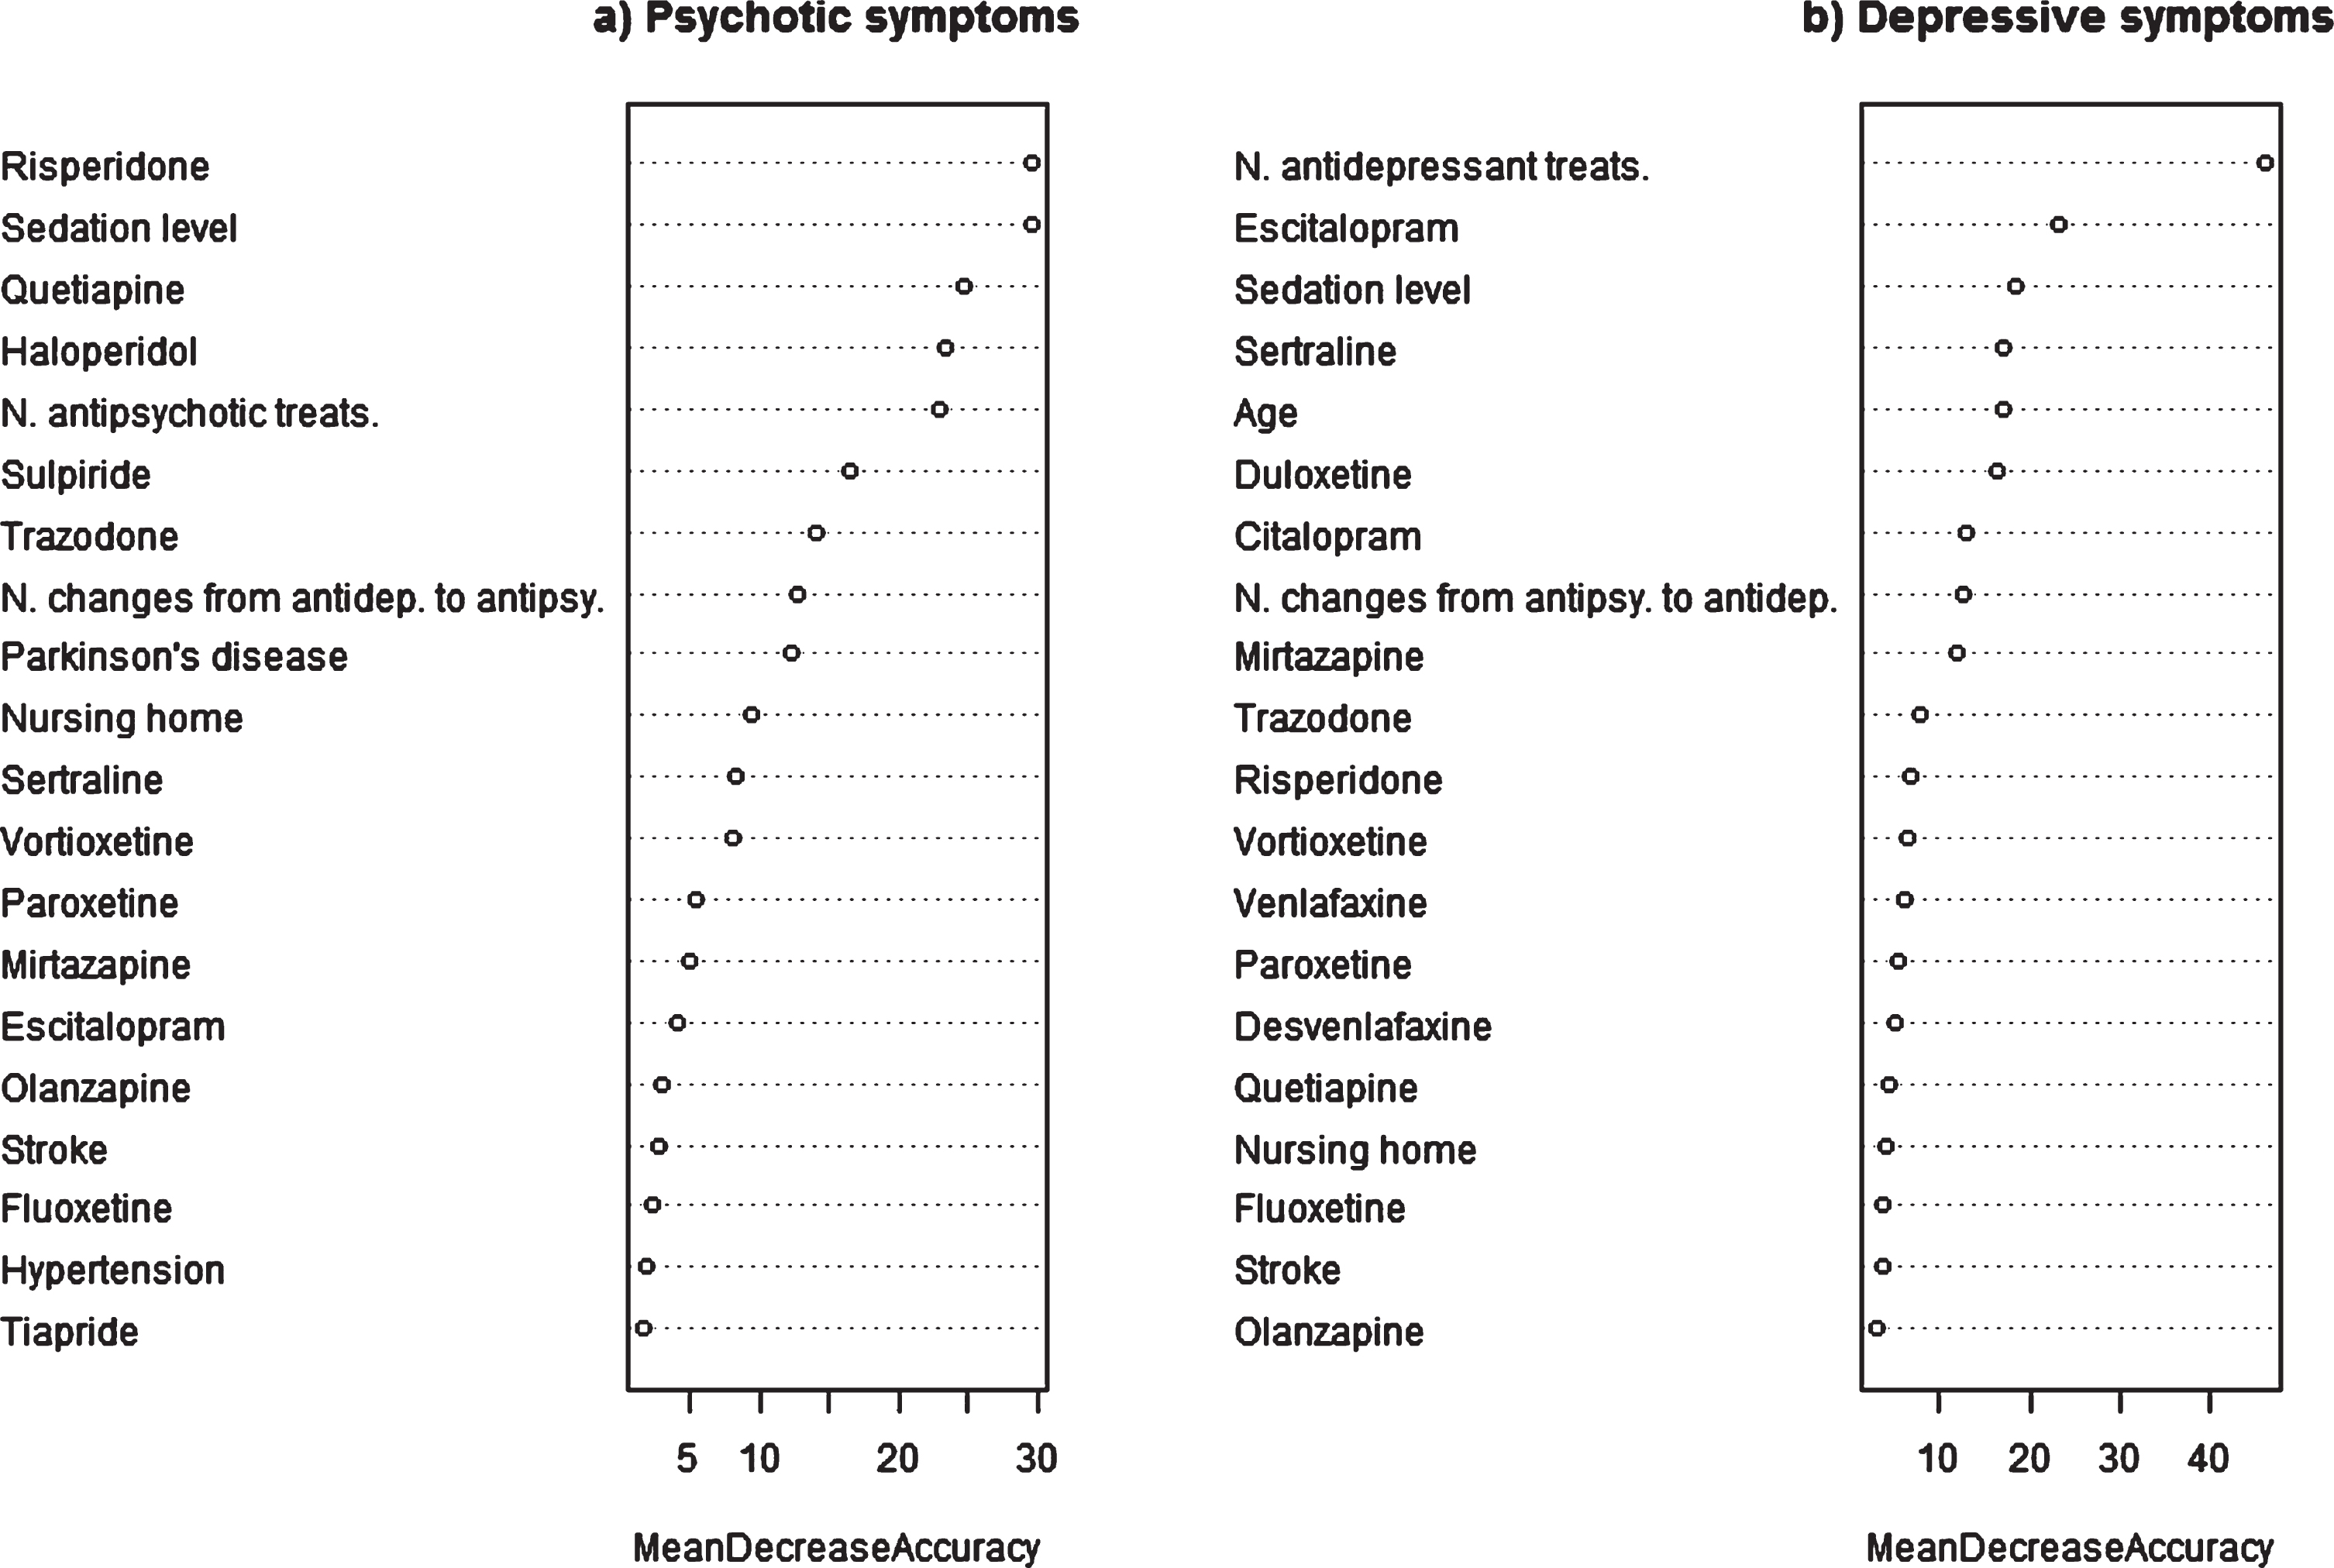
Table 2 shows the performance of the models tested for psychotic and depressive symptoms in both training and test sets. The iterations and modelling variables tested in each model are also summarized in this table. The analysis of the raw data without other variables indicates that antipsychotic prescribing is more specific and antidepressant prescribing more sensitive for identifying NPS. Notably, the models seeking to predict psychotic symptoms perform better, reaching an AUC of 0.80, than the depressive symptom models (maximum AUC of 0.74). Other statistics, namely, the kappa index and accuracy, also evidenced that the psychotic cluster models had better discriminatory power.
Figure 1 and Supplementary Table 8 indicate the importance of variables in the selected models. The most important ones in the psychotic symptom model are use of risperidone and level of sedation achieved by all the drugs prescribed, followed by use of quetiapine and haloperidol and the number of antipsychotics prescribed. Other important variables were the prescribing of trazodone, and sulpiride and number of changes from antidepressants to antipsychotics. In the depressive symptom model, the most important variable is number of antidepressants prescribed followed by use of escitalopram, level of sedation, and age. In this model, other important variables were the prescribing of Sertraline, duloxetine, mirtazapine, and citalopram, and the number of changes from antipsychotics to antidepressants.
Fig.2
Calibration plot for selected models predicting psychotic and depressive symptoms in the test set.
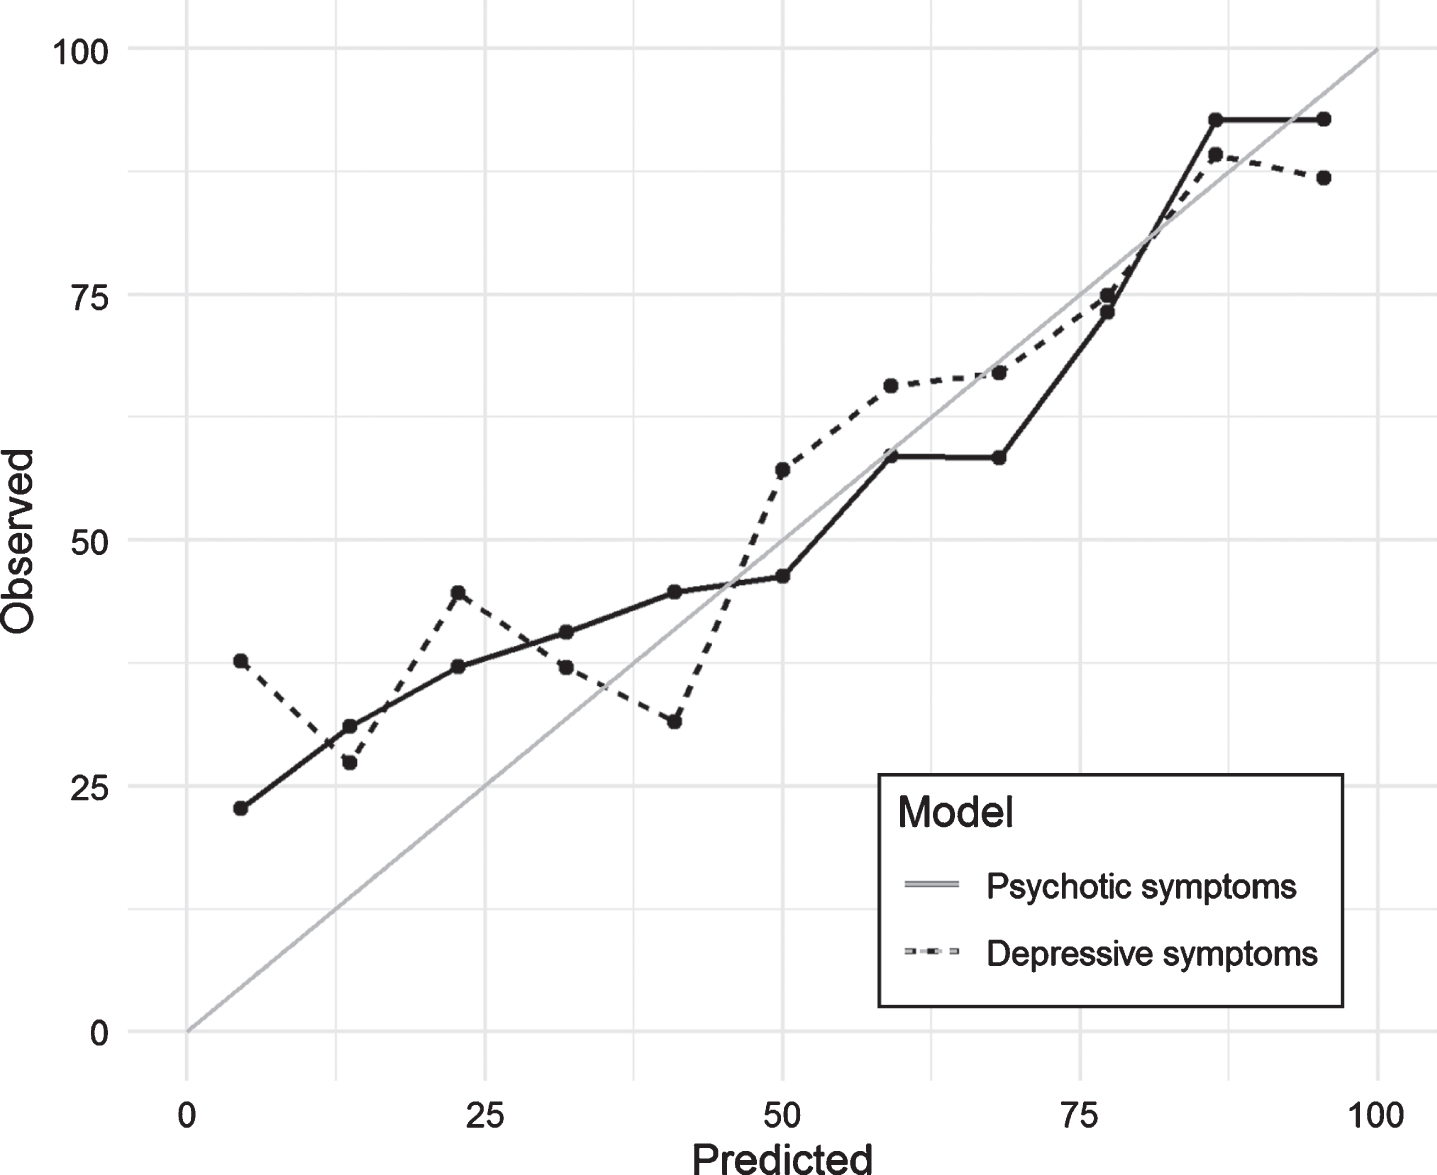
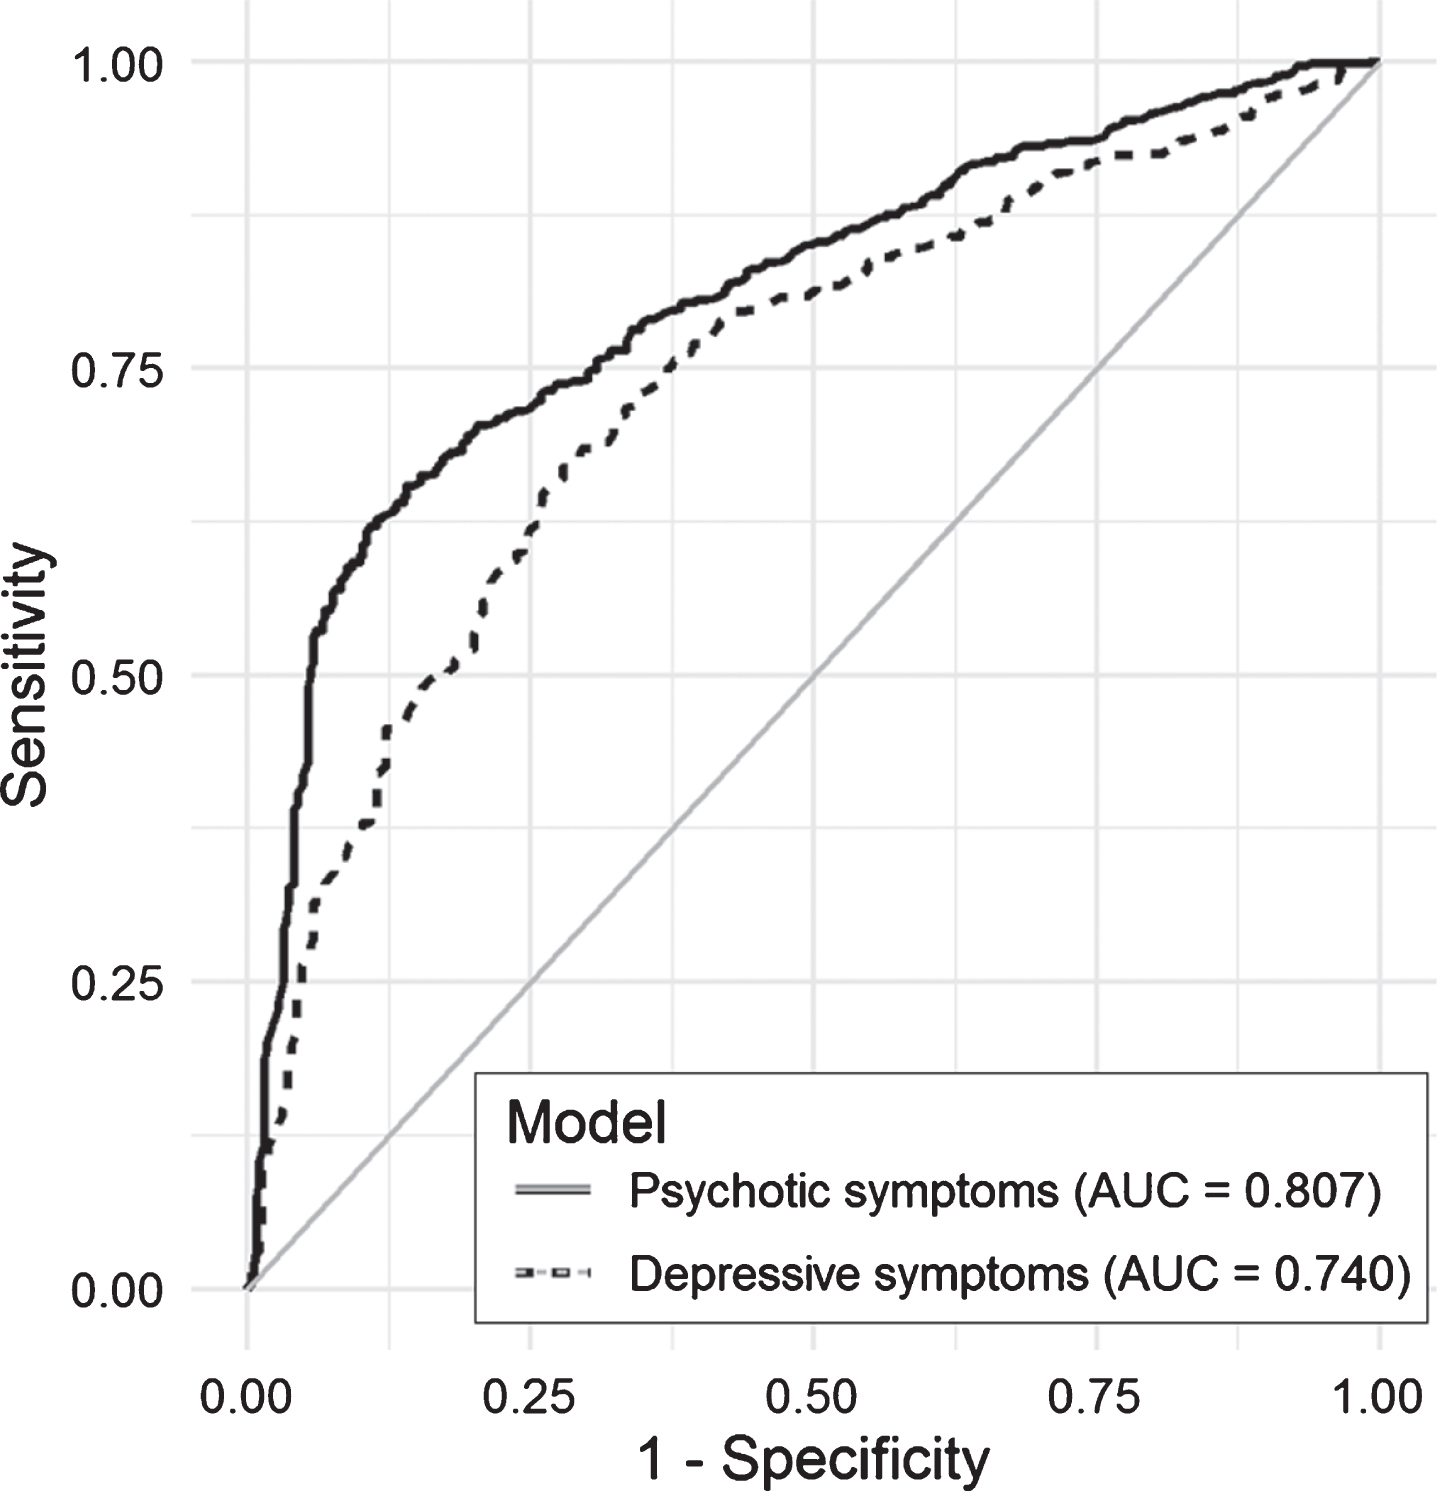
Figure 2 shows the calibration plot for the test dataset. If the model calibration was to be perfect, the points should lie on or around the 45° line of the plot. In our case, the models had poorer predictive power when the probability of NPS was lower than 0.25. Finally, Fig. 3 included in the Supplementary Material shows the ROC curves obtained in the test dataset for each of the models. As measured with the AUC (Table 2 and Fig. 3), the curves demonstrate graphically the better predictive ability of the psychotic symptom model.
Fig.3
Area under the curve (AUC) for selected models predicting psychotic and depressive symptoms in the test set.
4DISCUSSION
To our knowledge, this is the first time that ML techniques have been applied to build and validate models based on real-world population data to estimate the prevalence of NPS in dementia. This study shows that ML-based models are good at predicting dementia-related NPS and opens the prospect of applying these techniques in population databases. The raw results showed that more than half of the sample had NPS as identified by the presence of key terms in their EHR. This fits well with findings in the population-based literature. Halpern et al. found evidence of agitation in 44.6% of all patients when analyzing the EHR notes of dementia patients [6]. Similarly, a systematic review of 12 studies reporting NPS based on NPI score estimated rates of 40 to 50% for symptoms that could be included in the depressive and psychotic clusters [27], while in the Cardiovascular Health Study, 62% of dementia patients exhibited clinically significant NPS [28].
Considering AUCs of ≥0.80 to indicate excellent and 0.70– 0.79 acceptable discrimination, the psychotic symptom model can be classified as excellent and the depressive symptom model as acceptable [29]. Given these classifications, it would be valid to apply the results to the whole population database. They are consistent with the expected higher specificity of models for psychosis. When data collected from EHRs are applied to research, avoiding false-positive diagnoses may be more important than avoiding false negatives. In longitudinal studies, for example, false positives can dilute observed effects and reduce statistical power [30]. Therefore, our approach is valid for epidemiological research on dementia-related NPS. Consistent with the AUC values, other statistics used, namely, accuracy and the kappa index, also indicated that the model predicting psychotic symptoms performed better.
As previously mentioned, however, the calibration was poor when the probability of NPS estimated by the model was low. This implies that both models systematically underestimated symptom rates observed in EHRs. The explanation for this may be that when the symptoms are of recent onset the recording of symptoms in the EHR is not yet accompanied by pharmacological treatment. Nonetheless, as the disease moves forward, clinicians treat such symptoms, and hence, the calibration line overlaps the 45° line of the plot meaning that observed and predicted cases fit well.
Our framework for analyzing the NPS was based on distinguishing between two broad categories or constructs in individual clinical symptoms, because analyzing individual symptoms would lead to overly complex analysis. In 2015, the International Psychogeriatric Association developed a provisional consensus definition of agitation [31]. Currently, this association is updating the criteria for psychosis in major and mild neurocognitive disorder and has described agitation and depression as specific subtypes. The different level of importance of the variables in the two models corroborates the usefulness of the two-category classification. Nonetheless, there is agreement between the models on the importance of changes in medication and their sedative properties. As in the Chinese metaphor about cats, perhaps it does not matter whether a drug is an antidepressant or an antipsychotic so long as it produces sedation. Instead of being avoided as an adverse effect of treatment [32], it seems that sedation is the mechanism sought to reduce agitation. The other key variable is patients changing from one medication to another (antidepressant to antipsychotic or vice versa). Day-to-day fluctuations in clinical symptoms are interpreted as treatment failure, which boosts the recording of symptoms in the EHR and leads to the prescribing of new drugs.
The plot showing the importance of variables for psychotic symptoms highlights the role of risperidone and quetiapine in their pharmacological treatment. It was to be expected that risperidone would be the drug that contributed the most predictive value to the psychotic symptom model because it is the only one that has official approval from the European Drug Agency. The great gap between recommendations and reality is evidenced by the role of quetiapine, which is the second most important medication even though its indication for dementia is off label. On the other hand, the level of sedation achieved by the medications used also had a high explanatory capacity, and medication changes contributed considerably to the predictive value of the psychotic symptom model. NPS affect almost all individuals with dementia (97%) over the course of the disease [3], and although they fluctuate [4], they rarely disappear, and this makes level of sedation particularly important. Families seldom have access to specialized clinics to deal with such fluctuations and family caregivers often manage them by adjusting doses by trial and error. If that does not work, families turn to the most accessible doctor to change the drug prescribed because they cannot cope with the stress. This explains the great importance in the model of the variables indicating the number of antipsychotic treatments and changes from antidepressant to antipsychotic drugs. As described in the literature, antidepressant drugs also play a relevant role managing agitation [33]. Not only trazodone but also sertraline, paroxetine, mirtazapine, and escitalopram showed importance in the model. The most important antidepressants in the psychotic cluster model were mirtazapine and trazodone, which are most likely used for their sedative effect. In contrast, the prescribing of sertraline and paroxetine could have more to do with their antidepressant effects and ease of use due to fewer side effects. We believe that their role reflects a history of both psychotic and depressive symptoms in some cases. A few non-pharmacological variables showed importance, namely, comorbidities (Parkinson’s disease and stroke) and living in a nursing home. Nonetheless, their explanatory power was very weak compared with that of pharmacological variables.
The depressive cluster model was based on different variables, the most important one being the number of antidepressants prescribed. Escitalopram is the first individual drug in the ranking, and is followed by level of sedation and age. This model seemed to be more homogeneous as it relied much less on antipsychotic drugs and comorbidities. Moreover, living in a nursing home played a trivial role. Despite this homogeneity, its predictive power was much lower, especially because of the lower specificity. The model identified positive cases well, but failed to rule out negative ones.
Various authors have underlined the need to integrate evidence from heterogeneous sources including clinical trials, cohort data, and RWD to evaluate disease progression and build health economic models for dementia treatment [15, 34, 35]. Nonetheless, RWD lack consistency in the collection of outcomes and monitoring of disease severity. We recognize the limitations of our study associated with failure to include other comorbidities and our dataset lacking measures of cognitive function and/or autonomy, such as walking speed and performance of activities of daily living, which are not currently recorded in a structured format in EHRs. It is likely that inclusion of the such variables would have improved the predictive power of the models. Additionally, it is widely known that different feature selection techniques to compute variable importance can lead to different results [36]. In this sense, random forest-based technique has been deemed of giving biased results when using high-dimensional datasets with possible multicollinearity [36]. Considering the nature of our data, we believe that it does not significantly affect the presented results. Nonetheless, the comparison with other variable selection techniques in future works would be worth to consider. In this scenario, validation of variables available from EHRs seems to be a key first step towards an AD/dementia integrated curated data environment fed from multiple sources [15]. Brayne et al. pointed out the crucial importance of approaches to dementia research being anchored in the true population as selective participation in observational studies may systematically bias findings [37].
In addition to the aforementioned limitations of this study (related to variables not included in the models), a limitation is that no validated scale such as the NPI was used to identify the presence of NPS in patients with dementia in the whole sample [10]. Finding specific terms in an EHR review only reveals that a physician recorded symptoms linked to the presence of behavior and depressive disorders. The identification of dementia cases could also be deemed problematic, as some authors have questioned the use of Medicare claims to identify dementia [38]. On the other hand, the aim of such claims is to allow physicians to be paid. In contrast, our database is obtained directly from a unified EHR used by all healthcare professionals (physicians and nurses) to document all patients’ contacts with the health service in all care settings (primary, emergency, inpatient, home and outpatient care). The system includes an automatic coding system (ICD-10) managed by physicians when they provide care to patients. Specialists and primary care doctors are not able to move forward in the EHR if an episode is not assigned a diagnosis that is automatically coded. Canadian researchers have applied a similar approach for identifying Parkinson’s disease and dementia with good results [13, 39].
We have applied a binary classification that simplifies the heterogeneous way in which doctors describe NPS in the EHR. Moreover, we have consciously avoided including sleep disturbances within the scope of the research due to the bidirectional relationship between sleep disturbances and dementia [5]. Given that it is unclear whether dementia is a cause or consequence of sleep disturbance, we believe that the interpretation of predictive models based on the use of hypnotics would be very difficult, and hence, for the time being, have focused on psychotic and depressive clusters.
4.1Conclusions
More than half of the sample of dementia patients had NPS as identified by the presence of key terms in the electronic health record. Although NPS are not coded in the diagnosis registry, they are treated with antipsychotics and antidepressants, which allows the development of valid predictive models by joining ML tools and RWD. Given their good performance, the predictive models can be used to systematically estimate prevalence of NPS in population databases. Unraveling the extent of NPS subtypes is required to develop both social care and healthcare provision for NPS.
ACKNOWLEDGMENTS
We would like to acknowledge the help of Ideas Need Communicating Language Services in improving the use of English in the manuscript.
The study was funded by two grants from the Basque Foundation for Health Innovation and Research (BIOEF) (grant number BIOD17/ND/015) and Gipuzkoa Regional government (Adinberri program). The funding sources were not involved in study design in the collection, analysis, and interpretation of data, in the writing of the report, or in the decision to submit the article.
Authors’ disclosures available online (https://www.j-alz.com/manuscript-disclosures/20-0345r2).
SUPPLEMENTARY MATERIAL
[1] The supplementary material is available in the electronic version of this article: https://dx.doi.org/10.3233/JAD-200345.
REFERENCES
[1] | Katona C , Livingston G , Cooper C , Ames D , Brodaty H , Chiu E ((2007) ) International Psychogeriatric Association consensus statement on defining and measuring treatment benefits in dementia. Int Psychogeriatr 19: , 345–354. |
[2] | Gilhooly KJ , Gilhooly MLM , Sullivan MP , McIntyre A , Wilson L , Harding E , Woodbridge R , Crutch S ((2016) ) A meta-review of stress, coping and interventions in dementia and dementia caregiving. BMC Geriatr 16: , 106. |
[3] | Cummings J , Lee G , Ritter A , Sabbagh M , Zhong K ((2019) ) Alzheimer’s disease drug development pipeline: 2019. Alzheimers Dement (N Y) 5: , 272–293. |
[4] | Mar J , Arrospide A , Soto-Gordoa M , Iruin Á , Tainta M , Gabilondo A , Mar-Barrutia L , Calvo M , Mateos M , Ibarrondo O ((2019) ) Dementia-related neuropsychiatric symptoms: inequalities in pharmacological treatment and institutionalization. Neuropsychiatr Dis Treat 15: , 2027–2034. |
[5] | Lanctôt KL , Amatniek J , Ancoli-Israel S , Arnold SE , Ballard C , Cohen-Mansfield J , Ismail Z , Lyketsos C , Miller DS , Musiek E , Osorio RS , Rosenberg PB , Satlin A , Steffens D , Tariot P , Bain LJ , Carrillo MC , Hendrix JA , Jurgens H , Boot B ((2017) ) Neuropsychiatric signs and symptoms of Alzheimer’s disease: new treatment paradigms. Alzheimers Dement (N Y) 3: , 440–449. |
[6] | Halpern R , Seare J , Tong J , Hartry A , Olaoye A , Aigbogun MS ((2019) ) Using electronic health records to estimate the prevalence of agitation in Alzheimer disease/dementia. Int J Geriatr Psychiatry 34: , 420–431. |
[7] | Stocks SJ , Kontopantelis E , Webb RT , Avery AJ , Burns A , Ashcroft DM ((2017) ) Antipsychotic prescribing to patients diagnosed with dementia without a diagnosis of psychosis in the context of national guidance and drug safety warnings: longitudinal study in UK general practice. Drug Saf 40: , 679–692. |
[8] | Ballard C , Gauthier S , Corbett A , Brayne C , Aarsland D , Jones E ((2011) ) Alzheimer’s disease. Lancet 377: , 1019–1031. |
[9] | Brayne C ((2007) ) The elephant in the room - healthy brains in later life, epidemiology and public health. Nat Rev Neurosci 8: , 233–239. |
[10] | Cummings JL , Mega M , Gray K , Rosenberg-Thompson S , Carusi DA , Gornbein J ((1994) ) The Neuropsychiatric Inventory: comprehensive assessment of psychopathology in dementia. Neurology 44: , 2308–2314. |
[11] | Cerejeira J , Lagarto L , Mukaetova-Ladinska EB ((2012) ) Behavioral and psychological symptoms of dementia. Front Neurol 3: , 73. |
[12] | Mar J , Arrospide A , Soto-Gordoa M , Machón M , Iruin Á , Martinez-Lage P , Gabilondo A , Moreno-Izco F , Gabilondo A , Arriola L ((2018) ) Validity of a computerized population registry of dementia based on clinical databases. Neurologia doi: 10.1016/j.nrl.2018.03.005. |
[13] | Jaakkimainen RL , Bronskill SE , Tierney MC , Herrmann N , Green D , Young J , Ivers N , Butt D , Widdifield J , Tu K ((2016) ) Identification of physician-diagnosed Alzheimer’s disease and related dementias in population-based administrative data: a validation study using family physicians’ electronic medical records. J Alzheimers Dis 54: , 337–349. |
[14] | Olfson M , King M , Schoenbaum M ((2015) ) Antipsychotic treatment of adults in the United States. J Clin Psychiatry 76: , 1346–1353. |
[15] | Anderson G , Oderkirk J ((2015) ) Dementia Research and Care: Can Big Data Help? OECD Publishing, Paris. |
[16] | Obermeyer Z , Emanuel EJ ((2016) ) Predicting the future - big data, machine learning, and clinical medicine. N Engl J Med 375: , 1216–1219. |
[17] | Dimopoulos AC , Nikolaidou M , Caballero FF , Engchuan W , Sanchez-Niubo A , Arndt H , Ayuso-Mateos JL , Haro JM , Chatterji S , Georgousopoulou EN , Pitsavos C , Panagiotakos DB ((2018) ) Machine learning methodologies versus cardiovascular risk scores, in predicting disease risk . . BMC Med Res Methodol 18: , 179. |
[18] | Moscoso A , Silva-Rodríguez J , Aldrey JM , Cortés J , Fernández-Ferreiro A , Gómez-Lado N , Ruibal Á , Aguiar P ; Alzheimer’s Disease Neuroimaging Initiative ((2019) ) Prediction of Alzheimer’s disease dementia with MRI beyond the short-term: implications for the design of predictive models. Neuroimage Clin 23: , 101837. |
[19] | Zhang Y , Wang S , Sui Y , Yang M , Liu B , Cheng H , Sun J , Jia W , Phillips P , Gorriz JM ((2018) ) Multivariate approach for Alzheimer’s disease detection using stationary wavelet entropy and predator-prey particle swarm optimization. J Alzheimers Dis 65: , 855–869. |
[20] | Doupe P , Faghmous J , Basu S ((2019) ) Machine learning for health services researchers. Value Health 22: , 808–815. |
[21] | Fabris F , Magalhães JP , Freitas AA ((2017) ) A review of supervised machine learning applied to ageing research. Biogerontology 18: , 171–188. |
[22] | Biau G ((2012) ) Analysis of a random forests model. J Mach Learn Res 13: , 1063–1095. |
[23] | Landis JR , Koch GG ((1977) ) The measurement of observer agreement for categorical data. Biometrics 33: , 159–174. |
[24] | Collins GS , Reitsma JB , Altman DG , Moons KGM ((2015) ) Transparent Reporting of a multivariable prediction model for Individual Prognosis or Diagnosis (TRIPOD): the TRIPOD statement. Ann Intern Med 162: , 55–63. |
[25] | Steyerberg EW , Pencina MJ , Lingsma HF , Kattan MW , Vickers AJ , Van Calster B ((2012) ) Assessing the incremental value of diagnostic and prognostic markers: a review and illustration. Eur J Clin Invest 42: , 216–228. |
[26] | Steyerberg EW , Van Calster B , Pencina MJ ((2011) ) [Performance measures for prediction models and markers: evaluation of predictions and classifications]. Rev Esp Cardiol 64: , 788–794. |
[27] | Zhao QF , Tan L , Wang HF , Jiang T , Tan MS , Tan L , Xu W , Li JQ , Wang J , Lai TJ , Yu JT ((2016) ) The prevalence of neuropsychiatric symptoms in Alzheimer’s disease: systematic review and meta-analysis. J Affect Disord 190: , 264–271. |
[28] | Lyketsos CG , Lopez O , Jones B , Fitzpatrick AL , Breitner J , DeKosky S ((2002) ) Prevalence of neuropsychiatric symptoms in dementia and mild cognitive impairment: results from the cardiovascular health study. JAMA 288: , 1475–1483. |
[29] | Hosmer DWJr. , Lemeshow S , Sturdivant RX ((2013) ) Applied Logistic Regression, John Wiley & Sons, Inc, Hoboken, NJ, USA. |
[30] | Ponjoan A , Garre-Olmo J , Blanch J , Fages E , Alves-Cabratosa L , Martí-Lluch R , Comas-Cufí M , Parramon D , Garcia-Gil M , Ramos R ((2019) ) Epidemiology of dementia: prevalence and incidence estimates using validated electronic health records from primary care. Clin Epidemiol 11: , 217–228. |
[31] | Cummings J , Mintzer J , Brodaty H , Sano M , Banerjee S , Devanand DP , Gauthier S , Howard R , Lanctôt K , Lyketsos CG , Peskind E , Porsteinsson AP , Reich E , Sampaio C , Steffens D , Wortmann M , Zhong K ; International Psychogeriatric Association ((2015) ) Agitation in cognitive disorders: International Psychogeriatric Association provisional consensus clinical and research definition. Int Psychogeriatr 27: , 7–17. |
[32] | Citrome L ((2017) ) Activating and sedating adverse effects of second-generation antipsychotics in the treatment of schizophrenia and major depressive disorder: absolute risk increase and number needed to harm. J Clin Psychopharmacol 37: , 138–147. |
[33] | Porsteinsson AP , Drye LT , Pollock BG , Devanand DP , Frangakis C , Ismail Z , Marano C , Meinert CL , Mintzer JE , Munro CA , Pelton G , Rabins PV , Rosenberg PB , Schneider LS , Shade DM , Weintraub D , Yesavage J , Lyketsos CG ; CitAD Research Group ((2014) ) Effect of citalopram on agitation in Alzheimer disease: the CitAD randomized clinical trial. JAMA 311: , 682–691. |
[34] | Gallacher J , de Reydet de Vulpillieres F , Amzal B , Angehrn Z , Bexelius C , Bintener C , Bouvy JC , Campo L , Diaz C , Georges J , Gray A , Hottgenroth A , Jonsson P , Mittelstadt B , Potashman MH , Reed C , Sudlow C , Thompson R , Tockhorn-Heidenreich A , Turner A , van der Lei J , Visser PJ ; ROADMAP Consortium ((2019) ) Challenges for optimizing real-world evidence in Alzheimer’s disease: The ROADMAP Project. J Alzheimers Dis 67: , 495–501. |
[35] | Soto-Gordoa M , Arrospide A , Moreno-Izco F , Martínez-Lage P , Castilla I , Mar J ((2015) ) Projecting burden of dementia in Spain, 2010-2050: impact of modifying risk factors. J Alzheimers Dis 48: , 721–730. |
[36] | Janitza S , Hornung R ((2018) ) On the overestimation of random forest’s out-of-bag error. PLoS One 13: , e0201904. |
[37] | Brayne C , Davis D ((2012) ) Making Alzheimer’s and dementia research fit for populations. Lancet 380: , 1441–1443. |
[38] | Zhu CW , Ornstein KA , Cosentino S , Gu Y , Andrews H , Stern Y ((2019) ) Misidentification of dementia in medicare claims and related costs. J Am Geriatr Soc 67: , 269–276. |
[39] | Butt DA , Tu K , Young J , Green D , Wang M , Ivers N , Jaakkimainen L , Lam R , Guttman M ((2014) ) A validation study of administrative data algorithms to identify patients with Parkinsonism with prevalence and incidence trends. Neuroepidemiology 43: , 28–37. |

