
Astrocytic TSPO Upregulation Appears Before Microglial TSPO in Alzheimer’s Disease
Abstract
Background:
In vivo PET/SPECT imaging of neuroinflammation is primarily based on the estimation of the 18 kDa-translocator-protein (TSPO). However, TSPO is expressed by different cell types which complicates the interpretation.
Objective:
The present study evaluates the cellular origin of TSPO alterations in Alzheimer’s disease (AD).
Methods:
The TSPO cell origin was evaluated by combining radioactive imaging approaches using the TSPO radiotracer [125I]CLINDE and fluorescence-activated cell sorting, in a rat model of AD (TgF344-AD) and in AD subjects.
Results:
In the hippocampus of TgF344-AD rats, TSPO overexpression not only concerns glial cells but the increase is visible at 12 and 24 months in astrocytes and only at 24 months in microglia. In the temporal cortex of AD subjects, TSPO upregulation involved only glial cells. However, the mechanism of this upregulation appears different with an increase in the number of TSPO binding sites per cell without cell proliferation in the rat, and a microglial cell population expansion with a constant number of binding sites per cell in human AD.
Conclusion:
These data indicate an earlier astrocyte intervention than microglia and that TSPO in AD probably is an exclusive marker of glial activity without interference from other TSPO-expressing cells. This observation indicates that the interpretation of TSPO imaging depends on the stage of the pathology, and highlights the particular role of astrocytes.
INTRODUCTION
In order to improve the understanding of Alzheimer’s disease (AD) and to identify therapeutic pathways, it is important to better understand the neurochemical time course of the pathology. In this sense, amyloid plaques appear before the accumulation of neurofibrillary tangles [1], but it is suggested that these two markers are preceded by neuroinflammation. In fact, data in humans and in the hippocampus of the 3×Tg-AD mouse model suggest that neuroinflammation, identified by the upregulation of the 18 kDa Translocator Protein (TSPO), appears before amyloidosis [2–4]. However, even if previous preclinical and clinical PET and SPECT studies have concluded that TSPO is overexpressed in AD [2–42], it is difficult to draw conclusions on the pathophysiological significance of TSPO alterations unless we have a better understanding of the cell types that produce these TSPO alterations. Indeed, while the TSPO was historically defined as a marker of microglial activity, it is now recognized that it is expressed in other cell types including astrocytes and endothelial cells [4, 20, 43–46]. Thus, the understanding of the biological implications of TSPO alterations in disease is limited by the fact that the cellular origin of this phenomenon cannot be identified with molecular imaging. It is even probable that several cell types participate in the observed overexpression of TSPO in AD. In humans and mouse models, several immunohistochemical studies have shown the colocalization of TSPO with astrocytes and/or microglia but 1) they do not seek to determine the neuronal and endothelial fraction of TSPO and 2) they do not allow the in-depth study of the sources of TSPO increase (i.e., variation in TSPO density per cell, variation in the number of cells that express TSPO). In addition, preclinical models did not show the same colocalization: a purely APP model shows an expression related to astrocytes [20], combined APP-PS1 models show an expression related to microglia [30, 39], a purely Tau model shows an expression mainly in microglia [20] and the 3×Tg-AD mouse model (which combines tau and amyloid transgenes) exhibits the presence of TSPO in both astrocytes and microglial cells [4].
The major aim of this study was to identify the involvement of astrocytes, microglia, and endothelial cells in the overexpression of TSPO in AD, to better understand the neuroinflammatory phenomenon in AD, using the technique of FACS-RTT (fluorescence-activated cell sorting to radioligand-treated tissues) that we have recently developed [47]. Firstly, we assessed the TSPO cellular origin in the TgF344-AD rat model of AD. Secondly, we used the FACS-RTT approach on human temporal cortex samples to extend previous findings on the cells that are responsible for TSPO upregulation in the frontal cortex in human AD [47].
Outside of the brain, some studies have also suggested the use of TSPO as a peripheral inflammatory marker [48–51]. Interestingly in AD, an increase in inflammatory markers has been observed in various peripheral organs [52, 53]. Thus, to determine which tissue is the first to overexpress TPSO, our study extends to different peripheral organs: the eyes due to the accumulation of amyloid in relation to the pathology [54], intestines (given the presence of inflammation in AD) [53], and liver and spleen (given that they show hypertrophy in a model of the disease) [55].
MATERIALS AND METHODS
Animals
Hemizygote Fisher 344 rats (TgF344-AD) harboring the APPswe and PS1ΔE9 transgenes aged 12 or 24 months (n = 8/group) and their controls were housed in a 12 h light-dark cycle with food and water provided ad libitum. The female/male ratio was 1/1. All experimental procedures were approved by the Ethics Committee for Animal Experimentation of the Canton of Geneva, Switzerland. Data are reported in accordance with Animal Research: Reporting In vivo Experiments (ARRIVE) guidelines.
Human brain samples
Frozen human brain samples (n = 9/group) were used for the FACS-RTT procedure and the measure of TSPO polymorphism as previously described [47] with the agreement of the Cantonal Commission for Research Ethics (CCER) of the Canton of Geneva. Clinical variables of donors (age, gender, Tspo polymorphism, Braak stage) are given in Table 1. The TSPO rs6971 polymorphism must be considered because it induces modifications in the affinity of ligands for TSPO. Thus, the subjects are classified as high affinity binders (HAB, absence of the rs6971 polymorphism), mixed affinity binders (MAB, heterozygous for this polymorphism) and low affinity binders (LAB, homozygous for the rs6971 polymorphism). LAB subjects were excluded from the analyses.
Table 1
Details of control and AD subjects
| Group | Braak stage | Age | HAB/MAB | Sex | PM delay (h) |
| Control | 1.8±0.71 | 85.6±8.23 | 6/2 | 5 m/3 f | 11.4±8.53 |
| Alzheimer | 5.2±0.67*** | 89.1±8.74 | 4/5 | 5 m/4 f | 9.5±5.81 |
Mean±SD; ***p < 0.001, chi-squared test. PM, postmortem.
2.3[125I]CLINDE administrations
The synthesis and purification of [125I]CLINDE, a TSPO radiotracer, was previously described [4, 56]. Rats received an i.v. [125I]CLINDE injection (27.27±2.65 MBq) and were euthanized at 1 h post-injection. Their brains were quickly removed and dissected to isolate the hippocampus, the frontal cortex, the striatum, the cerebellum, and the rest of the brain (called the “brain residue” in the rest of the document). The eyes, the spleen, the left kidney, and a sample of liver, duodenum, and distal colon were also isolated. The radioactive concentration in extracts was measured on an automatic γ counting system.
Human brain samples were dissociated (see the protocol below) and exposed to [125I]CLINDE (1.85 MBq). The radioactive concentration in human samples was measured on an automatic γ counting system before the FACS procedure.
Cell suspensions
The cell dissociation and antibody staining protocols were previously described [47, 57]. Briefly, following tissue collection, mechanical and enzymatic separations were performed accordingly to the manufactured protocol (MACS Neural tissue dissociation kit, Miltenyi Biotec). In addition, a myelin depletion step was performed to eliminate myelinated debris that can interfere with cell staining and cell sorting, as described previously in the rat brain hippocampus [57]. Different antibodies have been selected for cell sorting with commonly used targets in FACS [57–60]: the astrocytic glutamate transporter-1 (GLT1), the microglial cluster of differentiation 11b and 45 (CD11b, CD45), the endothelial cluster of differentiation 31 (CD31), the neuronal cluster of differentiation 90 (CD90). These antibodies are mostly given as being specific to rats or humans, so different antibodies have been selected. Coupling with fluorochromes (FITC, APC, etc.) was also chosen in order to clearly distinguish cell “color” during cell sorting. Thus, cells from the rat hippocampus were treated with APC-conjugated anti-rat CD11b (1/800; Biolegend), FITC-conjugated anti-rat CD90 (1/250; Biolegend), PE-Cy7-conjugated anti-rat CD31 (1/100; Invitrogen) and rabbit anti-GLT1 (1/100; Novus) to identify microglia, neurons, endothelial and astrocytes, respectively. Human cells were treated with BV 421-conjugated anti-human CD45 (1/800; BD Horizon), PE-Cy7-conjugated anti-human CD31 (1/100; Invitrogen) and rabbit anti-GLT1 (1/100; Novus) antibodies for the identification of microglia, neurons, endothelial and astrocytes, respectively. As the anti-GLT1 antibody was not coupled with a fluorochrome, a secondary antibody (PE-conjugated goat anti-rabbit; 1/500; Life technologies) was then applied after a washing step. For the human samples, cells were treated with [125I]CLINDE, followed by a washing step, before the addition of antibodies.
Fluorescence activated cell sorting (FACS)
Rat dead cells were excluded using a DAPI staining during data collection. The validation of the FACS protocol was made previously in terms of median fluorescent intensity, interferences between fluorochromes, detection of each fluorochrome, drawing gates of cell sorting, detection of single cells and specificity of astrocytes and microglial cells sorted [47]. Cells were counted and sorted by FACS (Beckman Coulter MoFlo Astrios) accordingly to negative and positive selections. Negative selections consist of the elimination of autofluorescent cells, CD90 positive cells and non-fluorescent cells negative for antibodies. The positive selection consists of the isolation of CD45/CD11b cells (negative for both GLT1 and CD31), GLT1 cells (negative for both CD45/CD11b and CD31) and CD31 cells (negative for both CD45/CD11b and GLT1).
Radioactivity measurements
A gamma counter was used to measure the radioactivity in rat and human samples. Following the brain tissue and organ isolations, tissues were weighted and the radioactivity was measured. The radioactivity measurements also took place at two stages on the cells: before and after separation by FACS. Data are expressed as the radioactivity corrected by the injected dose and the mass of the tissue (injected dose/g of tissue) or the number of cells (injected dose/cell).
Immunohistochemistry and immunofluorescence
Three 12-months old TgF344-ad rats (2 females and 1 male) were transcardially perfused with 0.9% saline under 3% isoflurane anesthesia. Brains were removed, post-fixed (4% paraformaldehyde, 4°C, overnight), cryoprotected (sucrose gradient, 5–20%, 48 h), frozen in pre-cooled isopentane, cut in a cryostat and stored as free-floating slices (30μm) in 1× PBS 0.05% azide. Samples were treated for immunochemistry or double-immunofluorescence as previously described [4]. Briefly, free-floating slices were treated with the mouse anti-β amyloid 4G8 (1/500, 4°C, overnight, Biolegend, San Diego) and with the corresponding secondary antibody. Sections were then treated with DAB and cresyl violet. Images were acquired (Zeiss Axioscan.Z1 with the Zen2 software, Zeiss) and analyzed with ImageJ (5 sections/region). For double-immunofluorescence, free-floating slices were treated with the goat anti TSPO (1/100, 4°C, overnight, Abcam ab118913) and with either the mouse anti-GFAP-Cy3 (1/1000, Sigma C9205), the rabbit anti-IBA1 (1/600, Wako 019-19741) or the mouse anti-CD31 (1/200, Dako M0823) and then with the corresponding Alexa 555- or Alexa 488-labeled secondary antibody. Images were acquired with the Leica DMi8 fluorescence light microscope.
Statistical analyses
Samples were treated at blind conditions. A sample size analysis with the graphical Douglas Altman’s nomogram approach [61] was performed, and significant data was only reported if p≤0.05 and β<0.2. A planned comparison (unpaired two-tailed Student’s t-tests) was used to identify group differences only when group×cell type interaction was significant (two-way ANOVA) using Statistica software (Statistica 8.0, StatSoft). Differences in clinical variables of donors between control and AD groups were analyzed using an unpaired two-tailed Student’s t-test (age, postmortem delay), a chi-squared test (gender, Tspo polymorphism) or a chi-squared test for trend (Braak stage) combining 0/I/II, II/IV and V/VI stages.
RESULTS
Increases in TSPO levels are first observed in the hippocampus
In comparison with wild-type (WT) animals, an increase in TSPO levels in the hippocampus of TgF344-AD rats was observed at the age of 12 months (p < 0.05) and is exacerbated at 24 months (p < 0.001, Fig. 1A). An upregulation in the TSPO levels between 12 and 24 months is observed in TgF344-AD rats (p < 0.01) and is absent in WT. In frontal cortex, striatum, cerebellum, and brain residue, TSPO levels were higher in 24-month-old TgF344-AD rats as compared to all the other groups (Fig. 1B).
Fig. 1
TSPO overexpression in the brain and in peripheral organs in TgF344-AD rats. The ex vivo measures of [125I]CLINDE concentrations (% injected dose -ID-/g of tissue) were performed in the hippocampus (A), in various brain areas (B), in the eyes (C), and in various peripheral organs (D) in wild-type (WT) and TgF344-AD rats at the age of 12 and 24 months. [125I]CLINDE concentrations were analyzed by two-way ANOVA. Post hoc tests indicate genotype differences at the same age (★ ) and age effects in TgF344-AD (∞). The number of symbols indicates the significance level (1: p < 0.05; 2: p < 0.01; 3: p < 0.001). Mean±SEM of 8 animals per genotype and per age are presented. BRes., brain residue; Cer., cerebellum; Col., colon; Cx, frontal cortex; Duo., proximal duodenum; Kid., kidney; Liv., liver; Spl., spleen; Stria., striatum.
![TSPO overexpression in the brain and in peripheral organs in TgF344-AD rats. The ex vivo measures of [125I]CLINDE concentrations (% injected dose -ID-/g of tissue) were performed in the hippocampus (A), in various brain areas (B), in the eyes (C), and in various peripheral organs (D) in wild-type (WT) and TgF344-AD rats at the age of 12 and 24 months. [125I]CLINDE concentrations were analyzed by two-way ANOVA. Post hoc tests indicate genotype differences at the same age (★ ) and age effects in TgF344-AD (∞). The number of symbols indicates the significance level (1: p < 0.05; 2: p < 0.01; 3: p < 0.001). Mean±SEM of 8 animals per genotype and per age are presented. BRes., brain residue; Cer., cerebellum; Col., colon; Cx, frontal cortex; Duo., proximal duodenum; Kid., kidney; Liv., liver; Spl., spleen; Stria., striatum.](https://content.iospress.com:443/media/jad/2020/77-3/jad-77-3-jad200136/jad-77-jad200136-g001.jpg)
At the periphery, only the TSPO of the eyes is increased at the age of 24 months, as compared to 12-month-old TgF344-AD rats (p < 0.01) and WT (p < 0.01, Fig. 1C). None of the other studied organs (liver, spleen, distal colon, and duodenum) showed any modification of the TSPO as compared to WT (Fig. 1D). An increase in TSPO in duodenum is observed in 24-month-old as compared to 12-month-old TgF344-AD rats (p < 0.05).
Astrocytes and microglia mediate the TSPO binding increases in the hippocampus
As we did not observe any age effect on TSPO levels (as measured by the ex vivo binding in the hippocampus) in WT rats, we included only 24-month-old WT rats in the cell separation protocol. As shown in Fig. 1, TgF344-AD rats of both ages show higher TSPO levels than 24-month-old WT.
Using both positive and negative selections using a set of antibodies (see details in the Methods section), astrocytes, microglia, and endothelial cells were isolated. TSPO detection in cell population, at cell level and the number of cells sorted in WT and TgF344-AD rats is presented in Fig. 2.
Fig. 2
Cell origin identification of TSPO overexpression in the hippocampus of TgF344-AD rats. The [125I]CLINDE concentrations were determined in 24-month-old wild-type animals (WT) and in 12- and 24-month-old (12 m and 24 m) TgF344-AD rats. A) Radioactivity was determined in GLT1+ (astrocytes), CD11b+ (microglia), and CD31+ (endothelial cells) cell population (% injected dose/g of tissue). B) Radioactivity per cell (% injected dose/cell) in each cell population. C) number of cells sorted. [125I]CLINDE concentrations and cell number were analyzed by two-way ANOVA. Post hoc tests indicate genotype differences (★ ) and age effects in TgF344-AD (∞). The number of symbols indicates the significance level (1: p < 0.05; 2: p < 0.01; 3: p < 0.001). Mean±SEM of 8 animals per genotype and per age are presented.
![Cell origin identification of TSPO overexpression in the hippocampus of TgF344-AD rats. The [125I]CLINDE concentrations were determined in 24-month-old wild-type animals (WT) and in 12- and 24-month-old (12 m and 24 m) TgF344-AD rats. A) Radioactivity was determined in GLT1+ (astrocytes), CD11b+ (microglia), and CD31+ (endothelial cells) cell population (% injected dose/g of tissue). B) Radioactivity per cell (% injected dose/cell) in each cell population. C) number of cells sorted. [125I]CLINDE concentrations and cell number were analyzed by two-way ANOVA. Post hoc tests indicate genotype differences (★ ) and age effects in TgF344-AD (∞). The number of symbols indicates the significance level (1: p < 0.05; 2: p < 0.01; 3: p < 0.001). Mean±SEM of 8 animals per genotype and per age are presented.](https://content.iospress.com:443/media/jad/2020/77-3/jad-77-3-jad200136/jad-77-jad200136-g002.jpg)
TSPO from the astrocyte cell population is overexpressed at the age of 12 months (Fig. 2A, p < 0.05) and is persistent at 24 months (p < 0.01). In addition, we observed an increase in the number of TSPO binding sites per astrocyte at both ages as compared to the WT (Fig. 2B). The number of astrocytes is constant between experimental groups (Fig. 2C).
TSPO from the microglial cell population is only overexpressed at the age of 24 months as compared to the WT (p < 0.01) and to 12-month-old TgF344-AD rats (p < 0.05, Fig. 2A). The number of TSPO binding sites per microglial cell is increased at both 12 and 24 months in TgF344-AD rats as compared to WT (Fig. 2B). The density of microglia is constant between experimental groups (Fig. 2C).
TSPO from the endothelial cell population did not appear altered in TgF344-AD rats as compared to WT (Fig. 2A–C).
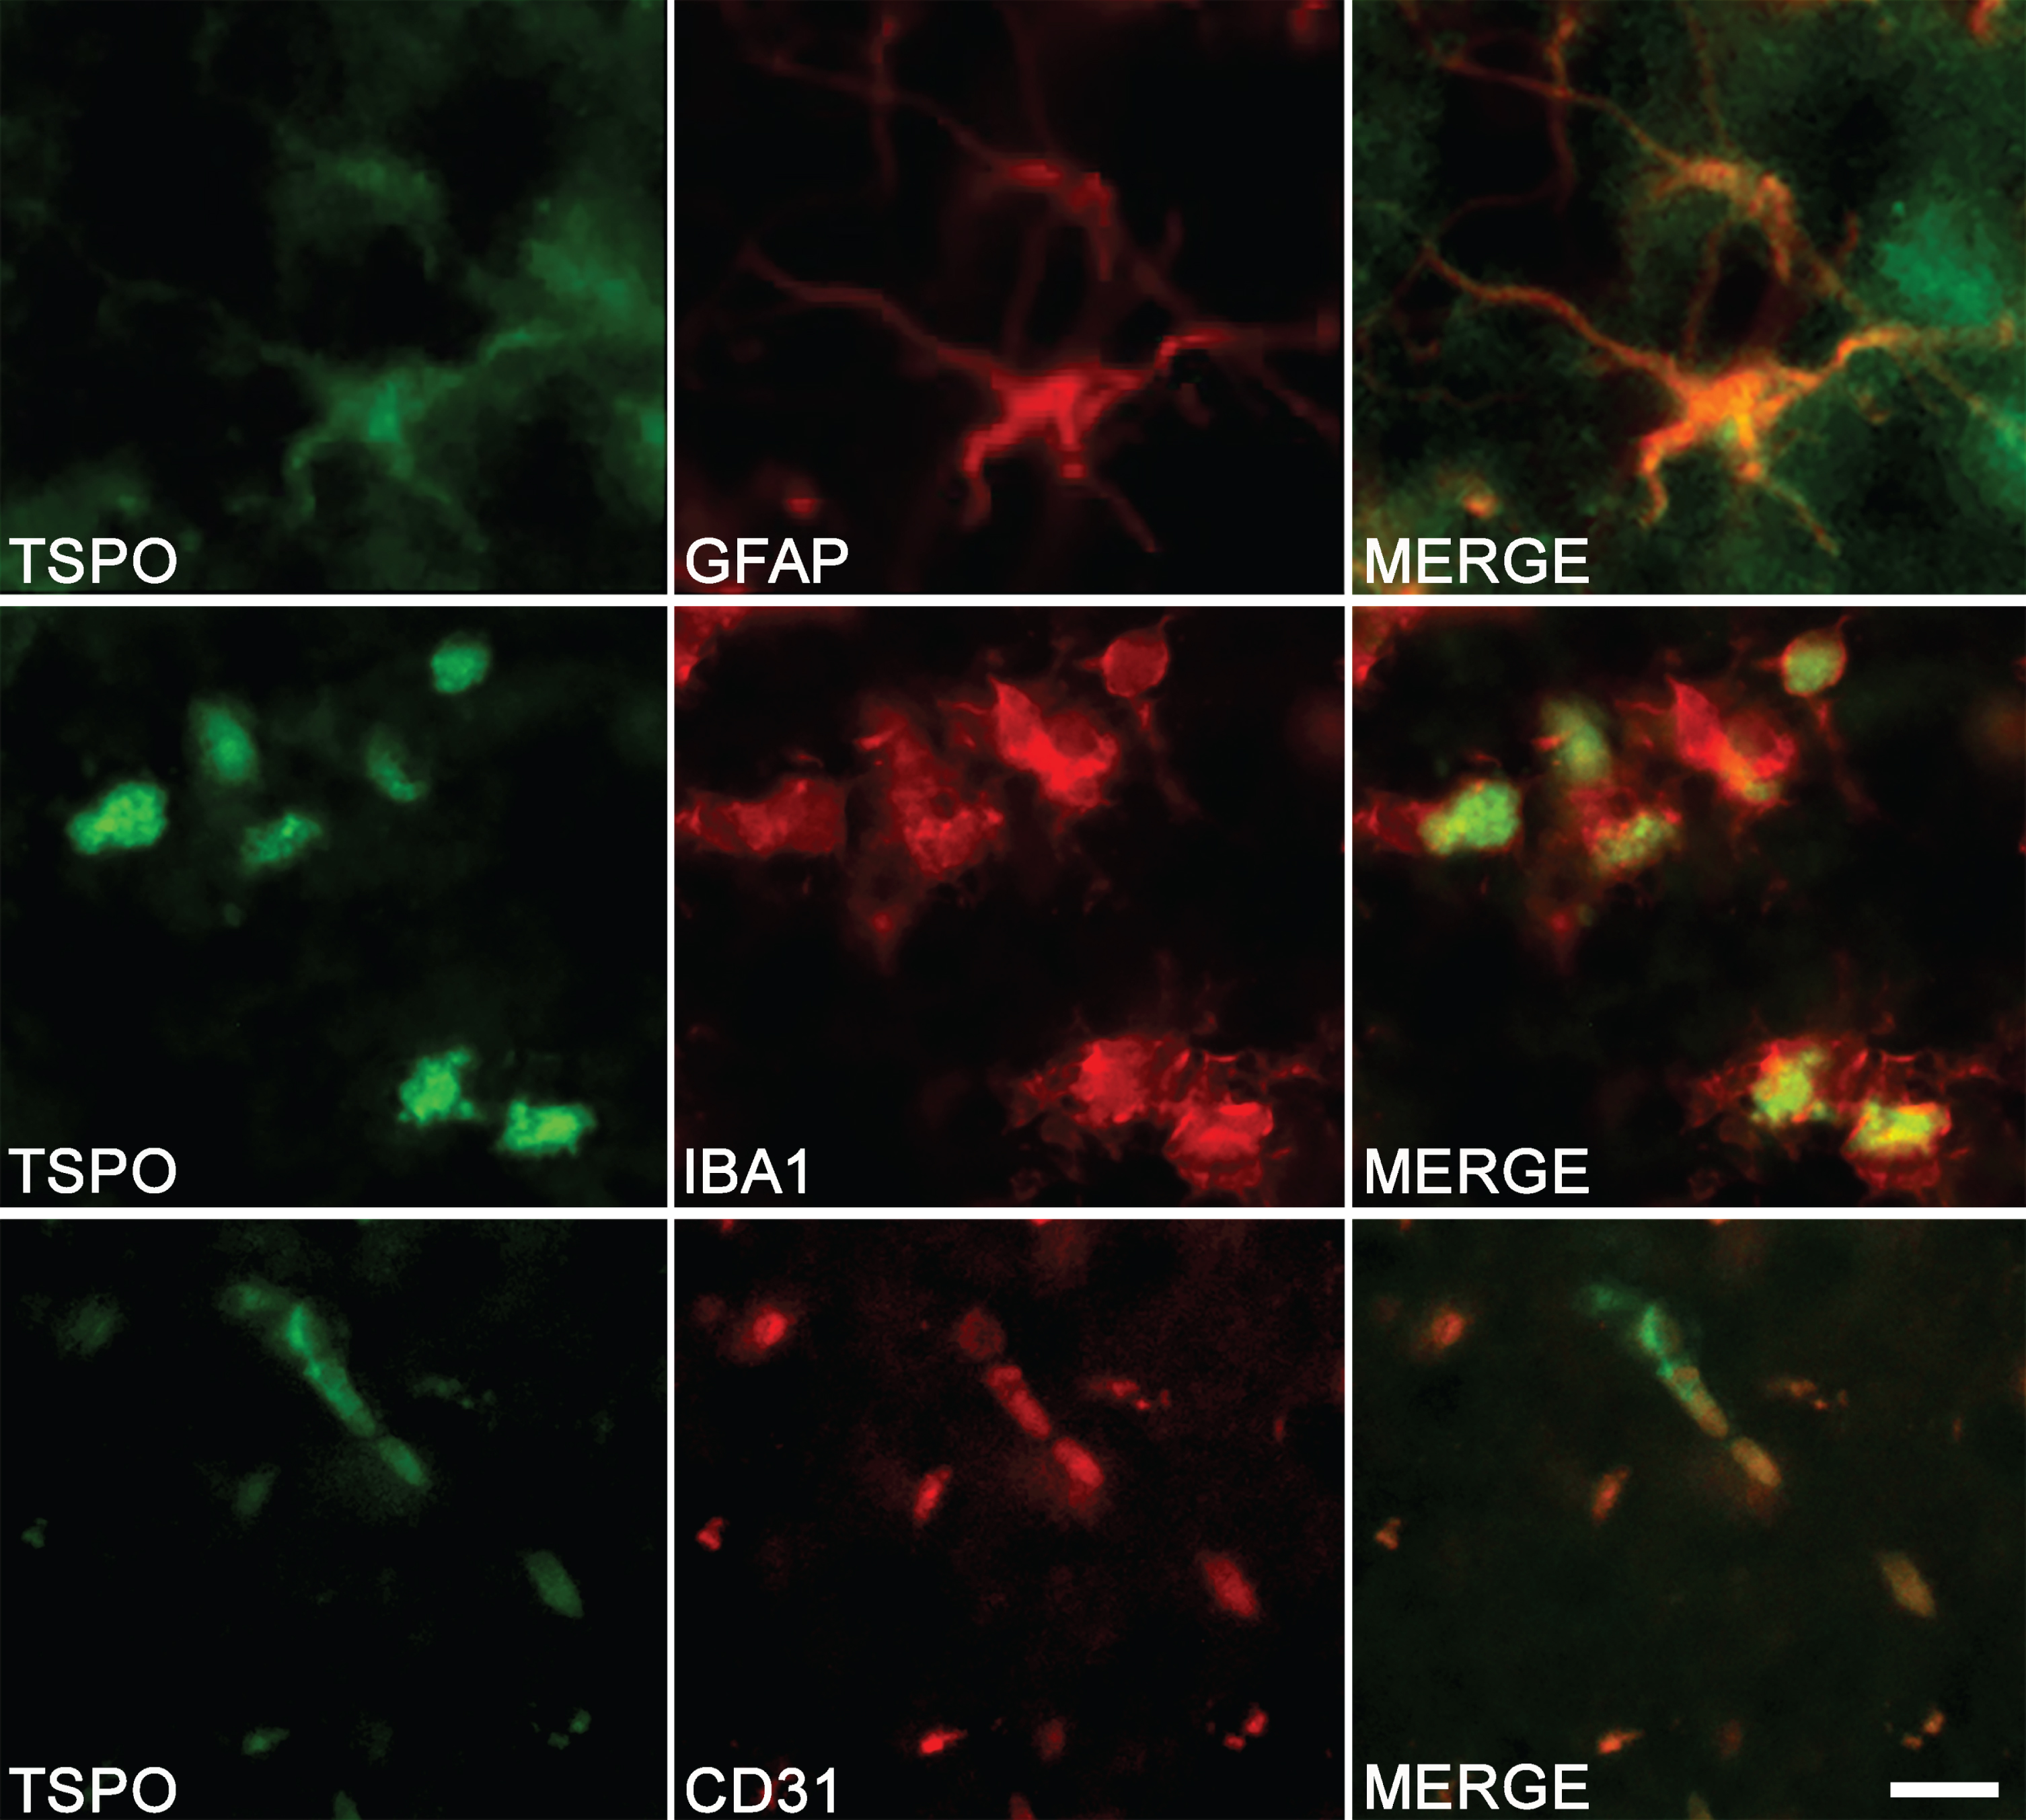
The colocalization observed by immunostaining between TSPO and specific markers of astrocytes (GFAP), microglia (IBA1), and endothelial cells (CD31) confirms the multi-cellular origin of TSPO (Fig. 3).
Fig. 3
Cell origin confirmation of TSPO expression in the hippocampus of TgF344-AD rats. Double-immunofluorescence was performed with antibodies directed against TSPO (green color) and specific cell markers (red color). Merge images demonstrate the colocalization of TSPO with astrocytes (GFAP), microglia (IBA1), and endothelial cells (CD31). Scale bar: 10μm.
The hippocampus showed the higher levels of amyloid deposits at 12 months of age
A positive A4G8 labeling is observed in all analyzed regions of the brain (see Supplementary Figure 1). The morphology of the staining clearly shows the presence of extracellular deposits. However, the hippocampus shows a higher density of Aβ deposits than all other regions (Supplementary Fig. 1, p < 0.01).
Astrocytes and microglia mediate the TSPO binding increases in the human temporal cortex
No difference was observed in terms of sex ratio, age and postmortem delay, but AD subjects showed a significantly higher Braak stage (χ2 = 15.7, p < 0.001, Table 1). A control sample was excluded from the analyses because it was homozygous for the TSPO rs6971 polymorphism [62]. The human temporal cortex showed an increase in TSPO binding in AD subjects as compared to controls (% ID/g of tissue±SD: 2.6±1.4 versus 1.3±0.5; p < 0.05). The cell sorting revealed that this elevation is due to both astrocytes (p < 0.05) and microglia (p < 0.05, Fig. 4A). Astrocytes did not show either an increase in TSPO binding site per cell or cell expansion (Fig. 4B, C). In contrast, there was a significant microglial cell population expansion (p < 0.05) without any change in the number of TSPO binding sites per cell (Fig. 4B, C).
Fig. 4
Determination of the cell origin of TSPO overexpression in temporal cortex of Alzheimer’s disease. The [125I]CLINDE concentrations were determined in the temporal cortex of control and AD subjects. A) Radioactivity was determined in GLT1+ (astrocytes), CD45+ (microglia), and CD31+ (endothelial cells) cell population (% injected dose/g of tissue). B) Radioactivity per cell (% injected dose/cell) in each cell population. C) number of cells sorted. [125I]CLINDE concentrations and cell number were analyzed by two-way ANOVA. Post hoc tests indicate genotype differences (★ p < 0.05). Mean±SEM of 8-9 subjects per group are presented.
![Determination of the cell origin of TSPO overexpression in temporal cortex of Alzheimer’s disease. The [125I]CLINDE concentrations were determined in the temporal cortex of control and AD subjects. A) Radioactivity was determined in GLT1+ (astrocytes), CD45+ (microglia), and CD31+ (endothelial cells) cell population (% injected dose/g of tissue). B) Radioactivity per cell (% injected dose/cell) in each cell population. C) number of cells sorted. [125I]CLINDE concentrations and cell number were analyzed by two-way ANOVA. Post hoc tests indicate genotype differences (★ p < 0.05). Mean±SEM of 8-9 subjects per group are presented.](https://content.iospress.com:443/media/jad/2020/77-3/jad-77-3-jad200136/jad-77-jad200136-g004.jpg)
DISCUSSION
In the TgF344-AD rat, the hippocampus is the first of the regions studied in the present paper to show an upregulation of the TSPO: the overexpression is present at 12 months and amplified at 24 months. On the contrary, the presence of an increase in TSPO is only observed at 24 months in the striatum, the frontal cortex, the cerebellum, the brain residue, and the eyes. At 12 months, amyloid deposit levels are the highest in the hippocampus, as compared to other brain areas. In the hippocampus, we have also demonstrated that TSPO levels are upregulated with age and that the cellular origin of these increases evolves. Indeed, in 12-month-old rats, astrocytes are responsible for TSPO overexpression whereas at 24 months, microglia also participates in this overexpression. This elevation of TSPO binding is associated with an upregulation of the number of TSPO sites per cell without expansion of the number of glial cells. In the temporal cortex of human AD subjects, we showed that the TSPO increases observed at the tissue level are due to astrocytes and microglia, as in the rat, but in human AD, this TSPO upregulation is associated with an expansion of the number of microglial cells.
The presence of TSPO overexpression in AD has been demonstrated in various animal models [4, 18, 20, 25, 29, 30, 34, 36, 39] as well as in clinical [2, 6, 11, 23, 40] and postmortem [10, 47, 63] human studies. However, the understanding of this phenomenon is limited by the presence of a TPSO expression by several cell types such as astrocytes, microglia, neurons, and endothelial cells [64]. At the tissue level, it is difficult to determine the progression of astrocytic versus microglial activity in terms of TPSO expression. However, providing a cellular resolution to the analyses is extremely important because of the heterogeneity of the physiological roles played by the different cell types of the brain. For this purpose, we have recently developed the FACS-RTT technique to identify the cell origin of the CLINDE binding [47]. The specificity of the CLINDE binding was previously demonstrated using a competitive inhibition approach [47]. In TgF344-AD rats, we show here that astrocytes are the first cell population to upregulate TSPO and then, as the pathology progresses, an increase in microglia cell population is also observed. In both cases, these increases are due to an increase in the number of sites per cell. These observations are important for our understanding of the pathology and show that the SPECT/PET signal does not always have a unique biological origin (in this case, the TSPO signal alterations are not solely attributed to microglia or astrocytes). Our observation of an upregulation of TSPO in astrocytes before microglia may suggest that astrocytes are involved earlier in AD pathology than microglia. Our hypothesis is consistent with previous studies showing the appearance of reactive astrocytes several months before reactive microglia [65–67] and the presence of an astrocytosis from the mild cognitive impairment stage in AD patients [68]. As astrocyte reactivity is modified by the presence of amyloid [69–71], the cellular stage of the pathology could be marked by a modification of astrocytic functions in connection with the upregulation of TSPO. With the progression of the pathology, inflammation spreads to other areas of the brain, microglial cells become active [66] and the origin of the increase in TSPO now involves microglia in addition to astrocytes. This could mark the transition to toxic forms of astrocytes and microglia leading to neurodegeneration [72–74]. The presence of a cell death in the brain of TgF344-AD rats at advanced stages of the pathology supports this idea [75]. In addition, a transition from a rather protective microglia phenotype (M2) to a deleterious microglial phenotype (M1) occurs late in the pathology [76]. However, the majority of studies showed that TSPO seems to be only expressed in the M1-type microglia [77–79] which could explain the late onset of microglial TSPO in the rat, but another study has seen its presence in M2 [25]. It is also important to notice that not all astrocytes and microglial phenotypes were analyzed in terms of TSPO expression. Indeed, a continuum of forms of phenotypes exists between the pro-inflammatory 1 and anti-inflammatory 2 subcategories, and the recently observed identification of particular gene expression profiles has made it possible to identify new sets such as “disease-associated microglia” or “senescent astrocytes” [80–85]. It is possible that the appearance of these different forms over the course of the pathology contributes to alterations in the TSPO signal. Another complementary possibility may be the time of onset of the neurofibrillary tangles. In the TgF344-AD rat, their absence at the age of 6 months and their presence at the age of 16 months has been shown [75]. It is therefore possible that the presence of a tau alteration and the appearance of neurofibrillary tangles, which are known to influence inflammation [86], also play a role in the appearance of astrocyte and microglial TSPO. Thus, in order to find potential avenues for therapeutic intervention, it will be preferable to no longer consider the glia-mediated inflammation at the tissue level but to consider cell type-specific approaches. Supporting this hypothesis, a specific modulation of the reactive state of astrocytes without any modification in microglia has allowed to improve synaptic function and cognitive symptoms and decrease amyloid deposits [87]. Thus, astrocytes could be a preferred target of neuroinflammation in the first stages of AD.
Numerous In vivo studies have shown the involvement of TSPO in AD but the cellular origin remains little or not determined. We showed that TSPO is overexpressed in astrocytes and microglia in the temporal cortex of AD subjects. This observation was made from AD and control subjects whose frontal cortex were used in a first study [47]. Interestingly, these two independent experiments conclude in the same way: increase in TSPO in astrocytic and microglial populations with an increase in the number of microglia. This double confirmation (2 tissues, 2 independent experiments) makes it possible to hypothesize that, at least in the human AD cortex, alterations in TSPO only involve glial cells. Thus, although it is not possible to determine in human samples which of the astrocytes or microglia occurs first in terms of TSPO overexpression in the present study, our observations in rats and humans are concomitant with each other. Therefore, activated glia represents the source of overexpression of TSPO, without involvement of other cell types. Thus, TSPO is most probably a biomarker of glial reaction in AD. Nevertheless, the functional effects that it induces in astrocytes and microglia are not necessarily the same and will have to be the object of future investigations. It is also important to note that the molecular mechanisms involved for the upregulation TSPO are different between the rat model and humans: in the first case, the number of sites per cell increases without cell proliferation and in the second case, the number of sites per cell remains constant in the presence of an expansion in the number of microglial cells. The absence of a variation of the number of astrocytic cells [88, 89] and the expansion of the microglial cell population [90, 91] previously described in AD reinforce our observations. Considering microglia, the difference between increased numbers of cells in humans and increased numbers of TSPO sites in animals may reflect intrinsic differences between species. In fact, the rate of renewal of murine microglia is very different from that of human microglia, suggesting that their response to the chronic presence of pathogenic factors may differ [92]. In culture, the presence of proinflammatory factors in the medium increased or had no effect on the expression of TSPO according to whether the microglia is of murine or human origin, respectively [79]. Thus, the responsiveness of microglia in terms of TSPO may reflect more general differences between human and murine microglia. In a similar manner, the changes in microglial gene expression during aging shows little overlap between human and murine microglia [83]. However, when measuring the inflammatory response to an injection of LPS directly into the brain, we observed an increase in the number of microglial cells [47]. This observation indicates the ability of the rat brain to show an expansion in the number of microglial cells or in the number of TSPO sites per microglial cell. Thus, it is possible that the type of response depends not only on the animal model considered but also on the type of inflammation (i.e., acute versus chronic). In this same idea, we observed that the cellular origin of the overexpression of TSPO depended on the type of molecule injected [47]. Overall, this data suggests that the results of studies in animal models of AD should be carefully extrapolated to the human pathology, taking such interspecies differences into account.
Functional links between amyloid and TSPO have previously been implicated by the demonstration of a positive correlation between TSPO and amyloid levels in humans and in AD mice [2, 4, 9, 93, 94]. The present study on TSPO levels is the first one conducted in the TgF344-AD rat model and we showed that the hippocampus is the first of the brain regions to overexpress TSPO. Interestingly, the hippocampus is also the region showing the higher Aβ deposit concentration. It is therefore possible that the evolution of the number of amyloid plaques follows that of the TSPO density in the TgF344-AD rat, as suggested in previous preclinical and clinical studies [2, 4, 13, 93, 94]. In contrast, the positive correlation observed between TSPO and tau in the P301S Tau transgenic mice [29] seems to be absent in humans [32]. Future studies should decipher the relationships between TSPO, tau, and Aβ. In addition, the presence of amyloid accumulation in TgF344-AD will have to be analyzed in more depth than on the basis of 4G8-immunoreactivity alone. Indeed, even if this antibody is very widely used in research and in diagnosis, it should be noted that it also has a labeling for the precursor of the amyloid [95].
Finally, we also included in this study an assessment of TSPO binding alterations in several peripheral organs, hypothesizing that TSPO imaging could also be a potential biomarker of inflammation in peripheral organs in AD. Among the brain regions and the peripheral organs that were assessed in this study, a TSPO upregulation concerns primarily the hippocampus and later the other brain regions and the eyes. It is interesting to note that the eyes also show amyloid deposits [54], suggesting a potential relationship between amyloid deposits and TSPO upregulation in tissues beyond the brain, which should be further confirmed and investigated. However, as the upregulation of TSPO in the eyes does not predate that of the hippocampus, this index does not seem to be a potential early marker of the pathology.
Two limitations can be made to the interpretation of our data. Firstly, measurements of CLINDE concentrations in the brain and peripheral organs are expressed as a percentage of the dose injected per g of tissue. These values do not take into account the concentration of the free CLINDE in the blood. However, we observed that the plasma/whole blood ratio of CLINDE is decreased in TgF344-AD rats aged 10 months as compared to their controls (personal observation). Thus, the data obtained here could underestimate the increases in TSPO in TgF344-AD. Secondly, given the biological roles of TSPO other than inflammation in the peripheral organs, the interpretation of its signal must be done with caution. In our study, it is possible that the absence of alteration of TSPO indicates the absence of an inflammatory reaction large enough to be detected, but we cannot exclude the possibility of a masking effect. However, previous imaging studies of TSPO had revealed an alteration of peripheral TSPO in different organs and in different pathologies [48–51, 96].
In conclusion, our study provides new information on the time course of astrocyte and microglia reactivity, with regard to the expression of TSPO. This observation is based on the hypothesis of an earlier involvement of reactive astrocytes than active microglia in AD, which opens new avenues for therapeutic studies. In humans, we showed that only glial cells participate in TSPO alterations and our data, in agreement with those previously obtained in the frontal cortex [47], confirms the translational character of TSPO from astrocytes and microglia in the pathology. However, the molecular mechanisms involved are different: in rats, the number of targets per cell is upregulated while in AD patients, it is the number of cells expressing TSPO that increases. Our observations tend to show that different therapeutic windows exist specifically targeting astrocytes at the beginning of pathology, then astrocytes and microglia in more advanced stages.
ACKNOWLEDGMENTS
We are grateful to Maria Surini, Marouane Ben Ammar and Jean-Pierre Aubry-Lachainaye for technical assistance. Author ST received support from the “Maria Zaousi” Memorial Foundation through the Greek State Scholarship Foundation and the Jean and Madeleine Vachoux Foundation; authors BBT and KC are supported by the Velux foundation (project n. 1123). Authors also thank the Rat Resource and Research Center (RRRC, Columbia) for providing the rat model. This work was supported by the Swiss National Science Foundation (no. 320030-184713).
Authors’ disclosures available online (https://www.j-alz.com/manuscript-disclosures/20-0136r4).
SUPPLEMENTARY MATERIAL
[1] The supplementary material is available in the electronic version of this article: https://dx.doi.org/10.3233/JAD-200136.
REFERENCES
[1] | Drew L ((2018) ) An age-old story of dementia. Nature 559: , S2–S3. |
[2] | Hamelin L , Lagarde J , Dorothee G , Leroy C , Labit M , Comley RA , de Souza LC , Corne H , Dauphinot L , Bertoux M , Dubois B , Gervais P , Colliot O , Potier MC , Bottlaender M , Sarazin M , Clinical IMABio3 team ((2016) ) Early and protective microglial activation in Alzheimer’s disease: A prospective study using 18F-DPA-714 PET imaging. Brain 139: , 1252–1264. |
[3] | Hamelin L , Lagarde J , Dorothee G , Potier MC , Corlier F , Kuhnast B , Caille F , Dubois B , Fillon L , Chupin M , Bottlaender M , Sarazin M ((2018) ) Distinct dynamic profiles of microglial activation are associated with progression of Alzheimer’s disease. Brain 141: , 1855–1870. |
[4] | Tournier BB , Tsartsalis S , Rigaud D , Fossey C , Cailly T , Fabis F , Pham T , Gregoire MC , Kovari E , Moulin-Sallanon M , Savioz A , Millet P ((2019) ) TSPO and amyloid deposits in sub-regions of the hippocampus in the 3xTgAD mouse model of Alzheimer’s disease. Neurobiol Dis 121: , 95–105. |
[5] | Blume T , Focke C , Peters F , Deussing M , Albert NL , Lindner S , Gildehaus FJ , von Ungern-Sternberg B , Ozmen L , Baumann K , Bartenstein P , Rominger A , Herms J , Brendel M ((2018) ) Microglial response to increasing amyloid load saturates with aging: A longitudinal dual tracer In vivo muPET-study. J Neuroinflammation 15: , 307. |
[6] | Cagnin A , Brooks DJ , Kennedy AM , Gunn RN , Myers R , Turkheimer FE , Jones T , Banati RB ((2001) ) In vivo measurement of activated microglia in dementia. Lancet 358: , 461–467. |
[7] | Calsolaro V , Edison P ((2016) ) Neuroinflammation in Alzheimer’s disease: Current evidence and future directions. Alzheimers Dement 12: , 719–732. |
[8] | Chaney A , Bauer M , Bochicchio D , Smigova A , Kassiou M , Davies KE , Williams SR , Boutin H ((2018) ) Longitudinal investigation of neuroinflammation and metabolite profiles in the APPswe xPS1Deltae9 transgenic mouse model of Alzheimer’s disease. J Neurochem 144: , 318–335. |
[9] | Chaney A , Williams SR , Boutin H ((2019) ) In vivo molecular imaging of neuroinflammation in Alzheimer’s disease. J Neurochem 149: , 438–451. |
[10] | Cosenza-Nashat M , Zhao ML , Suh HS , Morgan J , Natividad R , Morgello S , Lee SC ((2009) ) Expression of the translocator protein of 18 kDa by microglia, macrophages and astrocytes based on immunohistochemical localization in abnormal human brain. Neuropathol Appl Neurobiol 35: , 306–328. |
[11] | Edison P , Archer HA , Gerhard A , Hinz R , Pavese N , Turkheimer FE , Hammers A , Tai YF , Fox N , Kennedy A , Rossor M , Brooks DJ ((2008) ) Microglia, amyloid, and cognition in Alzheimer’s disease: An [11C](R)PK11195-PET and [11C]PIB-PET study. Neurobiol Dis 32: , 412–419. |
[12] | Edison P , Donat CK , Sastre M ((2018) ) In vivo imaging of glial activation in Alzheimer’s disease. Front Neurol 9: , 625. |
[13] | Fan Z , Aman Y , Ahmed I , Chetelat G , Landeau B , Ray Chaudhuri K , Brooks DJ , Edison P ((2015) ) Influence of microglial activation on neuronal function in Alzheimer’s and Parkinson’s disease dementia. Alzheimers Dement 11: , 608–621 e607. |
[14] | Fan Z , Harold D , Pasqualetti G , Williams J , Brooks DJ , Edison P ((2015) ) Can studies of neuroinflammation in a TSPO genetic subgroup (HAB or MAB) be applied to the entire AD cohort? J Nucl Med 56: , 707–713. |
[15] | Focke C , Blume T , Zott B , Yuan Shi Y , Deussing M , Peters F , Schmidt C , Kleinberger G , Lindner S , Gildehaus FJ , Beyer L , von Ungern-Sternberg B , Bartenstein P , Ozmen L , Baumann K , Dorostkar MM , Haass C , Adelsberger H , Herms J , Rominger A , Brendel M ((2019) ) Early and longitudinal microglial activation but not amyloid accumulation predict cognitive outcome in PS2APP mice. J Nucl Med 60: , 548–554. |
[16] | Golla SS , Boellaard R , Oikonen V , Hoffmann A , van Berckel BN , Windhorst AD , Virta J , Haaparanta-Solin M , Luoto P , Savisto N , Solin O , Valencia R , Thiele A , Eriksson J , Schuit RC , Lammertsma AA , Rinne JO ((2015) ) Quantification of [18F]DPA-714 binding in the human brain: Initial studies in healthy controls and Alzheimer’s disease patients. J Cereb Blood Flow Metab 35: , 766–772. |
[17] | Gulyas B , Vas A , Toth M , Takano A , Varrone A , Cselenyi Z , Schain M , Mattsson P , Halldin C ((2011) ) Age and disease related changes in the translocator protein (TSPO) systemin the human brain: Positron emission tomography measurements with [11C]vinpocetine. Neuroimage 56: , 1111–1121. |
[18] | James ML , Belichenko NP , Nguyen TV , Andrews LE , Ding Z , Liu H , Bodapati D , Arksey N , Shen B , Cheng Z , Wyss-Coray T , Gambhir SS , Longo FM , Chin FT ((2015) ) PET imaging of translocator protein (18 kDa) in a mouse model of Alzheimer’s disease using N-(2,5-dimethoxybenzyl)-2-18F-fluoro-N-(2-phenoxyphenyl)acetamide. J Nucl Med 56: , 311–316. |
[19] | Janssen B , Vugts DJ , Funke U , Molenaar GT , Kruijer PS , van Berckel BN , Lammertsma AA , Windhorst AD ((2016) ) Imaging of neuroinflammation in Alzheimer’s disease, multiple sclerosis and stroke: Recent developments in positron emission tomography. Biochim Biophys Acta 1862: , 425–441. |
[20] | Ji B , Maeda J , Sawada M , Ono M , Okauchi T , Inaji M , Zhang MR , Suzuki K , Ando K , Staufenbiel M , Trojanowski JQ , Lee VM , Higuchi M , Suhara T ((2008) ) Imaging of peripheral benzodiazepine receptor expression as biomarkers of detrimental versus beneficial glial responses in mouse models of Alzheimer’s and other CNS pathologies. J Neurosci 28: , 12255–12267. |
[21] | Knezevic D , Mizrahi R ((2018) ) Molecular imaging of neuroinflammation in Alzheimer’s disease and mild cognitive impairment. Prog Neuropsychopharmacol Biol Psychiatry 80: , 123–131. |
[22] | Kreisl WC , Lyoo CH , Liow JS , Wei M , Snow J , Page E , Jenko KJ , Morse CL , Zoghbi SS , Pike VW , Turner RS , Innis RB ((2016) ) (11)C-PBR28 binding to translocator protein increases with progression of Alzheimer’s disease. Neurobiol Aging 44: , 53–61. |
[23] | Kreisl WC , Lyoo CH , McGwier M , Snow J , Jenko KJ , Kimura N , Corona W , Morse CL , Zoghbi SS , Pike VW , McMahon FJ , Turner RS , Innis RB , Biomarkers Consortium PETRPT ((2013) ) In vivo radioligand binding to translocator protein correlates with severity of Alzheimer’s disease. Brain 136: , 2228–2238. |
[24] | Kumar A , Muzik O , Shandal V , Chugani D , Chakraborty P , Chugani HT ((2012) ) Evaluation of age-related changes in translocator protein (TSPO) in human brain using (11)C-[R]-PK11195 PET. J Neuroinflammation 9: , 232. |
[25] | Liu B , Le KX , Park MA , Wang S , Belanger AP , Dubey S , Frost JL , Holton P , Reiser V , Jones PA , Trigg W , Di Carli MF , Lemere CA ((2015) ) In vivo detection of age- and disease-related increases in neuroinflammation by 18F-GE180 TSPO MicroPET imaging in wild-type and Alzheimer’s transgenic mice. J Neurosci 35: , 15716–15730. |
[26] | Lopez-Picon FR , Snellman A , Eskola O , Helin S , Solin O , Haaparanta-Solin M , Rinne JO ((2018) ) Neuroinflammation appears early and then plateaus in a mouse model of Alzheimer’s disease shown by PET imaging. J Nucl Med 59: , 509–515. |
[27] | Lyoo CH , Ikawa M , Liow JS , Zoghbi SS , Morse CL , Pike VW , Fujita M , Innis RB , Kreisl WC ((2015) ) Cerebellum can serve as a pseudo-reference region in Alzheimer disease to detect neuroinflammation measured with PET radioligand binding to translocator protein. J Nucl Med 56: , 701–706. |
[28] | Ma L , Zhang H , Liu N , Wang PQ , Guo WZ , Fu Q , Jiao LB , Ma YQ , Mi WD ((2016) ) TSPO ligand PK11195 alleviates neuroinflammation and beta-amyloid generation induced by systemic LPS administration. Brain Res Bull 121: , 192–200. |
[29] | Maeda J , Zhang MR , Okauchi T , Ji B , Ono M , Hattori S , Kumata K , Iwata N , Saido TC , Trojanowski JQ , Lee VM , Staufenbiel M , Tomiyama T , Mori H , Fukumura T , Suhara T , Higuchi M ((2011) ) In vivo positron emission tomographic imaging of glial responses to amyloid-beta and tau pathologies in mouse models of Alzheimer’s disease and related disorders. J Neurosci 31: , 4720–4730. |
[30] | Mirzaei N , Tang SP , Ashworth S , Coello C , Plisson C , Passchier J , Selvaraj V , Tyacke RJ , Nutt DJ , Sastre M ((2016) ) In vivo imaging of microglial activation by positron emission tomography with [(11)C]PBR28 in the 5XFAD model of Alzheimer’s disease. Glia 64: , 993–1006. |
[31] | Okello A , Koivunen J , Edison P , Archer HA , Turkheimer FE , Nagren K , Bullock R , Walker Z , Kennedy A , Fox NC , Rossor MN , Rinne JO , Brooks DJ ((2009) ) Conversion of amyloid positive and negative MCI to AD over 3 years: An 11C-PIB PET study. Neurology 73: , 754–760. |
[32] | Parbo P , Ismail R , Sommerauer M , Stokholm MG , Hansen AK , Hansen KV , Amidi A , Schaldemose JL , Gottrup H , Braendgaard H , Eskildsen SF , Borghammer P , Hinz R , Aanerud J , Brooks DJ ((2018) ) Does inflammation precede tau aggregation in early Alzheimer’s disease? A PET study. Neurobiol Dis 117: , 211–216. |
[33] | Ramanan VK , Risacher SL , Nho K , Kim S , Shen L , McDonald BC , Yoder KK , Hutchins GD , West JD , Tallman EF , Gao S , Foroud TM , Farlow MR , De Jager PL , Bennett DA , Aisen PS , Petersen RC , Jack CR Jr. , Toga AW , Green RC , Jagust WJ , Weiner MW , Saykin AJ , Alzheimer’s Disease Neuroimaging Initiative ((2015) ) GWAS of longitudinal amyloid accumulation on 18F-florbetapir PET in Alzheimer’s disease implicates microglial activation gene IL1RAP. Brain 138: , 3076–3088. |
[34] | Rapic S , Backes H , Viel T , Kummer MP , Monfared P , Neumaier B , Vollmar S , Hoehn M , Van der Linden A , Heneka MT , Jacobs AH ((2013) ) Imaging microglial activation and glucose consumption in a mouse model of Alzheimer’s disease. Neurobiol Aging 34: , 351–354. |
[35] | Schuitemaker A , Kropholler MA , Boellaard R , van der Flier WM , Kloet RW , van der Doef TF , Knol DL , Windhorst AD , Luurtsema G , Barkhof F , Jonker C , Lammertsma AA , Scheltens P , van Berckel BN ((2013) ) Microglial activation in Alzheimer’s disease: An (R)-[(1)(1)C]PK11195 positron emission tomography study. Neurobiol Aging 34: , 128–136. |
[36] | Serriere S , Tauber C , Vercouillie J , Mothes C , Pruckner C , Guilloteau D , Kassiou M , Domene A , Garreau L , Page G , Chalon S ((2015) ) Amyloid load and translocator protein 18 kDa in APPswePS1-dE9 mice: A longitudinal study. Neurobiol Aging 36: , 1639–1652. |
[37] | Varrone A , Mattsson P , Forsberg A , Takano A , Nag S , Gulyas B , Borg J , Boellaard R , Al-Tawil N , Eriksdotter M , Zimmermann T , Schultze-Mosgau M , Thiele A , Hoffmann A , Lammertsma AA , Halldin C ((2013) ) In vivo imaging of the 18-kDa translocator protein (TSPO) with [18F]FEDAA1106 and PET does not show increased binding in Alzheimer’s disease patients. Eur J Nucl Med Mol Imaging 40: , 921–931. |
[38] | Varrone A , Oikonen V , Forsberg A , Joutsa J , Takano A , Solin O , Haaparanta-Solin M , Nag S , Nakao R , Al-Tawil N , Wells LA , Rabiner EA , Valencia R , Schultze-Mosgau M , Thiele A , Vollmer S , Dyrks T , Lehmann L , Heinrich T , Hoffmann A , Nordberg A , Halldin C , Rinne JO ((2015) ) Positron emission tomography imaging of the 18-kDa translocator protein (TSPO) with [18F]FEMPA in Alzheimer’s disease patients and control subjects. Eur J Nucl Med Mol Imaging 42: , 438–446. |
[39] | Venneti S , Lopresti BJ , Wang G , Hamilton RL , Mathis CA , Klunk WE , Apte UM , Wiley CA ((2009) ) PK11195 labels activated microglia in Alzheimer’s disease and In vivo in a mouse model using PET. Neurobiol Aging 30: , 1217–1226. |
[40] | Versijpt JJ , Dumont F , Van Laere KJ , Decoo D , Santens P , Audenaert K , Achten E , Slegers G , Dierckx RA , Korf J ((2003) ) Assessment of neuroinflammation and microglial activation in Alzheimer’s disease with radiolabelled PK11195 and single photon emission computed tomography. A pilot study. Eur Neurol 50: , 39–47. |
[41] | Wiley CA , Lopresti BJ , Venneti S , Price J , Klunk WE , DeKosky ST , Mathis CA ((2009) ) Carbon 11-labeled Pittsburgh Compound B and carbon 11-labeled (R)-PK11195 positron emission tomographic imaging in Alzheimer disease. Arch Neurol 66: , 60–67. |
[42] | Yasuno F , Ota M , Kosaka J , Ito H , Higuchi M , Doronbekov TK , Nozaki S , Fujimura Y , Koeda M , Asada T , Suhara T ((2008) ) Increased binding of peripheral benzodiazepine receptor in Alzheimer’s disease measured by positron emission tomography with [11C]DAA1106. Biol Psychiatry 64: , 835–841. |
[43] | Rizzo G , Veronese M , Tonietto M , Zanotti-Fregonara P , Turkheimer FE , Bertoldo A ((2014) ) Kinetic modeling without accounting for the vascular component impairs the quantification of [(11)C]PBR28 brain PET data. J Cereb Blood Flow Metab 34: , 1060–1069. |
[44] | Betlazar C , Harrison-Brown M , Middleton RJ , Banati R , Liu GJ ((2018) ) Cellular sources and regional variations in the expression of the neuroinflammatory marker translocator protein (TSPO) in the normal brain. Int J Mol Sci 19: , 2707. |
[45] | Karchewski LA , Bloechlinger S , Woolf CJ ((2004) ) Axonal injury-dependent induction of the peripheral benzodiazepine receptor in small-diameter adult rat primary sensory neurons. Eur J Neurosci 20: , 671–683. |
[46] | Notter T , Coughlin JM , Sawa A , Meyer U ((2018) ) Reconceptualization of translocator protein as a biomarker of neuroinflammation in psychiatry. Mol Psychiatry 23: , 36–47. |
[47] | Tournier BB , Tsartsalis S , Ceyzeriat K , Medina Z , Fraser BH , Gregoire MC , Kovari E , Millet P ((2020) ) Fluorescence-activated cell sorting to reveal the cell origin of radioligand binding. J Cereb Blood Flow Metab 40: , 1242–1255. |
[48] | Largeau B , Dupont AC , Guilloteau D , Santiago-Ribeiro MJ , Arlicot N ((2017) ) TSPO PET imaging: From microglial activation to peripheral sterile inflammatory diseases? Contrast Media Mol Imaging 2017: , 6592139. |
[49] | Ostuni MA , Issop L , Peranzi G , Walker F , Fasseu M , Elbim C , Papadopoulos V , Lacapere JJ ((2010) ) Overexpression of translocator protein in inflammatory bowel disease: Potential diagnostic and treatment value. Inflamm Bowel Dis 16: , 1476–1487. |
[50] | Wang SC , Xie Q , Lv WF ((2014) ) Positron emission tomography/computed tomography imaging and rheumatoid arthritis. Int J Rheum Dis 17: , 248–255. |
[51] | Bernards N , Pottier G , Theze B , Dolle F , Boisgard R ((2015) ) In vivo evaluation of inflammatory bowel disease with the aid of muPET and the translocator protein 18 kDa radioligand [18F]DPA-714. Mol Imaging Biol 17: , 67–75. |
[52] | Estrada LD , Ahumada P , Cabrera D , Arab JP ((2019) ) Liver dysfunction as a novel player in Alzheimer’s progression: Looking outside the brain. Front Aging Neurosci 11: , 174. |
[53] | Kowalski K , Mulak A ((2019) ) Brain-gut-microbiota axis in Alzheimer’s disease. J Neurogastroenterol Motil 25: , 48–60. |
[54] | van Wijngaarden P , Hadoux X , Alwan M , Keel S , Dirani M ((2017) ) Emerging ocular biomarkers of Alzheimer disease. Clin Exp Ophthalmol 45: , 54–61. |
[55] | Marchese M , Cowan D , Head E , Ma D , Karimi K , Ashthorpe V , Kapadia M , Zhao H , Davis P , Sakic B ((2014) ) Autoimmune manifestations in the 3xTg-AD model of Alzheimer’s disease. J Alzheimers Dis 39: , 191–210. |
[56] | Tsartsalis S , Dumas N , Tournier BB , Pham T , Moulin-Sallanon M , Gregoire MC , Charnay Y , Millet P ((2015) ) SPECT imaging of glioma with radioiodinated CLINDE: Evidence from a mouse GL26 glioma model. EJNMMI Res 5: , 9. |
[57] | Schwarz JM ((2015) ) Using fluorescence activated cell sorting to examine cell-type-specific gene expression in rat brain tissue. J Vis Exp, e52537. |
[58] | Orre M , Kamphuis W , Osborn LM , Jansen AHP , Kooijman L , Bossers K , Hol EM ((2014) ) Isolation of glia from Alzheimer’s mice reveals inflammation and dysfunction. Neurobiol Aging 35: , 2746–2760. |
[59] | Srinivasan K , Friedman BA , Larson JL , Lauffer BE , Goldstein LD , Appling LL , Borneo J , Poon C , Ho T , Cai F , Steiner P , van der Brug MP , Modrusan Z , Kaminker JS , Hansen DV ((2016) ) Untangling the brain’s neuroinflammatory and neurodegenerative transcriptional responses. Nat Commun 7: , 11295. |
[60] | Pannell M , Meier MA , Szulzewsky F , Matyash V , Endres M , Kronenberg G , Prinz V , Waiczies S , Wolf SA , Kettenmann H ((2016) ) The subpopulation of microglia expressing functional muscarinic acetylcholine receptors expands in stroke and Alzheimer’s disease. Brain Struct Funct 221: , 1157–1172. |
[61] | Altman DG ((1991) ) Practical Statistics for Medical Research. Chapman & Hall, London. |
[62] | Owen DR , Gunn RN , Rabiner EA , Bennacef I , Fujita M , Kreisl WC , Innis RB , Pike VW , Reynolds R , Matthews PM , Parker CA ((2011) ) Mixed-affinity binding in humans with 18-kDa translocator protein ligands. J Nucl Med 52: , 24–32. |
[63] | Gui Y , Marks JD , Das S , Hyman BT , Serrano-Pozo A ((2020) ) Characterization of the 18 kDa translocator protein (TSPO) expression in post-mortem normal and Alzheimer’s disease brains. Brain Pathol 30: , 151–164. |
[64] | Guilarte TR ((2019) ) TSPO in diverse CNS pathologies and psychiatric disease: A critical review and a way forward. Pharmacol Ther 194: , 44–58. |
[65] | Heneka MT , Carson MJ , El Khoury J , Landreth GE , Brosseron F , Feinstein DL , Jacobs AH , Wyss-Coray T , Vitorica J , Ransohoff RM , Herrup K , Frautschy SA , Finsen B , Brown GC , Verkhratsky A , Yamanaka K , Koistinaho J , Latz E , Halle A , Petzold GC , Town T , Morgan D , Shinohara ML , Perry VH , Holmes C , Bazan NG , Brooks DJ , Hunot S , Joseph B , Deigendesch N , Garaschuk O , Boddeke E , Dinarello CA , Breitner JC , Cole GM , Golenbock DT , Kummer MP ((2015) ) Neuroinflammation in Alzheimer’s disease. Lancet Neurol 14: , 388–405. |
[66] | Chun H , Marriott I , Lee CJ , Cho H ((2018) ) Elucidating the interactive roles of glia in Alzheimer’s disease using established and newly developed experimental models. Front Neurol 9: , 797. |
[67] | Gordon MN , Holcomb LA , Jantzen PT , DiCarlo G , Wilcock D , Boyett KW , Connor K , Melachrino J , O’Callaghan JP , Morgan D ((2002) ) Time course of the development of Alzheimer-like pathology in the doubly transgenic PS1+APP mouse. Exp Neurol 173: , 183–195. |
[68] | Carter SF , Scholl M , Almkvist O , Wall A , Engler H , Langstrom B , Nordberg A ((2012) ) Evidence for astrocytosis in prodromal Alzheimer disease provided by 11C-deuterium-L-deprenyl: A multitracer PET paradigm combining 11C-Pittsburgh compound B and 18F-FDG. J Nucl Med 53: , 37–46. |
[69] | Garwood CJ , Pooler AM , Atherton J , Hanger DP , Noble W ((2011) ) Astrocytes are important mediators of Abeta-induced neurotoxicity and tau phosphorylation in primary culture. Cell Death Dis 2: , e167. |
[70] | Carrero I , Gonzalo MR , Martin B , Sanz-Anquela JM , Arevalo-Serrano J , Gonzalo-Ruiz A ((2012) ) Oligomers of beta-amyloid protein (Abeta1-42) induce the activation of cyclooxygenase-2 in astrocytes via an interaction with interleukin-1beta, tumour necrosis factor-alpha, and a nuclear factor kappa-B mechanism in the rat brain. Exp Neurol 236: , 215–227. |
[71] | Giovannini MG , Scali C , Prosperi C , Bellucci A , Vannucchi MG , Rosi S , Pepeu G , Casamenti F ((2002) ) Beta-amyloid-induced inflammation and cholinergic hypofunction in the rat brain In vivo: Involvement of the p38MAPK pathway. Neurobiol Dis 11: , 257–274. |
[72] | Olabarria M , Noristani HN , Verkhratsky A , Rodriguez JJ ((2010) ) Concomitant astroglial atrophy and astrogliosis in a triple transgenic animal model of Alzheimer’s disease. Glia 58: , 831–838. |
[73] | Chun H , Lee CJ ((2018) ) Reactive astrocytes in Alzheimer’s disease: A double-edged sword. Neurosci Res 126: , 44–52. |
[74] | Fakhoury M ((2018) ) Microglia and astrocytes in Alzheimer’s disease: Implications for therapy. Curr Neuropharmacol 16: , 508–518. |
[75] | Cohen RM , Rezai-Zadeh K , Weitz TM , Rentsendorj A , Gate D , Spivak I , Bholat Y , Vasilevko V , Glabe CG , Breunig JJ , Rakic P , Davtyan H , Agadjanyan MG , Kepe V , Barrio JR , Bannykh S , Szekely CA , Pechnick RN , Town T ((2013) ) A transgenic Alzheimer rat with plaques, tau pathology, behavioral impairment, oligomeric abeta, and frank neuronal loss. J Neurosci 33: , 6245–6256. |
[76] | Shen Z , Bao X , Wang R ((2018) ) Clinical PET imaging of microglial activation: Implications for microglial therapeutics in Alzheimer’s disease. Front Aging Neurosci 10: , 314. |
[77] | Narayan N , Mandhair H , Smyth E , Dakin SG , Kiriakidis S , Wells L , Owen D , Sabokbar A , Taylor P ((2017) ) The macrophage marker translocator protein (TSPO) is down-regulated on pro-inflammatory ‘M1’ human macrophages. PLoS One 12: , e0185767. |
[78] | Beckers L , Ory D , Geric I , Declercq L , Koole M , Kassiou M , Bormans G , Baes M ((2018) ) Increased expression of translocator protein (TSPO) marks pro-inflammatory microglia but does not predict neurodegeneration. Mol Imaging Biol 20: , 94–102. |
[79] | Owen DR , Narayan N , Wells L , Healy L , Smyth E , Rabiner EA , Galloway D , Williams JB , Lehr J , Mandhair H , Peferoen LA , Taylor PC , Amor S , Antel JP , Matthews PM , Moore CS ((2017) ) Pro-inflammatory activation of primary microglia and macrophages increases 18 kDa translocator protein expression in rodents but not humans. J Cereb Blood Flow Metab 37: , 2679–2690. |
[80] | Werry EL , Bright FM , Piguet O , Ittner LM , Halliday GM , Hodges JR , Kiernan MC , Loy CT , Kril JJ , Kassiou M ((2019) ) Recent developments in TSPO PET imaging as a biomarker of neuroinflammation in neurodegenerative disorders. Int J Mol Sci 20: , 3161. |
[81] | Werry EL , King VA , Barron ML , Banister SD , Sokias R , Kassiou M ((2017) ) Derivatives of the pyrazolo[1,5-a]pyrimidine acetamide DPA-713 as translocator protein (TSPO) ligands and pro-apoptotic agents in human glioblastoma. Eur J Pharm Sci 96: , 186–192. |
[82] | Keren-Shaul H , Spinrad A , Weiner A , Matcovitch-Natan O , Dvir-Szternfeld R , Ulland TK , David E , Baruch K , Lara-Astaiso D , Toth B , Itzkovitz S , Colonna M , Schwartz M , Amit I ((2017) ) A unique microglia type associated with restricting development of Alzheimer’s disease. Cell 169: , 1276–1290 e1217. |
[83] | Galatro TF , Holtman IR , Lerario AM , Vainchtein ID , Brouwer N , Sola PR , Veras MM , Pereira TF , Leite REP , Moller T , Wes PD , Sogayar MC , Laman JD , den Dunnen W , Pasqualucci CA , Oba-Shinjo SM , Boddeke E , Marie SKN , Eggen BJL ((2017) ) Transcriptomic analysis of purified human cortical microglia reveals age-associated changes. Nat Neurosci 20: , 1162–1171. |
[84] | Masuda T , Sankowski R , Staszewski O , Bottcher C , Amann L , Sagar , Scheiwe C , Nessler S , Kunz P , van Loo G , Coenen VA , Reinacher PC , Michel A , Sure U , Gold R , Grun D , Priller J , Stadelmann C , Prinz M ((2019) ) Spatial and temporal heterogeneity of mouse and human microglia at single-cell resolution. Nature 566: , 388–392. |
[85] | Cohen J , Torres C ((2019) ) Astrocyte senescence: Evidence and significance. Aging Cell 18: , e12937. |
[86] | Laurent C , Buee L , Blum D ((2018) ) Tau and neuroinflammation: What impact for Alzheimer’s disease and tauopathies? Biomed J 41: , 21–33. |
[87] | Ceyzeriat K , Ben Haim L , Denizot A , Pommier D , Matos M , Guillemaud O , Palomares MA , Abjean L , Petit F , Gipchtein P , Gaillard MC , Guillermier M , Bernier S , Gaudin M , Auregan G , Josephine C , Dechamps N , Veran J , Langlais V , Cambon K , Bemelmans AP , Baijer J , Bonvento G , Dhenain M , Deleuze JF , Oliet SHR , Brouillet E , Hantraye P , Carrillo-de Sauvage MA , Olaso R , Panatier A , Escartin C ((2018) ) Modulation of astrocyte reactivity improves functional deficits in mouse models of Alzheimer’s disease. Acta Neuropathol Commun 6: , 104. |
[88] | Nirzhor SSR , Khan RI , Neelotpol S ((2018) ) The biology of glial cells and their complex roles in Alzheimer’s disease: New opportunities in therapy. Biomolecules 8: , 93. |
[89] | Marlatt MW , Bauer J , Aronica E , van Haastert ES , Hoozemans JJ , Joels M , Lucassen PJ ((2014) ) Proliferation in the Alzheimer hippocampus is due to microglia, not astroglia, and occurs at sites of amyloid deposition. Neural Plast 2014: , 693851. |
[90] | Gomez-Nicola D , Perry VH ((2016) ) Analysis of microglial proliferation in Alzheimer’s disease. Methods Mol Biol 1303: , 185–193. |
[91] | Gomez-Nicola D , Boche D ((2015) ) Post-mortem analysis of neuroinflammatory changes in human Alzheimer’s disease. Alzheimers Res Ther 7: , 42. |
[92] | Sarlus H , Heneka MT ((2017) ) Microglia in Alzheimer’s disease. J Clin Invest 127: , 3240–3249. |
[93] | Fan Z , Okello AA , Brooks DJ , Edison P ((2015) ) Longitudinal influence of microglial activation and amyloid on neuronal function in Alzheimer’s disease. Brain 138: , 3685–3698. |
[94] | Parbo P , Ismail R , Hansen KV , Amidi A , Marup FH , Gottrup H , Braendgaard H , Eriksson BO , Eskildsen SF , Lund TE , Tietze A , Edison P , Pavese N , Stokholm MG , Borghammer P , Hinz R , Aanerud J , Brooks DJ ((2017) ) Brain inflammation accompanies amyloid in the majority of mild cognitive impairment cases due to Alzheimer’s disease. Brain 140: , 2002–2011. |
[95] | Hunter S , Brayne C ((2017) ) Do anti-amyloid beta protein antibody cross reactivities confound Alzheimer disease research? J Negat Results Biomed 16: , 1. |
[96] | Kurtys E , Doorduin J , Eisel UL , Dierckx RA , de Vries EF ((2017) ) Evaluating [(11)C]PBR28 PET for monitoring gut and brain inflammation in a rat model of chemically induced colitis. Mol Imaging Biol 19: , 68–76. |


