
Plasma Amyloid Concentration in Alzheimer’s Disease: Performance of a High-Throughput Amyloid Assay in Distinguishing Alzheimer’s Disease Cases from Controls
Abstract
Background:
Collection of cerebrospinal fluid (CSF) for measurement of amyloid-β (Aβ) species is a gold standard in Alzheimer’s disease (AD) diagnosis, but has risks. Thus, establishing a low-risk blood Aβ test with high AD sensitivity and specificity is of outmost interest.
Objective:
We evaluated the ability of a commercially available plasma Aβ assay to distinguish AD patients from biomarker-healthy controls.
Method:
In a case-control design, we examined plasma samples from 44 AD patients (A + N+) and 49 controls (A–N–) from a memory clinic. AD was diagnosed using a combination of neuropsychological examination, CSF biomarker analysis and brain imaging. Total Aβ40 and total Aβ42 in plasma were measured through enzyme-linked immunosorbent assay (ELISA) technology using ABtest40 and ABtest42 test kits (Araclon Biotech Ltd.). Receiver operating characteristic (ROC) analyses with outcome AD were performed, and sensitivity and specificity were calculated.
Results:
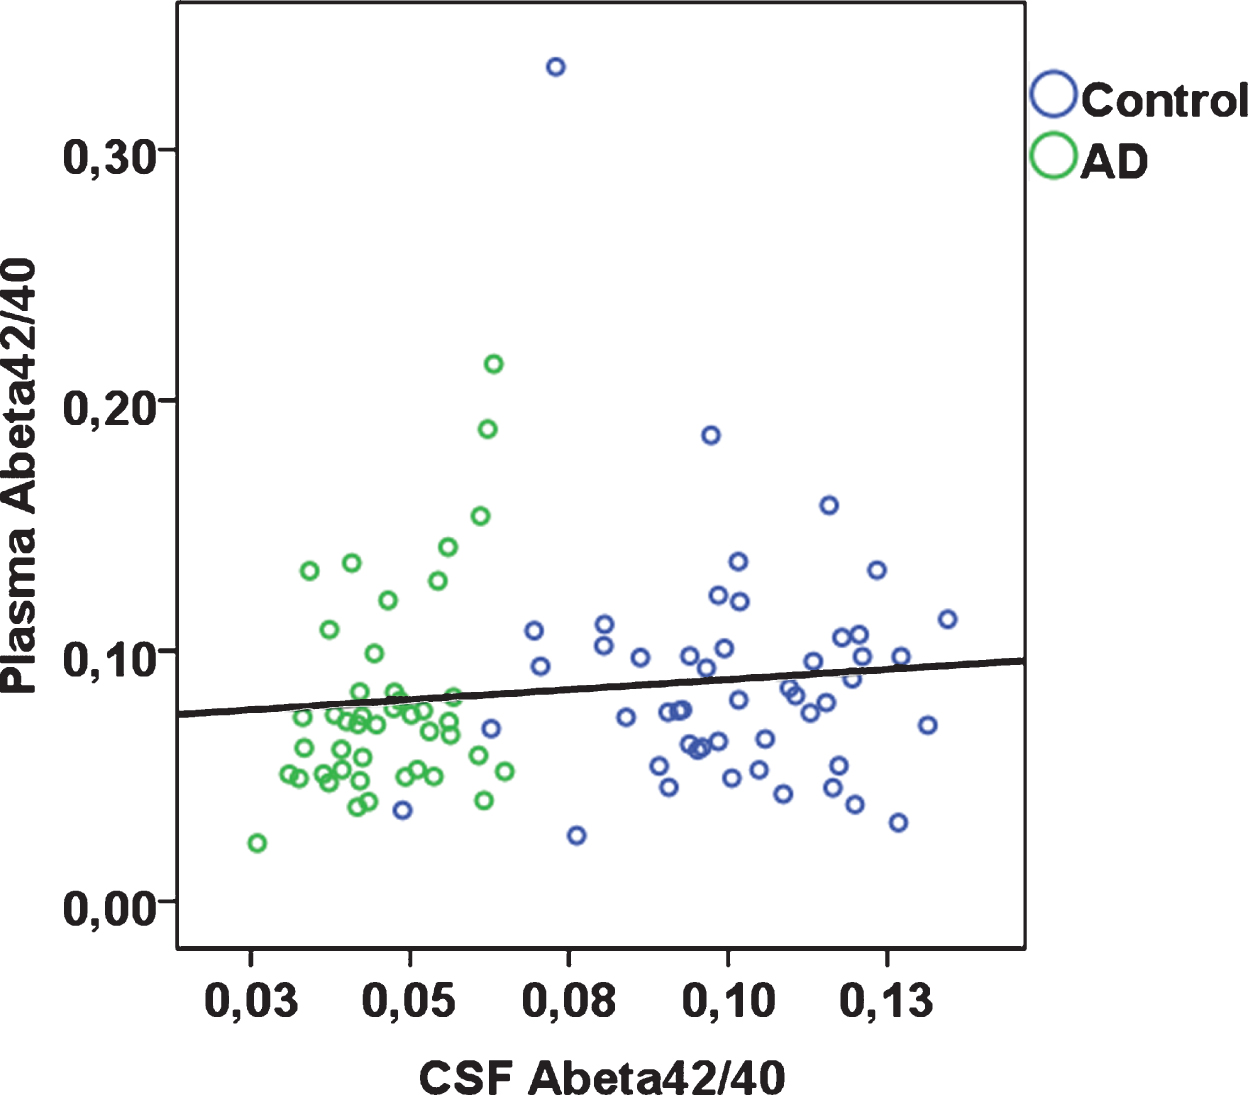
Plasma Aβ42/40 was weakly positively correlated with CSF Aβ42/40 (Spearman’s rho 0.22; p = 0.037). Plasma Aβ42/40 alone was not able to statistically significantly distinguish between AD patients and controls (AUC 0.58; 95% CI 0.46, 0.70). At a cut-point of 0.076 maximizing sensitivity and specificity, plasma Aβ42/40 had a sensitivity of 61.2% and a specificity of 63.6%.
Conclusion:
In this sample, the high-throughput blood Aβ assay was not able to distinguish well between AD patients and controls. Whether or not the assay may be useful in large-scale epidemiological settings remains to be seen.
INTRODUCTION
Alzheimer’s disease (AD) is threatening global healthcare systems [1] and generates immense economic, medical, and societal costs [2]. As its neuropathological hallmark, AD is characterized by an accumulation of amyloid-β (Aβ) peptides in the brain and AD diagnosis largely depends on an estimation of brain Aβ burden. Aβ is derived through cleavage of the amyloid-β protein precursor (AβPP), a transmembrane protein, and aggregates as neurotoxic amyloid plaques ultimately impairing synaptic function [3], though whether or not Aβ causes AD or functions as a ‘bystander’ of AD pathogenesis is yet to be determined [4, 5].
Brain Aβ antemortem is quantifiable via radioactive labelling on positron emission tomography (PET) [6] and can also be estimated from Aβ concentrations in cerebrospinal fluid (CSF) as a molecular biomarker [7]. Amyloid PET and CSF Aβ can be used interchangeably for clinical diagnosis [7, 8] and are increasingly relied upon in diagnostic frameworks [9, 10]. Both have also been shown to predict future cognitive decline [11–13]. Nonetheless, amyloid PET and CSF Aβ are used infrequently in clinical practice [14]. Amyloid PET is cost-intensive and dependent on radioactive tracers; lumbar punctures to obtain CSF can cause minor complications such as back pain as well as more severe complications such as spinal hematoma [15], and can lead to psychological distress [16]. In contrast, blood collection is well-tolerated, making measurement of blood Aβ for estimation of brain Aβ burden suitable for large-scale application in routine diagnostics. For instance, with sufficient sensitivity and specificity, analysis of blood Aβ could serve as a first-step screening tool for selection of patients for more cost-intensive and high-risk diagnostic measures. Ultimately, blood Aβ analysis might have a comparable impact on diagnostic procedures as amyloid PET [6, 17] and CSF Aβ analysis [18, 19], and even more so due to a projected wider uptake.
However, measuring Aβ in blood is inherently difficult [20, 21]. Plasma concentrations of Aβ are around 10-fold lower than in CSF, whereas the total protein content is 10-fold higher [22], causing technical difficulties. Sophisticated methods for Aβ analysis have been developed in recent years, but results from the first diagnostic and epidemiological applications of these methods have been inconsistent. A number of studies have found an association of lower plasma Aβ concentrations (thought to reflect a greater brain Aβ burden) with more severe neuropsychological deficits [23, 24], with an increased risk of developing AD [25, 26], and with amyloid-positive PET [8, 27, 28] or amyloid-abnormal CSF [29, 30] as current gold standards for AD diagnosis. Others report results in the opposite direction [31–34] and null findings, too, are frequent [35–37]. It has been suggested that one reason for this inconsistency may lie in between-study differences in the cognitive profiles of study samples given that plasma Aβ levels follow a complex temporal trajectory: concentrations increase with age but, potentially due to brain Aβ aggregation, reduce in symptomatic stages of AD [22, 32, 38]. The inconsistent research findings may additionally stem from variations in Aβ measurement methods. Of note, in-house methods with limited feasibility for upscaling are frequent [27] but hinder clinical application which is dependent on high-throughput methods.
Here, we determined the ability of plasma Aβ concentration to discriminate between AD patients and biomarker-healthy, non-diseased controls. We used a recently established, commercially available and high-throughput plasma Aβ assay that to our knowledge has never been evaluated independently of the manufacturer. We hypothesized that Aβ concentration was lower in the plasma of AD patients than in controls. The ratio of plasma Aβ42/40 served as the main biomarker of interest as it reflects the more pathological of the amyloid species (Aβ42) [39] with individual differences in overall Aβ production (Aβ40) accounted for.
MATERIALS AND METHOD
Study design and sample size calculation
In a case-control study design, Aβ was measured in plasma samples previously stored at a biobank for AD patients and biomarker-healthy, non-diseased controls. With a two-tailed analysis and a power of 80%, 47 observations were required per group (total N = 94) to detect statistically significant group differences in plasma Aβ (expected effect size d = 0.6). To account for occasional technical difficulty in biomarker measurement, we arrived at a target sample size of N = 100. The study complied with the Declaration of Helsinki.
Study sample
Cases in our study included patients with AD, who were diagnosed during a visit to a memory clinic in Berlin, Germany, between 2014 and 2018. Controls were selected among individuals who presented to the clinic with memory concerns during the same time period, but who were otherwise neurobiologically healthy and consequently did not receive a diagnosis of AD or other forms of dementia. The memory clinic is part of the German Dementia Competence Network (DCN). AD patients and controls were not matched.
Clinical examinations
All participants underwent a thorough and identical clinical examination that included lumbar puncture for CSF collection and collection of blood. Participants were not required to fast. Plasma samples were stored at a biobank for future analysis. CSF was collected into polypropylene tubes and frozen at –80°C according to standard operating procedures detailed elsewhere [40]. Total tau (t-tau), Aβ40, and Aβ42 in CSF were measured in Mesoscale System (MSD) immunoassays (Mesoscale Discovery, Gaithersburg, MD, USA) at a laboratory adjacent to the clinic site. For t-tau, the MSD MS6000 Phospho-, Total Tau Kit was used; for Aβ40 and Aβ42, the MSD MS6000 Human (6E10) Aβ3-Plex Kit was used [41]. The ratio Aβ42/40 was calculated. Consenting participants were genotyped for apolipoprotein (APOE) status. ‘APOE ɛ4’ was defined as presence of at least one ɛ4 allele. Participants additionally underwent computed tomography (CT) and/or magnetic resonance imaging (MRI) on a separate visit. Neuropsychological testing was mainly based on the CERAD (Consortium to Establish a Registry for Alzheimer’s Disease) recommendations. Tests included the Mini-Mental State Examination (MMSE) [42], Boston Naming, verbal fluency (category), figure copying, and word list recall. The battery was supplemented by the Clock Drawing test as a screening tool for dementia and Trail-Making Tests A and B (TMT-A; TMT-B) as measures of processing speed and executive function. The Logical Memory subtest of the Wechsler Memory Scale 4th edition assessed verbal memory and included immediate and delayed recall.
Clinical diagnosis of cases and controls
AD was diagnosed according to DSM-V criteria in a consensus conference involving psychiatrists, physicians and neuropsychologists from a combination of results from the neuropsychological examination, CSF biomarker analysis and brain imaging data. Diagnostic confidence was exceptionally high compared with non-specialized centers, as AD patients were selected for enrollment into clinical trials at the memory clinic. AD patients were thus considered both clinically and neurobiologically diseased, whereas the control group was considered biomarker-healthy. Plasma Aβ concentration was unknown at the time of diagnosis.
Aβ in plasma
Plasma samples were extracted from the biobank in 2018 and shipped to an analysis laboratory (Araclon Biotech Ltd., Zaragoza, Spain) for measurement of total Aβ40 (referred to as Aβ40 hereafter) and total Aβ42 (referred to as Aβ42 hereafter) through enzyme-linked immunosorbent assay (ELISA) technology using the ABtest40 and ABtest42 test kits (Araclon Biotech Ltd., Zaragoza, Spain) [43]. The laboratory was blinded to our research question and to patient characteristics. Of N = 100, the analysis produced data on Aβ40 for n = 97 (n = 50 controls; n = 47 patients) and on Aβ42 for n = 93 participants (n = 49 controls; n = 44 patients). Intra-assay coefficient of variation (CV) was 4.5% for Aβ40 and 15.8% for Aβ42. Inter-assay CV was 3.7% for Aβ40 and 5.0% for Aβ42. The ratio Aβ42/40 was calculated for n = 49 controls and n = 44 patients, and served as the main plasma biomarker of interest.
Statistical analysis
Differences between AD patients and controls in terms of sociodemographics, frequency of the APOE ɛ4 allele and CSF biomarkers were compared using independent samples t-tests, Mann-Whitney tests or χ2 tests. In the total sample, associations of plasma Aβ42, Aβ40, and Aβ42/40 with CSF Aβ42, Aβ40, and Aβ42/40 were determined using univariate Spearman correlation analyses.
Plasma Aβ42, Aβ40, and Aβ42/40 were compared between AD patients and controls, and between carriers of the APOE ɛ4 allele (≥1 allele) and non-carriers using Mann-Whitney tests.
The diagnostic accuracy of plasma Aβ40, plasma Aβ42, and plasma Aβ42/40 was determined in receiver operating characteristic (ROC) analyses to calculate areas under the curve (AUCs) with the outcome AD patients versus controls. ROC analyses were performed separately for age, APOE ɛ4, plasma Aβ40, plasma Aβ42, and plasma Aβ42/40, and for selected combinations of these predictors. For plasma Aβ42/40 as the main biomarker of interest, the optimal cut-off and associated sensitivity, specificity and Youden’s index [44], as well as positive predictive value (PPV) and negative predictive value (NPV) were calculated. Analyses were performed in SPSS (Version 18, IBM SPSS, Chicago, Illinois) and R.
RESULTS
Sample characteristics
AD patients were statistically significantly older and were more likely to have at least one APOE ɛ4 allele compared with controls (Table 1). CSF Aβ42, CSF Aβ42/40, CSF t-tau, and neuropsychological test results were in line according to diagnostic group (data not shown).
Table 1
Sociodemographic, clinical, and cognitive characteristics in controls and AD patients
| Controls (n = 50) | AD (n = 50) | p | |
| Age, years, mean±SD | 65.82±8.96 | 71.30±7.42 | 0.001 |
| Female sex, n (%) | 26 (52.0%) | 25 (50.0%) | 0.841 |
| Years of education*, mean±SD | 14.27±2.98 | 13.46±2.96 | 0.187 |
| ≥1 APOE ɛ4 allele**, n (%) | 11 (26.8%) | 33 (71.7%) | <0.001 |
Results from t-tests, Mann-Whitney tests or χ2 tests. *total n = 94. **total n = 87.
Associations of plasma Aβ with CSF biomarkers
In the total sample, plasma Aβ40 was significantly positively correlated with plasma Aβ42 (Spearman’s rho 0.46; p < 0.001). Plasma Aβ42 and plasma Aβ42/40 were each significantly, albeit weakly, positively correlated with CSF Aβ40, Aβ42; plasma Aβ42/40 was additionally positively associated with CSF Aβ42/40 (Table 2, Fig. 1). Plasma Aβ40 was not significantly correlated with CSF Aβ40, Aβ42, or Aβ42/40. When stratified by case-control status, in controls, plasma Aβ42 and Aβ42/40 were significantly correlated with CSF Aβ42, whereas none of the remaining correlations were statistically significant (Table 2). In AD patients, plasma Aβ40 was significantly inversely correlated with CSF Aβ42/40, but none of the remaining correlations were statistically significant. Aβ40 and Aβ42 concentrations were overall around 30-fold and 26-fold higher in CSF than in plasma respectively (CSF Aβ40, median 6,727 pg/mL in controls and 7,345 pg/mL in AD patients; CSF Aβ42, median 677 pg/mL in controls and 310 pg/mL in AD patients; plasma Aβ40, median 237 pg/mL in controls and 237 pg/mL in AD patients; plasma Aβ42, median 20 pg/mL in controls and 17 pg/mL in AD patients).
Table 2
Correlations of plasma Aβ with CSF Aβ
| CSF Aβ40 | CSF Aβ42 | CSF Aβ42/40 | |
| Total sample | |||
| Plasma Aβ40 | 0.10 (0.350) | –0.05 (0.637) | –0.14 (0.171) |
| Plasma Aβ42 | 0.24 (0.023) | 0.26 (0.012) | 0.13 (0.220) |
| Plasma Aβ42/40 | 0.23 (0.029) | 0.33 (0.001) | 0.22 (0.037) |
| Controls | |||
| Plasma Aβ40 | –0.05 (0.741) | –0.07 (0.636) | –0.11 (0.482) |
| Plasma Aβ42 | 0.15 (0.332) | 0.31 (0.043) | 0.24 (0.112) |
| Plasma Aβ42/40 | 0.15 (0.334) | 0.34 (0.026) | 0.29 (0.052) |
| AD | |||
| Plasma Aβ40 | 0.22 (0.131) | –0.01 (0.953) | –0.32 (0.025) |
| Plasma Aβ42 | 0.27 (0.057) | 0.23 (0.116) | –0.04 (0.761) |
| Plasma Aβ42/40 | 0.26 (0.071) | 0.28 (0.053) | 0.07 (0.636) |
Spearman’s rho (p-value). CSF; cerebrospinal fluid. n = 44 to 97.
Fig.1
Plasma Aβ42/40 plotted against CSF Aβ42/40 according to diagnostic group (rho = 0.22; p = 0.037 across total sample).
Plasma Aβ in AD patients and controls
Plasma Aβ40, plasma Aβ42, and plasma Aβ42/40 were not significantly different between AD patients and controls (Table 3; Supplementary Figure 1).
Table 3
Plasma Aβ concentration in controls and AD patients
| Controls | AD | Mann-Whitney | |||||
| Min | Max | Median (interquartile range) | Min | Max | Median (interquartile range) | p | |
| Plasma Aβ40 (pg/mL) | 129 | 415 | 237 (212 – 264) | 109 | 376 | 237 (216 – 267) | 0.809 |
| Plasma Aβ42 (pg/mL) | 5.8 | 88.2 | 19.9 (13.2 – 26.4) | 4.8 | 53.3 | 17.4 (12.1 – 27.1) | 0.404 |
| Plasma Aβ42/40 | 0.03 | 0.33 | 0.08 (0.06 – 0.10) | 0.02 | 0.21 | 0.07 (0.05 – 0.08) | 0.173 |
n = 93 to 97.
In ROC analyses, the area under the curve (AUC) was 0.51 (95% CI 0.40, 0.63; p = 0.809) for plasma Aβ40, 0.55 (95% CI 0.43, 0.67; p = 0.404) for plasma Aβ42, and 0.58 (95% CI 0.46, 0.70; p = 0.173) for plasma Aβ42/40, indicating that the ability to discriminate between AD patients and controls based solely on these plasma markers is poor. In comparison, the AUCs based on age only or based on APOE ɛ4 only were 0.70 (95% CI 0.59, 0.80; p = 0.001) and 0.73 (95% CI 0.62, 0.83; p < 0.001) respectively. When plasma Aβ42/40 as the main biomarker of interest was added to these models, the AUCs did not change (age and Aβ42/40, AUC, 0.70; 95% CI 0.59, 0.80; p = 0.001; p for difference 0.999; APOE ɛ4 and Aβ42/40, AUC, 0.76; 95% CI 0.65, 0.87; p < 0.001; p for difference 0.429). The AUC for a model that included age and APOE ɛ4 was 0.79 (95% CI 0.69, 0.89; p < 0.001). When plasma Aβ42/40 was added to this model, the AUC was 0.80 (95% CI 0.70, 0.91; p < 0.001; p for difference 0.879; see Fig. 2 for selected biomarker combinations). Taken together, these data show that plasma Aβ42/40 did not contribute to the ability to discriminate between AD patients and controls.
Fig.2
ROC curves for plasma Aβ42/40 alone, plasma Aβ42/40 with age, and plasma Aβ42/40 with age and APOE ɛ4, in n = 81 patients with complete data. Outcome is “AD” with reference “controls”. To create a ROC curve above the reference line, Aβ42/40 was transformed to “1- Aβ42/40” (blue line).
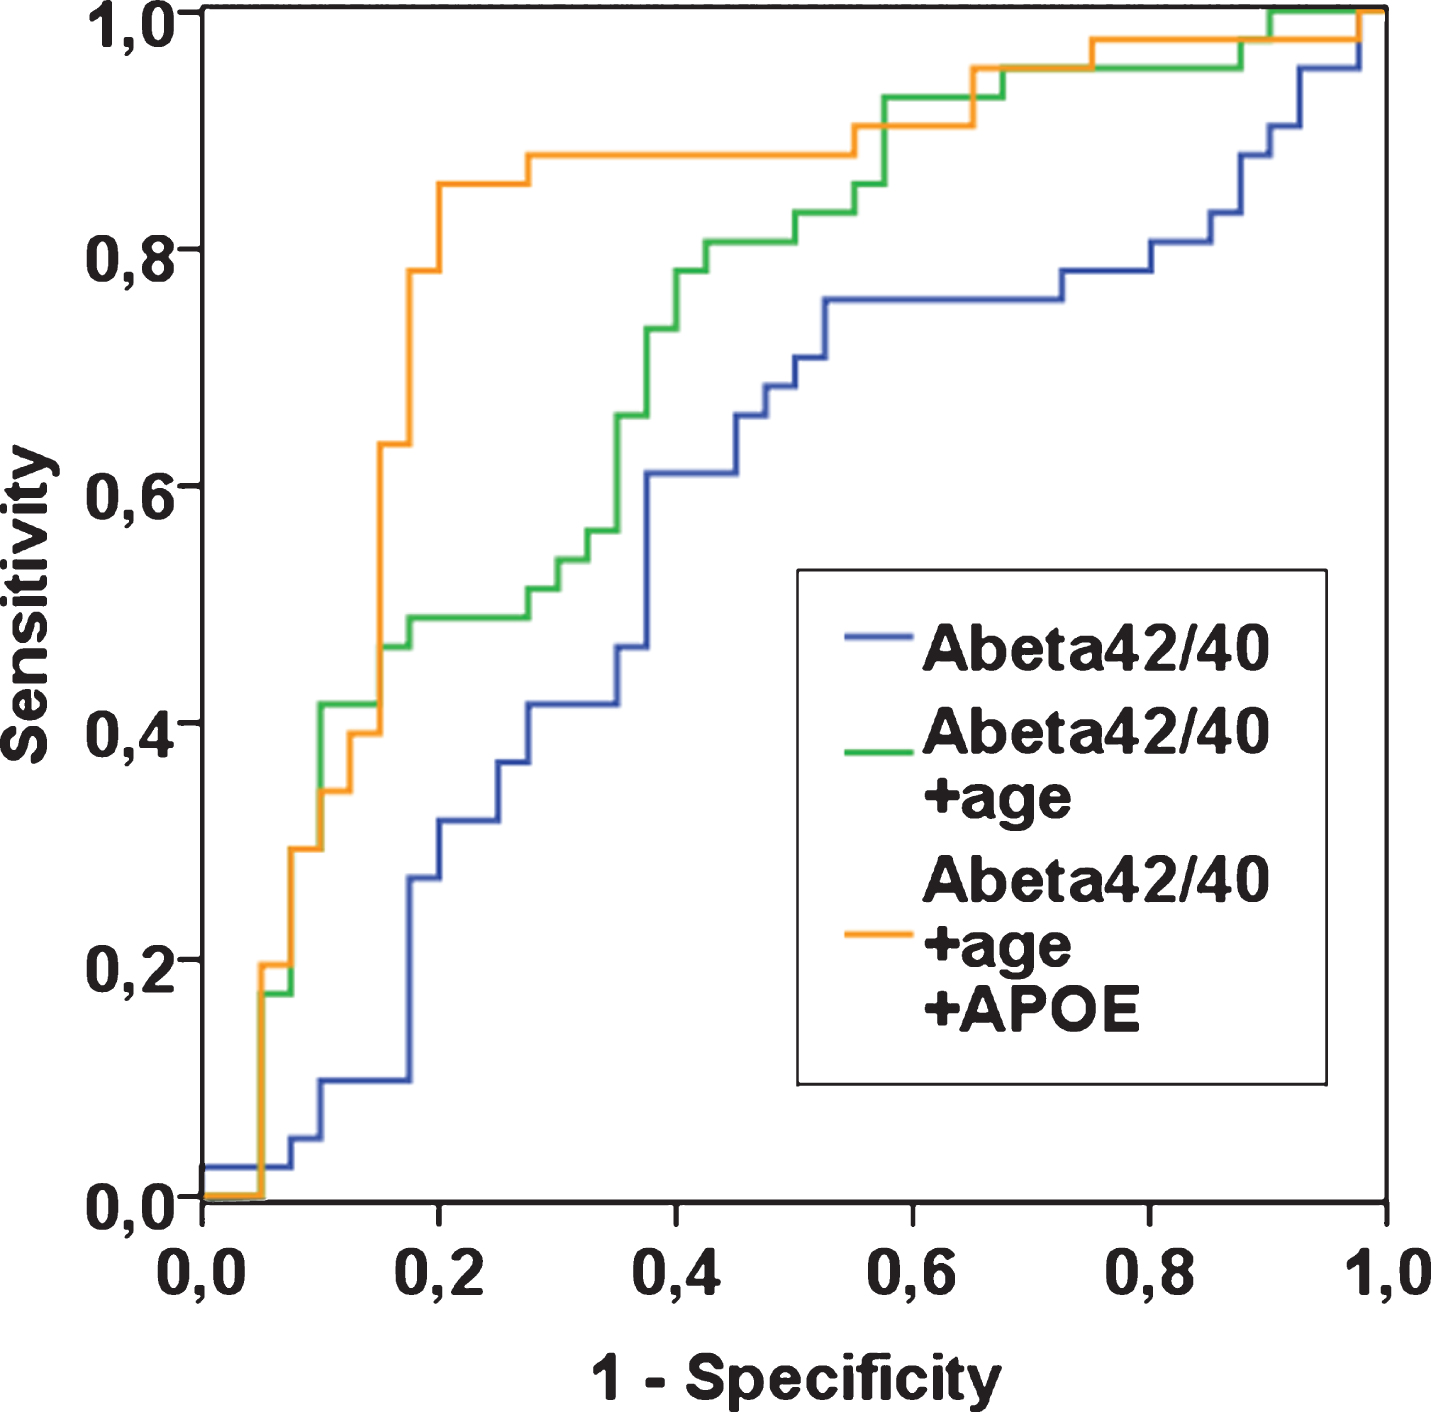
Fig.3
Diagnostic accuracy of plasma Aβ42/40 at optimal cut-point (total n = 93).
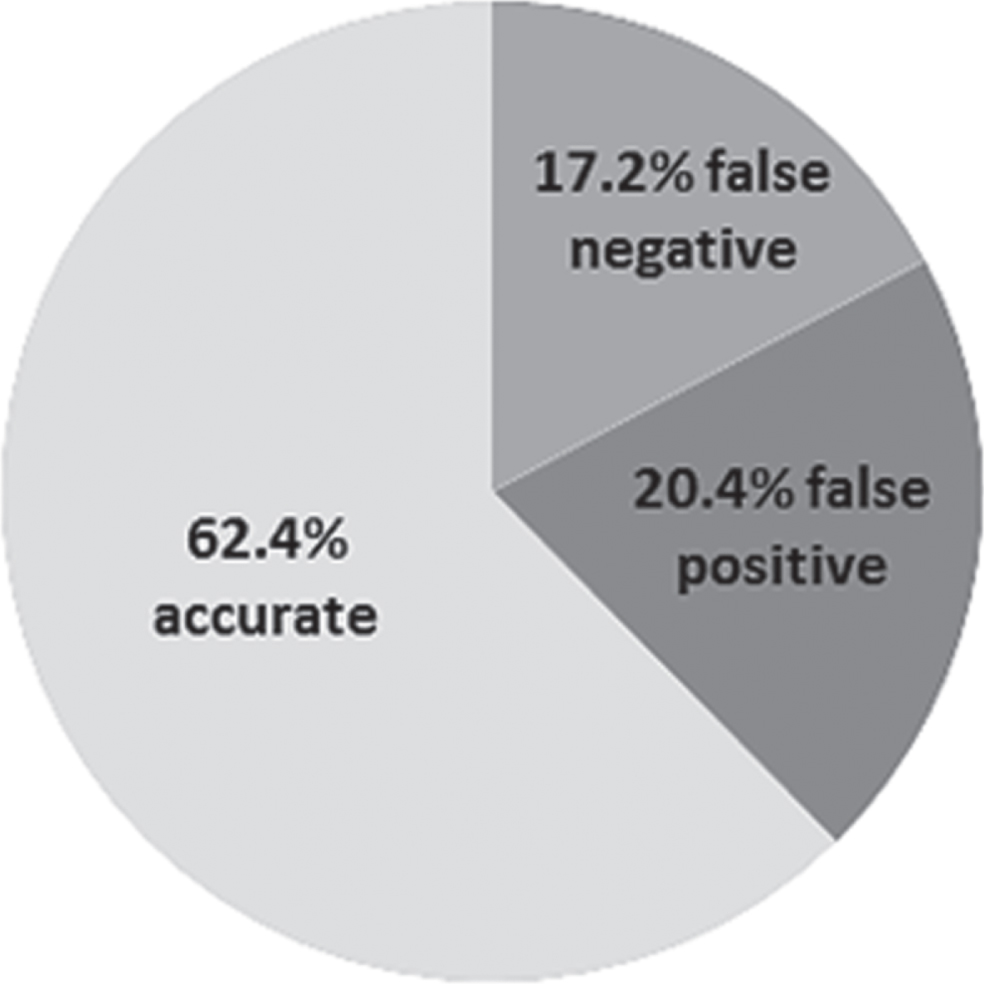
Based on the ROC analysis, we determined a cut-point of 0.076 for a plasma Aβ42/40 concentration with a maximum in both sensitivity and specificity. However, at this cut-point, plasma Aβ42/40 had low sensitivity (61.2%) and specificity (63.6%; Youden’s index 0.25) and correctly identified 28 of the 44 AD patients and 30 of the 49 controls. Sixteen AD patients were misclassified as controls (false negatives) and 19 controls were misclassified as AD cases (false positives). Plasma Aβ42/40 at this cut-point had a positive predictive value (PPV) of 59.6% and a negative predictive value (NPV) of 65.2%. We applied further experimental cut-points to plasma Aβ42/40 in post-hoc analyses to reduce the number of false positives, but all resulted in low diagnostic accuracy (Supplementary Table 1).
Plasma Aβ in non-carriers and carriers of APOE ɛ4
Across the full study sample, plasma Aβ40 (median 238.1 pg/mL versus 228.9 pg/mL; p = 0.466), plasma Aβ42 (median 21.3 pg/mL versus 16.7 pg/mL; p = 0.251), and plasma Aβ42/40 (median 0.08 versus 0.07; p = 0.212) were each not statistically different in non-carriers and in carriers of the APOE ɛ4 allele, respectively.
DISCUSSION
Blood-based biomarkers of AD have the potential to revolutionize AD diagnostic procedures. Here, in a unique case-control study with exceptionally detailed assessments that included a neuropsychological examination, CSF biomarker analysis and brain imaging as gold standards in AD diagnosis, we found that plasma Aβ was not able to distinguish AD patients well from biomarker-healthy, non-diseased controls. Sensitivity and specificity based on plasma Aβ42/40 levels alone were low and not indicative of a diagnostic test with scope for clinical application. Only 64% of AD patients were correctly detected based on plasma Aβ42/40.
Plasma Aβ42/40 was only weakly but significantly correlated with CSF Aβ42/40. This finding is in agreement with several previous investigations [27, 30, 45] though the strength of this correlation was markedly smaller in our sample. CSF Aβ itself comes with measurement difficulties [12, 41], but based on its established function as a gold-standard in AD diagnosis [7], combined with the fact that CSF Aβ was measured using the Mesoscale System (MSD) [41], our finding suggests that plasma Aβ reflected brain Aβ burden only to some limited extent. In contrast to several previous studies comparing AD patients and controls [22, 30], we did not find evidence of reduced plasma Aβ in AD patients. Several reasons may underlie this null result. Firstly, plasma Aβ may in fact be unrelated to AD status. Secondly, due to the ‘noise’ associated with peripheral production and clearance of Aβ [46], effect sizes may have been too small to detect differences in plasma Aβ between AD cases and controls. Thirdly, measurement error from varying time lapse before freezing, from varying storage time of plasma samples, uncontrolled fasting status and time of day, and/or plasma Aβ analysis itself may have affected results. To our knowledge, we provide the first application of a novel, high-throughput technique for plasma Aβ analysis [43] to a research study that was run independently of the manufacturer. The assay had previously been used in four studies [28, 45, 47, 48] of which one [47] used a subsample of an earlier investigation [45]. In sum, the studies found correlations of plasma Aβ42/40 with CSF Aβ42/40 [45], as well as associations of low plasma Aβ with presence of [28, 45, 47, 48] and an increased 3-year accumulation of Aβ burden on PET [28]. Further, a lower plasma Aβ42/40 was reported in patients with mild cognitive impairment (MCI) compared with cognitively normal individuals; additionally MCI patients with lower plasma Aβ42/40 were at increased risk of 2-year conversion to AD [45]. In two of the four studies sensitivity, specificity and AUC of plasma Aβ42/40 for Aβ-positive PET were more promising [28, 47] compared with our own analysis comparing AD patients with controls. Yet, in one of these studies, when the full cohort was analyzed rather than a subsample, plasma Aβ42/40 performed poorly in discriminating MCI from cognitively normal individuals [47], mirroring our own results. A cross-sectional analysis of people with subjective cognitive decline, too, found low AUC and low specificity of the compound alone for Aβ-positive PET [48]. The final, prospective study on conversion from MCI to AD only reported a fully adjusted model that included plasma Aβ as well as age, APOE, and education [45] so that the added benefit of plasma Aβ is difficult to evaluate.
The discrepancy of our results from many of the manufacturer-funded results remains unclear. AD diagnosis in our study was based on neuropsychological test scores, CSF biomarker analysis and brain imaging results, and so we are confident that we have been successful in selecting neurobiologically diseased AD patients and neurobiologically healthy controls. That, combined with recent reports of acceptable diagnostic performance of plasma Aβ when measured using different high-throughput techniques [8, 30], leads us to suggest that the assay may have failed to produce accurate plasma Aβ data. Technical issues in our study were also indicated by the fact that plasma Aβ relative to CSF Aβ was far lower than the expected 10-fold difference [27]; our >20-fold difference mirrored that of another investigation which also found no association of plasma Aβ with cognitive status [36].
Aβ metabolism is strongly influenced by the APOE protein. APOE is involved in cholesterol transport in the brain as well as in Aβ production and clearance, and binds to Aβ in CSF [49]. The APOE gene occurs in three polymorphisms (ɛ2; ɛ3; ɛ4) of which the APOE ɛ4 allele is a strong predictor of late-onset AD [49]. Carriers of APOE ɛ4 have greater brain Aβ burden imaged on PET [50, 51] and lower CSF Aβ compared with non-carriers [51–53]. Several population-based cohort studies also point to lower plasma Aβ in carriers [8, 54], but we and others that have used the same assay [48] found no such evidence. Effect sizes speak against low statistical power as the root cause, corroborating plasma Aβ—at least when measured using the present assay—as a peripheral biomarker with little scope for capturing AD-type neuropathological burden.
Detailed characterization of participants using genetic, CSF biomarker, and brain imaging data is a strength of our study, but some limitations must be considered. Due to small sample size, our analyses were underpowered to detect more subtle group differences in plasma Aβ. For instance, we only had a two-tailed power of around 30% to detect a small group difference. Nonetheless, the anticipated large effect had been reasonable given that we had selected distinct groups of neurobiologically confirmed AD patients and biomarker-healthy controls. A large group difference is also a prerequisite for implementation of a diagnostic test in clinical settings, which is at the core of plasma Aβ research. Time interval between plasma collection and freezing, fasting status, and time of day had not been fully standardized and this may have contributed to measurement error. However, recent evidence suggests that plasma Aβ concentration is relatively immune to these factors [55, 56]. Plasma samples had been stored for between 7 months and 4 years prior to extraction from the biobank for Aβ analysis. Though we are not aware of studies that have assessed an influence of storage time on plasma Aβ, we have no reason to believe it may be less stable compared with Aβ in frozen CSF for which we have previously demonstrated long-term stability [41]. Finally, we did not consider AD staging and included both early-onset and late-onset AD in our sample (6 AD patients were <65 years old). All of these factors may have played a role in generating a large range of plasma Aβ measurements thus may have contributed to our null findings. At the same time, with exception of storage time, they are all part of a real-world setting which any diagnostic test for AD must be able to withstand for implementation in the clinic.
In a recent analysis of a mostly cognitively unimpaired older cohort, baseline plasma Aβ measured with immunoprecipitation and liquid chromatography-mass spectrometry assay predicted conversion from amyloid-negative to amyloid-positive PET during a 4-year follow-up. Results indicated that implementing the plasma Aβ test in clinical practice would reduce PET scans by 62% [8]. Further studies in this direction are needed in spite of the present null findings to fully determine the diagnostic value of plasma Aβ and for head-to-head comparison with other biomarkers of brain Aβ burden. For instance, plasma t-tau [57] and plasma neurofilament light (NFL) [58] have recently been reported as predictive of AD in three independent cohorts. Serum NFL has also been shown to be elevated in patients with familial AD [59] and to predict their rate of cognitive decline [60]. A substantial proportion of patients with MCI or dementia with potential AD etiology appears to be misdiagnosed once followed up with amyloid PET [17], and plasma biomarkers could be evaluated as follow-up diagnostic tools. For Aβ in particular, different methods for measuring plasma concentration of the protein should be compared with one another and with a recently developed structure-based approach that measures misfolded Aβ [61]. The goal should be to standardize analysis methods across labs. Here, we did not create CSF/plasma Aβ ratios, because AD diagnosis was based in part on CSF Aβ so that such ratios would have led to circular arguments, but future studies could explore their usefulness (e.g., [36]) as well as ratios combining several plasma biomarkers (e.g., [62]).
Any biomarker of AD needs to offer scope for large-scale application. Here, we used a recently established, commercially available, high-throughput technique and found that plasma Aβ correlated weakly with CSF Aβ and was unable to distinguish between AD patients and biomarker-healthy, non-diseased controls. Plasma Aβ at the cut-point with maximum sensitivity and specificity identified 38% of our sample incorrectly as false positive or false negative. We thus deem its performance inacceptable. Diagnostic confidence for clinical AD diagnosis can be considered exceptionally high in our study because AD diagnosis was based on a combination of detailed diagnostic procedures that are not routinely applied in clinical practice outside of specialized memory clinics. Plasma Aβ measured with the present assay can therefore be expected to be even less adequate in more diverse, ‘real-world’ samples that include ‘gray zones’ and prodromal stages of AD. Nonetheless, plasma Aβ may well be a useful biomarker of age-related cognitive impairment in population-based epidemiological research studies aimed at risk stratification and elucidation of pathophysiological mechanisms underlying impairment. The utility of the blood Aβ assay presented here is yet to be determined in that context.
Overall, we conclude that as the evidence currently stands, the plasma Aβ concentration assay may have limited ability to distinguish AD cases from biomarker-healthy, non-diseased controls. Its evaluation in larger samples and, potentially, a shift of focus toward other blood-based biomarkers and/or efforts for technological advancement of plasma Aβ measurement, which has recently gained momentum [30], are warranted.
ACKNOWLEDGMENTS
This work was funded by the Berlin Institute of Health (BIH), QUEST Center, Berlin, Germany.
Authors’ disclosures available online (https://www.j-alz.com/manuscript-disclosures/20-0046r1).
SUPPLEMENTARY MATERIAL
[1] The supplementary material is available in the electronic version of this article: http://dx.doi.org/10.3233/JAD-200046.
REFERENCES
[1] | Global Burden of Disease 2016 Neurology Collaborators ((2019) ) Global, regional, and national burden of neurological disorders, 1990–2016: A systematic analysis for the Global Burden of Disease Study 2016. Lancet Neurol 18: , 459–480. |
[2] | World Health Organization ((2015) ), The Epidemiology and Impact of Dementia. |
[3] | Reddy PH , Manczak M , Mao P , Calkins MJ , Reddy AP , Shirendeb U ((2010) ) Amyloid-β and mitochondria in aging and Alzheimer’s disease: Implications for synaptic damage and cognitive decline. J Alzheimers Dis 20: , S499–S512. |
[4] | Selkoe DJ , Hardy J ((2016) ) The amyloid hypothesis of Alzheimer’s disease at 25 years. EMBO Mol Med 8: , 595–608. |
[5] | Ricciarelli R , Fedele E ((2017) ) The amyloid cascade hypothesis in Alzheimer’s disease: It’s time to change our mind. Curr Neuropharmacol 15: , 926–935. |
[6] | Shea YF , Barker W , Greig-Gusto MT , Loewenstein DA , Duara R , DeKosky ST ((2018) ) Impact of amyloid PET imaging in the memory clinic: A systematic review and meta-analysis. J Alzheimers Dis 64: , 323–335. |
[7] | Blennow K , Zetterberg H ((2018) ) Biomarkers for Alzheimer’s disease: Current status and prospects for the future. J Intern Med 284: , 643–663. |
[8] | Schindler SE , Bollinger JG , Ovod V , Mawuenyega KG , Li Y , Gordon BA , Holtzman DM , Morris JC , Benzinger TLS , Xiong C , Fagan AM , Bateman RJ ((2019) ) High-precision plasma beta-amyloid 42/40 predicts current and future brain amyloidosis. Neurology 93: , e1647–e1659. |
[9] | Jack CR Jr. , Bennett DA , Blennow K , Carrillo MC , Dunn B , Haeberlein SB , Holtzman DM , Jagust W , Jessen F , Karlawish J , Liu E , Molinuevo JL , Montine T , Phelps C , Rankin KP , Rowe CC , Scheltens P , Siemers E , Snyder HM , Sperling R ((2018) ) NIA-AA Research Framework: Toward a biological definition of Alzheimer’s disease. Alzheimers Dement 14: , 535–562. |
[10] | Glymour MM , Brickman AM , Kivimaki M , Mayeda ER , Chene G , Dufouil C , Manly JJ ((2018) ) Will biomarker-based diagnosis of Alzheimer’s disease maximize scientific progress? Evaluating proposed diagnostic criteria. Eur J Epidemiol 33: , 607–612. |
[11] | Quigley H , Colloby SJ , O’Brien JT ((2011) ) PET imaging of brain amyloid in dementia: A review. Int J Geriatr Psychiatry 26: , 991–999. |
[12] | Ritchie C , Smailagic N , Noel-Storr AH , Takwoingi Y , Flicker L , Mason SE , McShane R ((2014) ) Plasma and cerebrospinal fluid amyloid beta for the diagnosis of Alzheimer’s disease dementia and other dementias in people with mild cognitive impairment (MCI). Cochrane Database Syst Rev, CD008782. |
[13] | Buchhave P , Minthon L , Zetterberg H , Wallin AK , Blennow K , Hansson O ((2012) ) Cerebrospinal fluid levels of beta-amyloid 1-42, but not of tau, are fully changed already 5 to 10 years before the onset of Alzheimer dementia. Arch Gen Psychiatry 69: , 98–106. |
[14] | Bocchetta M , Galluzzi S , Kehoe PG , Aguera E , Bernabei R , Bullock R , Ceccaldi M , Dartigues JF , de Mendonca A , Didic M , Eriksdotter M , Felician O , Frolich L , Gertz HJ , Hallikainen M , Hasselbalch SG , Hausner L , Heuser I , Jessen F , Jones RW , Kurz A , Lawlor B , Lleo A , Martinez-Lage P , Mecocci P , Mehrabian S , Monsch A , Nobili F , Nordberg A , Rikkert MO , Orgogozo JM , Pasquier F , Peters O , Salmon E , Sanchez-Castellano C , Santana I , Sarazin M , Traykov L , Tsolaki M , Visser PJ , Wallin AK , Wilcock G , Wilkinson D , Wolf H , Yener G , Zekry D , Frisoni GB ((2015) ) The use of biomarkers for the etiologic diagnosis of MCI in Europe: An EADC survey. Alzheimers Dement 11: , 195–206.e191. |
[15] | Costerus JM , Brouwer MC , van de Beek D ((2018) ) Technological advances and changing indications for lumbar puncture in neurological disorders. Lancet Neurol 17: , 268–278. |
[16] | Duits FH , Martinez-Lage P , Paquet C , Engelborghs S , Lleo A , Hausner L , Molinuevo JL , Stomrud E , Farotti L , Ramakers I , Tsolaki M , Skarsgard C , Astrand R , Wallin A , Vyhnalek M , Holmber-Clausen M , Forlenza OV , Ghezzi L , Ingelsson M , Hoff EI , Roks G , de Mendonca A , Papma JM , Izagirre A , Taga M , Struyfs H , Alcolea DA , Frolich L , Balasa M , Minthon L , Twisk JWR , Persson S , Zetterberg H , van der Flier WM , Teunissen CE , Scheltens P , Blennow K ((2016) ) Performance and complications of lumbar puncture in memory clinics: Results of the multicenter lumbar puncture feasibility study. Alzheimers Dement 12: , 154–163. |
[17] | Rabinovici GD , Gatsonis C , Apgar C , Chaudhary K , Gareen I , Hanna L , Hendrix J , Hillner BE , Olson C , Lesman-Segev OH , Romanoff J , Siegel BA , Whitmer RA , Carrillo MC ((2019) ) Association of amyloid positron emission tomography with subsequent change in clinical management among medicare beneficiaries with mild cognitive impairment or dementia. JAMA 321: , 1286–1294. |
[18] | van Maurik IS , Slot RER , Verfaillie SCJ , Zwan MD , Bouwman FH , Prins ND , Teunissen CE , Scheltens P , Barkhof F , Wattjes MP , Molinuevo JL , Rami L , Wolfsgruber S , Peters O , Jessen F , Berkhof J , van der Flier WM ((2019) ) Personalized risk for clinical progression in cognitively normal subjects-the ABIDE project. Alzheimers Res Ther 11: , 33. |
[19] | Manca C , Rivasseau Jonveaux T , Roch V , Marie PY , Karcher G , Lamiral Z , Malaplate C , Verger A ((2019) ) Amyloid PETs are commonly negative in suspected Alzheimer’s disease with an increase in CSF phosphorylated-tau protein concentration but an Abeta42 concentration in the very high range: A prospective study. J Neurol 266: , 1685–1692. |
[20] | Hampel H , Shen Y , Walsh DM , Aisen P , Shaw LM , Zetterberg H , Trojanowski JQ , Blennow K ((2010) ) Biological markers of amyloid beta-related mechanisms in Alzheimer’s disease. Exp Neurol 223: , 334–346. |
[21] | Blennow K ((2017) ) A review of fluid biomarkers for Alzheimer’s disease: Moving from CSF to blood. Neurol Ther 6: , 15–24. |
[22] | Song F , Poljak A , Valenzuela M , Mayeux R , Smythe GA , Sachdev PS ((2011) ) Meta-analysis of plasma amyloid-beta levels in Alzheimer’s disease. J Alzheimers Dis 26: , 365–375. |
[23] | Wang J , Qiao F , Shang S , Li P , Chen C , Dang L , Jiang Y , Huo K , Deng M , Wang J , Qu Q ((2018) ) Elevation of plasma amyloid-beta level is more significant in early stage of cognitive impairment: A population-based cross-sectional study. J Alzheimers Dis 64: , 61–69. |
[24] | Hilal S , Akoudad S , van Duijn CM , Niessen WJ , Verbeek MM , Vanderstichele H , Stoops E , Ikram MA , Vernooij MW ((2017) ) Plasma amyloid-beta levels, cerebral small vessel disease, and cognition: The Rotterdam Study. J Alzheimers Dis 60: , 977–987. |
[25] | Hilal S , Wolters FJ , Verbeek MM , Vanderstichele H , Ikram MK , Stoops E , Ikram MA , Vernooij MW ((2018) ) Plasma amyloid-beta levels, cerebral atrophy and risk of dementia: A population-based study. Alzheimers Res Ther 10: , 63. |
[26] | Chouraki V , Beiser A , Younkin L , Preis SR , Weinstein G , Hansson O , Skoog I , Lambert JC , Au R , Launer L , Wolf PA , Younkin S , Seshadri S ((2015) ) Plasma amyloid-beta and risk of Alzheimer’s disease in the Framingham Heart Study. Alzheimers Dement 11: , 249–257.e241. |
[27] | Nakamura A , Kaneko N , Villemagne VL , Kato T , Doecke J , Dore V , Fowler C , Li QX , Martins R , Rowe C , Tomita T , Matsuzaki K , Ishii K , Ishii K , Arahata Y , Iwamoto S , Ito K , Tanaka K , Masters CL , Yanagisawa K ((2018) ) High performance plasma amyloid-beta biomarkers for Alzheimer’s disease. Nature 554: , 249–254. |
[28] | Fandos N , Perez-Grijalba V , Pesini P , Olmos S , Bossa M , Villemagne VL , Doecke J , Fowler C , Masters CL , Sarasa M ((2017) ) Plasma amyloid beta 42/40 ratios as biomarkers for amyloid beta cerebral deposition in cognitively normal individuals. Alzheimers Dement (Amst) 8: , 179–187. |
[29] | Verberk IMW , Slot RE , Verfaillie SCJ , Heijst H , Prins ND , van Berckel BNM , Scheltens P , Teunissen CE , van der Flier WM ((2018) ) Plasma amyloid as prescreener for the earliest Alzheimer pathological changes. Ann Neurol 84: , 648–658. |
[30] | Palmqvist S , Janelidze S , Stomrud E , Zetterberg H , Karl J , Zink K , Bittner T , Mattsson N , Eichenlaub U , Blennow K , Hansson O ((2019) ) Performance of fully automated plasma assays as screening tests for Alzheimer disease-related beta-amyloid status. JAMA Neurol, doi: 10.1001/jamaneurol.2019.1632. |
[31] | Cosentino SA , Stern Y , Sokolov E , Scarmeas N , Manly JJ , Tang MX , Schupf N , Mayeux RP ((2010) ) Plasma ss-amyloid and cognitive decline. Arch Neurol 67: , 1485–1490. |
[32] | Schupf N , Tang MX , Fukuyama H , Manly J , Andrews H , Mehta P , Ravetch J , Mayeux R ((2008) ) Peripheral Abeta subspecies as risk biomarkers of Alzheimer’s disease. Proc Natl Acad Sci U S A 105: , 14052–14057. |
[33] | Gronewold J , Todica O , Klafki HW , Seidel UK , Kaltwasser B , Wiltfang J , Kribben A , Bruck H , Hermann DM ((2017) ) Association of plasma beta-amyloid with cognitive performance and decline in chronic kidney disease. Mol Neurobiol 54: , 7194–7203. |
[34] | Assini A , Cammarata S , Vitali A , Colucci M , Giliberto L , Borghi R , Inglese ML , Volpe S , Ratto S , Dagna-Bricarelli F , Baldo C , Argusti A , Odetti P , Piccini A , Tabaton M ((2004) ) Plasma levels of amyloid beta-protein 42 are increased in women with mild cognitive impairment. Neurology 63: , 828–831. |
[35] | Blasko I , Jellinger K , Kemmler G , Krampla W , Jungwirth S , Wichart I , Tragl KH , Fischer P ((2008) ) Conversion from cognitive health to mild cognitive impairment and Alzheimer’s disease: Prediction by plasma amyloid beta 42, medial temporal lobe atrophy and homocysteine. Neurobiol Aging 29: , 1–11. |
[36] | Seino Y , Nakamura T , Kawarabayashi T , Hirohata M , Narita S , Wakasaya Y , Kaito K , Ueda T , Harigaya Y , Shoji M ((2019) ) Cerebrospinal fluid and plasma biomarkers in neurodegenerative diseases. J Alzheimers Dis 68: , 395–404. |
[37] | Lovheim H , Elgh F , Johansson A , Zetterberg H , Blennow K , Hallmans G , Eriksson S ((2017) ) Plasma concentrations of free amyloid beta cannot predict the development of Alzheimer’s disease. Alzheimers Dement 13: , 778–782. |
[38] | Huang Y , Potter R , Sigurdson W , Kasten T , Connors R , Morris JC , Benzinger T , Mintun M , Ashwood T , Ferm M , Budd SL , Bateman RJ ((2012) ) beta-amyloid dynamics in human plasma. Arch Neurol 69: , 1591–1597. |
[39] | Jarrett JT , Berger EP , Lansbury PT Jr. ((1993) ) The carboxy terminus of the beta amyloid protein is critical for the seeding of amyloid formation: Implications for the pathogenesis of Alzheimer’s disease. Biochemistry 32: , 4693–4697. |
[40] | Lewczuk P , Kornhuber J , Wiltfang J ((2006) ) The German Competence Net Dementias: Standard operating procedures for the neurochemical dementia diagnostics. J Neural Transm (Vienna) 113: , 1075–1080. |
[41] | Schipke CG , Jessen F , Teipel S , Luckhaus C , Wiltfang J , Esselmann H , Frolich L , Maier W , Ruther E , Heppner FL , Prokop S , Heuser I , Peters O ((2011) ) Long-term stability of Alzheimer’s disease biomarker proteins in cerebrospinal fluid. J Alzheimers Dis 26: , 255–262. |
[42] | Folstein MF , Folstein SE , McHugh PR ((1975) ) ‘Mini-mental state’. A practical method for grading the cognitive state of patients for the clinician. J Psychiatr Res 12: , 189–198. |
[43] | Perez-Grijalba V , Fandos N , Canudas J , Insua D , Casabona D , Lacosta AM , Montanes M , Pesini P , Sarasa M ((2016) ) Validation of immunoassay-based tools for the comprehensive quantification of Abeta40 and Abeta42 peptides in plasma. J Alzheimers Dis 54: , 751–762. |
[44] | Youden WJ ((1950) ) Index for rating diagnostic tests. Cancer 3: , 32–35. |
[45] | Perez-Grijalba V , Romero J , Pesini P , Sarasa L , Monleon I , San-Jose I , Arbizu J , Martinez-Lage P , Munuera J , Ruiz A , Tarraga L , Boada M , Sarasa M ((2019) ) Plasma Abeta42/40 ratio detects early stages of Alzheimer’s disease and correlates with CSF and neuroimaging biomarkers in the AB255 Study. J Prev Alzheimers Dis 6: , 34–41. |
[46] | Kurz A , Perneczky R ((2011) ) Amyloid clearance as a treatment target against Alzheimer’s disease. J Alzheimers Dis 24 Suppl 2: , 61–73. |
[47] | Perez-Grijalba V , Arbizu J , Romero J , Prieto E , Pesini P , Sarasa L , Guillen F , Monleon I , San-Jose I , Martinez-Lage P , Munuera J , Hernandez I , Buendia M , Sotolongo-Grau O , Alegret M , Ruiz A , Tarraga L , Boada M , Sarasa M ((2019) ) Plasma Abeta42/40 ratio alone or combined with FDG-PET can accurately predict amyloid-PET positivity: A cross-sectional analysis from the AB255 Study. Alzheimers Res Ther 11: , 96. |
[48] | de Rojas I , Romero J , Rodriguez-Gomez O , Pesini P , Sanabria A , Perez-Cordon A , Abdelnour C , Hernandez I , Rosende-Roca M , Mauleon A , Vargas L , Alegret M , Espinosa A , Ortega G , Gil S , Guitart M , Gailhajanet A , Santos-Santos MA , Moreno-Grau S , Sotolongo-Grau O , Ruiz S , Montrreal L , Martin E , Peleja E , Lomena F , Campos F , Vivas A , Gomez-Chiari M , Tejero MA , Gimenez J , Perez-Grijalba V , Marquie GM , Monte-Rubio G , Valero S , Orellana A , Tarraga L , Sarasa M , Ruiz A , Boada M ((2018) ) Correlations between plasma and PET beta-amyloid levels in individuals with subjective cognitive decline: The Fundacio ACE Healthy Brain Initiative (FACEHBI). Alzheimers Res Ther 10: , 119. |
[49] | Bu G ((2009) ) Apolipoprotein E and its receptors in Alzheimer’s disease: Pathways, pathogenesis and therapy. Nat Rev Neurosci 10: , 333–344. |
[50] | Gottesman RF , Schneider AL , Zhou Y , Chen X , Green E , Gupta N , Knopman DS , Mintz A , Rahmim A , Sharrett AR , Wagenknecht LE , Wong DF , Mosley TH Jr. ((2016) ) The ARIC-PET amyloid imaging study: Brain amyloid differences by age, race, sex, and APOE. Neurology 87: , 473–480. |
[51] | Ba M , Kong M , Li X , Ng KP , Rosa-Neto P , Gauthier S ((2016) ) Is ApoE varepsilon 4 a good biomarker for amyloid pathology in late onset Alzheimer’s disease? Transl Neurodegener 5: , 20. |
[52] | Sutphen CL , Jasielec MS , Shah AR , Macy EM , Xiong C , Vlassenko AG , Benzinger TL , Stoops EE , Vanderstichele HM , Brix B , Darby HD , Vandijck ML , Ladenson JH , Morris JC , Holtzman DM , Fagan AM ((2015) ) Longitudinal cerebrospinal fluid biomarker changes in preclinical Alzheimer disease during middle age. JAMA Neurol 72: , 1029–1042. |
[53] | Peskind ER , Li G , Shofer J , Quinn JF , Kaye JA , Clark CM , Farlow MR , DeCarli C , Raskind MA , Schellenberg GD , Lee VM , Galasko DR ((2006) ) Age and apolipoprotein E*4 allele effects on cerebrospinal fluid beta-amyloid 42 in adults with normal cognition. Arch Neurol 63: , 936–939. |
[54] | Yaffe K , Weston A , Graff-Radford NR , Satterfield S , Simonsick EM , Younkin SG , Younkin LH , Kuller L , Ayonayon HN , Ding J , Harris TB ((2011) ) Association of plasma beta-amyloid level and cognitive reserve with subsequent cognitive decline. JAMA 305: , 261–266. |
[55] | RózgaM, BittnerT, BatrlaR, KarlJ ((2019) ) Preanalytical sample handling recommendations for Alzheimer’s disease plasma biomarkers. Alzheimers Dement 11: , 291–300. |
[56] | LinSY, LinKJ, LinPC, HuangCC, ChangCC, LeeYC, HsiaoIT, YenTC, HuangWS, YangBH, WangPN ((2019) ) Plasma amyloid assay as a pre-screening tool for amyloid positron emission tomography imaging in early stage Alzheimer’s disease. Alzheimers Res Ther 11: , 111. |
[57] | Pase MP , Beiser AS , Himali JJ , Satizabal CL , Aparicio HJ , DeCarli C , Chene G , Dufouil C , Seshadri S ((2019) ) Assessment of plasma total tau level as a predictive biomarker for dementia and related endophenotypes. JAMA Neurol 76: , 598–606. |
[58] | Mattsson N , Cullen NC , Andreasson U , Zetterberg H , Blennow K ((2019) ) Association between longitudinal plasma neurofilament light and neurodegeneration in patients with Alzheimer disease. JAMA Neurol 76: , 791–799. |
[59] | Weston PSJ , Poole T , Ryan NS , Nair A , Liang Y , Macpherson K , Druyeh R , Malone IB , Ahsan RL , Pemberton H , Klimova J , Mead S , Blennow K , Rossor MN , Schott JM , Zetterberg H , Fox NC ((2017) ) Serum neurofilament light in familial Alzheimer disease: A marker of early neurodegeneration. Neurology 89: , 2167–2175. |
[60] | Preische O , Schultz SA , Apel A , Kuhle J , Kaeser SA , Barro C , Graber S , Kuder-Buletta E , LaFougere C , Laske C , Voglein J , Levin J , Masters CL , Martins R , Schofield PR , Rossor MN , Graff-Radford NR , Salloway S , Ghetti B , Ringman JM , Noble JM , Chhatwal J , Goate AM , Benzinger TLS , Morris JC , Bateman RJ , Wang G , Fagan AM , McDade EM , Gordon BA , Jucker M ((2019) ) Serum neurofilament dynamics predicts neurodegeneration and clinical progression in presymptomatic Alzheimer’s disease. Nat Med 25: , 277–283. |
[61] | Nabers A , Hafermann H , Wiltfang J , Gerwert K ((2019) ) Abeta and tau structure-based biomarkers for a blood- and CSF-based two-step recruitment strategy to identify patients with dementia due to Alzheimer’s disease. Alzheimers Dement (Amst) 11: , 257–263. |
[62] | Park JC , Han SH , Yi D , Byun MS , Lee JH , Jang S , Ko K , Jeon SY , Lee YS , Kim YK , Lee DY , Mook-Jung I ((2019) ) Plasma tau/amyloid-beta1-42 ratio predicts brain tau deposition and neurodegeneration in Alzheimer’s disease. Brain 142: , 771–786. |


