
Link Between Dietary Sodium Intake, Cognitive Function, and Dementia Risk in Middle-Aged and Older Adults: A Systematic Review
Abstract
Background:
A key focus for dementia risk-reduction is the prevention of socio-demographic, lifestyle, and nutritional risk factors. High sodium intake is associated with hypertension and cardiovascular disease (both are linked to dementia), generating numerous recommendations for salt reduction to improve cardiovascular health.
Objective:
This systematic review aimed to assess, in middle- and older-aged people, the relationship between dietary sodium intake and cognitive outcomes including cognitive function, risk of cognitive decline, or dementia.
Methods:
Six databases (PubMed, EMBASE, CINAHL, Psych info, Web of Science, and Cochrane Library) were searched from inception to 1 March 2020. Data extraction included information on study design, population characteristics, sodium reduction strategy (trials) or assessment of dietary sodium intake (observational studies), measurement of cognitive function or dementia, and summary of main results. Risk-of-bias assessments were performed using the National Heart, Lung, and Blood Institute (NHLBI) assessment tool.
Results:
Fifteen studies met the inclusion criteria including one clinical trial, six cohorts, and eight cross-sectional studies. Studies reported mixed associations between sodium levels and cognition. Results from the only clinical trial showed that a lower sodium intake was associated with improved cognition over six months. In analysis restricted to only high-quality studies, three out of four studies found that higher sodium intake was associated with impaired cognitive function.
Conclusion:
There is some evidence that high salt intake is associated with poor cognition. However, findings are mixed, likely due to poor methodological quality, and heterogeneous dietary, analytical, and cognitive assessment methods and design of the studies. Reduced sodium intake may be a potential target for intervention. High quality prospective studies and clinical trials are needed.
INTRODUCTION
Dementia is a severe condition characterized by cognitive deficits and loss of independence. It is associated with a wide range of poor outcomes including increased frailty and mortality [1–4]. Aging is one of the most important risk factors for cognitive decline and dementia and the rapid shifts in global demographic trends are contributing to the projected increase in dementia cases over the next decades [5].
Currently, dementia is incurable and pharmacological treatments for symptom management are modest [6]. There have been numerous calls for research directed at the identification and testing of preventative strategies to minimize, or arrest the onset of cognitive decline and reduce the rate of conversion to clinical dementia in high risk individuals [7]. Observational studies suggests that in some cases the pathological processes underlying dementia might be influenced by dietary components [8]. Excessive consumption of dietary sodium (or salt) has been associated with adverse health outcomes [9, 10], including hypertension, stroke, and coronary heart disease [11, 12]. A sustained drop in salt intake of about 4.0 g/day could result in a 4.2 mmHg reduction in blood pressure [15]. Hypertension is a known risk factor for dementia for people in midlife to late life [11]. While there is consensus on the need to reduce sodium consumption for the prevention and treatment of hypertension [12, 13], the evidence on an association between sodium consumption, cognitive impairment, and dementia risk remains limited.
Animal studies have demonstrated that high dietary salt is associated with neurotoxicity (increased amyloid aggregates) [14] and effects systemic and cerebral blood vessels [15, 16], all of which have been linked to cognitive impairment and dementia. More recent findings in animal studies have also suggested that the effect of salt on cognition may occur via a gut-mediated pathway [17]. A high sodium diet in mice leads to an adaptive immune response in the gut which then reduces blood flow to the brain, and promotes neurovascular and cognitive impairment [17]. Therefore, salt reduction may reduce dementia risk via its benefits on cardio-metabolic health and inflammation, both of which have been found to contribute to dementia risk [18–20]. In humans, healthy dietary patterns with low sodium levels, such as the Mediterranean diet (MD) [21, 22] or the Dietary Approach to Stop Hypertension (DASH) diet [23, 24], have been associated with better cognitive function.
The aim of this systematic review was to summarize the current evidence on the association between dietary sodium intake, cognitive function and dementia risk. The findings will be important for informing the development of new intervention and prevention strategies targeting cognitive function. Indeed, being able to reduce the global burden of disease associated with impaired cognitive function and dementia will have significant personal, social and economic consequences.
METHODS
Protocol registration
This review was carried out according to the Preferred Reporting Items for Systematic Reviews and Meta-analyses statement [25]. The review protocol was registered on PROSPERO (CRD4201914632).
Search strategies and study selection
A systematic search for eligible publications was performed in six electronic databases (Pubmed, Embase, CINAHL, Psych info, Web of Science, and Cochrane Library) from inception to 1 March 2020. The search terms were salt, sodium, natrium, intake, consumption, feeding, old age, elderly, aged, geriatric, people, adults, population, cognitive, memory, mental, impairment, function, decline, dementia, Alzheimer. The detailed search strategy is described in Supplementary Table 1. Titles and abstracts of the identified studies were screened for inclusion by two authors (KHY and YCS). Studies that were not relevant were excluded. Full papers were sought for all studies meeting the inclusion criteria and final selections were made by two authors (DM and KHY). Articles were included if they were 1) human studies of middle and older aged adults (aged 45 years and above); 2) original research articles published in peer reviewed scientific journals; and, 3) studies presenting data on cognition and sodium or salt intake with the following study designs: prospective cohorts, cross-sectional studies, clinical trials and case control studies. There were no restrictions on baseline cognitive function. Only English articles were considered. Studies were excluded if there was insufficient information to allow for a critical evaluation of the strength and direction of the results. Specifically, eligible studies had to include information on measurement of dietary sodium or salt intake, cognitive function, and/or dementia and report details on the association between dietary sodium intake with dementia risk and cognitive decline.
Data extraction and quality assessment
Data was extracted by one investigator (KHY)using a standardized electronic template. Data entries were then independently checked for completeness and inconsistencies by a second investigator (DM). Any discrepancies were resolved by consensus. Extracted data included study design, country, study population characteristics, sample size, sodium or salt intake classification, details of dementia status and cognitive function, methods of assessment of sodium or salt intake, cognitive function or dementia risk, and summary measures of the association between salt or sodium intake with risk of dementia, cognitive decline, or cognitive impairment. Further details of potential confounders including age, sex, race, education, body mass index (BMI), health-related comorbidities, physical activity, alcohol intake, and total energy intake were also recorded. In this paper, we have considered the terms salt and sodium as equivalent. However, when extracting the data, the specific measurement of salt or sodium intake is reported as in the original manuscript.
Risk of bias assessments were performed using the National Heart, Lung, and Blood Institute (NHLBI) assessment tool [26]. Studies were rated as “good” (low risk of bias), “fair” (intermediate risk of bias), or “poor” (high risk of bias). Quality was assessed by one reviewer (KHY) and double checked by a second reviewer (YCS). Disagreements were resolved by consensus or by consulting a third reviewer (DM).
Synthesis of results
Due to heterogeneity in study design and large differences in the assessment of salt/sodium intake and cognitive function, it was not possible to pool results in a meta-analysis. Therefore, we have presented the results stratified by cognitive domains (including global cognition, memory, executive function, processing speed and other). The results for the association between sodium or salt intake with mild cognitive impairment (MCI) or dementia are also reported separately.
RESULTS
Study selection
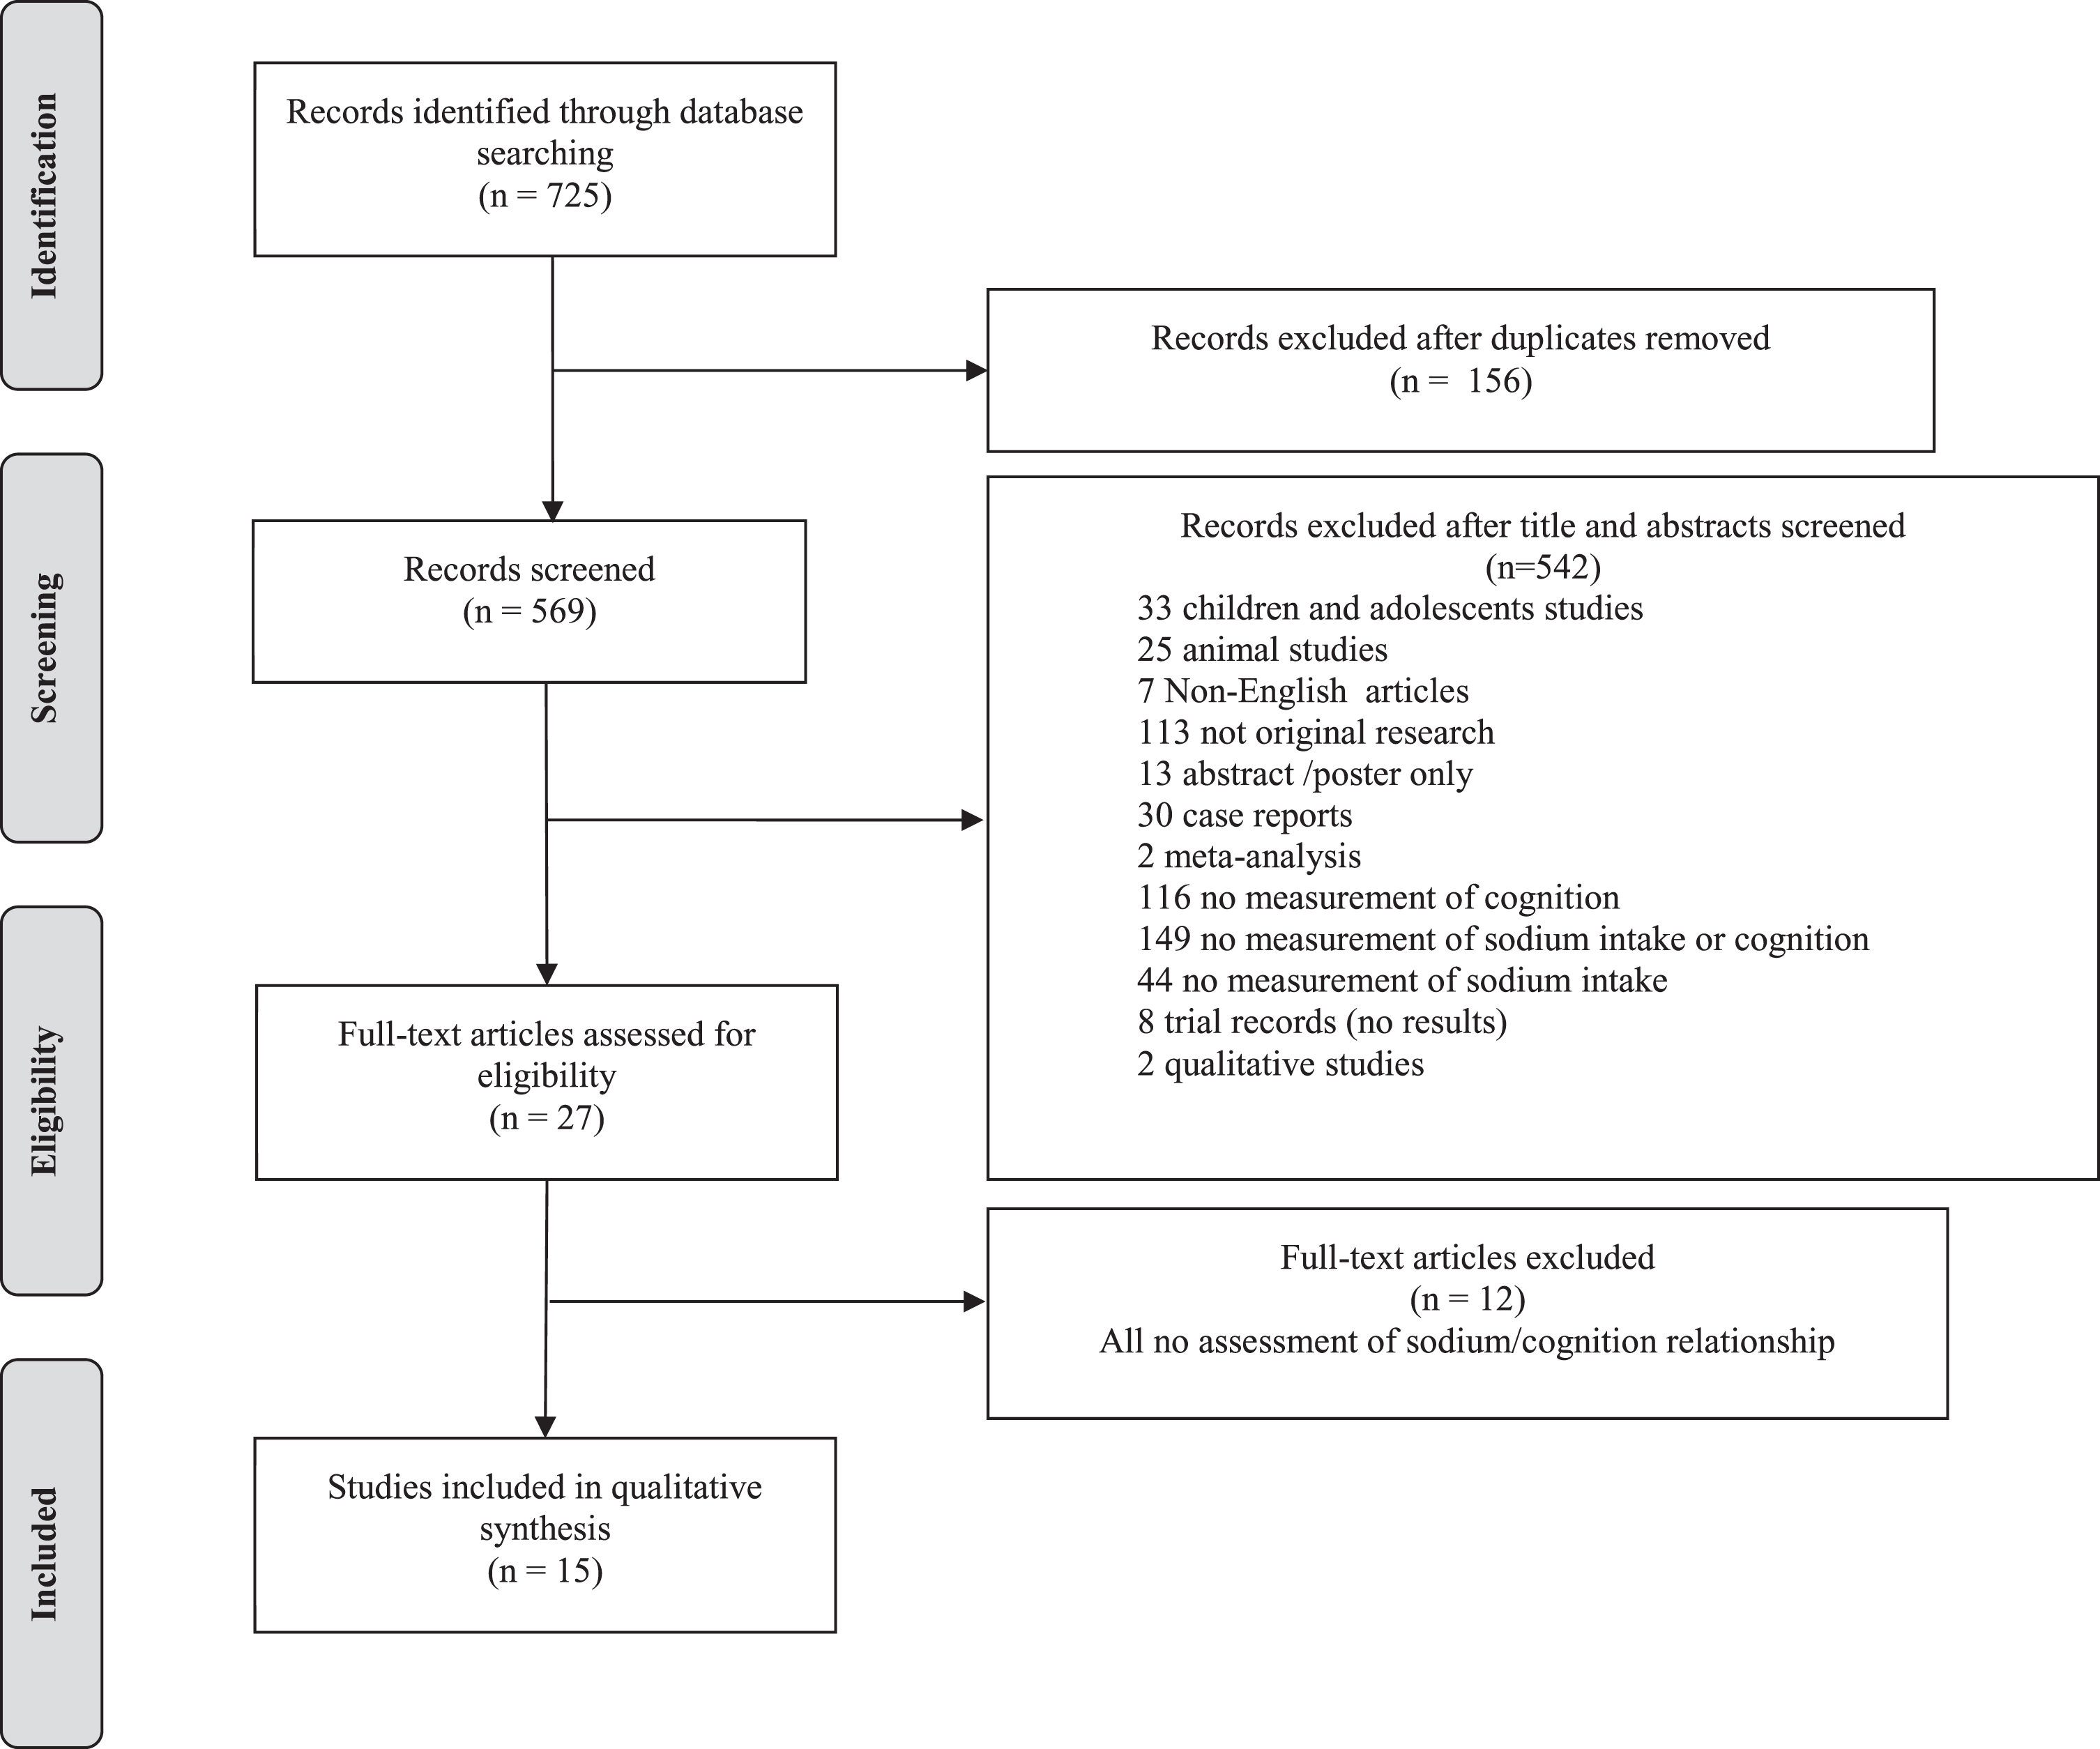
From the electronic search, 725 articles were identified; of which 156 were duplicates and therefore removed. After title and abstract screening 542 papers were excluded leaving 27 for full text review. From the full text review, 15 studies fulfilled the inclusion criteria and were included in the review (see Fig. 1).
Fig.1
Flow diagram of study selection.
Study characteristics
This review includes data from one clinical trial [27], six longitudinal cohort studies [28–33] (of which three studies only reported results of cross-sectional analyses [30, 31, 33]) and eight cross-sectional studies [34–41] (Table 1). Six of the studies were conducted in the United States of America (USA) [27–29, 31, 32, 39], two studies were conducted in Australia [33, 36], and one study each was conducted in Canada [30], Turkey [34], Korea [37], Poland [35], Scotland [38], Ireland [40], and China [41]. The only clinical trial included 160 participants who had subjective memory complaints, objective cognitive impairment (as assessed with the Montreal Cognitive Assessment [MoCA]), and at least one cardiovascular risk factor [27]. Mean age was 65.4 years (SD = 6.8) with a follow-up time of six months. The six [28–33] cohort studies had sample sizes ranging from 1,194 [29] to 6,426 [28] participants. Age ranged from 40 to 96 (only one study [32] included participants aged 40 years and above, with the mean age of participants higher than 45 years old). Follow-up time ranged from three to 36 years. The remaining eight [34–41] cross-sectional studies had sample sizes ranging from 44 [40] to 402 [35] participants with ages ranging from 50 to 85 years. Thirteen studies included both men and women, with two studies only including post-menopausal women [28, 35].
Table 1
Characteristics of reviewed studies
| Study | Country, settings and design | Study population | Sample size | How salt intake was estimated | How cognitive function/status was ascertained | Cognitive outcome Assessed |
| Haring et al. [28] | USA, clinical longitudinal cohort study | From WHIMS study cohort - a hormone replacement therapy trial of postmenopausal women: 1. Sex distribution: all women 2. Aged between 65 – 79 years 3. Mean follow-up period: 9.1 years. 4. Cognitive status at enrolment: dementia free 5. Inclusion/exclusion: only hypertensive women and normotensive but on anti-hypertensive medications were included in the analysis. Women with incomplete data, or extreme caloric intake were excluded. | 6426 | WHI-FFQ for all participants and 24-h urinary sodium excretion in a subsample of women to correct for the dietary self-report. | Yearly screening with 3MS, if score below pre-established cut-off points, the following were used to determine cognitive status of normal, MCI or probable dementia (in accordance with DSM-IV criteria): 1. Consortium to Establish a Registry for Alzheimer’s Disease (CERAD) battery, 2. MMSE 3. Trail Making Test parts A and B 4. A structured psychiatric interview (PRIMEMD) 5. 15-item Geriatric Depression Scale-short form 6. Acquired cognitive and behavioral changes interview completed by a knowledgeable friend or family member. | Cognitive decline |
| Nowak et al. [29] | USA, community, longitudinal cohort | From the Health ABC study cohort - healthy men and women from a sample of Medicare beneficiaries 1. Sex distribution: more women (55.6%) than men (44.4%) 2. Aged between 70-79 years old with 3. Median follow up of 6.9±0.1 years. 4. Cognitive status at enrolment: cognitively intact, cognitive impairment at baseline (3MS≥1.5 SD above the mean) 5. Inclusion/exclusion: Participants with missing data, implausible dietary data, sodium intake <500 mg/day or potassium intake>1000 mg/day were excluded. | 1194 | FFQ (108 items) | Yearly 3MS performed, cognitive decline defined as score of ≥1.5 SD above the mean | Cognitive decline |
| Blumenthal et al. [27] | USA, clinical, clinical trial | From the ENLIGHTEN clinical trial, inactive older men and women 1. Sex distribution: men (34%) and women (66%) 2. Mean age 65.4 (SD 6.8) 3. Follow-up period: 6 months 4. Cognitive status at enrolment: dementia free but with subjective memory complaints and objective cognitive impairment 5. Inclusion/exclusion: included if participant had at least 1 CVD risk factor (together with the qualifying cognitive status of subjective memory complaints and objective cognitive impairment), excluded if they had missing data, were cognitively impaired (MCI) at baseline, incomplete dietary information or extreme caloric intake (<500 kcal or >3500 kcal per day). 6. Intervention - randomized into 2 x 2 factorial interventions of: aerobic exercise alone, DASH diet alone, aerobic exercise and DASH or health education alone | 160 | FFQ + Four-day food diary, using DASH scoring algorithm from Epstein and Folsom | Neuropsychiatric battery used to assess cognitive function: 1. Executive: Trail Making Test, Stroop test, Digit span forward. Backward subtest from Weschler Adult Intelligence Scale, Digit symbol substitution test from Weschler Adult Intelligence Test, Ruff 2 & 7 test and Animal Naming Test 2. Memory: Hopkins Verbal learning Test- revised, Medical College of Georgia Complex Figure Test, Language/verbal fluency: Controlled Oral Word Association Test (COWA) and Animal Naming Test. 3. Changes in global function was assessed using modified CDR Sum of Boxes (a clinical interview) But for sodium, only executive function was mentioned - a composite score of all the executive functioning tests was derived. | Cognitive improvement |
| Fiocco et al. [30] | Canada, community, cross sectional analysis from a longitudinal cohort | From the NuAge cohort of community dwelling men and women: 1. Sex distribution: men (49%) and women (51%) 2. Aged between 67-84 years. 3. Cognitive status at enrolment: dementia free - participants with baseline cognitive impairment (defined as 3MS ≥79) were excluded 4. Inclusion/exclusion: Individuals with missing information or presence of neurological diseases which can impact brain health (cerebral vascular disease, Parkinson’s disease, epilepsy or muscular dystrophy) were excluded | 1262 | 78-item semiquantitative FFQ | 3MS score of ≥79 was used to define cognitive impairment. | Cognitive function |
| Rush et al. [31] | USA, community, cross sectional analysis from a longitudinal cohort | Drawn from the Rancho Bernado cohort of community dwelling healthy men and women 1. Sex distribution: men (40%) and women (60%) 2. Aged between 50 to 96 years old (mean age 74.5±8.7) 3. Cognitive status at enrolment: No exclusions were performed on the basis of baseline cognitive status. 4. Inclusion/Exclusion: Participants with missing data were excluded from analysis. | 925 | Willet FFQ (153 items) | Neuropsychological battery measuring 1 domain, and one screening test: 1. Executive: Verbal Fluency Test and Trail Making test (B) 2. Screening: MMSE Definition of cognitive impairment: >132 for Trails B, <26 for MMSE and <12 for Verbal Fluency Test | Cognitive function |
| Afsar [34] | Turkey, clinical, cross-sectional study | From an outpatient nephrology unit in a hospital of newly diagnosed essential hypertension 1. Sex distribution: men (42%) and women (58%) 2. Mean age of 54.2 ± 16.1 years. 3. Cognitive status at baseline: No exclusions were performed on the basis of baseline cognitive status. | 119 | 24-h urinary sodium excretion | MMSE, scores used on a continuous measure, no cut-offs imposed | Cognitive function |
| Hwang and Kim [37] | Korea, clinical, cross- sectional study | From a cardiovascular outpatient clinic of heart failure 1. Sex distribution: More male (70%) compared to female (30%) patients 2. Mean age of 57±14.1 years and range age of 21 to 79 years. 3. Cognitive status at enrolment: intact cognitive functioning as defined by exclusion criteria 4. Inclusion/exclusion: Participants were excluded if they experienced acute cardiac events within 3 months prior to enrolment, visual or hearing impairment and documented pathologic conditions that compromised cognitive functioning (such as dementia, stroke, psychiatric condition or renal failure requiring dialysis). | 91 | Three-day food diary | Seoul Neuropsychological Screening Battery (SNSB) measuring 2 domains and one screening test: 1. Screening: MMSE (Korean version) 2. Memory: Seoul Verbal learning Test (immediate and delayed recall memory) 3. Executive: Controlled Oral Word Association test | Cognitive function |
| Brownbill and Ilich [39] | USA, community, cross-sectional study | From another longitudinal study of community dwelling healthy post-menopausal women investigating association of reduced sodium intake on bone health. 1. Sex distribution: all post-menopausal women 2. Mean age of 69.7 (± 6.7). 3. Cognitive status at baseline: cognitively well - no exclusions were performed on the basis of baseline cognitive status. Participants had average MMSE of 27.9 (range 22-30) 4. Inclusion/exclusion: no others mentioned | 97 | Three-day food diary | MMSE - normal cognition was defined as MMSE≥27, impaired cognition defined as MMSE<27 | Cognitive function |
| Li et al. [32] | USA, community, longitudinal cohort | From the Framingham Offspring cohort of community dwelling healthy men and women 1. Sex distribution: men (49.5%) and women (50.5%) 2. Aged between 40 to 65 years old at baseline 3. Follow up of more than 30 years. 4. Cognitive status at enrolment: not demented at baseline 5. Inclusion/exclusion: Men and women diagnosed with dementia at baseline were excluded from the study. | 2461 | Self-reported question: Low salt diet | Participants would undergo MMSE and neuropsychological assessments at study visits and dementia was diagnosed according to DSM-IV criteria (for Alzheimer’s Disease type dementia) or according to the National Institute of Neurological Disorders and Stroke and the Association Internationale pour la Recherche et l'Enseignement en Neurosciences (NINDS-AIREN) (for vascular type dementia). | Cognitive decline |
| Koh et al. [36] | Australia, independent living facility, cross-sectional study | From an independent living facility: Illawarra Retirement Trust. 1. Sex distribution: men (36%) and women (64%) 2. Mean age of 78.2±6.1 years 3. 3. Cognitive status at enrolment: Participants were described as having no serious cognitive impairment at inclusion. 3. Inclusion/exclusion: participants with incomplete data were excluded. | 47 | Three-day food diary | Measured 3 cognitive domains: 1. Executive: Verbal Fluency Test, Trail Making Test, Digit Span Backwards 2. Memory: Rey Auditory Verbal Learning Test (RAVLT) 3. Language: Boston Naming test | Cognitive function |
| Bojar et al. [35] | Poland, community, cross-sectional study | From community dwelling healthy post-menopausal women 1. Sex distribution: all women 2. Aged between 50-65 years. 3. Cognitive status at enrolment: cognitively normal (MoCA>26) 4. Inclusion/exclusion: Participants were excluded if they had active cancerous disease within 5 years before enrolment into study, mental diseases (depression, substance addiction or diagnosed nosologic unit with symptoms of dementia. | 402 | Seven-day food diary | Used a neuropsychological battery (the CNS Vital Signs) to determine cognitive function- seven cognitive domains: 1. Memory: verbal and Visual memory test 2. Processing speed: Symbol Digit test 3. Executive: Shifting Attention Test 4. Psychomotor speed: Finger Tapping and Symbol Digits test 5. Reaction time: Stroop test 6. Attention: Continuous performance test, Shifting Attention Test, Stroop test 7. Cognitive flexibility: Shifting attention test Results were broken down by domains | Cognitive function |
| Salerno-Kennedy and Cashman [40] | Ireland, community, cross-sectional study | Community dwelling healthy adults: including first degree blood relatives of AD patients. 1. Sex distribution: More women (72.7%) compared to men (37.3%). 2. Mean age of participants 57.7 (SD 9.4) 3. Cognitive status at enrolment: No exclusions were performed on the basis of baseline cognitive status. 4. Inclusion/exclusion: Subjects were excluded from the study if they suffered from depression and stroke. | 44 | Semi-quantitative FFQ | MMSE - normal MMSE>24, impaired defined as MMSE≤24 | Cognitive function |
| del C. Valdés Hernández et al. [38] | Scotland, community, cross-sectional study | From the Lothian Birth Cohort 1936 - community dwelling healthy men and women 1. Sex distribution: more women (54%) compared to men (46%) 2. Mean age of 72.7 (SD 0.8). 3. Cognitive status at enrolment: no dementia 4. Inclusion/exclusion: Analysis only included the extreme /middle /avoidance of iodine intake subgroups of participants | 189 | Scottish Collaborative Group Food Frequency Questionnaire | Neuropsychological battery generating three domains, composite scoring with PCA: 1. General cognitive factor- Digit Symbol, Digit Span Backward, Symbol Search, Letter-Number Sequencing, Block Design and Matrix Reasoning 2. Memory - Logical memory Total Immediate and Delayed recall, Verbal Paired Associates Immediate and Delayed Recall, Spatial Apn Total Score, Letter-Number Sequencing and Digit Span Backward 3. Speed - Simple Reaction Time and Choice Reaction Time | Cognitive function |
| Milte et al. [33] | Australia, community, cross sectional analysis from a population based longitudinal cohort study | From the Wellbeing, Eating and Exercise for a Long Life (WELL) study. 1. Sex distribution: nearly equal proportions of men (49%) and women (51%) 2. Aged between 55 to 65 years old. 3. Cognitive status at enrolment: No exclusions were performed on the basis of baseline cognitive status. 4. Inclusion/exclusion: Only participants with complete data were included in the analyses. Responses for salt intake were collected in 2010 and 2014. Cognitive function tests were conducted in 2014 by telephone interview. | 617 | Self-reported questions on whether: 1. “Salt added to your food during cooking” (response choices “Never”, “Sometimes”, “Usually”, “Don’t Know”) and 2.“Salt added to your food after it is cooked” (response choices of “Never”, “Sometimes” and “Usually”) | Telephone Interview for Cognitive Status Modified (TICS-m). Scores can range from 0 to 50. Cut offs for cognitive categories were: 1. Normal cognitive function - score of 32 and above 2. Possible mild cognitive impairment - score of between 31 and 28 3. Possible dementia - score of 27 and below. | Cognitive function |
| Yao et al. [41] | China, community, cross-sectional study | All community-dwelling older adults from two towns in a Shanghai sub-district: 1. Sex distribution: more women (64%) participants than men (36%). 2. Aged 60 years and above 3. Cognitive status at baseline: no dementia 4. Inclusion/exclusion: Participants were excluded if they were hearing impaired, speech impaired, diagnosed with dementia, refused to cooperate or in psychosis. | 2809 | Self-reported question: Preferring non-salty diet (yes/no) | Chinese version of the MMSE (C-MMSE) used. Cut-offs for cognitive impairment were according to education level: Without formal education - score 17 and below With 1 to 6 years education - score of 20 and below With more than 6 years of education - score of 24 and below | Cognitive function |
3MS, The Modified Mini-Mental State Test; AD, Alzheimer’s disease; DASH, Dietary Approaches to Stop Hypertension diet; DSM-IV, Diagnostic and Statistical Manual of Mental Disorders (fourth edition); FFQ, Food frequency questionnaire; MMSE, Mini-Mental State Examination; MoCA, Montreal Cognitive Assessment; PCA, Principal Component Analysis; SD, standard deviation
A total of 55 independent analyses examining the association between sodium or salt intake and cognitive outcomes were extracted from the 15 studies; out of which 26 analyses adjusted the results for confounding factors.
Risk of bias/Quality assessment
Based on the NIHLB assessment tool four studies were rated as “good” [27–30], five were classified as “fair” [31–34, 37], and six studies were rated as “poor” [35, 36, 38–41]. The main issues across the studies included poorly defined study populations, non-reporting of participating rate, large proportion of missing data, and no adjustment for confounding factors.
See Supplementary Tables 2 and 3 for the rating of each study.
Assessment of sodium and salt intake
Sodium or salt intake was assessed using a wide variety of methods and four studies used more than one assessment of sodium intake [29–31, 34]. Seven studies [27–31, 38, 40] assessed sodium or salt intake with food frequency questionnaires (FFQs), five studies [27, 35–37, 39] used food diaries, two studies [28, 34] used 24-hour urinary sodium excretion, two studies used single self-reported salt-intake questions [32, 41], and one study used two self-reported salt-intake questions [33]. Two studies [29, 37] used sodium/potassium intake ratios (Na/K) to assess sodium intake.
Assessment of cognitive function, MCI, and dementia
There were large differences in how cognitive function was assessed. The most frequently used tests included the Mini-Mental State Examination (MMSE) (six studies [31, 33, 34, 37, 39, 40]), modified Mini-Mental State Examination (3MS, two studies [29, 30]), Verbal Fluency Test (two studies [31, 36]), and the Trail Making Test (two studies [27, 36]). Only one study used the Telephone Interview for Cognitive Status Modified (TICS-m) [41]. Three studies combined cognitive measurements to derive composite scores of cognitive performance [27, 35, 38]. Seven studies used more than one measure of cognition [27, 28, 31, 35–38].
Two studies [28, 32] assessed clinical status, including MCI or dementia (all-cause). Dementia was diagnosed using the criteria from the Diagnostic and Statistical Manual of Mental Disorders Fourth Edition (DSM-IV). MCI was diagnosed if the participant scored in the 10th or lower percentile in at least one area of cognitive function on modified neuropsychological tests established by the Consortium to Establish a Registry for Alzheimer’s Disease or if the participant was reported to suffer from some functional impairment but still performed well in basic activities of daily living as reported by a reliable informant [28]. A study by Li et al. [32] additionally used the criteria from National Institute of Neurological Disorders and Stroke and the Association Internationale pour la Recherche et l’Enseignementen Neurosciences (NINDS–AIREN) for the diagnosis of vascular dementia.
Global cognition
Eight studies [29–31, 33, 34, 37, 39–41], with sample sizes ranging from 44 [35] to 1,262 [30], reported associations between sodium intake and global cognitive function measured using single tests including the MMSE, 3MS, or the TICS-m (see Table 2). Only one study was analyzed prospectively [29], the others were cross-sectional [31, 33, 34, 37, 39–41]. Overall, the results were mixed. In studies using the MMSE or 3MS, four [29, 30, 34, 40] showed that higher dietary sodium was associated with poor global cognitive function, one study showed that lower dietary sodium preference was associated with better cognitive function [41], and one study showed that higher sodium was associated with better MMSE scores [31]. The remaining two studies reported no associations [37, 39].
The only study utilizing the TICS-m reported no association in the total study sample and mixed associations when the analyses were stratified by sex [33]. Men who reported they “usually” add salt during cooking had poorer cognitive function than men who reported “never”. In contrast, women who reported they “sometimes” add salt after cooking had better cognitive function than women who reported “never”. Two studies [35, 38] using a composite of tests to derive a global cognition score both reported no association between sodium intake and cognitive function (see Table 2).
Table 2
The association between sodium intake and global cognition (measured by screening tools)
| Studies | Quality assessment | Salt categorization | Type of Cognitive assessment | Categorization of cognitive scores/function | Type of analysis | Results | Direction of association | |||
| Nowak et al. [29] | Good | Sodium measured in mg/day, divided into quartiles, | 3MS | Categorical, 3MS score (≥1.5 SD of mean decline) = CI | Logistic regression | For sodium Sodium quartiles OR (95% CI) Q1 597-1921 mg/day Ref Q2 1921-2511 mg/day 0.82 (0.45-1.47) Q3 2511-3264 mg/day 0.65 (0.34-1.27) Q4 3264-11565 mg/day 0.94 (0.42-2.10) Adjusted for: Age, sex, race, education, smoking, BMI, SBP, hypertension history, stroke, CVD, diabetes, estimated glomerular filtration rate, total kcals | No association | |||
| Sodium measured in mg/day, continuous measures | 3MS | Categorical, 3MS score (≥1.5 SD of mean decline) = CI | Logistic regression | For sodium OR (95% CI) Continuous 0.96 (0.50-1.84) (log2 transformed) Adjusted for: Age, sex, race, education, smoking, BMI, SBP, hypertension history, stroke, CVD, diabetes, estimated glomerular filtration rate, total kcals | No association | |||||
| Sodium/potassium ratio was calculated, divided into quartiles | 3MS | Categorical, 3MS score (≥1.5 SD of mean decline) = CI | Logistic regression | For sodium/potassium ratio Na/K quartiles OR (95% CI) Q1 0.350-0.743 Ref Q2 0.743-0.904 1.16 (0.64-1.55) Q3 0.904-1.083 0.84 (0.45-1.55) Q4 1.083-2.400 1.36 (0.77-2.38) Adjusted for: Age, sex, race, education, smoking, BMI, SBP, hypertension history, stroke, CVD, diabetes, estimated glomerular filtration rate, total kcals | No association | |||||
| Sodium /potassium ratio was calculated in continuous measures | 3MS | Categorical, 3MS score (≥1.5 SD of mean decline) = CI | Logistic regression | For sodium/potassium OR (95% CI) Continuous 2.02 (1.01-4.03) Adjusted for: Age, sex, race, education, smoking, BMI, SBP, hypertension history, stroke, CVD, diabetes, estimated glomerular filtration rate, total kcals | Higher sodium: potassium --> CI | |||||
| Fiocco et al. [30] | Good | Sodium measured in mg/day, split into tertiles | 3MS | Categorical, CI defined as < 79 | GEE | Outcome: Baseline cognitive function Sodium intake tertile Median 3MS (SD) p Low (median: 1800) 93.74 (0.002) 0.21 Medium (median: 2634) 94.05 (0.003) High (median: 3701) 93.44 (0.003) | No association | |||
| Sodium measured in mg/day, split into tertiles | 3MS | Categorical, CI defined as < 79 | GEE | Outcome: Baseline cognitive function Sodium intake tertile Median 3MS (SD) Low activity High activity Low (median: 1800) 94.14 (0.16) 93.45 (0.17) Medium (median: 2634) 93.91 (0.15) 94.25 (0.17) High (median: 3701) 93.42 (0.16) 93.50 (0.17) p 0.82 0.76 Adjusted for: Age, sex, education, diabetes, waist circumference, energy, cholesterol, calcium and Canadian Healthy Eating Index total score | No association | |||||
| Sodium measured in mg/day, split into tertiles | 3MS | Categorical, CI defined as < 79 | GEE | Outcome: Change in cog function over years Sodium intake tertile Median (SD) p Low (median: 1800) -1.18 (0.03) 0.11 Medium (median: 2634) -1.83 (0.003) High (median: 3701) -1.53 (0.004) | No association | |||||
| Sodium measured in mg/day, split into tertiles | 3MS | Categorical, CI defined as < 79 | GEE | Stratified by baseline physical activity level - only in low physical activity group there was association Outcome: Change in cog function over years Sodium intake tertile M (SD) p Low (median: 1800) -0.86 (0.003) 0.0005 Medium (median: 2634) -2.31 (0.01) High (median: 3701) -2.24 (0.01) Adjusted for: Age, sex, education, diabetes, waist circumference, energy, cholesterol, calcium and Canadian Healthy Eating Index total score | Higher sodium → more cognitive decline in low physical activity group | |||||
| Rush et al. [31] | Fair | Sodium measured in mg/day, in continuous measures | MMSE | Continuous | Linear regression | Dependent variable: MMSE score β = 0.09, p=0.007 Adjusted for: Age, sex, education, total caloric intake, daily potassium intake, calcium intake, Mediterranean diet score | For MMSE in continuous measures lower sodium --> CI | |||
| Sodium measured in mg/day, cut-off at MMSE=26 | MMSE | Categorical, CI= MMSE < 26 normal=MMSE ≥ 26 | Logistic regression | Outcome: CI OR (95% CI) Sodium =1.15 (1.02-1.28) Adjusted for: Age, sex, education, total caloric intake, daily potassium intake, calcium intake, Mediterranean diet score | For MMSE in categorical measures lower sodium --> CI | |||||
| Sodium measured in mg/day, in quartiles | MMSE | Continuous | Linear test for trend | Mean test scores by caloric adjusted sodium intake quartiles p=0.007 Adjusted for: Age, sex, education level, total caloric intake | Higher sodium -> better cognition | |||||
| Afsar [34] | Fair | Sodium measured in mEq/day, log transformed | MMSE | Continuous | Linear regression | Outcome: log transformed 24-h Na excretion MMSE: B = -0.0033, 95%CI= -0.049, -0.017, p<0.0001 Adjusted for: Gender, creatinine clearance, SBP | Higher sodium --> CI | |||
| Sodium measured in mEq/day, log transformed | MMSE | Continuous | Spearman’s correlation | r=-0.300, p=0.001 | Higher sodium --> CI | |||||
| Hwang and Kim [37] | Fair | Sodium/potassium ratio, split into quartiles | MMSE | Continuous | ANOVA | Na/K quartile F p Q1 (M±SD) 25.52±5.93 2.20 0.09 Q2 (M±SD) 27.09±3.27 Q3 (M±SD) 28.52±2.06 Q4 (M±SD) 26.04±4.35 | No association | |||
| Salerno-Kennedy and Cashman [40] | Poor | Sodium measured in mg/day, in continuous measures | MMSE | Categorical CI = MMSE≤24 Normal=MMSE>24 | Kruskal Wallis/ Mann Whitney | Sodium levels, Mean±SD p MMSE>24 (n=40), Na 1.9±0.9 0.037 MMSE=<24 (n=4), Na 3.9±-2.1 | Higher sodium → CI | |||
| del C. Valdés Hernández et al. [38] | Poor | Sodium measured in mg/day, in continuous measures | Digit Symbol, Digit Span Backward, Symbol Search, Letter-Number Sequencing, Block Design and Matrix Reasoning | Continuous | Linear regression | β = -0.05, p = 0.56 | No association | |||
| Bojar et al. [35] | Poor | Sodium measured in mg/day, in continuous measures | composite of 5 domains: memory, psychomotor speed, reaction time, complex attention, cognitive flexibility | Continuous | Pearson’s correlation | Cognition measure r p composite domains 0.086 0.085 | No association | |||
| Brownbill and Ilich [39] | Poor | Sodium measured in mg/day, continuous | MMSE | Categorical: normal = 27-30 mild CI = lower than 27 | ANOVA | Sodium levels, Mean±SD MCI group (n=34), 2114±661 Normal group (n=63), 2322±955 | No association | |||
| Yao et al. [41] | Poor | Categorical, self-reported question: Preferring non-salty diet (yes/no) | C-MMSE | Categorical, according to education level 1. No education: Normal= 18 above CI= 17 below 2. 1-6 years: Normal = 21 above CI= 20 below 3. >6 years: Normal=25 above CI=24 below | Logistic regression | Outcome: CI Preferring non-salty diet OR (95% CI) No reference Yes 0.647 (0.46 - 0.91) Adjusted for: Age | Lower sodium → better cognitive function | |||
| Milte et al. [33] | Fair | Categorical, two questions on addition of salt to food: 1. “Salt added to your food during cooking” (Never/Sometimes/Usually/Don’t Know) 2.“Salt added to your food after it is cooked” (Never/Sometimes/Usually) | TICS-m | Categorical: Normal = 32 and above CI= below 32 | Multiple linear regression | Outcome: MCI or dementia For salt added during cooking (in 2010) - B(95%CI) for total and stratified by sex Response Total Men Women Never reference reference reference Sometimes 0.07 (?0.59, 0.73) ?0.27 (?1.29, 0.76) 0.41 (–0.58, 1.40) Usually 0.11 (–0.79, 1.00) –0.32 (–1.83, 1.18) 0.54 (–0.33, 1.41) For salt added during cooking (in 2014) - B(95%CI) for total and stratified by sex Response Total Men Women Never reference reference reference Sometimes –0.49 (–1.14, 0.16) –0.65 (–1.48, 0.18) –0.13 (–1.26, 0.99) Usually –1.12 (–2.04, –0.19) –1.37 (–2.39, –0.35) –0.47 (–1.70, 0.76) Don’t know –0.93 (–2.98, 1.13) –0.91 (–3.04, 1.21) n/a For salt added after cooking (in 2010) - B(95%CI) for total and stratified by sex Response Total Men Women Never reference reference reference Sometimes 0.34 (–0.23, 0.91) 0.05 (–0.99, 1.08) 0.98 (0.25, 1.71) Usually 0.23 (–0.72, 1.19) –0.18 (–1.58, 1.23) 0.63 (–0.23, 1.49) For salt added after cooking (in 2014) - B(95%CI) for total and stratified by sex Response Total Men Women Never reference reference reference Sometimes 0.07 (–0.59, 0.73) –0.27 (–1.29, 0.76) 0.41 (–0.58, 1.40) Usually 0.11 (–0.79, 1.00) –0.32 (–1.83, 1.18) 0.54 (–0.33, 1.41) All analyses adjusted for: Age, sex, education, urban/rural, clustering by postcode, total physical activities | No association Usually add salt during cooking -> poorer cognitive function (in men only) Sometimes add salt after cooking -> better cognitive function (in women only) No association | |||
3MS, The Modified Mini-Mental State Test; ANOVA, Analysis of Variance; BMI, body mass index; CI, cognitive impairment; CVD, cardiovascular disease; GEE, generalized estimating equation; MCI, mild cognitive impairment; MMSE, Mini-Mental State Examination; Na, sodium; Na/K, sodium/potassium ratio; r, correlation coefficient; SBP, systolic blood pressure; SD, standard deviation; OR, odds ratio, C-MMSE = Chinese MMSE; TICS = Telephone Interview for Cognitive Status modified.
Four studies [27–30] were rated as “good” quality, five studies [31–34, 37] were rated as “fair”, and six studies [35, 36, 38–41] were rated as “poor”. When restricting the analysis to high quality studies only (n = 2 studies [29, 30]) the results were consistent; Nowak et al. [29] showed that a higher Na/K ratio was associated with cognitive decline (OR = 2.02, 95% CI: 1.01–4.03) and Fiocco et al. [30] showed that higher sodium intake was associated with cognitive decline in older subjects with low physical activity.
Memory
Four cross-sectional studies, with sample sizes ranging from 44 to 189, reported associations between sodium intake and memory [35–38] (see Table 3). Eleven different memory tests were used and two studies [35, 38] created composite scores including more than one test. One study [37] was rated as “fair” while the remaining three studies [35, 36, 38] were rated as “poor” quality. The only statistically significant association between sodium intake and memory function was found in the study conducted by Hwang and Kim [37]. This study analyzed the relationship between Na/K quartiles with memory function in heart failure patients and observed that the lowest and highest quartiles of Na/K ratio were associated with poorer memory scores compared to the second and third quartiles of Na/K ratio.
Table 3
Association between sodium intake and memory
| Studies | Quality Assessment | Salt categorization | Type of Cognitive assessment | Categorization of cognitive scores | Type of analysis | Results | Direction of association | ||
| Bojar et al. [35] | Poor | Sodium measured in mg/day, in continuous measures | Verbal memory test | Continuous | Pearson’s correlation | Cognition measure r p Verbal Memory -0.037 0.456 | No association | ||
| Sodium measured in mg/day, in continuous measures | Visual Memory test | Continuous | Pearson’s correlation | Cognition measure r p Visual Memory 0.071 0.158 | No association | ||||
| Sodium measured in mg/day, in continuous measures | Composite Verbal + Visual memory | Continuous | Pearson’s correlation | Cognition measure r p Composite 0.016 0.085 (Verbal + Visual memory) | No association | ||||
| Koh et al. [36] | Poor | Sodium measured in mg/day, in continuous measures | Rey’s Auditory Verbal Learning Test (RAVLT) | Continuous | Spearman’s correlation | Cognition measure r p RAVLT 0.055 >0.05 (not shown exact) | No association | ||
| Hwang and Kim [37] | Fair | Sodium/potassium ratio, split into quartiles | Seoul Verbal Learning Test (Immediate recall section) | Continuous | ANOVA | Na/K quartile F p Immediate recall Q1 (M±SD) 12.91±5.32 3.69 0.015, Q1<Q3 Q2 (M±SD) 16.57±5.01 Q3 (M±SD) 18.43±6.21 Q4 (M±SD) 15.98±5.98 | Higher Na/K--> better cognition, until a threshold, cognition scores dip again, j-shaped | ||
| Sodium/potassium ratio, split into quartiles | Seoul Verbal Learning Test (Delayed recall section) | Continuous | ANOVA | Na/K quartile F p Delayed recall Q1 (M±SD) 4.17±1.95 1.93 0.13 Q2 (M±SD) 4.87±2.60 Q3 (M±SD) 5.78±2.00 Q4 (M±SD) 4.98±2.32 | No association | ||||
| del C. Valdés Hernández et al. [38] | Poor | Sodium measured in mg/day, in continuous measures | Composite score of: Logical memory Total Immediate and Delayed recall Verbal Paired Associates Immediate and Delayed Recall Spatial Span Total Score Letter-Number Sequencing Digit Span Backward | Continuous | Linear regression | β = 0.09, p = 0.29 | No association | ||
ANOVA, Analysis of Variance; FFQ, Food frequency questionnaire; M, mean; Na/K, sodium/potassium ratio; r, correlation coefficient; SD, standard deviation.
Executive function
Five studies [27, 31, 35–37] with sample sizes ranging from 44 to 925 reported associations between sodium intake and executive function (see Table 4). Twelve types of tests were used to assess executive function with the Trail Making Test the most commonly used (n = 3 studies [27, 31, 36]). Only two studies reported significant associations between sodium and executive function, but the results were mixed [27, 31]. The clinical trial, which had a low risk of bias, reported that a lower sodium intake was associated with improved executive function measured using a neuropsychological battery including the Trail Making Test [27]. In contrast, the cross-sectional study by Rush et al. [31], which was rated as fair, reported that higher sodium intake was associated with better performance on the Trail Making Test. The remaining three cross-sectional studies reported no association [35–37].
Table 4
Association between sodium intake and executive function
| Studies | Quality Assessment | Salt categorization | Type of Cognitive assessment | Categorization of cognitive scores/function | Type of analysis | Results | Direction of association | ||
| Bojar et al. [35] | Poor | Sodium measured in mg/day, in continuous measures | Shifting Attention tests | Continuous | Pearson’s correlation | Cognition measure r p Shifting Attention tests 092 0.065 | No association | ||
| Koh et al. [36] | Poor | Sodium measured in mg/day, in continuous measures | Verbal Fluency test (Letter Fluency) | Continuous | Spearman’s correlation | Cognition measure r p Letter Fluency -0.141 >0.05 | No association | ||
| Sodium measured in mg/day, in continuous measures | Verbal Fluency test (Categorical Fluency) | Continuous | Spearman’s correlation | Cognition measure r p Categorical Fluency -0.055 >0.05 | No association | ||||
| Sodium measured in mg/day, in continuous measures | Trail Making test | Continuous | Spearman’s correlation | Cognition measure r p Trailmaking -0.111 >0.05 | No association | ||||
| Sodium measured in mg/day, in continuous measures | Digitspan backwards | Continuous | Spearman’s correlation | Cognition measure r p Digitspan backwards -0.016 >0.05 | No association | ||||
| Hwang and Kim [37] | Fair | Sodium/potassium ratio, split into quartiles | Controlled Oral Word Association test | Continuous | ANOVA | Na/K quartile F p Q1 (M±SD) 17.22±9.04 1.98 0.12 Q2 (M±SD) 21.43±9.19 Q3 (M±SD) 24.78±11.65 Q4 (M±SD) 21.18±11.72 j-shaped but not statistically significant | No association | ||
| Blumenthal et al. [27] | Good | Sodium measured in mg/day, in continuous measures | Composite score of: Trail Making Test, Stroop test, Digit span forward, Backward subtest from Weschler Adult Intelligence Scale, Digit symbol substitution test from Weschler Adult Intelligence Test, Ruff 2 & 7 test and Animal Naming Test | Continuous | GLM | Dependent variable: composite score of cognitive tests For sodium b= 0.18, p=0.024 | Lower sodium --> better cognition | ||
| Rush et al. [31] | Fair | Sodium measured in mg/day, in continuous measures | Verbal Fluency Test | Continuous | Linear regression | Dependent variable: Verbal Fluency Test score For sodium: β= 0.006, p=0.823 Adjusted for: Age, sex, education, total caloric intake, daily potassium intake, calcium intake, Mediterranean diet score | No association | ||
| Sodium measured in mg/day, in quartiles | Verbal Fluency Test | Continuous | Linear test for trend | Mean test scores by caloric adjusted sodium intake quartiles p=0.897 Adjusted for: Age, sex, education level, total caloric intake *more like a inverted j-shaped relationship | Null | ||||
| Sodium measured in mg/day, in continuous measures | Trailmaking Test (Trail B) | Continuous | Linear regression | Dependent variable: Trailmaking Test scores For sodium β= -0.079, p=0.005 Adjusted for: Age, sex, education, total caloric intake, daily potassium intake, calcium intake, Mediterranean diet score | Higher sodium ->better cognition | ||||
| Sodium measured in mg/day, in continuous measures | Trailmaking Test (Trail B) | Continuous | Linear regression | Dependent variable: Trailmaking Test scores sodium intake predicting for Trails B score stratified by age <80 years old: standardized β=-0.04, p=0.365 ≥80 years old: standardized β=-0.15, p=0.014 Adjusted for: Sex, education, total caloric intake | Higher sodium ->better cognition | ||||
| Sodium measured in mg/day, in quartiles | Trailmaking Test (Trail B) | Continuous | Linear test for trend | Mean test scores by caloric adjusted sodium intake quartiles p=0.073 Adjusted for: Age, sex, education level, total caloric intake | Null | ||||
ANOVA, Analysis of Variance; CVD, cardiovascular diseases; FFQ, Food frequency questionnaire; GLM, generalized linear model; M, mean; MoCA, Montreal Cognitive Assessment; Na/K, sodium/potassium ratio; r, correlation coefficient; SD, standard deviation.
Processing speed
Only two cross-sectional studies [35, 38], with sample sizes ranging from 189 to 402, examined associations between sodium intake and processing speed using different cognitive assessments. No significant association was reported in either study (see Table 5). Both studies were rated as “poor” quality.
Table 5
Association between sodium intake and processing speed
| Studies | Quality Assessment | Salt categorization | Type of Cognitive assessment | Categorization of cognitive scores/function | Type of analysis | Results | Direction of association (according to article) | ||
| del C. Valdés Hernéndez et al. [38] | Poor | Sodium measured in mg/day, in continuous measures | Simple Reaction Time and Choice Reaction Time | Continuous | Linear regression | Dependent variable: Simple Reaction Time and Choice Reaction Time scores For Sodium: β=-0.08, p=0.33 | No association | ||
| Bojar et al. [35] | Poor | Sodium measured in mg/day, in continuous measures | Symbol digit | Continuous | Pearson’s correlation | Cognition measure r p Symbol digit 0.035 0.481 | No association | ||
r, correlation coefficient.
Dementia and MCI
Only two prospective studies [28, 32] reported associations between sodium intake with risk of MCI or dementia (see Table 6). The follow-up period for each study was a median of 9.1 years [28] and 36 years [32]. The first study with low bias of risk [28] stratified participants (n = 6426) by different levels of sodium intake (FFQ sodium level adjusted for 24 h urinary levels).They concluded that for women in the sodium intakes tratum of 2,300 mg to 3000 mg per day, hypertension was associated with greater risk of probable dementia/MCI in (HR = 1.28, 95% CI: 1.08–1.51) compared to non-hypertension. The study also concluded that for women in this stratum of sodium intake, those on antihypertensive medication were at a higher risk of probable dementia or MCI compared to those not on antihypertensive medication (HR = 1.25, 95% CI:1.06–1.48).These associations were not significant in other two strata of sodium intake (less than 2300 mg/day and more than 3000 mg/day). Formal tests of interaction were also not significant. The second study [32] found no significant association between sodium intake and risk of incident dementia (OR = 1.64, 95% CI: 0.95–2.83; n = 2461).
Table 6
Association between sodium intake and diagnosis of dementia or MCI
| Studies | Quality Assessment | Salt categorization | Type of Cognitive assessment | Categorization of cognitive scores/function | Type of analysis | Results | Direction of association (according to article) | ||||
| Li et al. [32] | Fair | One question on “low salt diet”, binary “yes” “no” response | formal dementia diagnosis in health facilities | Binary | Logistic regression | Demented Non-Demented Total % Dem All 227 2235 2462 9.2 Non-Low Salt 211 2136 2347 9.0 Low salt diet 16 99 115 14.0 Logistic regression predicting for dementia OR (95% CI) of Low Salt diet = 1.64 (0.95-2.83) | None Lower sodium-->dementia but not statistically significant | ||||
| Haring et al. [28] | Good | Sodium measured in mg/day, analysis split into in groups of sodium 1. ≤1500 mg/day 2. 1501-2999 mg/day 3. >3000 mg/day | DSM-IV criteria for MCI/Probable Dementia | Binary | Hazards ratio | Risk in hypertensive women only, before 24-h urine adjustment Outcome MCI/ProbDem HR (95% CI) sodium ≤1500 mg/day 1.23 (0.85-1.78) sodium 1501-2999 mg/day 1.24 (1.02-1.52) sodium >3000 mg/day 1.19 (0.90-1.57) Risk in women on antihypertensive medication before 24-hurine adjustment Outcome MCI/ProbDem HR (95% CI) sodium ≤1500 mg/day 1.18 (0.81-1.71) sodium 1501-2999 mg/day 1.19 (0.97-1.46) sodium >3000 mg/day 1.24 (0.94-1.64) Adjusted for: Age, race, education, WHIM therapy arm, baseline 3MS, alcohol, smoking, physical activity, diabetes, BMI, depression, energy intake, CVD history | Mid range sodium in HPT women -->CI Null | ||||
| Sodium measured in mg/day, analysis split into in groups of sodium 1. ≤1500 mg/day 2. 1501-2999 mg/day 3. >3000 mg/day | DSM-IV criteria for MCI/Probable Dementia | Binary | Hazards ratio | Risk in hypertensive women only, before 24-h urine adjustment Outcome MCI/ProbDem HR (95% CI) sodium ≤1500 mg/day 1.30 (0.91-1.87) sodium 1501-2999 mg/day 1.29 (1.06-1.57) sodium >3000 mg/day 1.29 (0.98-1.69) Risk in women on antihypertensive medication before 24-h urine adjustment Outcome MCI/ProbDem HR (95% CI) sodium ≤1500 mg/day 1.25 (0.86-1.80) sodium 1501-2999 mg/day 1.25 (1.02-1.52) sodium >3000 mg/day 1.36 (1.03-1.78) Adjusted for: Age, race, education, baseline 3MS and WHI menopausal hormone therapy arm | Mid range sodium in HPT women -->CI Mid and high range sodium in HPT meds women -->CI | ||||||
| Sodium measured in mg/day, analysis split into in groups of sodium after correction: 1. <2300 mg/day 2. 2300-3000 mg/day 3. >3000 | DSM-IV criteria for MCI/Probable Dementia | Binary | Hazards ratio | Risk of MCI/Prob Dem in hypertensive women only, stratified by sodium levels (after 24-h urine adjustment) Outcome MCI/ProbDem HR (95% CI) sodium <2300mg/day 1.56 (0.97-2.52) sodium 2300-3000mg/day 1.28 (1.08-1.51) sodium >3000 mg/day 1.32 (0.86-2.05) Risk in women on antihypertensive medication, after 24-h urine adjustment Outcome MCI/ProbDem HR (95% CI) sodium <2300mg/day 1.53 (0.93-2.50) sodium 2300-3000mg/day 1.25 (1.06-1.48) sodium >3000 mg/day 1.43 (0.93-2.21) Adjusted for: Age, race, education, baseline 3MS and WHI menopausal hormone therapy arm | Mid range sodium in HPT women -->CI Mid range sodium in HPT meds women -->CI | ||||||
3MS, The Modified Mini-Mental State Test; CI, cognitive impairment; CVD, cardiovascular; DSM-IV, Diagnostic and Statistical Manual of Mental Disorders (fourth edition); HPT, hypertension; HR, hazards ratio; OR, odds ratio; MCI, mild cognitive impairment; Prob Dem, probable dementia; WHI, Women’s Health Initiative (study).
Other cognitive domains
Additional cognitive domains were tested in three cross-sectional studies included “general” [38], “neurocognition index” [35],“attention” [35], “cognitive flexibility” [35], “psychomotor speed” [35], “reaction time” [35], and “language” [36] (Table 7). Overall, studies had a small sample size (ranging from 47 [36] to 189 [38] participants) and were of low quality. None reported significant associations between sodium intake and performance on these cognitive domains (see Table 7).
Table 7
Association between sodium intake and other cognitive domains
| Author | Quality Assessment | Salt categorization | Cognitive Domain Assessed | Type of Cognitive assessment | Categorization of cognitive scores/function | Type of analysis | Results | Direction of association | ||
| Bojar et al. [35] | Poor | Sodium measured in mg/day, in continuous measures | Attention | Performance Test, Shifting Attention Test, Stroop Test | Continuous | Pearson’s correlation | Cognition measure r p composite tests 0.078 0.119 | No association | ||
| Cognitive flexibility | Shifting Attention tests | Cognition measure r p Shifting Attention tests 0.095 0.058 | No association | |||||||
| Psychomotor speed | Finger Tapping test and Symbol digits | Cognition measure r p composite tests -0.013 0.797 | No association | |||||||
| Reaction time | Stroop test | Cognition measure r p Stroop tests 0.052 0.300 | No association | |||||||
| Koh et al. [36] | Poor | Sodium measured in mg/day, in continuous measures | Language | Boston Naming Test | Continuous | Spearman’s correlation | Cognition measure r p Boston Naming test -0.153 >0.05 | No association | ||
r, correlation coefficient.
DISCUSSION
This is the first review, to our knowledge, to synthesize the current evidence on the association between sodium intake and cognitive outcomes. In total, fifteen studies were identified of which over 60% (n = 10 studies [27–31, 33, 34, 37, 40, 41]) reported significant associations. However, mixed results were found regarding whether dietary sodium intake is associated with cognitive function. Of the eight studies with significant results, five [27, 29, 30, 34, 40, 41] reported a positive association, one reported a negative association [31], one reported a mixed association [33], one reported a j-shaped association [37], and the remaining study reported that moderate sodium intake is associated with cognitive impairment [28]. Even though the overall evidence was mixed, higher quality studies generally reported that lower sodium intake was associated with better cognitive function [27, 29, 30]. A positive association between high sodium intake and cognitive decline points to the possible role of low sodium diets to prevent cognitive decline. However, a lower sodium intake might also be associated with poor cognitive performance which adds to the complexity of this topic.
With regard to specific cognitive domains, there appeared to be some evidence that high salt intake is associated with poor global cognitive function assessed using the MMSE/3MS. Indeed, four studies [29, 30, 34, 40] reported a significant positive association, one study [31] reported a significant negative association, and two studies [37, 39] reported no association. In contrast, the results for memory, executive function and processing speed, while mixed, generally reported no significant association. The three studies with significant associations that assessed global cognition were longitudinal in nature [29, 30] and/or had large sample sizes (n = 1194 [29], n = 1262 [30], n = 925 [31]). The remaining two studies with significant associations that assessed global cognition were cross-sectional with small sample sizes (n = 119 [34], n = 44 [40]), but had significant risk-of-bias issues. Of the six studies that examined memory [35–38], executive functioning [27, 31, 35–37], and processing speed [35, 38], only three studies reported significant associations; one study for memory [37] and two studies for executive functioning [27, 31].
Generally, the studies with significant associations were of low to intermediate risk-of-bias. These studies also ranged from health community living adults to more specific populations of higher risk groups. For instance, Hwang et al.’s [37] study population comprised of heart failure patients which can be considered a higher risk group due to the cardio-metabolic risk being associated with dementia [18–20]. This increases the chances of detecting a link between sodium intake and cognitive function. Even though the sample size in Hwang et al.’s study was small (n = 91), statistically significant results were still found in sodium intake’s relationship with memory. On the other hand, even if the study population was of higher-risk, the limited spectrum of cognitive function observed in a cross-sectional setting would limit the chances of observing any significant association. For example, in Bojar et al. [35], even though participants were higher-risk (e.g., post-menopausal women; defined as high risk given that a decline in estrogen has been previously linked to increased risk of cardiovascular diseases and dementia [42, 43]), the results were null. This is likely because the study only included participants on the higher spectrum of cognitive performance (i.e., MoCA≥26) and was cross-sectional. More high-quality longitudinal studies in both healthy adults and high-risk groups across wider cognitive spectrums are needed to illuminate and test the mechanism of the sodium-cognition continuum.
With regard to incident MCI and dementia, the results were mixed. In one study [28], moderate sodium intake in hypertensive post-menopausal women was found to be associated with an increased risk of dementia (either alone or combined with MCI). In another study, that focused on incident dementia in healthy older adults, no association was found [32]. The differing results may be due to study population characteristics. For Haring et al. [28], the study population comprised of only post-menopausal women, and focused on hypertension as the main exposure of interest. Li et al. [32] on the other hand, focused on healthy men and women with sodium intake as the exposure of interest.
The methods used for the analysis of the studies may also have contributed to the differing results. Haring et al. [28] performed separate analysis for each strata of sodium levels, instead of conducting analyses in the whole sample, reducing the statistical power. In fact, to assess the association of sodium and cognitive decline, it would have been more appropriate to use the sodium intake levels as a predictor variable. In Li et al. [32], the follow up time was for a sufficiently long period of time (36 years). However, the imprecise measurement of sodium intake with just a single question (yes/no to whether the participant was on a low-salt diet) at a single point in time, may have affected the results. Analyses of data from prospective studies with accurate assessments of dietary sodium intake over time cognitive status and dementia incidence are needed to confirm whether excessive sodium consumption is associated with impaired cognition and dementia risk.
To a certain extent, the findings from this review support that higher sodium intake have bearings on the cognitive health of middle and older aged individuals. The missing link in all the studies included in this review would be the inclusion of factors that may allude to the different mechanisms of how sodium intake affects cognition. So far, most studies that adjusted for confounders typically targeted factors associated with cardiometabolic health and inflammation such as stroke, diabetes, hypertension or blood pressure readings, and BMI. Given the potential mechanism via a gut mediated pathway [17], it would be interesting to observe the effects of sodium intake and its interaction with cardiometabolic health and inflammation (rather than just controlling for confounding) to also tease out the effects (if any) of the gut mediated pathway hypothesis.
As the range of cognitive assessments is wide and largely context dependent, more objective indications of cognitive function or decline should be considered. Future studies can include cerebrospinal fluid, neuroimaging, or blood biomarkers of dementia and cognitive decline. There are robust biomarkers of dementia which are known to correlate with pathological progression (especially in the case of Alzheimer’s dementia) [44]. For example amyloid-β levels and hippocampal volumes using magnetic resonance imaging have been shown to have different trajectories across cognitive stages [45]. In the case of vascular related dementia and cognitive decline, neuroimaging and blood-based biomarkers (inflammatory markers) may also have the potential to further increase the accuracy of determining cognitive status [46] and contributing to mechanism related information.
This study has a number of strengths. To provide a comprehensive and unbiased review of the existing literature, a wider search strategy was used by including studies with different designs (i.e., observational and randomized clinical trials) and outcome measures (i.e., cognitive function, cognitive decline, and incidence of MCI and dementia). This approach also took into consideration the limited number of studies published in this area of research. Never the less, there are some limitations. The included studies are characterized by large heterogeneity in design, sampling frame, cognitive assessment methods, assessment of sodium intake, and analytical methods. This making it difficult to compare results. Further, sodium intake was mainly assessed using self-report tools including FFQs [27–31, 38, 40], food diaries [27, 35–37, 39], or a single question with binary responses probing the individual level of sodium intake [32, 33, 41]. Therefore, there is risk of under-reporting or over-reporting and this could explain the lack of significant results and the mixed unexplainable results. Only two studies collected urine samples for objective measurement of sodium excretion; one on a sub-set of participants [28] and the other on total study population [34]. However, there are numerous difficulties with 24 h urine collection including feasibility in population-based setting, cost, and the need for logistical support (i.e., storage and analysis). One option to increase the validity and accuracy of FFQ would be to adjust sodium levels derived from FFQs with sodium values from 24 h urine samples collection from a subset of the study population. This is similar to the methods used by Haring et al. [28]. In that way, less resources would be used, yet the study would have a more accurate estimation of sodium intake from the adjustment. Last, only studies in English were included. Only seven studies [47–53] were excluded based on this criterion. Moreover, one of the results of the excluded study (from the abstract which was in English) alluded to the association of dementia with high-salt diet [47]. The other six non-English articles (abstracts were in English) also fit other exclusion criteria (five studies did not measure cognition and/or sodium intake levels [48, 49, 51–53], one study was a review [50]) that were set for this study. Therefore, the exclusion of the non-English articles was unlikely to influence the overall interpretation and validity of the results.
Conclusions
The studies in this review reported heterogeneous findings on the association between sodium consumption and cognitive function in humans. Overall, the strength of the evidence is modest, which could be largely attributed to between-study differences in design, dietary, analytical, and cognitive assessment methods. Robust longitudinal analyses are needed to evaluate the association of different levels of sodium intake with cognitive decline to minimize the potential influence of residual confounding and reverse causality on the associations. Different target populations are needed including people with and without chronic vascular related conditions such as hypertension, heart disease, or kidney disease, to the add to the evidence base on the possible mechanisms on how the sodium-cognition pathway works, e.g., the gut mediated or vascular inflammatory pathway. The results from these further studies can then inform the design of targeted sodium-reducing nutritional and lifestyle interventions.
ACKNOWLEDGMENTS
This research was funded by the National Institute for Health Research (NIHR) (16/137/62) using UK aid from the UK Government to support global health research. The views expressed in this publication are those of the author(s) and not necessarily those of the NIHR or the UK Department of Health and Social Care. The authors acknowledge the support of NIHR DePEC (Dementia Prevention and Enhanced Care) team members in this study.
Authors’ disclosures available online (https://www.j-alz.com/manuscript-disclosures/19-1339r2).
SUPPLEMENTARY MATERIAL
[1] The supplementary material is available in the electronic version of this article: https://dx.doi.org/10.3233/JAD-191339.
REFERENCES
[1] | Dewey ME , Saz P ((2001) ) Dementia, cognitive impairment and mortality in persons aged 65 and over living in the community: a systematic review of the literature. Int J Geriatr Psychiatry 16: , 751–761. |
[2] | Ravi S ((2011) ) Dementia Mortality: Estimates of survival after the onset of dementia range from 4 to 12 years. Indian J Psychiatry 53: , 178–179. |
[3] | Agüero-Torres H , Fratiglioni L , Guo Z , Viitanen M , Winblad B ((1999) ) Mortality from dementia in advanced age: a 5-year follow-up study of incident dementia cases. J Clin Epidemiol 52: , 737–743. |
[4] | Bae JB , Han JW , Kwak KP , Kim BJ , Kim SG , Kim JL , Kim TH , Ryu S-H , Moon SW , Park JH , Youn JC , Lee DY , Lee DW , Lee SB , Lee JJ , Jhoo JH , Kim KW ((2019) ) Is dementia more fatal than previously estimated? A population-based prospective cohort study. Aging Dis 10: , 1–11. |
[5] | Prince M , Ali G-C , Guerchet M , Prina AM , Albanese E , Wu Y-T ((2016) ) Recent global trends in the prevalence and incidence of dementia, and survival with dementia. Alzheimers Res Ther 8: , 23. |
[6] | Szeto JYY , Lewis SJG ((2016) ) Current treatment options for Alzheimer’s disease and Parkinson’s disease dementia. Curr Neuropharmacol 14: , 326–338. |
[7] | Livingston G , Sommerlad A , Orgeta V , Costafreda SG , Huntley J , Ames D , Ballard C , Banerjee S , Burns A , Cohen-Mansfield J , Cooper C , Fox N , Gitlin LN , Howard R , Kales HC , Larson EB , Ritchie K , Rockwood K , Sampson EL , Samus Q , Schneider LS , Selbæk G , Teri L , Mukadam N ((2017) ) Dementia prevention, intervention, and care. Lancet 390: , 2673–2734. |
[8] | Vauzour D , Camprubi-Robles M , Miquel-Kergoat S , Andres-Lacueva C , Bánáti D , Barberger-Gateau P , Bowman GL , Caberlotto L , Clarke R , Hogervorst E , Kiliaan AJ , Lucca U , Manach C , Minihane A-M , Mitchell ES , Perneczky R , Perry H , Roussel A-M , Schuermans J , Sijben J , Spencer JPE , Thuret S , van de Rest O , Vandewoude M , Wesnes K , Williams RJ , Williams RSB , Ramirez M ((2017) ) Nutrition for the ageing brain: Towards evidence for an otimal diet. Ageing Res Rev 35: , 222–240. |
[9] | Wong MMY , Arcand J , Leung AA , Thout SR , Campbell NRC , Webster J ((2017) ) The science of salt: A regularly updated systematic review of salt and health outcomes (December 2015-March 2016). J Clin Hypertens 19: , 322–332. |
[10] | Afshin A , Sur PJ , Fay KA , Cornaby L , Ferrara G , Salama JS , Mullany EC , Abate KH , Abbafati C , Abebe Z , Afarideh M , Aggarwal A , Agrawal S , Akinyemiju T , Alahdab F , Bacha U , Bachman VF , Badali H , Badawi A , Bensenor IM , Bernabe E , Biadgilign SKK , Biryukov SH , Cahill LE , Carrero JJ , Cercy KM , Dandona L , Dandona R , Dang AK , Degefa MG , Zaki MES , Esteghamati A , Esteghamati S , Fanzo J , Farinha CS e S , Farvid MS , Farzadfar F , Feigin VL , Fernandes JC , Flor LS , Foigt NA , Forouzanfar MH , Ganji M , Geleijnse JM , Gillum RF , Goulart AC , Grosso G , Guessous I , Hamidi S , Hankey GJ , Harikrishnan S , Hassen HY , Hay SI , Hoang CL , Horino M , Islami F , Jackson MD , James SL , Johansson L , Jonas JB , Kasaeian A , Khader YS , Khalil IA , Khang Y-H , Kimokoti RW , Kokubo Y , Kumar GA , Lallukka T , Lopez AD , Lorkowski S , Lotufo PA , Lozano R , Malekzadeh R , März W , Meier T , Melaku YA , Mendoza W , Mensink GBM , Micha R , Miller TR , Mirarefin M , Mohan V , Mokdad AH , Mozaffarian D , Nagel G , Naghavi M , Nguyen CT , Nixon MR , Ong KL , Pereira DM , Poustchi H , Qorbani M , Rai RK , Razo-García C , Rehm CD , Rivera JA , Rodríguez-Ramírez S , Roshandel G , Roth GA , Sanabria J , Sánchez-Pimienta TG , Sartorius B , Schmidhuber J , Schutte AE , Sepanlou SG , Shin M-J , Sorensen RJD , Springmann M , Szponar L , Thorne-Lyman AL , Thrift AG , Touvier M , Tran BX , Tyrovolas S , Ukwaja KN , Ullah I , Uthman OA , Vaezghasemi M , Vasankari TJ , Vollset SE , Vos T , Vu GT , Vu LG , Weiderpass E , Werdecker A , Wijeratne T , Willett WC , Wu JH , Xu G , Yonemoto N , Yu C , Murray CJL ((2019) ) Health effects of dietary risks in 195 countries, 1990–2017: a systematic analysis for the Global Burden of Disease Study 2017. Lancet 393: , 1958–1972. |
[11] | McGrath ER , Beiser AS , DeCarli C , Plourde KL , Vasan RS , Greenberg SM , Seshadri S ((2017) ) Blood pressure from mid- to late life and risk of incident dementia. Neurology 89: , 2447–2454. |
[12] | Frisoli TM , Schmieder RE , Grodzicki T , Messerli FH ((2012) ) Salt and hypertension: is salt dietary reduction worth the effort? Am J Med 125: , 433–439. |
[13] | Appel LJ , Brands MW , Daniels SR , Karanja N , Elmer PJ , Sacks FM ((2006) ) Dietary approaches to prevent and treat hypertension. Hypertension 47: , 296–308. |
[14] | Cheng X-J , Gao Y , Zhao Y-W , Cheng X-D ((2015) ) Sodium chloride increases Aβ levels by suppressing Aβ clearance in cultured cells. PloS One 10: , e0130432. |
[15] | Bailey EL , McBride MW , McClure JD , Beattie W , Graham D , Dominiczak AF , Smith C , Wardlaw JM ((2018) ) Effects of dietary salt on gene and protein expression in brain tissue of a model of sporadic small vessel disease. Clin Sci 132: , 1315–1328. |
[16] | Taheri S , Yu J , Zhu H , Kindy MS ((2016) ) High-sodium diet has opposing effects on mean arterial blood pressure and cerebral perfusion in a transgenic mouse model of Alzheimer’s disease. J Alzheimers Dis 54: , 1061–1072. |
[17] | Faraco G , Brea D , Garcia-Bonilla L , Wang G , Racchumi G , Chang H , Buendia I , Santisteban MM , Segarra SG , Koizumi K , Sugiyama Y , Murphy M , Voss H , Anrather J , Iadecola C ((2018) ) Dietary salt promotes neurovascular and cognitive dysfunction through a gut-initiated TH17 response. Nat Neurosci 21: , 240–249. |
[18] | Gorelick PB , Scuteri A , Black SE , Decarli C , Greenberg SM , Iadecola C , Launer LJ , Laurent S , Lopez OL , Nyenhuis D , Petersen RC , Schneider JA , Tzourio C , Arnett DK , Bennett DA , Chui HC , Higashida RT , Lindquist R , Nilsson PM , Roman GC , Sellke FW , Seshadri S , American Heart Association Stroke Council, Council on Epidemiology and Prevention, Council on Cardiovascular Nursing, Council on Cardiovascular Radiology and Intervention, and Council on Cardiovascular Surgery and Anesthesia ((2011) ) Vascular contributions to cognitive impairment and dementia: a statement for healthcare professionals from the American Heart Association/American Stroke Association. Stroke 42: , 2672–2713. |
[19] | Abete P , Della-Morte D , Gargiulo G , Basile C , Langellotto A , Galizia G , Testa G , Canonico V , Bonaduce D , Cacciatore F ((2014) ) Cognitive impairment and cardiovascular diseases in the elderly. A heart-brain continuum hypothesis. Ageing Res Rev 18: , 41–52. |
[20] | Cunningham C , Hennessy E ((2015) ) Co-morbidity and systemic inflammation as drivers of cognitive decline: new experimental models adopting a broader paradigm in dementia research. Alzheimers Res Ther 7: , 33. |
[21] | Aridi YS , Walker JL , Wright ORL ((2017) ) The association between the Mediterranean dietary pattern and cognitive health: a systematic review. Nutrients 9: , 674. |
[22] | Shannon OM , Stephan BCM , Granic A , Lentjes M , Hayat S , Mulligan A , Brayne C , Khaw K-T , Bundy R , Aldred S , Hornberger M , Paddick S-M , Muniz-Tererra G , Minihane A-M , Mathers JC , Siervo M ((2019) ) Mediterranean diet adherence and cognitive function in older UK adults: the European Prospective Investigation into Cancer and Nutrition-Norfolk (EPIC-Norfolk) Study. Am J Clin Nutr 110: , 938–948. |
[23] | Berendsen AAM , Kang JH , van de Rest O , Feskens EJM , de Groot LCPGM , Grodstein F ((2017) ) The Dietary Approaches to Stop Hypertension Diet, cognitive function, and cognitive decline in American older women. J Am Med Dir Assoc 18: , 427–432. |
[24] | Tangney CC , Li H , Wang Y , Barnes L , Schneider JA , Bennett DA , Morris MC ((2014) ) Relation of DASH- and Mediterranean-like dietary patterns to cognitive decline in older persons. Neurology 83: , 1410–1416. |
[25] | Moher D , Liberati A , Tetzlaff J , Altman DG , PRISMA Group ((2009) ) Preferred reporting items for systematic reviews and meta-analyses: the PRISMA statement. PLoS Med 6: , e1000097. |
[26] | Assessing Cardiovascular Risk: Systematic Evidence Review from the Risk Assessment Work Group | National Heart, Lung, and Blood Institute (NHLBI). |
[27] | Blumenthal JA , Smith PJ , Mabe S , Hinderliter A , Lin P-H , Liao L , Welsh-Bohmer KA , Browndyke JN , Kraus WE , Doraiswamy PM , Burke JR , Sherwood A ((2019) ) Lifestyle and neurocognition in older adults with cognitive impairments: A randomized trial. Neurology 92: , e212–e223. |
[28] | Haring B , Wu C , Coker LH , Seth A , Snetselaar L , Manson JE , Rossouw JE , Wassertheil-Smoller S ((2016) ) Hypertension, dietary sodium, and cognitive decline: results from the Women’s Health Initiative Memory Study. Am J Hypertens 29: , 202–216. |
[29] | Nowak KL , Fried L , Jovanovich A , Ix J , Yaffe K , You Z , Chonchol M ((2018) ) Dietary sodium/potassium intake does not affect cognitive function or brain imaging indices. Am J Nephrol 47: , 57–65. |
[30] | Fiocco AJ , Shatenstein B , Ferland G , Payette H , Belleville S , Kergoat M-J , Morais JA , Greenwood CE ((2012) ) Sodium intake and physical activity impact cognitive maintenance in older adults: The NuAge Study. Neurobiol Aging 33: , 829.e21–829.e28. |
[31] | Rush TM , Kritz-Silverstein D , Laughlin GA , Fung TT , Barrett-Connor E , McEvoy LK ((2017) ) Association between dietary sodium intake and cognitive function in older adults. J Nutr Health Aging 21: , 276–283. |
[32] | Li J , Ogrodnik M , Kolachalama VB , Lin H , Au R ((2018) ) Assessment of the mid-life demographic and lifestyle risk factors of dementia using data from the Framingham Heart Study Offspring Cohort. J Alzheimers Dis 63: , 1119–1127. |
[33] | Milte CM , Ball K , Crawford D , McNaughton SA ((2019) ) Diet quality and cognitive function in mid-aged and older men and women. BMC Geriatr 19: , 1–14. |
[34] | Afsar B ((2013) ) The relationship between cognitive function, depressive behaviour and sleep quality with 24-h urinary sodium excretion in patients with essential hypertension. High Blood Press Cardiovasc Prev 20: , 19–24. |
[35] | Bojar I , Wierzbińska-Stępniak A , Witczak M , Raczkiewicz D , Owoc A ((2015) ) Are cognitive functions in post-menopausal women related with the contents of macro- and micro-components in the diet? Ann Agric Environ Med 22: , 178–184. |
[36] | Koh F , Charlton KE , Walton K , Brock E , McMahon AT , Langford K , Host A , Crowe R , Thornhill K ((2015) ) Protein and thiamin intakes are not related to cognitive function in well-nourished community-living older adults. Nutr Diet 72: , 47–53. |
[37] | Hwang SY , Kim J ((2016) ) An examination of the association of cognitive functioning, adherence to sodium restriction and Na/K ratios in Korean heart failure patients. J Clin Nurs 25: , 1766–1776. |
[38] | Del C Valdés Hernández M , Kyle J , Allan J , Allerhand M , Clark H , Muñoz Manieg S , Royle NA , Gow AJ , Pattie A , Corley J , Bastin ME , Starr JM , Wardlaw JM , Deary IJ , Combet E ((2017) ) Dietary iodine exposure and brain structures and cognition in older people. Exploratory analysis in the Lothian Birth Cohort 1936. J Nutr Health Aging 21: , 971–979. |
[39] | Brownbill RA , Ilich JZ ((2004) ) Cognitive function in relation with bone mass and nutrition: cross-sectional association in postmenopausal women. BMC Womens Health 4: , 2. |
[40] | Salerno-Kennedy R , Cashman KD ((2007) ) The relationship between nutrient intake and cognitive performance in people at risk of dementia. Ir J Med Sci 176: , 193–198. |
[41] | Yao Y-H , Xu R-F , Tang H-D , Jiang G-X , Wang Y , Wang G , Chen S-D , Cheng Q ((2010) ) Cognitive impairment and associated factors among the elderly in the Shanghai suburb: findings from a low-education population. Neuroepidemiology 34: , 245–252. |
[42] | Monk D , Brodaty H ((2000) ) Use of estrogens for the prevention and treatment of Alzheimer’s disease. Dement Geriatr Cogn Disord 11: , 1–10. |
[43] | Solerte SB , Fioravanti M , Racchi M , Trabucchi M , Zanetti O , Govoni S ((1999) ) Menopause and estrogen deficiency as a risk factor in dementing illness: hypothesis on the biological basis. Maturitas 31: , 95–101. |
[44] | Zetterberg H , Schott JM ((2019) ) Biomarkers for Alzheimer’s disease beyond amyloid and tau. Nat Med 25: , 201–203. |
[45] | Lo RY , Hubbard AE , Shaw LM , Trojanowski JQ , Petersen RC , Aisen PS , Weiner MW , Jagust WJ , Alzheimer’s Disease Neuroimaging Initiative ((2011) ) Longitudinal change of biomarkers in cognitive decline. Arch Neurol 68: , 1257–1266. |
[46] | Lang B , Kindy MS , Kozel FA , Schultz SK , Taheri S ((2018) ) Multi-parametric classification of vascular cognitive impairment and dementia: the impact of diverse cerebrovascular injury biomarkers. J Alzheimers Dis 62: , 39–60. |
[47] | Ohkuni M ((1993) ) A study of the factors involved in the onset of senile dementia. Nihon Ronen Igakkai Zasshi Jpn J Geriatr 30: , 1039–1045. |
[48] | Turró Garriga O , Farrés Costa S , Pérez Terré A , Batlle Amat P ((2018) ) Assessment of the sense of coherence in the perceived burden and in the adherence to a psycho-educational program for informal caregivers of dependent persons. Rev Espanola Geriatr Gerontol 53: , 196–201. |
[49] | Itoi K , Yamada K , Morioka I ((2019) ) Factors related to salt-reduction cognizance and salt intake in women aged 40-59 years: characteristics of guardians of medical university students. Nihon Eiseigaku Zasshi Jpn J Hyg 74: . |
[50] | Berrino F ((2002) ) Western diet and Alzheimer’s disease. Epidemiol Prev 26: , 107–115. |
[51] | Ortega RM , Jiménez Ortega AI , Perea Sánchez JM , Cuadrado Soto E , Martínez García RM , López Sobaler AM ((2017) ) Alimentación oral en la mejora nutricional en hospitales y residencias. Innovaciones de la industria. Nutr Hosp 34: , 13–18. |
[52] | Muñecas P , Malaret ML , Galdi M ((2017) ) Excreción urinaria de iodo y sal en población de Buenos Aires, Argentina. Acta Bioquím Clín Latinoam 609–613. |
[53] | Lee MS ((2014) ) The relationship between dietary behaviors/health risk factors and preference for salty taste among Korean elderly people living in rural areas. Korean J Community Nutr 19: , 448–458. |


