
Costs of Early Stage Alzheimer’s Disease in the United States: Cross-Sectional Analysis of a Prospective Cohort Study (GERAS-US)1
Abstract
Background:
Costs associated with early stages of Alzheimer’s disease (AD; mild cognitive impairment [MCI] and mild dementia [MILD]) are understudied.
Objective:
To compare costs associated with MCI and MILD due to AD in the United States.
Methods:
Data included baseline patient/study partner medical history, healthcare resource utilization, and outcome assessments as part of a prospective cohort study. Direct, indirect, and total societal costs were derived by applying standardized unit costs to resources for the 1-month pre-baseline period (USD2017). Costs/month for MCI and MILD cohorts were compared using analysis of variance models. To strengthen the confidence of diagnosis, amyloid-β (Aβ) tests were included and analyses were replicated stratifying within each cohort by amyloid status [+ /−].
Results:
Patients (N = 1327) with MILD versus MCI had higher total societal costs/month ($4243 versus $2816; p < 0.001). These costs were not significantly different within each severity cohort by amyloid status. The largest fraction of overall costs were informal caregiver costs (45.1%) for the MILD cohort, whereas direct medical patient costs were the largest for the MCI cohort (39.0%). Correspondingly, caregiver time spent on basic activities of daily living (ADLs), instrumental ADLs, and supervision time was twice as high for MILD versus MCI (all p < 0.001).
Conclusion:
Early AD poses a financial burden, and despite higher functioning among those with MCI, caregivers were significantly impacted. The major cost driver was the patient’s clinical cognitive-functional status and not amyloid status. Differences were primarily due to rising need for caregiver support.
INTRODUCTION
Alzheimer’s disease (AD), a chronic, degenerative brain disorder, is ranked as one of the costliest conditions in the United States (US) [1, 2]. The disease burden, which affects an estimated 5.4 million Americans, impacts both patients and caregivers in terms of increased risk of morbidity and mortality and substantial costs from direct healthcare use and indirect costs such as loss of potential earnings and caregiving stress [1, 3–7].
Several studies have examined cost in patients with early signs of dementia, yet many of these studies did not confirm a diagnosis of AD [8–17]. Increasing severity of AD dementia has been found to be associated with increased costs [3, 18], yet the literature lacks estimates for the cost of illness across the full disease continuum. GERAS I, an observational study conducted in multiple European countries, found that at baseline, estimated mean monthly total societal costs were higher with greater severity when comparing patients with mild, moderate, and moderately severe or severe AD dementia [3]. At the follow-up 6-, 12-, and 18-month visits, estimated mean total societal costs generally increased from baseline [19]. For the overall 18-month period, caregiver time represented the largest resource use component, accounting for 54% to 65% of total resources depending on country [19]. Economic and treatment pattern findings from GERAS I may not reflect US healthcare patterns. Additionally, the GERAS I study did not include amyloid testing, which detects abnormal levels of amyloid-β (Aβ) neuritic plaques in the brain and is more consistent with AD diagnosis [20–22].
The current study, GERAS-US (H8A-US-B004; ClinicalTrials.gov NCT02951598), was adapted from the earlier GERAS I study [3] to investigate the costs and care-related burden associated with increasing disease severity over time for early AD, defined here as physician-diagnosed mild cognitive impairment (MCI) due to AD and mild dementia (MILD), which is understudied in US clinical practice settings. That is, MCI presents earlier than MILD in the continuum of AD. Attributing MCI to AD is often a diagnostic challenge. Pre-mortem identification of the presence of Aβ plaques and neurofibrillary tangles [23, 24] is possible via cerebrospinal fluid (CSF) and positron emission tomography (PET) amyloid imaging [20, 21]. A positive Aβ test result [+] indicates a rising positive predictive value of an AD diagnosis within the context of a comprehensive clinical evaluation. Conversely, it is postulated that a negative Aβ test result [−] indicates no or sparse amyloid neuritic plaques on pathology (inconsistent with a biomarker defined diagnosis of AD) and is, therefore, cognitive-functional impairment predominantly due to other disease states and comorbidities. Due to the dichotomous reading of the amyloid scan results, it is likely that some individuals with subthreshold results for Aβ may in fact be in the AD pathway. In a prior publication assessing the clinical characteristics of patients from the 36-month GERAS-US cohort study, patients in clinical practice settings with negative Aβ test [−] results were likely to have greater health burden, were more medically complex in terms of increased number of comorbid conditions, and had poorer self-reported quality of life, indicating that cognitive impairment was likely influenced by disease processes outside of the AD pathway [25].
The primary aim of this manuscript is to describe the cross-sectional total societal costs for patients and study partners, including direct medical and nonmedical costs for healthcare resource use and indirect costs for caregiving by severity (MCI versus MILD) and by amyloid status within each severity cohort (MCI: [+] versus [−]; MILD: [+] versus [−]). This analysis uses the baseline economic data from the GERAS-US cohort study mentioned above [25].
MATERIALS AND METHODS
Study design
This cross-sectional assessment uses baseline data from GERAS-US, a 36-month, US-based, prospective, longitudinal cohort study of patients with clinician-diagnosed early AD seeking routine care for memory concerns. Patients were invited to participate in the study during routine visits with their healthcare provider. Patients and their study partners were enrolled from October 30, 2016, through October 9, 2017. Sites included 76 primary care and specialty care settings within the US, all of which completed Good Clinical Practice training prior to participant enrollment. Electronic tablets were used to collect baseline evaluations that included clinician interviews and study partner surveys. To increase the diagnostic certainty of studying individuals with early AD longitudinally, amyloid status was required. Those patients with evidence of amyloid were scheduled to continue assessments with their study partner every 6 months (±6 weeks) for up to 36 months. Patients and their study partners were remunerated for their time and travel, and sites were compensated based on market value. A central or site-specific institutional review board granted study approval.
Participant selection and cohort designation
Eligible patients were 55 to 85 years old and met criteria for early AD in the opinion of the enrolling physician from whom they were receiving care for cognitive issues. Patients were required to have study partners that were willing to participate throughout the study. Patients were excluded from longitudinal evaluation if they had a negative Aβ PET scan or CSF results within the last 2 years, were participating or considering participation in an investigational drug clinical trial, or were employees or family members of personnel from the sites, sponsor, or third-party organizations affiliated with the study. All participants or their legal designees provided written informed consent before assessments and had to be able to communicate in English or Spanish.
Two outcome assessments were included in the screening process and cohort classification process. Patients with Mini-Mental State Examination (MMSE) [26] scores lower than 20 (out of 30) indicating lower cognitive status were excluded from the study. The literature varies as to how early stages of AD may be defined using the MMSE. Therefore, the Functional Activities Questionnaire (FAQ) was also administered to classify patients by severity. The FAQ is a study partner rating of the performance changes in complex activities of daily living (ADLs) [27]. It has been psychometrically tested to distinguish cut-points consistent with clinical diagnoses of MCI (MMSE≥24 and FAQ < 6) and MILD AD dementia (MMSE≥20 and FAQ≥6) [28]. For 26 of the 28 patients who fell outside of this range (i.e., MMSE≥24 and FAQ≥6), the enrolling physician’s current diagnosis was used to classify patients, and 2 patients were excluded from the analyses because they had diagnoses of “memory loss Not Elsewhere Classified.”
Determination of amyloid status was also required. Patients with prior evidence of amyloid via a Food and Drug Administration (FDA)-approved amyloid PET scan (florbetapir, flutemetamol, or florbetaben) or a CSF test were included in the study. Patients who did not undergo prior testing had to be willing and eligible to complete a florbetapir F18 PET scan in accordance with the FDA package insert. Scan results were to be shared with the patients and their study partners.
Participants were classified based on severity (MCI or MILD) and within each severity cohort by amyloid status ([+] or [−]), including MCI[+], MCI[−], MILD[+], and MILD[−].
Assessments
Key assessments for this paper included healthcare resource utilization, caregiver burden, and economic burden. The entire listing of GERAS-US baseline and longitudinal measures is described elsewhere [25].
The Resource Utilization in Dementia (RUD version 4.0) [29] is a structured interview with the study partner to obtain healthcare resource utilization, work status, and living accommodations information for both the patient and the caregiver as well as items to determine the level of formal and informal care attributable to AD. Caregiving time included hours (averaged over in the previous month) spent assisting patients’ instrumental ADLs (iADLs) such as shopping, cooking, housekeeping, laundry, transportation, taking medication, and managing finances; basic ADLs (bADLs) such as using the toilet, eating, dressing, grooming, walking, and bathing; and providing supervision (i.e., preventing dangerous events) for the patient.
Cost estimation
Total societal costs at baseline (direct and indirect costs in the 1-month pre-baseline period) were estimated by applying unit costs (USD2017) of services and products to the recorded responses in the RUD version 4.0 and other monetary items asked at baseline including medications for comorbidities, nonmedical costs for consumables, and structural changes to accommodate health issues. Missing resources remained missing with no imputation and were considered as $0 in cost calculations. Further details on unit costs may be found in Supplementary Table 1 [30–40].
The cost components included in the total societal costs are illustrated in Fig. 1, including direct medical and nonmedical resources for the patients, direct medical resources for the study partners, and indirect nonmedical resources for study partners. For the indirect nonmedical resources for study partners, hours spent was calculated 2 ways (hours spent caring for the patient OR hours of work loss due to caring for the patient), with the higher number applied to the cost calculation. To avoid overestimations of caregiver time, the electronic data capture was set to only allow response of caregiver time to truncate hours per day to be 24 hours/day minus reported hours slept.
Fig. 1
Cost components summed to calculate total societal costs. Total societal costs (1-month pre-baseline) were calculated (USD2017) by summing the following cost components.
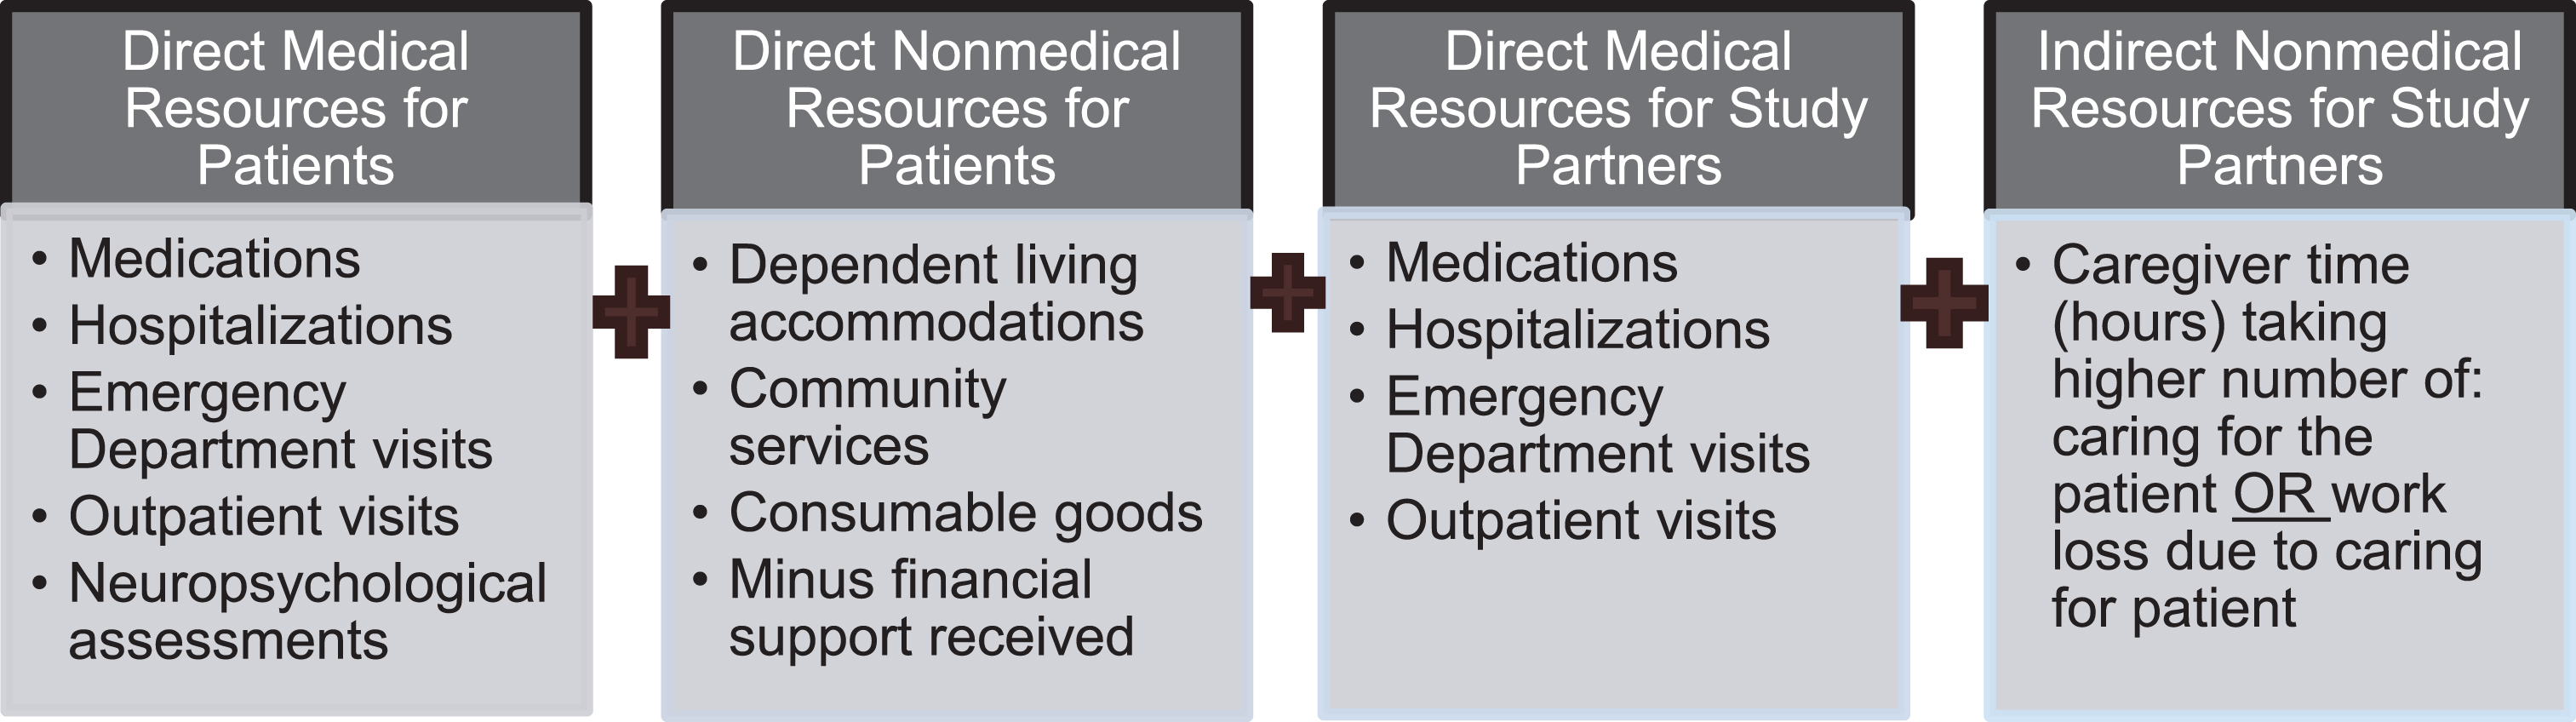
Cost unit for caregiver time was also calculated using two methods. First, the opportunity costs approach sums lost productive hours and multiplies them by national average annual gross hourly wage for workers [30] and by lost leisure time for nonworkers (35% of hourly wage for workers). The second method uses replacement costs approach that sums time associated with lost productivity and multiplies it by the market value of professional caregiver/aide hourly wage [31, 32, 35–38] for all caregivers irrespective of working status of the study partner. In both of these methods, if a caregiver is paid for patient care, those hours will be subtracted from the production loss time.
Statistical analysis
Sample size targets for the study were determined based on the primary objective, which was the 36-month cost assessment from enrollment to the end of the study period. To obtain an approximate 95% confidence interval for ±10% of the mean cost, the aim was to enroll 700 amyloid[+] patients (350 per severity cohort) so that approximately 420 patients would provide data at 36 months. The sample size was calculated assuming that costs would be exponentially distributed, that discontinuation rates would be similar to those of the GERAS I study for the mild AD dementia cohort (40% discontinuation by 36 months [41]), and that severity cohorts and amyloid status would be equally represented. The sample size calculation was based on the asymptotic normality of the maximum likelihood estimate of the mean of the exponential distribution and used the fact that the mean and standard deviation (SD) are equal for an exponential random variable. Cost data frequently have a skewed distribution and exhibit extreme observations. The assumption of the exponential distribution was an attempt to take that into account when planning the study. In conducting the analysis, however, the cost data were not summarized or analyzed using a parametric approach with the exponential distribution. The mean costs were summarized and analyzed with an asymptotic normality approach relying on the central limit theorem [42]. Cost was calculated from real-world data collected by RUD version 4.0. Extreme observations existed in the data and influenced the observed variance.
The baseline analysis was descriptive in nature to understand the cost characteristics of the population at the start of the study. The primary analyses used total societal costs with the opportunity cost approach, and sensitivity analyses were conducted using total societal costs with a replacement cost approach (see definitions above). Data are summarized as the number of patients and percentages for categorical variables and as mean±SD for continuous variables. The primary baseline comparisons were conducted for difference between MCI versus MILD and by amyloid status within severity cohorts. All comparisons evaluated were pre-specified. Continuous characteristics were compared using t-tests for MCI versus MILD and analysis of variance (ANOVA) models for MCI[+] versus MCI[−] and MILD[+] versus MILD[−]; categorical variables were compared using chi-square statistics. For one of the multinomial categorical variables (“reason for reduced work”), one of the responses was of particular interest (“to care for the patient”) and a new binomial variable was created (“to care for the patient” versus all other responses), and a chi-square statistic was used to compare MCI versus MILD, MCI[+] versus MCI[−], and MILD[+] versus MILD[−]. p-values<0.05 are considered statistically significant, and 95% 2-sided confidence intervals for the means are provided. No adjustments were made for multiplicity in cohort comparisons or for the number of variables assessed. All analyses used SAS Enterprise Guide version 7.12 (Cary, NC, USA).
RESULTS
All results below are reported first by severity cohort comparisons and then stratified by amyloid status within each severity cohort. Statistically significant differences were highlighted.
Demographic and socioeconomic characteristics
Patients
The patient population was approximately 70 years old, mostly white (>84%), and with a predominance of females (>56%) (Table 1). The percentage of patients of Hispanic or Latino ethnicity were 2-fold higher for MILD versus MCI patients (50.6% versus 28.7%; p < 0.001). Furthermore, there was a significantly higher percentage of Hispanic or Latino patients within the amyloid[−] status cohorts: 20.7% for MCI[+] versus 33.8% MCI[−] and 43.2% for MILD[+] versus 58.7% for MILD[−] (both p < 0.001).
Table 1
Patient characteristics across cohorts
| Cohort for comparisons | |||||||||
| Severity cohorts | Severity cohorts by amyloid status | ||||||||
| Description | MCI | MILD | pg | MCI[+] | MCI[−] | pg | MILD[+] | MILD[−] | pg |
| N = 679 | N = 650 | N = 300 | N = 281 | N = 317 | N = 300 | ||||
| Age, mean (SD), y | 69.5 (7.8) | 70.9 (7.7) | 0.001 | 70.3 (7.4) | 69.3 (7.7) | 0.092 | 71.7 (8.0) | 69.9 (7.4) | 0.004 |
| Age>65 y, n (%)a | 479 (70.5) | 494 (76.0) | 0.025 | 224 (74.7) | 199 (70.8) | 0.298 | 245 (77.3) | 223 (74.3) | 0.392 |
| Gender, female, n (%) | 386 (56.8) | 366 (56.3) | 0.842 | 158 (52.7) | 160 (56.9) | 0.301 | 167 (52.7) | 178 (59.3) | 0.096 |
| Race, n (%) | 0.025 | 0.019 | 0.447 | ||||||
| White | 570 (83.9) | 564 (86.8) | 259 (86.3) | 249 (88.6) | 279 (88.0) | 255 (85.0) | |||
| Black | 70 (10.3) | 68 (10.5) | 33 (11.0) | 17 (6.0) | 30 (9.5) | 36 (12.0) | |||
| Asian | 26 (3.8) | 8 (1.2) | 5 (1.7) | 14 (5.0) | 5 (1.6) | 3 (1.0) | |||
| Other | 13 (1.9) | 10 (1.5) | 3 (1.0) | 1 (0.4) | 3 (0.9) | 6 (2.0) | |||
| Ethnicity, Hispanic or Latino, n (%) | 195 (28.7) | 329 (50.6) | <0.001 | 62 (20.7) | 95 (33.8) | <0.001 | 137 (43.2) | 176 (58.7) | <0.001 |
| N = 583 | N = 615 | N = 299 | N = 280 | N = 316 | N = 299 | ||||
| Below (≤100%) 2016 federal poverty level,b n (%) | 111 (19.0) | 203 (33.0) | <0.001 | 58 (19.4) | 53 (18.9) | 0.919 | 104 (32.9) | 99 (33.1) | 0.832 |
| Some college or above, n (%) | 372 (63.8) | 242 (39.3) | <0.001 | 198 (66.2) | 124 (39.2) | 0.313 | 170 (60.7) | 118 (39.5) | 0.977 |
| Insurance, n (%)c | <0.001 | 0.682 | 0.003 | ||||||
| Public | 385 (66.0) | 439 (71.4) | 196 (65.6) | 189 (67.5) | 210 (66.5) | 229 (76.6) | |||
| Private | 267 (45.8) | 188 (30.6) | 136 (45.5) | 131 (46.8) | 122 (38.6) | 66 (22.1) | |||
| Self-insured | 5 (0.9) | 0 | 3 (1.0) | 2 (0.7) | 0 | 0 | |||
| Other | 14 (2.4) | 16 (2.6) | 10 (3.3) | 4 (1.4) | 9 (2.8) | 7 (2.3) | |||
| No insurance | 11 (1.9) | 19 (3.1) | 7 (2.3) | 4 (1.4) | 9 (2.8) | 10 (3.3) | |||
| Unknown | 21 (3.6) | 20 (3.3) | 9 (3.0) | 8 (2.9) | 10 (3.2) | 10 (3.3) | |||
| Work for pay, yes, n (%) | 125 (21.4) | 58 (9.4) | <0.001 | 61 (20.4) | 64 (22.9) | 0.684 | 35 (11.1) | 23 (7.7) | 0.049 |
| N = 455 | N = 553 | N = 236 | N = 215 | N = 277 | N = 276 | ||||
| Reason for work reduced, n (%) | 0.002 | 0.904 | 0.121 | ||||||
| Never worked | 12 (2.6) | 41 (7.4) | 7 (3.0) | 5 (2.3) | 20 (7.2) | 21 (7.6) | |||
| Reached retirement age | 275 (60.4) | 303 (54.8) | 147 (62.3) | 124 (57.7) | 161 (58.1) | 142 (51.4) | |||
| Early retirement (not disease related) | 57 (12.5) | 51 (9.2) | 27 (11.4) | 30 (14.0) | 28 (10.1) | 23 (8.3) | |||
| Laid off | 9 (2.0) | 16 (2.9) | 4 (1.7) | 5 (2.3) | 5 (1.8) | 11 (4.0) | |||
| Health problems | 74 (16.3) | 115 (20.8) | 37 (15.7) | 37 (17.2) | 47 (17.0) | 68 (24.6) | |||
| Of those that work | N = 125 | N = 58 | N = 61 | N = 64 | N = 35 | N = 23 | |||
| Cut down work due to AD, n (%) | 4 (3.2) | 8 (13.8) | 0.007 | 3 (4.9) | 1 (1.6) | 0.287 | 3 (8.6) | 5 (21.7) | 0.155 |
| Re-entered work force to supplement income for loss due to declining cognitiond, yes, n (%) | 8 (6.4) | 9 (15.5) | 0.048 | 6 (9.8) | 2 (3.1) | 0.125 | 5 (14.3) | 4 (17.4) | 0.749 |
| Number of comorbiditiese, mean (SD) | 2.2 (1.5)f | 2.5 (1.9) | <0.001 | 2.3 (1.5) | 2.2 (1.6) | 0.538 | 2.3 (1.7) | 2.8 (2.2) | <0.001 |
| N = 583 | N = 615 | N = 299 | N = 280 | N = 316 | N = 299 | ||||
| Interactions with police, fire, or ambulance services due to cognitive symptoms in the past 3 months, n (%) | 4 (0.7) | 14 (2.3) | 0.049 | 3 (1.0) | 1 (0.4) | 0.402 | 7 (2.2) | 7 (2.3) | 0.864 |
| Accidental falls in the past 3 months, n (%) | 42 (7.2) | 78 (12.7) | 0.007 | 24 (8.0) | 18 (6.4) | 0.329 | 46 (14.6) | 32 (10.7) | 0.357 |
| Number of falls, mean (SD) | 1.7 (1.0) | 2.4 (2.0) | 0.017 | 1.8 (1.1) | 1.5 (0.7) | 0.544 | 2.2 (1.9) | 2.6 (2.3) | 0.395 |
AD, Alzheimer’s disease; MCI, mild cognitive impairment; MILD, mild dementia; SD, standard deviation; +, amyloid positive; –, amyloid negative. aPercentages are based on the number of respondents available per item. bhttp://familiesusa.org/product/federal-poverty-guidelines. cPercentages may exceed 100 as patients may have had more than 1 insurance type. dPercentages are based on those who worked. eTwelve comorbidities interrelated to AD were evaluated. fN = 678. gp-values were estimated for continuous versus categorical data from t-test or chi-square test, respectively.
MILD versus MCI patients were significantly more likely to fall below the 2016 federal poverty level ([43], 33% versus 19%), and less likely to report at least some college education (39.3% versus 63.8%) (both p < 0.001). Yet, neither measure differed by amyloid status for either severity cohort. MILD (versus. MCI) patients were also less likely to work for pay (21.4% versus 9.4%; p < 0.001) and more likely to reduce their work hours due to AD (13.8% versus 3.2%; p = 0.007). A significantly higher percentage of MILD[+] patients worked for pay (11.1%) versus MILD[−] patients (7.7%; p = 0.049).
The mean number of comorbidities was significantly higher for MILD versus MCI patients (2.5 versus 2.2; p < 0.001), and MILD[−] patients had a significantly higher number of comorbidities than MILD[+] patients (2.8 versus 2.3; p < 0.001). Interactions with police, fire, or ambulance services due to cognitive symptoms, number of accidental falls, and mean number of falls were significantly higher for MILD versus MCI patients (all p < 0.05) but not significantly different when stratified by amyloid status.
Study partners
The mean age of study partners was similar between the MCI and MILD cohorts (~58 years), yet MILD[+] study partners were significantly older (59.3 years) than MILD[−] study partners (55.8 years; p = 0.004) (Table 2). However, the percentage of study partners > 65 years old caring for MCI patients were significantly greater (43.3%) compared with those caring for MILD patients (37.5%; p = 0.032). Study partners of the MCI cohort versus the MILD cohort were more likely to be the sole caregiver (68.0% versus 53.2%; p < 0.001) and the spouses of patients (43.3% versus 37.8%; p < 0.001); yet were less likely to reside with patients (64.2% versus 72.3%; p = 0.002). These measures did not differ by the amyloid status of the patient.
Table 2
Study partner demographic characteristics across cohorts
| Cohort for comparisons | |||||||||
| Severity cohorts | Severity cohorts by amyloid status | ||||||||
| Description | MCI | MILD | pb | MCI[+] | MCI[−] | pb | MILD[+] | MILD[−] | pb |
| N = 679 | N = 650 | N = 300 | N = 281 | N = 317 | N = 300 | ||||
| Age, mean (SD), y | 58.7 (15.4) | 57.4 (15.1) | 0.125 | 59.7 (15.9) | 59.7 (14.4) | 0.958 | 59.3 (14.9) | 55.8 (15.2) | 0.004 |
| Age>65 y, n (%)a | 294 (43.3) | 244 (37.5) | 0.032 | 144 (48.0) | 126 (44.8) | 0.445 | 131 (41.3) | 102 (34.0) | 0.061 |
| Gender, female, n (%) | 429 (63.2) | 443 (68.2) | 0.056 | 187 (62.3) | 174 (61.9) | 0.919 | 226 (71.3) | 195 (65.0) | 0.093 |
| Number of caregivers in addition to study partner | <0.001 | 0.741 | 0.119 | ||||||
| 0 | 462 (68.0) | 346 (53.2) | 212 (70.7) | 199 (70.8) | 179 (56.5) | 145 (48.3) | |||
| 1 | 160 (23.6) | 208 (32.0) | 67 (22.3) | 58 (20.6) | 99 (31.2) | 101 (33.7) | |||
| 2 | 35 (5.2) | 67 (10.3) | 14 (4.7) | 14 (5.0) | 25 (7.9) | 41 (13.7) | |||
| 3 | 15 (2.2) | 20 (3.1) | 4 (1.3) | 8 (2.8) | 10 (3.2) | 8 (2.7) | |||
| 4+ | 7 (1.0) | 9 (1.4) | 3 (1.0) | 2 (0.7) | 4 (1.3) | 5 (1.7) | |||
| Study partner is a spouse, n (%) | 294 (43.3) | 246 (37.8) | <0.001 | 144 (48.0) | 121 (43.1) | 0.174 | 134 (42.3) | 102 (34.0) | 0.231 |
| Resides with patient, n (%) | 436 (64.2) | 470 (72.3) | 0.002 | 196 (65.3) | 181 (64.4) | 0.816 | 227 (71.6) | 218 (72.7) | 0.770 |
| Work for pay, n (%) | 328 (48.3) | 282 (43.4) | 0.072 | 139 (46.3) | 136 (48.4) | 0.618 | 132 (41.6) | 132 (44.0) | 0.554 |
| N = 351 | N = 368 | N = 161 | N = 145 | N = 185 | N = 168 | ||||
| Reason for reduced work, n (%) | <0.001 | 0.035 | 0.007 | ||||||
| Never worked | 25 (7.1) | 33 (9.0) | 11 (6.8) | 9 (6.2) | 13 (7.0) | 18 (10.7) | |||
| Reached retirement age | 185 (52.7) | 161 (43.8) | 92 (57.1) | 79 (54.5) | 85 (45.9) | 72 (42.9) | |||
| Early retirement | 47 (13.4) | 31 (8.4) | 26 (16.1) | 12 (8.3) | 19 (10.3) | 9 (5.4) | |||
| Laid off | 18 (5.1) | 20 (5.4) | 9 (5.6) | 6 (4.1) | 13 (7.0) | 7 (4.2) | |||
| Own health problems | 41 (11.7) | 63 (17.1) | 13 (8.1) | 24 (16.6) | 24 (13.0) | 36 (21.4) | |||
| To care for patient | 6 (1.7) | 26 (7.1) | 2 (1.2) | 0 | 19 (10.3) | 6 (3.6) | |||
| Other | 29 (8.3) | 34 (9.2) | 8 (5.0) | 15 (10.3) | 12 (6.5) | 20 (11.9) | |||
| N = 646 | N = 597 | N = 289 | N = 262 | N = 293 | N = 272 | ||||
| Number of missed working days/month for caregiving, mean (SD) | 0.1 (0.8) | 0.4 (2.1) | 0.002 | 0.1 (0.5) | 0.2 (1.1) | 0.731 | 0.4 (1.1) | 0.5 (2.9) | 0.850 |
| N = 583 | N = 615 | N = 299 | N = 280 | N = 316 | N = 299 | ||||
| Insurance status, n (%)c | <0.001 | 0.452 | 0.001 | ||||||
| Public | 279 (47.9) | 318 (51.7) | 148 (49.5) | 131 (46.8) | 156 (49.4) | 162 (54.2) | |||
| Private | 291 (49.9) | 243 (39.5) | 147 (49.2) | 144 (51.4) | 153 (48.4) | 90 (30.1) | |||
| Self-insured | 26 (4.5) | 4 (0.7) | 11 (3.7) | 15 (5.4) | 3 (0.9) | 1 (0.3) | |||
| Other | 12 (2.1) | 16 (2.6) | 9 (3.0) | 3 (1.1) | 8 (2.5) | 8 (2.7) | |||
| No insurance | 34 (5.8) | 61 (9.9) | 18 (6.0) | 16 (5.7) | 23 (7.3) | 38 (12.7) | |||
| Unknown | 36 (6.2) | 18 (2.9) | 14 (4.7) | 18 (6.4) | 7 (2.2) | 11 (3.7) | |||
| N = 583 | N = 615 | N = 299 | N = 280 | N = 316 | N = 299 | ||||
| Number of comorbiditiesd, mean (SD) | 1.1 (1.4) | 1.1 (1.4) | 0.539 | 1.2 (1.4) | 1.1 (1.4) | 0.130 | 1.0 (1.4) | 1.1 (1.4) | 0.477 |
AD, Alzheimer’s disease; MCI, mild cognitive impairment; MILD, mild dementia; SD, standard deviation; +, amyloid positive; –, amyloid negative. aPercentages are based on the number of respondents available per item. bp-values were estimated for continuous versus categorical data from t-test or chi-square test, respectively. cPercentages may exceed 100 as patients may have had more than 1 insurance type. dTwelve comorbidities interrelated to AD were evaluated.
Overall, >43% of study partners worked for pay, which was not influenced by severity status of the patient or amyloid status within each severity cohort. However, a significantly greater percentage of study partners reduced work to care for patients in the MILD versus MCI cohort (7.1% versus 1.7%; p < 0.001). Likewise, a greater percentage of study partners had to reduce work to care for patients with an amyloid[+] status: 1.2% MCI[+] versus 0% MCI[−] (p > 0.05) and 10.3% MILD[+] versus 3.6% MILD[−] (p = 0.014). The number of missed workdays by all study partners (working and nonworking) caring for patients was on average 0.4 days/month in the MILD cohort and 0.1 days/month in the MCI cohort (p = 0.002). Amyloid status of the patient did not significantly affect the average number of missed workdays that study partners provided caregiving.
Time spent caring for patient
Total time per month (combining basic, instrumental, and supervision activities) spent by study partners caring for patients was significantly affected by severity status: 84 hours/month for the MCI cohort versus 207 hours/month for the MILD cohort (p < 0.001). Amyloid status did not significantly affect the total time per month spent by study partners caring for patients in either severity cohort: MCI[+] versus MCI[−]: 69 versus 85 hours/month (p = 0.248) and MILD[+] versus MILD[−]: 196 versus 218 hours/month (p = 0.102).
Study partners spent significantly more time assisting patients in the MILD cohort with bADLs and iADLs and providing supervision than in the MCI cohort (each p < 0.001) (Table 3). Amyloid[−] status was associated with significantly greater amount of time spent by the study partner assisting with bADLs for the MCI cohort (11.7 hours/month MCI[+] versus 21.6 hours/month MCI[−] [p = 0.049]) and supervision for the MILD cohort (68.0 hours/month MILD[+] versus 81.7 hours/month MILD[−] [p = 0.049]) (Table 3). Differences were not observed based on amyloid status for time spent by the study partner assisting iADLs.
Table 3
Study partner time spent caring for patient
| Cohort for comparisons | |||||||||
| Severity cohorts | Severity cohorts by amyloid status | ||||||||
| Description Mean (SD) Time per Month (hours) | MCI | MILD | p | MCI[+] | MCI[−] | p | MILD[+] | MILD[−] | p |
| N = 679 | N = 650 | N = 300 | N = 281 | N = 317 | N = 300 | ||||
| Basic activities of daily living | 18.6 (43.7) | 49.2 (73.0)a | <0.001 | 11.7 (29.5) | 21.6 (54.2) | 0.049 | 45.4 (72.2) | 54.2 (74.0)c | 0.071 |
| Instrumental activities of daily living | 38.9 (59.6) | 86.2 (79.3)a | <0.001 | 38.9 (68.3) | 34.5 (49.7) | 0.448 | 86.0 (83.8)b | 86.9 (75.4) | 0.875 |
| Supervision | 27.0 (68.1) | 75.2 (103.7) | <0.001 | 18.6 (47.1) | 29.5 (75.4) | 0.126 | 68.0 (99.4) | 81.7 (107.2) | 0.049 |
MCI, mild cognitive impairment; MILD, mild dementia; SD, standard deviation; +, amyloid positive; –, amyloid negative. aN = 649, bN = 316, cN = 299.
Societal costs
Patients in the MILD versus MCI cohort incurred more total societal costs per month using opportunity costs ($4243 versus $2816; p < 0.001) (Fig. 2A); this included data from 3 patients/study partners who incurred very high costs due to hospitalization: 1 MCI[−] patient who was hospitalized for 29 days, 1 caregiver (to a MCI[−] patient) who was hospitalized for 29 days, and 1 caregiver (to a MILD[+] patient) who was hospitalized for 30 days. Overall, these costs were not significantly different based on amyloid status within each severity cohort.
Fig. 2
Total societal costs across cohorts. A) Total (Using Opportunity Costs). There were no statistically significant differences for each outcome for MCI[+] versus MCI[−] and MILD[+] versus MILD[−]. Opportunity cost sums lost productive hours and multiplies them by national average annual gross hourly wage for workers and by lost leisure time for non-workers (35% of hourly wage for workers) [30]. *p < 0.001 for MCI versus MILD. B) Total (Using Replacement Costs). There were no statistically significant differences for each outcome for MCI versus MILD, MCI[+] versus MCI[−], and MILD[+] versus MILD[−]. Replacement cost sums lost productive times and multiplies it by the market value of professional caregiver/aide hourly wage for all caregivers irrespective of working status of the study partner. In both of these methods, if a caregiver is paid for patient care, those hours will be subtracted from the production loss time [31, 32, 35–38]. MCI, mild cognitive impairment; MILD, mild dementia; SD, standard deviation; USD, U.S. dollars; +, amyloid positive; –, amyloid negative.
![Total societal costs across cohorts. A) Total (Using Opportunity Costs). There were no statistically significant differences for each outcome for MCI[+] versus MCI[−] and MILD[+] versus MILD[−]. Opportunity cost sums lost productive hours and multiplies them by national average annual gross hourly wage for workers and by lost leisure time for non-workers (35% of hourly wage for workers) [30]. *p < 0.001 for MCI versus MILD. B) Total (Using Replacement Costs). There were no statistically significant differences for each outcome for MCI versus MILD, MCI[+] versus MCI[−], and MILD[+] versus MILD[−]. Replacement cost sums lost productive times and multiplies it by the market value of professional caregiver/aide hourly wage for all caregivers irrespective of working status of the study partner. In both of these methods, if a caregiver is paid for patient care, those hours will be subtracted from the production loss time [31, 32, 35–38]. MCI, mild cognitive impairment; MILD, mild dementia; SD, standard deviation; USD, U.S. dollars; +, amyloid positive; –, amyloid negative.](https://content.iospress.com:443/media/jad/2020/75-2/jad-75-2-jad191212/jad-75-jad191212-g002.jpg)
Evaluation of cost components found that direct nonmedical resource costs for patients ($359 MILD versus $194 MCI; p = 0.002) and indirect nonmedical resource costs for study partners ($1912 MILD versus $865 MCI; p < 0.001) were significantly higher for patients with advanced severity (Table 4). To the contrary, each cost component was not significantly affected by amyloid status within each severity cohort. Corresponding direct medical resource costs for study partners were $410 MCI[+] versus $929 MCI[−] (p = 0.231) and $861 MILD[+] versus $529 MILD[−] (p = 0.430). Direct nonmedical resource costs for patients were $222 MCI[+] versus $187 MCI[−] (p = 0.660) and $295 MILD[+] versus $423 MILD[−] (p = 0.101). Similarly, indirect nonmedical resource costs for study partners were $718 MCI[+] versus $874 MCI[−] (p = 0.307) and $1953 MILD[+] versus $1867 MILD[−] (p = 0.563).
Table 4
Cost components of total societal costs using opportunity costs
| Cohort for comparisons | |||||||||
| Severity cohorts | Severity cohorts by amyloid status | ||||||||
| Description Mean (SD) Cost per Month (USD2017) | MCI | MILD | p | MCI[+] | MCI[−] | p | MILD[+] | MILD[−] | p |
| N = 677 | N = 650 | N = 300 | N = 283 | N = 317 | N = 300 | ||||
| Direct medical resources for patients | 1098 (5332) | 1288 (3604) | 0.445 | 1048 (3140) | 1066 (7129) | 0.958 | 892 (1567) | 1518 (2971) | 0.062 |
| Direct nonmedical resources for patients | 194 (815) | 359 (1080) | 0.002 | 222 (861) | 187 (838) | 0.660 | 295 (1052) | 423 (1091) | 0.101 |
| Direct medical resources for study partners | 660 (4992) | 684 (5183) | 0.931 | 410 (745) | 929 (7334) | 0.231 | 861 (7012) | 529 (2492) | 0.430 |
| Indirect nonmedical resources for study partners | 865 (1504) | 1912 (2143) | <0.001 | 718 (1251) | 874 (1677) | 0.307 | 1953 (2382) | 1867 (1864) | 0.563 |
MCI, mild cognitive impairment; MILD, mild dementia; SD, standard deviation; +, amyloid positive; –, amyloid negative.
Total societal costs per month for MCI ($2035) versus MILD ($2653) cohorts and based on amyloid status within each severity cohort were not significantly different when replacement costs were used (p = 0.107) (Fig. 2B). However, it is notable that total costs using replacement costs for the MILD cohort only were much lower compared to the MILD cohort using opportunity costs.
DISCUSSION
This study formally examined the total societal costs in patients who received a clinician diagnosis of mild cognitive impairment or mild dementia due to AD (early AD), which was further classified by amyloid PET imaging as [+] or [−] to substantiate the diagnosis. Key findings included the following: 1) rising costs were evident with increasing cognitive-functional disease severity, 2) cost drivers tended to vary by severity cohort with the greatest overall differences due to caregiver time, and 3) costs were similar across amyloid status within each severity cohort, highlighting the need for further investigation of the role of other health conditions in influencing the diagnosis of AD and increasing overall healthcare costs.
To our knowledge, GERAS-US is the first study to examine costs in patients with MCI or MILD that is related to AD based on amyloid testing. Not surprisingly, significantly higher total societal costs per month were incurred for patients diagnosed with AD within the cohorts of MILD [$4243] versus MCI [$2816]. Among the four cost components comprising total societal costs, direct medical costs for patients and indirect costs for study partners combined were responsible for more than 70% of overall total costs regardless of severity status. For the other two cost components, patients with MILD versus MCI incurred approximately 2-fold higher direct nonmedical costs for patients and indirect costs for study partners. Both of these measures represent costs incurred to provide additional support to patients in terms of community services (care-related transportation, nursing or home aides, and food delivery) and caregiver time. The impact of functional impairment manifested for patients diagnosed with MCI has previously been described as less debilitating than for patients at later stages of AD; however, our data suggest that even with higher functioning among those with MCI, there is still functional impairment to the point that it impacts caregivers.
For this population of patients with MCI or MILD, the average time since AD-related diagnosis of MCI or MILD was 1.5 years [25]. These GERAS-US economic findings support earlier data by Lin et al. [8] who reported increased costs during a 2-year follow-up period in Medicare patients diagnosed with AD-related dementia or MCI that was not AD-specific versus matched control participants. Notably, costs for the AD-related dementia and MCI patients began to rise in the 12 months prior to receiving a formal diagnosis ($15,091 and $13,691, respectively) that continued to rise in the 1 year immediately following the diagnosis ($27,126 and $20,386, respectively), and then leveled off in the second year thereafter ($17,257 and $14,286, respectively). Increased costs were due to the substantial increased use of direct medical costs. Our data support the findings of others wherein direct costs were a major driver of overall costs in patients with AD [8]. In addition, direct costs for uncontrolled comorbidities were often potentially avoidable [44]. The greatest overall cost driver was caregiver time.
In GERAS-US, indirect study partner costs were computed based on the caregiver’s time spent assisting with bADLs, iADLs, and supervision of patients as well as missed work. Study partners spent in excess of 200 hours/month caring for patients in the MILD cohort (>50 hours/week) and more than 80 hours/month caring for the MCI cohort (20 hours/week) (p < 0.001). Study partner time spent caring for the patient must also consider that 48.3% of those caring for patients with MCI and 43.4% caring for those with MILD still worked for pay. Although workdays missed due to caregiving responsibilities were relatively modest at baseline (0.1 day/month and 0.4 day/month for MCI and MILD, respectively), the potential impact to the labor force participation rate that both (growing) incidence and disease progression may represent warrants further investigation. The data reported herein with GERAS-US show that despite significant difference between study partner time spent caring for patients between the MCI and MILD cohorts, considerable study partner assistance was required in the performance of bADLs, iADLs, and supervision with MCI, suggesting that an observable burden related to function does exist prior to the onset of dementia. Diagnostic criteria for MCI include the ability to maintain independence of function in daily life with minimal aids or assistance but acknowledge minor problems in the performance of complex tasks [45]. Our findings are consistent with previously described research [46] that found the impact of functional impairment manifested for patients diagnosed with MCI was less debilitating than for patients at later stages of AD; however, our data suggest that even with higher functioning among those with MCI, as defined using FAQ scores obtained from physician interviews with study partners, there is still functional impairment to the degree that it impacts caregivers when measured based on study partner’s assessment of caregiver time. Whether inconsistences in these measures of function are due to inexactness in diagnosis or confounding evidence caused by other comorbidities that limit function need further exploration.
These economic findings are consistent with the broader measures of caregiver burden included in the GERAS-US study [25]. Caregiver burden in terms of stress, time for self, and impact of caring on the caregiver’s social life was significantly worse among MILD(–) patients than MILD(+) patients according to the Zarit Burden Interview [25]. In addition to study partner-rated assessments of caregiver burden, differences between MCI and MILD were reported in terms of time spent providing care to patients without equalizing the time spent on bADLs, iADLs, and supervision by the varying level of intensity associated with these measures. There was a 3-fold difference between MCI and MILD in caregiver time due to the most burdensome category of aiding with bADLs and approximately a 2-fold difference with the other two measures. Additionally, costs did not account for work efficiency and effectiveness (i.e., caregivers sleep less, have worse health, and have higher levels of anxiety and depression), caregivers likely experience negative effects related to work productivity. Furthermore, given that patient-caregiver dyads experience greater loss of savings and have a lower financial safety net, and are mindful that cost will rise in the future, there may be greater pressure to not miss work. Of note, the economic consequences of this dynamic appears to be sensitive to the wage rate of the caregiver. In our study, an approach using opportunity costs derived higher cost estimates on average than a replacement cost approach, indicating that lost work or wages were higher than replacement costs that assumed informal caregivers were substituted for low-paid caregivers.
While the majority of patients had only 1 caregiver (68.0% MCI versus 53.2% MILD) and resided at home, caregiving dynamics appear to evolve with severity of disease including increased number of additional caregivers, decreased percentage of spouses as primary caregiver, and increase in the percentage of caregivers that reside with the patients for the MILD cohort. The shifting of caregiving responsibilities from spouse to adult children may have important implications on the manifestation and impact of caregiving strain as well as decisions related to transitions of care and the overall delivery of care.
It is noteworthy that costs were not significantly different by amyloid status within each severity cohort. Perhaps, this is no surprise as physicians were treating patients as if they had AD in the 1-month pre-baseline period. In fact, among Medicare patients with MCI or dementia of uncertain etiology who participated in the IDEAS study, clinical care management (i.e., AD drug therapy, other drug therapy, or counseling about safety and future planning) was substantially altered within 90 days of identification of a patient’s amyloid status [47]. Although baseline findings did not find differences in costs between amyloid[+] and amyloid[−] patients, longitudinal cost differences are still in question among patients with cognitive deficits, especially once physicians were informed of the patient’s amyloid status. Furthermore, some patients classified as amyloid [−] may in fact be in the AD pathway despite subthreshold results for Aβ. The GERAS-US study will provide an opportunity to observe how costs and caregiving evolve after determining amyloid status in the real-world setting.
Despite the lack of variability in costs by amyloid status, study partner time spent caring for the patient was inconsistently affected by amyloid status within each severity cohort for bADLs (11.7 hours/month MCI[+] versus 21.6 hours/month MCI[−] [p = 0.049]) and supervision of patients (68.0 hours/month MILD[+] versus 81.7 hours/month MILD[−] [p = 0.049]). The need for increased caregiver time among some patients who were amyloid[−] may be associated with their increased number of comorbidities. It may be postulated that like baseline findings on the clinical difference by amyloid status reported elsewhere [25], knowledge of amyloid status may shift costs to address alternative causes of cognitive decline. In the GERAS-US study, MILD[−] versus MILD[+] patients were sicker with greater rates of depression (55.7% versus 40.4%), sleep disorders (34.3% versus 26.5%), and obstructive pulmonary disease (11.8% versus 6.6%) [25] and also experienced greater burden that warrants both individualized medical and supportive care services. Overall, the differences seen in comorbidity in amyloid[−] patients underscore the need for accurate diagnosis and treatment in patients with cognitive impairment who lack amyloid pathology.
The findings of this study must be considered based on the following limitations. There was a high level of screen failures due to the inability to obtain an amyloid PET scan. One site (n = 50 patients) was withdrawn from enrollment due to quality or compliance findings prior to amyloid testing. These participants were considered screen failures due to lack of evidence of disease. There was an attempt to enroll patients from geographically dispersed clinical practice sites throughout US; however, enrollment was restricted to sites in close proximity to imaging centers that administered amyloid scans. Thus, patients enrolled in this study are not nationally representative. Additionally, limiting study participation enrollment to patients who were unlikely to enroll in clinical drug trials may have excluded patients whose symptoms were fast progressing and associated with potentially higher total costs. To reflect real-world practices, amyloid images were interpreted without the use of a central reader or validation against a criterion standard; consequently, the variability among readers may impact the results. Another limitation is that total societal costs may not have captured all costs of illness and are likely underestimated. For example, only caregiver work loss costs are included in the equation. These data suggest that among patients with early AD, the MILD versus MCI patients also were less likely to work for pay and of those who did work a greater proportion reduced their work hours due to AD. El-Hayek et al. recently reported that there are many hidden societal costs associated with AD, such as underemployment and loss of savings and earnings in the years leading up to the diagnosis, reduced health and well-being of the caregiver, as well as reduced quality of life [48]. It is important to mention that cost estimates used in this study relied on national averages rather than individualized costs that may be impacted by the gender, race and ethnicity, and socioeconomic status of the study population. Cost estimates may have been underestimated as patients/caregivers in this study were more likely to be from urban areas (had to be near PET/major medical centers) and may have gross hourly wages higher than national averages. Use of publicly available cost information equalizes comparisons across groups but may be inexact at the individual patient level. For example, as stated in Supplementary Table 1, medication costs were based on the top 3 drugs per comorbidity at the most common strength per drug for patients of similar age to this study’s population age and older. Subsequently, a single average cost per drug/strength/daily dose was defined by using an average wholesale price. Finally, these reported findings represent estimated costs for MCI and mild dementia from AD over a brief period. Because costs were calculated for patients at the time they were seeking medical care, cost estimates may be inflated; specifically, costs may have been biased toward finding higher direct medical resources as a cost driver, especially for the MCI cohort. Our nonsignificant findings with regard to amyloid status are in contrast to those of Hunter et al. [49] who found that costs of misdiagnosis of AD were higher in patients who were subsequently (12 months later) found to have diagnoses of vascular dementia or Parkinson’s disease solely versus as a comorbidity of AD. Despite these limitations, the physicians participating in this study represent a sample of those who treat patients in the course of their practice. There were no prescribed treatments or regimens specified in the protocol; thus, management of the patients was determined by the physician, caregiver, and patient, representing real-world practice.
The GERAS-US study has several strengths. Costs were derived for patients and study partners to view full disease impact with known amyloid status. A low level of missing data with electronic data was captured. Community-based results by severity level may be applied to models to understand the cost impact of disease progression or the cost-effectiveness of interventions that may slow disease progression.
In summary, MCI and mild dementia from AD poses a financial burden to the patient, caregiver, and society, and even with higher functioning among those with MCI, there remains functional impairment that significantly impacts caregivers. Costs are evident early and increase as the disease progresses. The main driver of cost is associated with the level of impairment of the patient (e.g., the clinical cognitive-functional status of the patient) regardless of the underlying disease(s) and condition(s) responsible for their cognitive impairment. Extrapolation of our data implies that total societal costs exceed $33,000/year for patients with MCI and $50,000/year for those with MILD. For patients with MCI and mild dementia from AD, direct medical care expenditures dominated the cost burden for patients with MCI (likely due to the impact of cognitive impairment on comorbidity management) but shifted to indirect nonmedical resources that reflect the costs associated with caregiving for patients in the MILD cohort. Although amyloid status did not influence cost in GERAS-US, knowledge of amyloid status may improve the ability to identify the underlying causes of cognitive impairment and therefore support individualized treatment and care planning. In some cases, ruling out AD by a negative amyloid scan allows clinicians to identify and address with more certainty and rigor potentially treatable causes of cognitive impairment, such as those due to depression and vascular etiologies (e.g., hypertension and diabetes mellitus) [50]. Finally, the GERAS-US study reinforces the need for care strategies that recognize and address the considerable resources and costs associated with caring for people with AD.
ACKNOWLEDGMENTS
Writing support was provided by Teresa Tartaglione, PharmD (Synchrogenix, a Certara Company, Wilmington, DE, USA). The authors thank the following who provided support to the conduct of this study: the GERAS team (Rita Papen, Jose Luis Guerra, and Deanilee Deckard) and each of the study investigators, site personnel, patients, and study partners for their participation in this study.
Eli Lilly and Company is the sole sponsor and funder for this study; the sponsor was responsible for the study design, data collection, data analysis, interpretation of data, and decision to publish the findings.
Authors’ disclosures available online (https://www.j-alz.com/manuscript-disclosures/19-1212r1).
SUPPLEMENTARY MATERIAL
[1] The supplementary material is available in the electronic version of this article: https://dx.doi.org/10.3233/JAD-191212.
REFERENCES
[1] | Alzheimer’s Association ((2016) ) 2016 Alzheimer’s disease facts and figures. Alzheimers Dement 12: , 459–509. |
[2] | Hurd MD , Martorell P , Delavande A , Mullen KJ , Langa KM ((2013) ) Monetary costs of dementia in the United States. N Engl J Med 368: , 1326–1334. |
[3] | Wimo A , Reed CC , Dodel R , Belger M , Jones RW , Happich M , Argimon JM , Bruno G , Novick D , Vellas B , Haro JM ((2013) ) The GERAS Study: A prospective observational study of costs and resource use in community dwellers with Alzheimer’s disease in three European countries –study design and baseline findings. J Alzheimers Dis 36: , 385–399. |
[4] | Lucas Carrasco R ((2007) ) Quality of life and dementia. Med Clin (Barc) 128: , 70–75. |
[5] | Argimon JM , Limon E , Vila J , Cabezas C ((2004) ) Health-related quality of life in carers of patients with dementia. Fam Pract 21: , 454–457. |
[6] | Xie J , Brayne C , Matthews FE ((2008) ) Survival times in people with dementia: Analysis from a population based cohort study with 14-year follow-up. BMJ 336: , 258–262. |
[7] | Schultz R , Beach SR ((1999) ) Caregiving as a risk factor for mortality: The caregiver health effects study. JAMA 282: , 2215–2219. |
[8] | Lin PJ , Zhong Y , Fillit HM , Chen E , Neumann PJ ((2016) ) Medicare expenditures of individuals with Alzheimer’s disease and related dementias or mild cognitive impairment before and after diagnosis. J Am Geratr Soc 64: , 1549–1957. |
[9] | Leibson CL , Long KH , Ransom JE , Roberts RO , Hass SL , Duhig AM , Smith CY , Emerson JA , Pankratz VS , Petersen RC ((2015) ) Direct medical costs and source of cost differences across the spectrum of cognitive decline: A population-based study. Alzheimers Dement 11: , 917–932. |
[10] | Zhu CW , Sano M , Ferris SH , Whitehouse PJ , Patterson MB , Aisen PS ((2013) ) Health-related resource use and costs in elderly adults with and without mild cognitive impairment. J Am Geriatr Soc 6: , 396–402. |
[11] | Gustavsson A , Brinck P , Bergvall N , Kolasa K , Wimo A , Winblad B , Jönsson L ((2011) ) Predictors of costs of care in Alzheimer’s disease: A multinational sample of 1222 patients. Alzheimer Dement 7: , 318–327. |
[12] | Zhu CW , Leibman C , McLaughlin T , Zbrozek AS , Scarmeas N , Albert M , Brandt J , Blacker D , Sano M , Stern Y ((2008) ) Patient dependence and longitudinal changes in costs of care in Alzheimer’s disease. Dement Geriatr Cogn Disord 26: , 416–423. |
[13] | Zhu CW , Scarmeas N , Stavitsky K , Albert M , Brandt J , Blacker D , Sano M , Stern Y ((2008) ) Comparison of costs of care between patients with Alzheimer’s disease and dementia with Lewy bodies. Alzheimers Dement 4: , 280–284. |
[14] | Zhu CW , Torgan R , Scarmeas N , Albert M , Brandt J , Blacker D , Sano M , Stern Y ((2008) ) Home health and informal care utilization and costs over time in Alzheimer’s disease. Home Health Care Serv Q 27: , 1–20. |
[15] | Zhu CW , Scarmeas N , Torgan R , Albert M , Brandt J , Blacker D , Sano M , Stern Y ((2006) ) Clinical characteristics and longitudinal changes of informal cost of Alzheimer’s disease in the community. J Am Geriatr Soc 54: , 1596–1602. |
[16] | Zhu CW , Scarmeas N , Torgan R , Albert M , Brandt J , Blacker D , Sano M , Stern Y ((2006) ) Longitudinal study of effects of patient characteristics on direct costs in Alzheimer disease. Neurology 67: , 998–1005. |
[17] | Zhu CW , Scarmeas N , Torgan R , Albert M , Brandt J , Blacker D , Sano M , Stern Y ((2006) ) Clinical features associated with costs in early AD: Baseline data from the Predictors Study. Neurology 66: , 1021–1028. |
[18] | Jonsson L , Eriksdotter Jonhagen M , Kilander L , Soininen H , Hallikainen M , Waldemar G , Nygaard H , Andreasen N , Winblad B , Wimo A ((2006) ) Determinants of costs of care for patients with Alzheimer’s disease. Int J Geriatr Psychiatry 21: , 449–459. |
[19] | Reed C , Happich M , Argimon JM , Haro JM , Wimo A , Bruno G , Dodel R , Jones RW , Vellas B , Belger M ((2017) ) What drives country differences in cost of Alzheimer’s disease? An explanation from resource use in the GERAS study. . J Alzheimers Dis 57: , 797–812. |
[20] | Laforce R Jr , Rabinovici GD ((2011) ) Amyloid imaging in the differential diagnosis of dementia: Review and potential clinical applications. Alzheimers Res Ther 3: , 31. |
[21] | Johnson KA , Minoshima S , Bohnen NI , Donohoe KJ , Foster NL , Herscovitch P , Karlawish JH , Rowe CC , Carrillo MC , Hartley DM , Hedrick S , Mitchell K , Pappas V , Thies WH ((2013) ) Appropriate use criteria for amyloid PET: A report of the Amyloid Imaging Taskforce, the Society of Nuclear Medicine and Molecular Imaging, and the Alzheimer’s Association. J Nucl Med 9: , 476–490. |
[22] | Clark CM , Pontecorvo MJ , Breach TG , Bedell BJ , Coleman RE , Doraiswamy PM , Fleisher AS , Reiman EM , Sabbagh MN , Sadowsky CH , Schneider JA , Arora A , Carpenter AP , Flitter ML , Joshi AD , Krautkramer MJ , Lu M , Mintun MA , Skovronsky DM ((2012) ) Cerebral PET with florbetapir compared with neuropathology at autopsy for detection of neuritic amyloid-β plaques: A prospective cohort study. Lancet Neurol 11: , 669–678. |
[23] | Jack CR Jr ((2011) ) Alliance for aging research AD biomarkers work group: Structural MRI. Neurobiol Aging 32: (Suppl 1), S48–S57. |
[24] | Morris GP , Clark IA , Vissel B ((2014) ) Inconsistencies and controversies surrounding the amyloid hypothesis of Alzheimer’s disease. Acta Neuropathol Commun 2: , 135. |
[25] | Robinson RL , Rentz DM , Bruemmer V , Andrews JS , Zagar A , Kim Y , Schwartz RL , Ye W , Fillit HM ((2019) ) Observation of patient and caregiver burden associated with early Alzheimer’s disease in the United States: Design and baseline findings of the GERAS-US Cohort Study. J Alzheimers Dis 72: , 279–292. |
[26] | Folstein SE , McHugh PR ((1975) ) “Mini-mental state.” A practical method for grading the cognitive state of patients for the clinician. J Psychiatric Res 2: , 189–198. |
[27] | Pfeffer RI , Kurosaki TT , Harrah CH Jr , Chance JM , Filos S ((1982) ) Measurement of functional activities in older adults in the community. J Gerontol 37: , 323–329. |
[28] | Teng E , Becker BW , Woo E , Knopman DS , Cummings JL , Lu PH ((2010) ) Utility of the Functional Activities Questionnaire for distinguishing mild cognitive impairment from very mild Alzheimer’s disease. Alzheimer Dis Assoc Disord 24: , 348–353. |
[29] | Wimo A , Gustavsson A , Jönsson L , Winblad B , Hsu MA , Gannon B ((2013) ) Application of resource utilization in dementia (RUD) instrument in a global setting. Alzheimers Dement 9: , 429–435. |
[30] | United States Department of Labor—Bureau of Labor Statistics. https://www.bls.gov/news.release/pdf/wkyeng.pdf, Accessed September 21, 2019. |
[31] | Genworth 2016 Cost of Care Survey, Conducted by CareScout®, April 2016. https://www.genworth.com/about-us/industry-expertise/cost-of-care.html, Accessed August 23, 2019. |
[32] | American Elder Care Research Organization. Paying for Senior Care. https://www.payingforseniorcare.com/about-us.html, Accessed September 22, 2019. |
[33] | Agency for Healthcare Research and Quality. Hospital Inpatient Services-Mean and Median Expenses per Person with Expense and Distribution of Expenses by Source of Payment: United States, 2014. Medical Expenditure Panel Survey Household Component Data. Generated interactively. https://meps.ahrq.gov/mepsweb/data_stats/quick_tables.jsp, Accessed September 22, 2019. |
[34] | National Center for Health Statistics. Health, United States 2016: With Chartbook on Long-term Trends in Health. Hyattsville, MD. 2017. https://www.cdc.gov/nchs/data/hus/hus16.pdf Accessed September 22, 2019. |
[35] | Agency for Healthcare Research and Quality. Emergency Room Services-Mean and Median Expenses per Person with Expense and Distribution of Expenses by Source of Payment: United States, 2014. Medical Expenditure Panel Survey Household Component Data. Generated interactively. https://meps.ahrq.gov/mepsweb/data_stats/quick_tables.jsp, Accessed September 22, 2019. |
[36] | CMS Physician Fee Schedule 2016. National Payment Amount by HCPCS Code. https://www.cms.gov/apps/physician-fee-schedule/search/search-results.aspx?Y=0&T=4&HT=1&CT=0&H1=99285&M=5, Accessed August 23, 2019. |
[37] | Ziegler J , Redel N , Rosenberg L , Carlson B ((2015) ) Older Americans Act Nutrition Programs Evaluation: Meal Cost Analysis. Mathematica Policy Research, http://www.mealsonwheelsamerica.org/docs/default-source/default=document-library/nsp-meal-cost-analysis.pdf, Accessed September 22, 2019. |
[38] | Federal Transit Administration. Accessible transit services for All, FTA Report No. 0081. www.transit.dot.gov/sites/fta.dot.gov/files/FTA0081_Research_Report_Summary.pdf, Accessed September 22, 2019. |
[39] | IMS Health, IMS MIDAS Quantum MAT March 2013. https://www.imshealth.com/files/web/IMSH%20Institute/NPA_Data_Brief-.pdf, Accessed May 11, 2019. |
[40] | Truven Health Analytics. RED BOOK A Comprehensive, Consistent Drug Pricing Resource. Micromedex Solutions. http://micromedex.com/products/product-suites/clinical-knowledge/redbook, Accessed September 22. 2019. |
[41] | Belger M , Argimon JM , Dodel R , Haro JM , Wimo A , Reed C ((2015) ) Comparing resource use in Alzheimer’s disease across three European countries –18 month results of the GERAS study. Value Health 18: , A759–A760. |
[42] | Casella G , Berger RL ((2001) ) Statistical Inference. Cengage Learning; 2nd edition. |
[43] | Families USA. 2016 Federal Poverty Guidelines. http://familiesusa.org/product/federal-poverty-guidelines, Accessed September 18, 2019. |
[44] | Lin PJ , Fillit HM , Cohen JT , Neumann ((2013) ) Potentially avoidable hospitalizations among Medicare beneficiaries with Alzheimer’s disease and related disorders. Alzheimers Dement 9: , 30–38. |
[45] | Albert MS , DeKosky ST , Dickson D , Dubois B , Feldman HH , Fox NC , Gamst A , Holtzman DM , Jagust WJ , Petersen RC , Snyder PJ , Carrillo MC , Thies B , Phelps CH ((2011) ) The diagnosis of mild cognitive impairment due to Alzheimer’s disease: Recommendations from the National Institute on Aging-Alzheimer’s Association workgroups on diagnostic guidelines for Alzheimer’s disease. Alzheimers Dement 7: , 270–279. |
[46] | Brown PJ , Devanand DP , Liu X , Caccappolo E ((2011) ) Functional impairment in elderly patients with mild cognitive impairment and mild Alzheimer Disease. Arch Gen Psychiatry 68: , 617–626. |
[47] | Rabinovici GD , Gatsonis C , Apgar C , Chaudhary K , Gareen I , Hanna L , Hendrix J , Hillner BE , Olson C , Lesman-Segev OH , Romanoff J , Siegel BA , Whitmer RA , Carrillo MC ((2019) ) Association of amyloid positron emission tomography with subsequent change in clinical management among Medicare beneficiaries with mild cognitive impairment or dementia. JAMA 321: , 1286–1294. |
[48] | El-Hayek JH , Wiley RE , Khoury CP , Daya RP , Ballard C , Evans AR , Karran M , Molinuevo JL , Norton M , Atri A ((2019) ) Tip of the iceberg: Assessing the global socioeconomic costs of Alzheimer’s Disease and related dementias and strategic implications for stakeholders. J Alzheimers Dis 70: , 323–341. |
[49] | Hunter CA , Kirson NY , Desai U , Cummings AK , Faries DE , Birnbaum HG ((2015) ) Medical costs of Alzheimer’s disease misdiagnosis among US Medicare beneficiaries. Alzheimers Dement 11: , 887–895. |
[50] | Kjeldsen SE , Narkiewicz K , Burnier M , Oparil S ((2019) ) Systolic blood pressure control prevents cognitive decline and slows development of white matter lesions in the brain: The SPRINT MIND study outcomes. Blood Press 28: , 356–357. |


