
Brief Cognitive Tests Used in Primary Care Cannot Accurately Differentiate Mild Cognitive Impairment from Subjective Cognitive Decline
Abstract
Background:
Differentiating mild cognitive impairment (MCI) from subjective cognitive decline (SCD) is important because of the higher progression rate to dementia for MCI and when considering future disease-modifying drugs that will have treatment indications at the MCI stage.
Objective:
We examined if the two most widely-used cognitive tests, the Mini-Mental State Examination (MMSE) and clock-drawing test (CDT), and a test of attention/executive function (AQT) accurately can differentiate MCI from SCD.
Methods:
We included 466 consecutively recruited non-demented patients with cognitive complaints from the BioFINDER study who had been referred to memory clinics, predominantly from primary care. They were classified as MCI (n = 258) or SCD (n = 208) after thorough neuropsychological assessments. The accuracy of MMSE, CDT, and AQT for identifying MCI was examined both in training and validation samples and in the whole population.
Results:
As a single test, MMSE had the highest accuracy (sensitivity 73%, specificity 60%). The best combination of two tests was MMSE < 27 points or AQT > 91 seconds (sensitivity 56%, specificity 78%), but in logistic regression models, their AUC (0.76) was not significantly better than MMSE alone (AUC 0.75). CDT and AQT performed significantly worse (AUC 0.71; p < 0.001–0.05); otherwise no differences were seen between any combination of two or three tests.
Conclusion:
Neither single nor combinations of tests could differentiate MCI from SCD with adequately high accuracy. There is a great need to further develop, validate, and implement accurate screening-tests for primary care to improve accurate identification of MCI among individuals that seek medical care due to cognitive symptoms.
INTRODUCTION
A clinical version of mild cognitive impairment (MCI) has recently been introduced in the Diagnostic and Statistical Manual of Mental Disorders, Fifth Edition (DSM-5) as mild neurocognitive disorder, making it a formal clinical diagnosis that can be used on its own or paired with an underlying etiology such as Alzheimer’s disease (AD) [1]. Although a specific test cut-off never was specified in the original MCI criteria [2], a cut-off of 1.5 standard deviations (SD) below reference norms is usually employed in research studies [3], whereas the DSM-5 criteria uses a span of 1–2 SD depending on premorbid factors [1]. MCI differs from dementia in that it is not severe enough to interfere with independence in daily life, but still causes a significant decline in cognitive function. Recent clinical and population-based samples suggest an MCI prevalence of 10% to 20% for adults aged 65 years and older [4–6]. In a German study [6], the weighted total prevalence of MCI (according to the DSM-5 criteria) was 20.3%, while in the Cretan Aging Cohort which comprised 3,140 persons aged ≥60 years, the prevalence of MCI was much higher (32.4%) [7]. The underlying etiology of MCI is very heterogenous, ranging from reversible causes such as depression to permanent or progressive pathological findings such as AD-related changes, cerebrovascular changes, hippocampal sclerosis, effect of trauma, metabolic diseases, etc. [8–10].
Population-based screenings for MCI has not been proven useful regarding patient management [11, 12], so in clinical practice, the physician should focus on identifying MCI among those that seek medical care due to cognitive symptoms. In primary care, early detection of objective cognitive impairment is still challenging and the diagnosis is missed in approximately 76% of the cases. Moreover, the diagnosis is often not established until these patients are at moderate to severe stages [11]. However, an early and accurate identification of cognitive impairment could ideally allow the patients to receive care, information, and treatment at an earlier stage in the disease process, which could lead to improved prognosis and decreased morbidity. Further, pending applications for disease-modifying therapies for AD at the Food and Drug Administration (FDA) seek approval specifically for the MCI stage but not the subjective cognitive decline (SCD) stage of the disease, making it even more important to differentiate these two conditions [13, 14].
Accurate detection of MCI is time-consuming and requires a comprehensive neuropsychological assessment. However, most patients are examined in primary care and therefore there is a strong need for reliable and valid brief screening instruments for the detection of MCI [15]. There are many previous studies examining the identification of MCI, but unfortunately almost all of them focus on differentiating MCI from cognitively healthy controls that do not experience any cognitive symptoms [16–18]. There is therefore a great need for studies that specifically examine cognitive tests that can differentiate between MCI and SCD to better mimic the clinical situation (dementia is per definition best identified using Activities of Daily Living scales). Further, it would be advantageous if this differentiation could be done using commonly used tests. In our recent, Pan-European survey [19], we found that the most popular tests in primary care settings still are the Mini-Mental State Examination (MMSE) [20] and the Clock Drawing Test (CDT) [21], but they lack adequate assessment of cognitive speed and executive function and may not have the adequate psychometric properties to identify MCI [22]. However, this might be improved by adding the brief test “A Quick Test of Cognitive Speed” (AQT) [23], which has gained increasing popularity in primary care and proved to be a better combination when used with the MMSE compared to using the MMSE and CDT in the diagnostic work-up of cognitive impairment [24].
In the present study, we hypothesized that the MMSE and CDT would not accurately differentiate MCI from SCD but that the addition of AQT would improve the accuracy. The aim was to examine the accuracy of the MMSE, CDT, and AQT to identify MCI in a large, consecutively included, heterogenous cohort of non-demented patients with cognitive symptoms referred to memory clinics, predominantly from primary care units.
MATERIAL AND METHODS
Population
For the present study, we included non-demented patients with cognitive symptoms from the Swedish BioFINDER Study (http://biofinder.se). The patients had been consecutively included between 2010 and 2015 at the Memory clinic at Skåne University Hospital and Ängelholm’s Hospital in Sweden for this prospective, longitudinal cohort study. All patients had been referred to the memory clinics due to subjective or objective cognitive impairment as part of routine clinical practice. These symptoms were not necessarily memory complaints, but could also be problems in one of the other five possible neurocognitive domains: complex attention, executive function, language, perceptual-motor, and social cognition. The patients were mostly referred from primary care (80.8%), but 12.5% of the referrals came from other specialist clinics and 6.7% were self-referrals. The inclusion criteria for the SCD and MCI cohort in BioFINDER were 1) age 60 to 80 years; 2) MMSE score of 24–30 points; 3) not fulfilling the criteria for dementia; 4) fluent in Swedish to the extent that an interpreter was not necessary to fully understand the study information or to take part in the neuropsychological assessment. The exclusion criteria were 1) significant unstable systemic illness or organ failure that made it difficult to participate in the study; 2) current significant alcohol or substance misuse; 3) refusing lumbar puncture or neuropsychological assessment; 4) cognitive impairment at baseline visit that with certainty could be explained by another condition or disease such as normal pressure hydrocephalus, major cerebral hemorrhage, brain tumor, etc. For the present study, we included all participants from the MCI and SCD cohort with data on MMSE, CDT, AQT, level of education, and MCI/SCD classification.
The study was approved by the ethical review board in Lund, Sweden, and all participants gave their written informed consent.
MCI classification
The classification of MCI was based on the results of a comprehensive neuropsychological test-battery and the clinical assessment of a senior neuropsychologist (SV). In borderline cases, a consensus decision was made together with two physicians. The neuropsychological test-battery assessed four cognitive domains: 1) Verbal ability (a multiple-choice vocabulary test, SRB:1, and Category Fluency Condition 2, Delis-Kaplan Executive Function System, D-KEFS) [25, 26]; 2) Episodic memory (Rey Auditory Verbal Learning Test (RAVLT) delayed recall [27] and Rey Complex Figure Test (RCFT) delayed recall) [28]; 3) Visuospatial ability (Block design, WAIS [29] and the copy trial of RCFT) [28]; 4) Attention and Executive functions (the Trail Making Test, Number-Letter Switching, Condition 4 and Verbal Fluency Condition 1, both from D-KEFS) [25]. The test score from each test was compared with published age-scaled normative data and converted to a normative score. The mean z-score from the two tests of each cognitive domain constituted a composite cognitive domain score. Patients with domain z-scores of ≤–1.5 in at least one domain were classified as MCI. In agreement with the DSM-5 criteria for mild neurocognitive disorders, all subjects with composite scores of –1 to –1.5 were individually assessed by the neuropsychologist and classified as MCI if the performance was assessed to represent a significant cognitive decline in comparison with their estimated premorbid level. The MCI classification was then subtyped as amnestic single domain, amnestic multi-domain, non-amnestic single-domain, or non-amnestic multi-domain. All patients with cognitive complaints who did not fulfil the criteria for MCI were classified as having SCD, in agreement with the proposed SCD criteria (that also includes “medical help seeking” which was present for all participants in the present study) [30].
The brief cognitive tests
Mini-mental state examination
The MMSE is a cognitive test that examines five areas of cognitive function: orientation, registration, attention and calculation, word recall, and language. The maximum score is 30 [20]. In the present study, the Swedish standardized revision was used (MMSE-SR), which has shown a very high inter-rater reliability (kappa of 0.95) [31].
Clock drawing test
The CDT, widely acknowledged for its simplicity and ease of administration, is a measure used to detect cognitive decline associated with a variety of neurobehavioral disorders [21]. Moreover, the CDT requires different cognitive abilities including visuospatial function, abstract conceptualization, executive control, concentration and auditory and visual comprehension [32]. The CDT can be performed in different ways and the scoring also varies. In the present study, the subject was presented with a paper with the instructions to draw a clock and set the time to 10 past 11. The clock drawings were then scored according to the Schulman method with scores from 0 (poor) to 5 (best) [21], since this method has provided among the best diagnostic accuracies compared to other scoring methods for identifying cognitive impairment or AD [33–36].
A quick test of cognitive speed
AQT consists of three separate naming tasks. The test is time-based and consists of a task in which color and shape of 40 geometric figures should be named. Of these, color naming (e.g., red) and form naming (e.g., circle) provide single dimension naming measures that account primarily for reaction, retrieval, and response time. The third, color–form combination naming (e.g., red circle), measures reaction, retrieval, and response time as well as time for co-articulation and shifting cognitive set (alternating between naming colors and forms) [37]. The color-form part of the test was used in the present study. AQT has been validated and translated in several languages, including English, Swedish, Italian, Spanish, Arabic, Greek, and Korean [38].
Statistics
Group differences were calculated using Mann-Whitney (the three cognitive screening tests and education), T-test (age) or χ2 test (binary variables). Receiver operating characteristic (ROC) statistics with classification (SCD or MCI) as outcome were used to calculate sensitivities and specificities for the MMSE, AQT color-form, and CDT. To test the robustness of the accuracies and cut-offs, we divided the population in training and validation samples as well as performed repeated 10-fold cross-validations of the logistic regression models. The training and validation samples were randomly sampled, allocating 70% of the total population to the training sample and 30% to the validation sample. In the training sample, we started determining the cut-offs for the single tests MMSE, CDT, and AQT color-form according to the best Youden’s index (sensitivity + specificity –1). We then tested all combinations of cut-offs for 1) MMSE and AQT; 2) MMSE and CDT; 3) CDT and AQT; and 4) MMSE, AQT, and CDT, to the determined which combination of cut-offs resulted in the highest Youden indices. The optimized cut-offs were then applied to the training sample. Diagnosis (MCI or SCD) was also predicted using logistic regression models where MMSE, CDT, and AQT scores were adjusted for age and years of education in the whole population. We also performed secondary analyses where we adjusted for age as an exponential term as well as the interaction between age and education. Differences between areas under the ROC curves (AUCs) were examined using De Long statistics [39]. Models were also examined using the Akaike information criterion (AIC), where a drop of more than 2 suggests an improved model fit when adding an additional test. Internal-cross-validation was carried out using repeated 10-fold cross-validation where the entire population was dived in 10 sample of equal size. The logistic regression models were trained in 9 datasets (90% of the population) and tested/validated in 1 (10% of the population). This process was repeated 10 times so that each of the 10 samples had been a test sample. Then, this entire 10-fold process was iterated 5 times (with new, randomly selected datasets) to obtain a mean AUC and accuracy (% correctly classified cases) from the 5×10 analyses derived from datasets separate from the ones where the model estimates were developed. The data were analyzed in SPSS Statistics version 22 (IBM, Armonk, NY, US), in MedCalc Statistical Software version 14.10.2 (MedCalc Software, Ostend, Belgium; http://www.medcalc.org; 2014) and in R version 3.4.4 (The R Foundation for Statistical Computing).
RESULTS
Demographics
Figure 1 shows the enrolment process and Table 1 the characteristics of the BioFINDER cohort stratified by classification (SCD or MCI). Compared to the SCD group, the MCI group consisted of significantly more women, performed poorer on all brief cognitive tests, and had a higher prevalence of ischemic heart disease and APOE ɛ4 carriers. Characteristics of the randomly grouped training and validation samples (for testing the robustness of cut-offs) are shown in Supplementary Table 1. The only significant difference between the training and validation sample was a slightly increased mean AQT score in the training sample (83.6 s, SD 28.4 s) compared to the validation sample (79.0 s, SD 26.7 s; p = 0.038).
Fig.1
Enrollment process. The eligible population was defined as those who met the inclusion criteria (see Methods). Participation in other studies was not an exclusion criterion, but because of multiple investigations at the same time, some patients could not be included in the present study. “Any missing data” was defined as missing data for MMSE, CDT, AQT, SCD/MCI classification, or years of education.
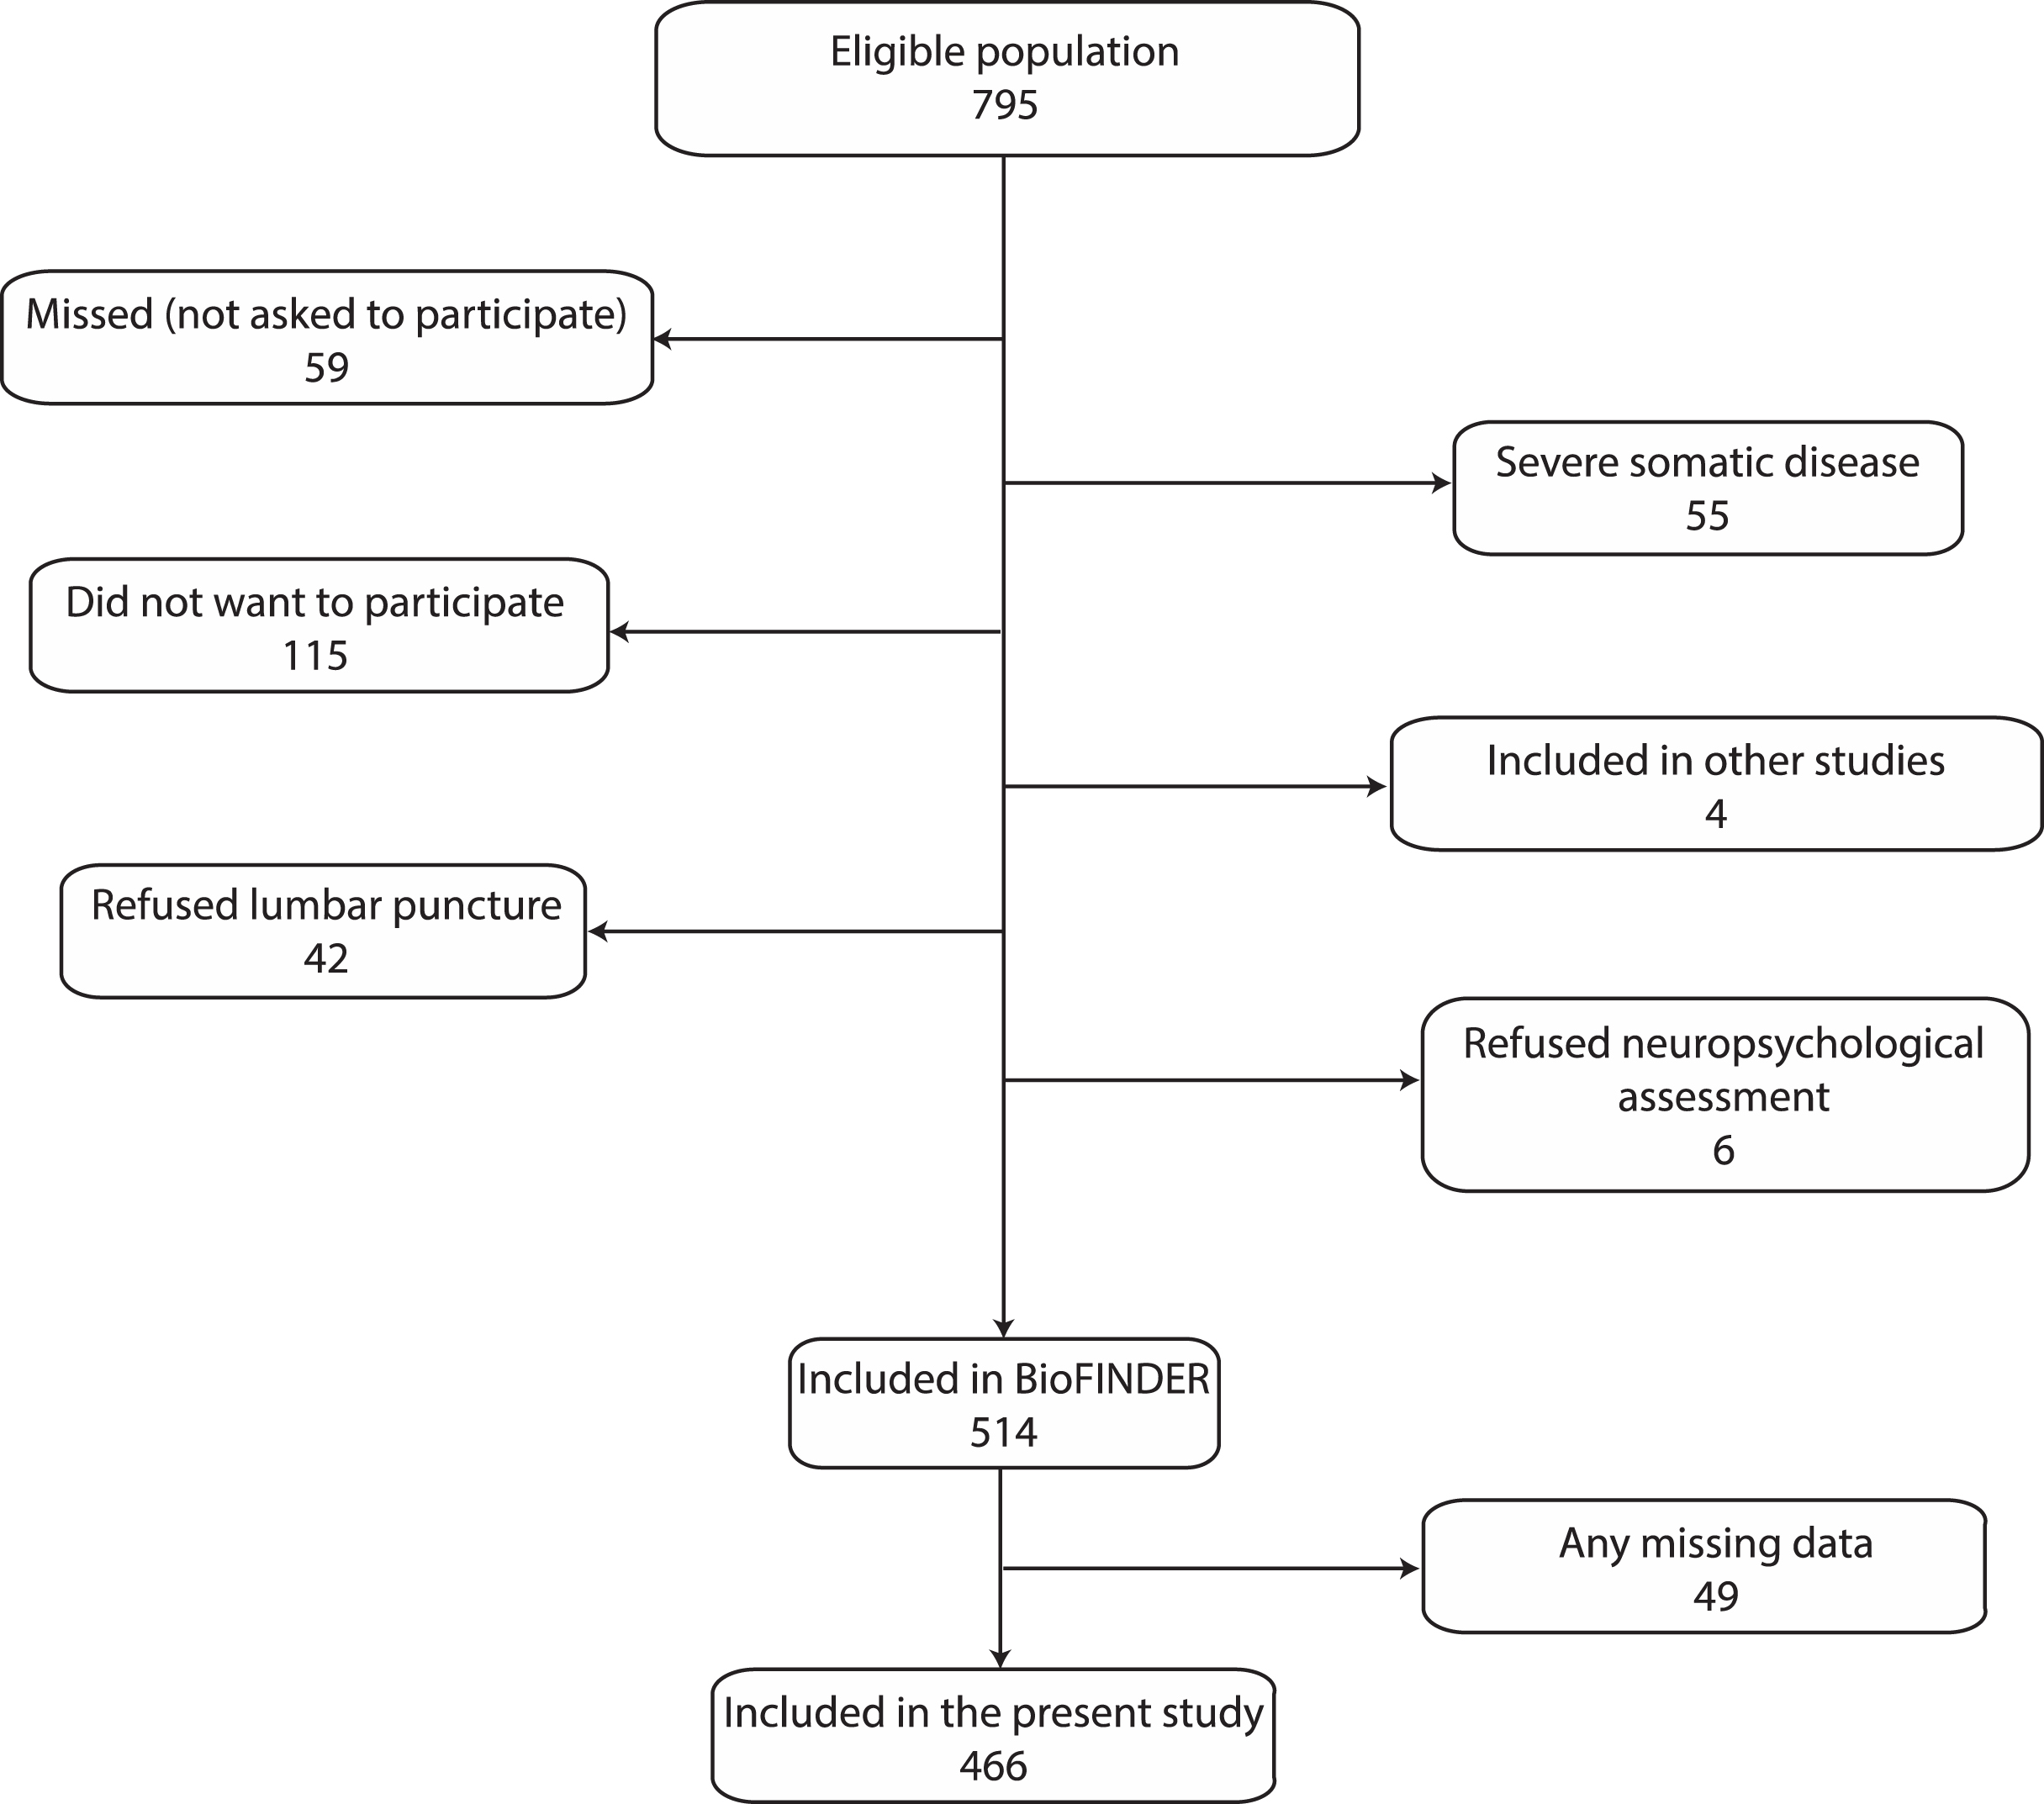
Table 1
Characteristics of the SCD and MCI groups
| Characteristic | SCD | MCI | p |
| N | 208 | 258 | |
| Age mean, y | 70.0 (5.7) | 71.0 (5.4) | 0.061 |
| Female sex, N (%) | 109 (52.4) | 104 (40.3) | 0.009 |
| Education, y | 12.5 (3.5) | 11.1 (3.2) | 0.001 |
| Stroke, n (%)) | 26 (12.5%) | 38 (14.7%) | 0.487 |
| Hypertension, n (%) | 62 (29.8%) | 84 (32.6%) | 0.525 |
| Diabetes (n (%)) | 17 (8.2%) | 26 (10.1%) | 0.522 |
| Ischemic heart disease (n (%)) | 19 (9.1%) | 45 (17.5%) | 0.010 |
| Atrial fibrillation (n (%)) | 14 (6.7%) | 15 (5.8%) | 0.704 |
| Congestive heart failure (n (%)) | 3 (1.4%) | 3 (1.2%) | 1.000 |
| Hyperlipemia (n (%)) | 25 (12.5%) | 21 (8.2%) | 0.211 |
| APOE ɛ4 carrier (n (%)) | 78 (37.5%) | 131 (50.8%) | 0.002 |
| MMSE, points | 28.5 (1.4) | 27.0 (1.8) | <0.001 |
| AQT | 74.1 (20.4) | 88.8 (31.3) | <0.001 |
| CDT | 4.5 (0.9) | 4.0 (1.1) | <0.001 |
| MCI subtype | |||
| Amnestic MCI single domain | N/A | 107 (41.5%) | |
| Amnestic MCI multidomain | N/A | 84 (32.6%) | |
| Non-amnestic MCI single domain | N/A | 47 (18.2%) | |
| Non-amnestic MCI multidomain | N/A | 19 (7.4%) | |
| MCI not subclassified | N/A | 1 (0.4%) |
Data are in mean (standard deviation) if not otherwise specified. SCD, subjective cognitive decline; MCI, mild cognitive impairment; n, number of patients; N/A, not applicable; MMSE, Mini-Mental State Examination; AQT, A Quick Test of Cognitive Speed; CDT, Clock Drawing Test.
Detection of MCI using cross-validated cut-offs
First, sensitivities and specificities at the highest Youden index were established in the training sample (n = 326) for single and combinations of cognitive tests (AQT, MMSE, and CDT). Then, the cut-offs were tested in the validation sample (n = 140). Finally, optimized logistic regression models adjusted for age and education were tested in the whole population to examine the potential diagnostic accuracy of the tests.
In the training sample, the best single test was the MMSE, which at the optimal cut-off of <28 p had a sensitivity of 59% and a specificity of 79% (Table 2). AQT and CDT had lower sensitivities at their optimal cut-offs, 55% and 34%, respectively, and approximately similar specificities. When testing the optimal combination of cognitive test cut-offs, MMSE < 27 p or AQT > 91 s performed better than any combination of MMSE and CDT. No clear improvement was seen when adding the CDT to MMSE and AQT (Table 2).
Table 2
ROC analysis for identifying MCI using MMSE, CDT, and AQT in the training and validation samples
| Total number of tests | Training sample (n = 326) | Validation sample (n = 140) | |||||
| Cut-off* | Sensitivity (%) | Specificity (%) | Youden index | Sensitivity (%) | Specificity (%) | Youden index | |
| 1 | MMSE < 28 | 59.1 | 79.3 | 0.38 | 72.7 | 60.3 | 0.33 |
| 1 | AQT > 83 s | 54.7 | 73.8 | 0.28 | 68.8 | 49.2 | 0.18 |
| 1 | CDT < 4 p | 33.7 | 85.5 | 0.19 | 35.1 | 85.7 | 0.21 |
| 2 | MMSE < 28 AND AQT > 52 | 58.0 | 80.7 | 0.39 | 40.3 | 87.3 | 0.28 |
| 2 | MMSE < 27 OR AQT > 91 | 65.8 | 79.3 | 0.45 | 55.8 | 77.8 | 0.34 |
| 2 | MMSE < 30 AND CDT < 5 | 48.6 | 75.2 | 0.24 | 42.9 | 82.5 | 0.25 |
| 2 | MMSE < 28 OR CDT < 4 | 69.6 | 70.3 | 0.40 | 63.6 | 68.2 | 0.32 |
| 3 | MMSE < 27 OR AQT > 91 OR CDT < 2 | 66.3 | 79.3 | 0.46 | 57.1 | 77.8 | 0.35 |
*Cut-offs were established in the training sample according to the highest Youden index and tested in the validation sample. MMSE, Mini-Mental State Examination; AQT, A Quick Test of Cognitive Speed; CDT, Clock Drawing Test.
When applying the cut-offs on the validation sample, all accuracies were lower than in the training sample, except for the CDT which had a marginally higher sensitivity (35%) and specificity (86%) (Table 2). Similar Youden indices (sensitivity + specificity –1) were seen for the best single and combination of tests in the validation sample (MMSE, 0.33; MMSE < 27 or AQT > 91, 0.34; MMSE < 27 or AQT > 91 or CDT < 2, 0.35).
Logistic regression models for identifying MCI
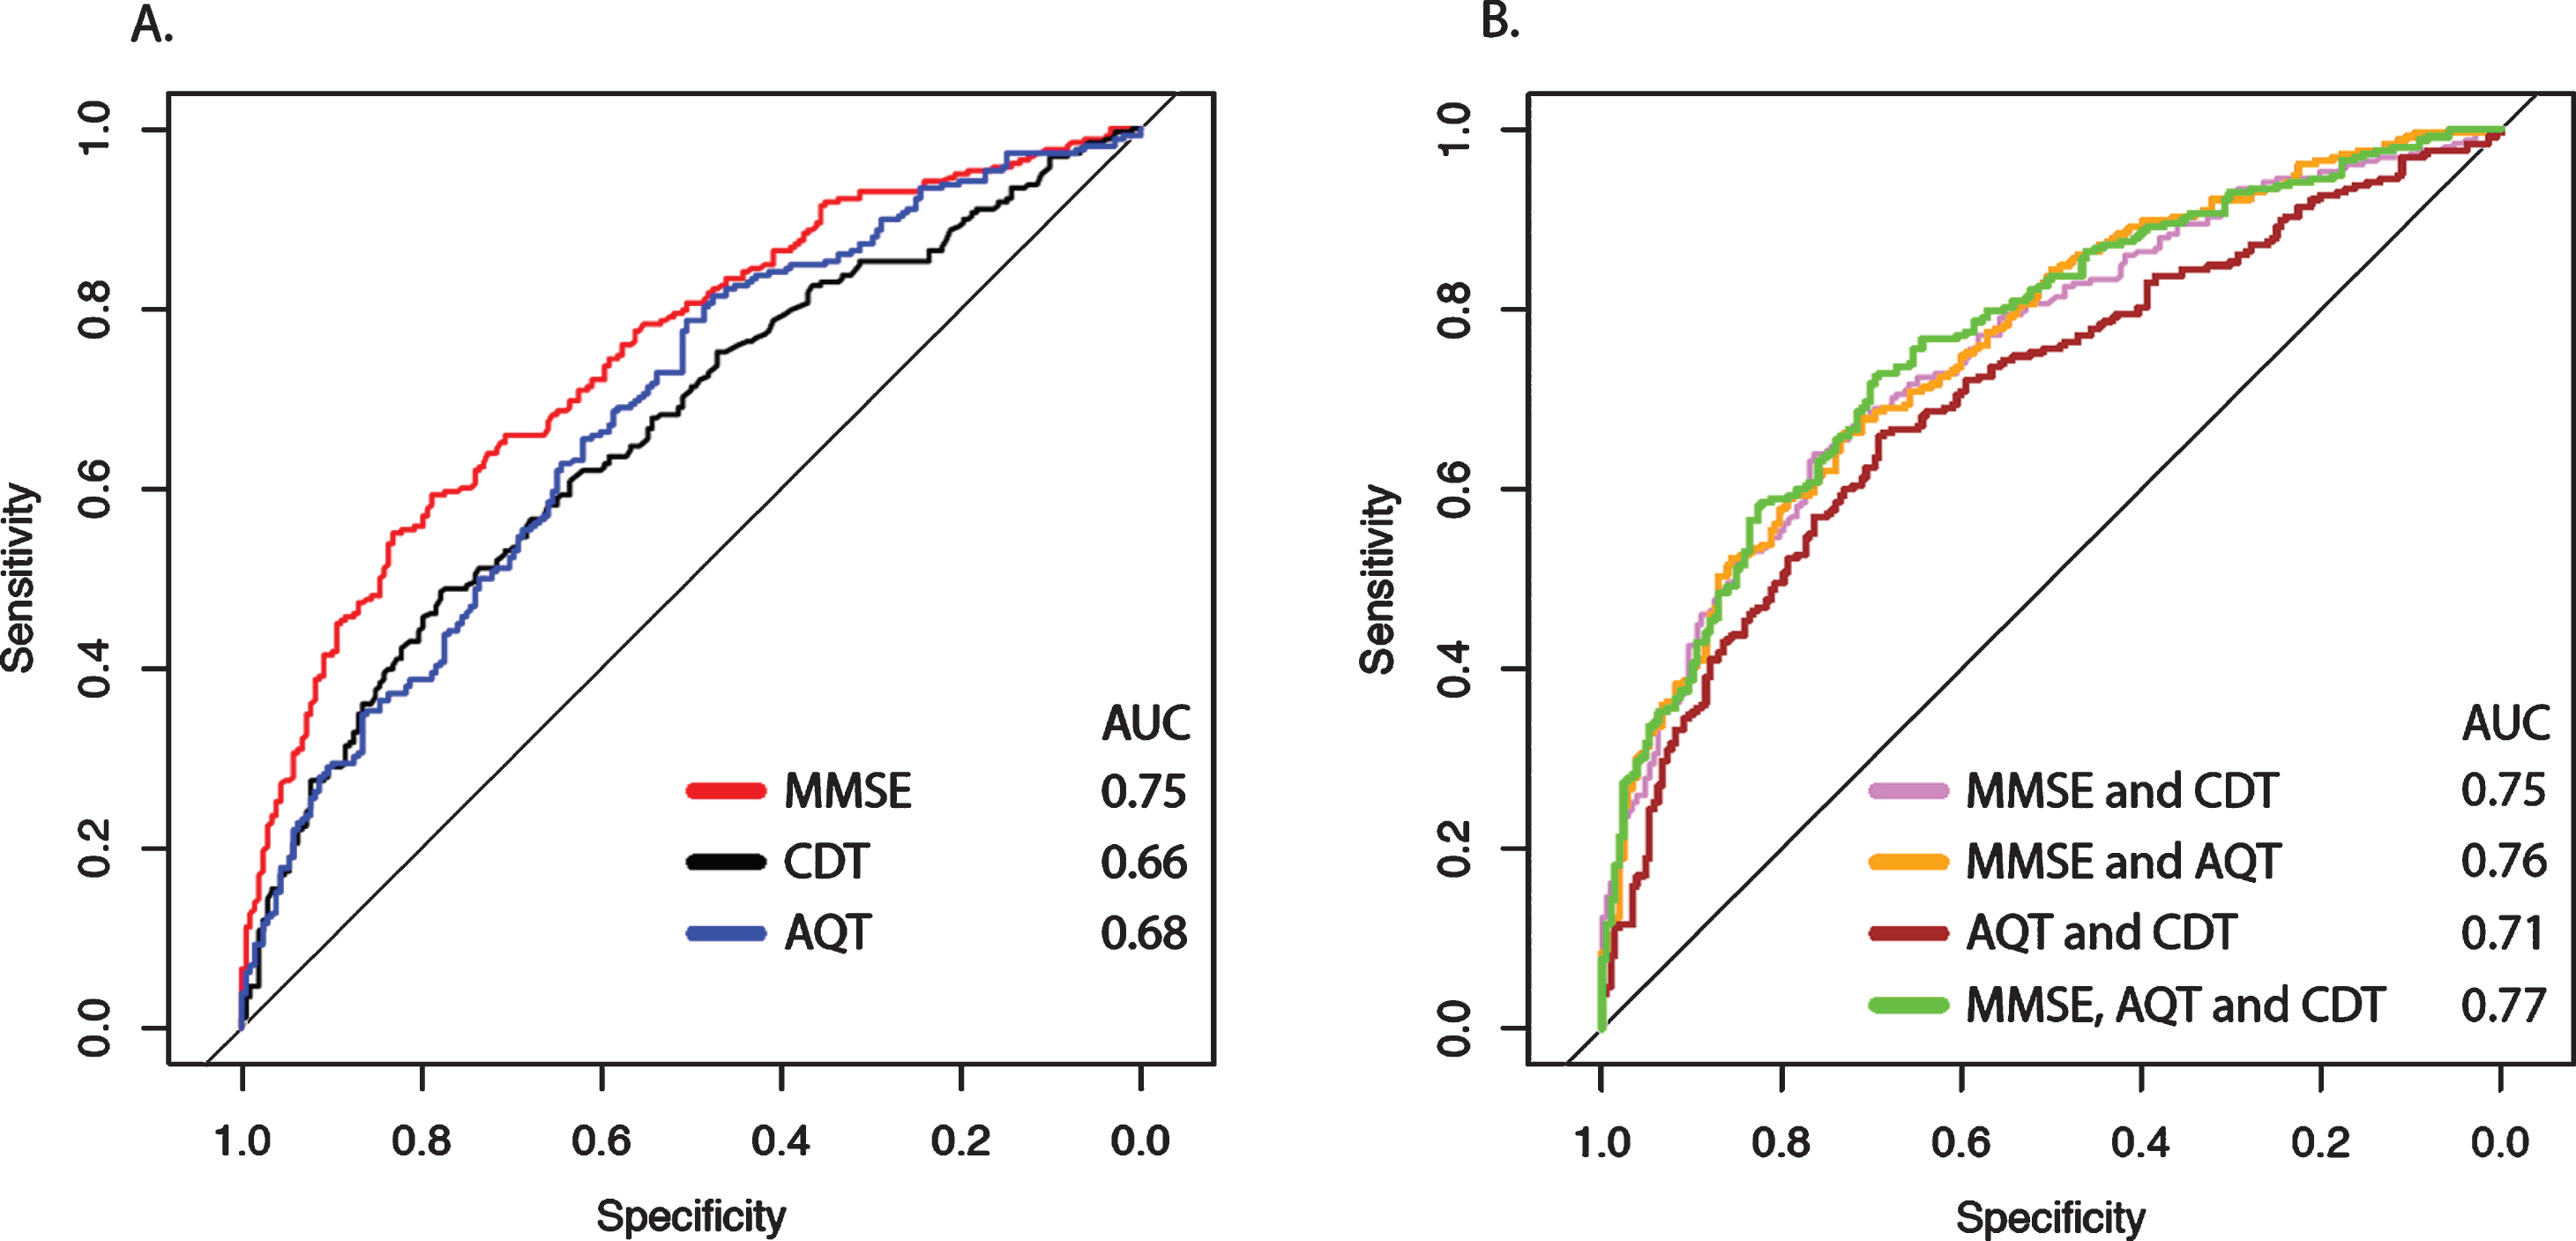
To further test the potential diagnostic value of the different cognitive tests (and combinations of them), they were examined in logistic regression models adjusted for age and education. Using single tests and different combination of tests, 62–71% of the patients were classified correctly (Table 3). Overall, the Youden indices for the optimized model cut-offs were similar compared to the previous approach of “manually” identifying the best combination of cut-offs in the training sample without adjusting for age and education. The ROC curves with corresponding sensitivities and specificities for the cognitive tests are shown in Fig. 2A and 2B. When comparing the different AUCs of the single test models (Table 3), MMSE (AUC 0.75) performed better than AQT (AUC 0.68; p < 0.01) and CDT (AUC 0.66; p < 0.001). No significant improvement was seen when adding AQT or CDT to the MMSE (AUC Δ 0.00 to 0.01; p > 0.1) and no significant differences were found between any combination of tests, except that AQT and CDT performed significantly worse than the other test combinations. The highest accuracy was found for the model that included MMSE, CDT, and AQT (70.8% correctly classified; AUC 0.77, AIC 545), but the AIC suggested overfitting compared with MMSE and AQT (69.1% correctly classified; AUC 0.76, AIC 547). There was a positive interaction between age and education in all models (p = 0.02–0.048), except for the model including only AQT. However, the AUCs of the models with the interaction term had similar AUCs compared with the main effect models (Δ AUC <0.01) and no significant differences were found. We also included age as an exponential term, but it was not significant in any of the models.
Table 3
Detection of MCI in the total population using logistic regressions models
| Predictors | AUC (95% CI) | AIC | Accuracy | Sensitivity | Specificity | Youden index |
| MMSE | 0.75 (0.70–0.79)1,2 | 557 | 66.5% | 55.0% | 83.2% | 0.38 |
| CDT | 0.66 (0.61–0.71) | 609 | 61.6% | 48.4% | 77.9% | 0.26 |
| AQT | 0.68 (0.63–0.73) | 600 | 63.7% | 78.7% | 50.5% | 0.29 |
| MMSE and CDT | 0.75 (0.71–0.80)4,5,7 | 552 | 69.1% | 64.0% | 76.4% | 0.40 |
| MMSE and AQT | 0.76 (0.72–0.80)4,6,8 | 547 | 68.5% | 66.2% | 73.1% | 0.39 |
| AQT and CDT | 0.71 (0.66–0.75)1 | 590 | 65.8% | 65.9% | 69.2% | 0.35 |
| MMSE, CDT and AQT | 0.77 (0.72–0.81)3,4,6,9 | 545 | 70.8% | 72.5% | 69.7% | 0.42 |
All models were adjusted for age and education. Neither age nor education were significant in any of the models except for the single cognitive test models with CDT and AQT, respectively. AIC shows the model fit in relation to the number of predictors in the model, where a decrease in ΔAIC of < –2 equals a significant better model fit (the addition of an extra cognitive test is thus justified if the AIC drops by >2). Accuracy was defined as % correctly classified cases (MCI or SCD) using a probability cut-off of 0.5. Sensitivity and specificity are shown for the probability cut-off (probability output from the logistic regression model) that provides the highest Youden index (sensitivity + specificity –1). 1p < 0.01 compared to CDT; 2p < 0.05 compared to AQT; 3p < 0.05 compared to MMSE; 4p < 0.001 compared to CDT; 5p < 0.01 compared to AQT; 6p < 0.001 compared to AQT; 7p < 0.05 compared to AQT and CDT; 8p < 0.01 compared to AQT and CDT; 9p < 0.001 compared to AQT and CDT. AIC, Akaike Information Criterion; AUC, Area under the Curve; MMSE, Mini-Mental State Examination; AQT, A Quick Test of Cognitive Speed; CDT, Clock Drawing Test.
Fig.2
ROC curves from logistic regression models for identifying MCI. A shows the ROC curves of the individual cognitive tests adjusted for age and education in logistic regression models with classification (SCD or MCI) as outcome variable. B shows the different combinations of tests, also adjusted for age and education. See Table 3 for more details. AUC, Area under the Curve; MMSE, Mini-Mental State Examination; AQT, A Quick Test of Cognitive Speed; CDT, Clock Drawing Test.
To assess the robustness of the models, a 10-fold cross-validation approach was applied. Here, the mean accuracies were overall slightly lower than when optimizing them for the whole population (61–70%; Supplementary Table 2).
DISCUSSION
In this study, we examined the accuracy of the two most commonly used brief cognitive tests (MMSE and clock drawing test) and a sensitive test of attention and executive function (AQT) for identifying MCI in consecutively included patients seeking medical care due to cognitive symptoms (n = 466). Despite analyzing single tests, optimal combination of tests and multivariable models adjusted for age and education, none of them could differentiate MCI from SCD with adequately high accuracy (a sensitivity and specificity of >80% is usually suggested) [11, 40, 41].
To the best of our knowledge, only one previous study has examined the accuracy of either MMSE, CDT, or AQT for identifying MCI and differentiating it from SCD [42]. In that study, 32 elderly with subjective memory complaints and 74 with MCI were recruited from community centers for the elderly. At <29 points, the MMSE had a sensitivity of 64% and a specificity 79%, and the CDT did not differ between the groups. Other available studies have instead examined how the tests can differentiate MCI from cognitively healthy controls. A large meta-analysis of 47 studies and 17,749 participants showed that the MMSE had a sensitivity of 66% (95% CI 61–72%) and a specificity of 74% (95% CI 69–78%), similar to the present study [16]. The same review, showed that the CDT at standard cut-offs had a fairly high (>80%) specificity for MCI, but the corresponding sensitivities were unacceptably low (30–65%) [16]. Other reviews have found similar poor accuracies for the CDT [17]. Only one previous study has examined AQT and found no difference between MCI and controls. [43]
In our opinion, the comparison between MCI and cognitively healthy controls does not warrant clinically relevant diagnostic accuracies. In a clinical situation, where a patient seeks medical help due to cognitive symptoms, the physician needs to be able to differentiate MCI from the more benign condition SCD. Although SCD can be a very early sign of a neurodegenerative disorder, the annual progression rate from SCD to MCI is only 6–7% [44–47], and in community-based populations, the incidence of AD is not significantly higher in SCD compared to healthy controls [48]. On the other hand, for MCI, the annual conversion rate to AD dementia range from 7.5% to 16.5% in clinic-based studies, and from 5.4% to 11.5% in community-based samples [49].
In the present study we used multiple approaches to examine the accuracy and potentially clinical applicability of the tests. When testing the optimal cut-offs from the training sample (n = 326) in the validation sample (n = 140) to examine their potential generalizability, all single and combinations of tests had 5–10% lower combined sensitivity and specificity (except for the CDT; Table 2). The best combination of all three tests had no higher accuracy than a sensitivity of 57% and a specificity of 78% (Youden index: 0.35) and the combination of just MMSE and AQT performed similarly (Table 2). When we instead ran optimized logistic regression models adjusted for age and education in the whole population, the accuracy was slightly higher (Table 3). As for the combination of tests, AQT and CDT performed worse, but otherwise there were no significant differences between the AUCs (Table 3). When instead comparing the model fits, it was more or less a dead race between MMSE and AQT (AIC 547) and MMSE, AQT, and CDT (AIC 545). Despite previous findings that this combination of tests has been favored for screening for dementia, it is difficult to justify the use of CDT in practical settings in addition to MMSE and AQT in order to identify MCI [50]. Ways that could improve the accuracy of these tests, especially the MMSE, include applying item response theory and taking into account the continuum that exists between healthy and cognitively impaired which is not accounted for using ROC analysis [51] or examining changes in the tests related to the time-course of the underlying disease. [52] By applying Modern Test Theory and Gompertz Law [53] preferably implemented in computerized testing, future studies may improve the use of tests such as the MMSE.
A limitation of our study was the inclusion criteria of MMSE scores from 24 to 30 points. Given the high specificity for dementia at this cutoff [54], it is unlikely that it had any important effect on the inclusion of MCI and SCD participants and hence the present results. Nonetheless, we acknowledge that this criterion may potentially have affected the accuracy of the MMSE to identify MCI. Strengths of the present study include the comprehensive neuropsychological battery used to classify MCI, the large population of consecutively included patients with cognitive symptoms. Future studies should extend the analysis to include unselected primary care populations and include newer and more sensitive cognitive tests.
During the recent one to two decades there have been many breakthroughs in AD and dementia diagnostics with CSF analysis of amyloid-β, tau, and neurofilament light, amyloid-β PET, tau PET, and regional atrophy measures from MRI and FDG-PET. However, these diagnostic tools are only available in specialist settings, while primary care still uses the same diagnostic tools as in the late 1970s when the combination of MMSE and CDT was introduced. Our findings as well as other studies show that more novel tests need to replace the MMSE and CDT as the standard screening tests for MCI, especially in primary care [55]. Such newer promising tests should preferably be freely available and may include the Montreal Cognitive Assessment [16, 19, 56], the Memory Alteration Test [57], and sensitive computerized tests [58–60]. Given the possible breakthrough in disease-modifying treatments, where the indication probably will cover MCI and mild dementia but not SCD [14, 61], there is now a great need to focus on improving the diagnostic work-up for identifying MCI.
ACKNOWLEDGMENTS
Work at the authors’ research center was supported by the European Research Council, the Swedish Research Council, the Knut and Alice Wallenberg foundation, the Marianne and Marcus Wallenberg foundation, the Strategic Research Area MultiPark (Multidisciplinary Research in Parkinson’s disease) at Lund University, the Swedish Alzheimer Association, the Swedish Brain Foundation, The Parkinson foundation of Sweden, The Parkinson Research Foundation, the Skåne University Hospital Foundation, and the Swedish federal government under the ALF agreement.
Authors’ disclosures available online (https://www.j-alz.com/manuscript-disclosures/19-1191r1).
SUPPLEMENTARY MATERIAL
[1] The supplementary material is available in the electronic version of this article: https://dx.doi.org/10.3233/JAD-191191.
REFERENCES
[1] | American Psychiatric Association ((2013) ) Diagnostic and statistical manual of mental disorders, Arlington, VA. |
[2] | Petersen RC , Smith GE , Waring SC , Ivnik RJ , Tangalos EG , Kokmen E ((1999) ) Mild cognitive impairment: Clinical characterization and outcome. Arch Neurol 56: , 303–308. |
[3] | Petersen RC ((2004) ) Mild cognitive impairment as a diagnostic entity. J Intern Med 256: , 183–194. |
[4] | Langa KM , Levine DA ((2014) ) The diagnosis and management of mild cognitive impairment: A clinical review. JAMA 312: , 2551–2561. |
[5] | Kaduszkiewicz H , Eisele M , Wiese B , Prokein J , Luppa M , Luck T , Jessen F , Bickel H , Mösch E , Pentzek M ((2014) ) Prognosis of mild cognitive impairment in general practice: Results of the German AgeCoDe study. Ann Fam Med 12: , 158–165. |
[6] | Luck T , Then FS , Schroeter ML , Witte V , Engel C , Loeffler M , Thiery J , Villringer A , Riedel-Heller SG ((2017) ) Prevalence of DSM-5 mild neurocognitive disorder in dementia-free older adults: Results of the population-based LIFE-Adult-Study. Am J Geriatr Psychiatry 25: , 328–339. |
[7] | Zaganas IV , Simos P , Basta M , Kapetanaki S , Panagiotakis S , Koutentaki I , Fountoulakis N , Bertsias A , Duijker G , Tziraki C , Scarmeas N , Plaitakis A , Boumpas D , Lionis C , Vgontzas AN ((2019) ) The Cretan Aging Cohort: Cohort description and burden of dementia and mild cognitive impairment. Am J Alzheimers Dis Other Demen 34: , 23–33. |
[8] | Saito Y , Murayama S ((2007) ) Neuropathology of mild cognitive impairment. Neuropathology 27: , 578–584. |
[9] | Schneider JA , Arvanitakis Z , Leurgans SE , Bennett DA ((2009) ) The neuropathology of probable Alzheimer disease and mild cognitive impairment. Ann Neurol 66: , 200–208. |
[10] | Bennett DA ((2001) ) How can I deal with missing data in my study? Aust N Z J Public Health 25: , 464–469. |
[11] | Lin JS , O’Connor E , Rossom RC , Perdue LA , Eckstrom E ((2013) ) Screening for cognitive impairment in older adults: A systematic review for the U.S. Preventive Services Task Force. Ann Intern Med 159: , 601–612. |
[12] | Moyer VA , U.S. Preventive Services Task Force ((2014) ) Screening for cognitive impairment in older adults: U.S. Preventive Services Task Force recommendation statement. Ann Intern Med 160: , 791–797. |
[13] | Abbott A ((2019) ) Fresh push for ‘failed’ Alzheimer’s drug. Nature, doi: 10.1038/d41586-019-03261-5. |
[14] | Biogen, Biogen Plans Regulatory Filing for Aducanumab in Alzheimer’s Disease Based on New Analysis of Larger Dataset from Phase 3 Studies, https://investors.biogen.com/news-releases/news-release-details/biogen-plans-regulatory-filing-aducanumab-alzheimers-disease, Accessed November 11, 2019. |
[15] | Ehreke L , Luck T , Luppa M , Konig HH , Villringer A , Riedel-Heller SG ((2011) ) Clock drawing test - screening utility for mild cognitive impairment according to different scoring systems: Results of the Leipzig Longitudinal Study of the Aged (LEILA 75+). Int Psychogeriatr 23: , 1592–1601. |
[16] | Breton A , Casey D , Arnaoutoglou NA ((2019) ) Cognitive tests for the detection of mild cognitive impairment (MCI), the prodromal stage of dementia: Meta-analysis of diagnostic accuracy studies. Int J Geriatr Psychiatry 34: , 233–242. |
[17] | Ehreke L , Luppa M , Konig HH , Riedel-Heller SG ((2010) ) Is the Clock Drawing Test a screening tool for the diagnosis of mild cognitive impairment? A systematic review. Int Psychogeriatr 22: , 56–63. |
[18] | Tsoi KKF , Chan JYC , Hirai HW , Wong A , Mok VCT , Lam LCW , Kwok TCY , Wong SYS ((2017) ) Recall tests are effective to detect mild cognitive impairment: A systematic review and meta-analysis of 108 diagnostic studies. J Am Med Dir Assoc 18: , 807.e17–807.e29. |
[19] | Petrazzuoli F , Vinker S , Koskela TH , Frese T , Buono N , Soler JK , Ahrensberg J , Asenova R , Foguet Boreu Q , Ceyhun Peker G , Collins C , Hanzevacki M , Hoffmann K , Iftode C , Kurpas D , Le Reste JY , Lichtwarck B , Petek D , Pinto D , Schrans D , Streit S , Tang EYH , Tatsioni A , Torzsa P , Unalan PC , van Marwijk H , Thulesius H ((2017) ) Exploring dementia management attitudes in primary care: A key informant survey to primary care physicians in 25 European countries. Int Psychogeriatr 29: , 1413–1423. |
[20] | Folstein MF , Folstein SE , McHugh PR ((1975) ) “Mini-mental state”. A practical method for grading the cognitive state of patients for the clinician. J Psychiatr Res 12: , 189–198. |
[21] | Shulman KI ((2000) ) Clock-drawing: Is it the ideal cognitive screening test? Int J Geriatr Psychiatry 15: , 548–561. |
[22] | Cullen B , O’Neill B , Evans JJ , Coen RF , Lawlor BA ((2007) ) A review of screening tests for cognitive impairment. J Neurol Neurosurg Psychiatry 78: , 790–799. |
[23] | Palmqvist S , Minthon L , Wattmo C , Londos E , Hansson O ((2010) ) A Quick Test of cognitive speed is sensitive in detecting early treatment response in Alzheimer’s disease. Alzheimers Res Ther 2: , 29. |
[24] | Kvitting AS , Wimo A , Johansson MM , Marcusson J ((2013) ) A quick test of cognitive speed (AQT): Usefulness in dementia evaluations in primary care. Scand J Prim Health Care 31: , 13–19. |
[25] | Delis DC , Kaplan E , Kramer JH ((2001) ) Delis-Kaplan Executive function system: Examiners manual, Psychological Corporation. |
[26] | Nilsson L-G , Bäckman L , Erngrund K , Nyberg L , Adolfsson R , Bucht G , Karlsson S , Widing M , Winblad B ((1997) ) The Betula prospective cohort study: Memory, health, and aging. Aging Neuropsychol Cogn 4: , 1–32. |
[27] | Strauss E , Sherman EM , Spreen O ((2006) ), A compendium of neuropsychological tests: Administration, norms, and commentary, American Chemical Society. |
[28] | Meyers JE , Meyers KR ((1995) ) Rey Complex Figure Test and recognition trial professional manual, Psychological Assessment Resources. |
[29] | Wechsler D ((2008) ) Wechsler Adult Intelligence Scale–Fourth Edition (WAIS–IV), The Psychological Corporation, San Antonio, TX. |
[30] | Jessen F , Amariglio RE , Buckley RF , van der Flier WM , Han Y , Molinuevo JL , Rabin L , Rentz DM , Rodriguez-Gomez O , Saykin AJ , Sikkes SAM , Smart CM , Wolfsgruber S , Wagner M ((2020) ) The characterisation of subjective cognitive decline. Lancet Neurol 19: , 271–278. |
[31] | Palmqvist S ((2011) ) Validation of brief cognitive tests in mild cognitive impairment, Alzheimer’s disease and dementia with Lewy bodies, Clinical Memory Research Unit, Lund University. |
[32] | Wang P , Shi L , Zhao Q , Hong Z , Guo Q ((2014) ) Longitudinal changes in clock drawing test (CDT) performance before and after cognitive decline. PLoS One 9: , e97873. |
[33] | Brodaty H , Moore CM ((1997) ) The Clock Drawing Test for dementia of the Alzheimer’s type: A comparison of three scoring methods in a memory disorders clinic. Int J Geriatr Psychiatry 12: , 619–627. |
[34] | Storey JE , Rowland JT , Basic D , Conforti DA ((2001) ) A comparison of five clock scoring methods using ROC (receiver operating characteristic) curve analysis. Int J Geriatr Psychiatry 16: , 394–399. |
[35] | Schramm U , Berger G , Muller R , Kratzsch T , Peters J , Frolich L ((2002) ) Psychometric properties of Clock Drawing Test and MMSE or Short Performance Test (SKT) in dementia screening in a memory clinic population. Int J Geriatr Psychiatry 17: , 254–260. |
[36] | van der Burg M , Bouwen A , Stessens J , Ylieff M , Fontaine O , de Lepeleire J , Buntinx F ((2004) ) Scoring clock tests for dementia screening: A comparison of two scoring methods. Int J Geriatr Psychiatry 19: , 685–689. |
[37] | Wiig EH , Nielsen NP , Minthon L , Warkentin S ((2002) ) A Quick Test of Cognitive Speed (AQT). Pearson/PsychCorp, San Antonio, TX. |
[38] | Petrazzuoli F , Palmqvist S , Thulesius H , Buono N , Pirrotta E , Cuffari A , Cambielli M , D’Urso M , Farinaro C , Chiumeo F , Marsala V , Wiig EH ((2014) ) A Quick Test of Cognitive Speed: Norm-referenced criteria for 121 Italian adults aged 45 to 90 years. Int Psychogeriatr 26: , 1493–1500. |
[39] | DeLong ER , DeLong DM , Clarke-Pearson DL ((1988) ) Comparing the areas under two or more correlated receiver operating characteristic curves: A nonparametric approach. Biometrics 44: , 837–845. |
[40] | Milne A , Culverwell A , Guss R , Tuppen J , Whelton R ((2008) ) Screening for dementia in primary care: A review of the use, efficacy and quality of measures. Int Psychogeriatr 20: , 911–926. |
[41] | Brodaty H , Low LF , Gibson L , Burns K ((2006) ) What is the best dementia screening instrument for general practitioners to use? Am J Geriatr Psychiatry 14: , 391–400. |
[42] | de Gobbi Porto FH , Spindola L , de Oliveira MO , Figueredo do Vale PH , Orsini M , Nitrini R , Dozzi Brucki SM ((2013) ) A score based on screening tests to differentiate mild cognitive impairment from subjective memory complaints. Neurol Int 5: , e16. |
[43] | Park S , Pyo S , Shin SA , Lee JY , Kim YK , Park HJ , Youn JH , Park SW , Lee JY ((2018) ) A quick test of cognitive speed in older adults with Alzheimer’s disease and mild cognitive impairment: A preliminary behavioral and brain imaging study. Psychiatry Res Neuroimaging 280: , 30–38. |
[44] | Cheng YW , Chen TF , Chiu MJ ((2017) ) From mild cognitive impairment to subjective cognitive decline: Conceptual and methodological evolution. Neuropsychiatr Dis Treat 13: , 491–498. |
[45] | Fernandez-Blazquez MA , Avila-Villanueva M , Maestu F , Medina M ((2016) ) Specific features of subjective cognitive decline predict faster conversion to mild cognitive impairment. J Alzheimers Dis 52: , 271–281. |
[46] | Reisberg B , Torossian C , Shulman MB , Monteiro I , Boksay I , Golomb J , Guillo Benarous F , Ulysse A , Oo T , Vedvyas A , Rao JA , Marsh K , Kluger A , Sangha J , Hassan M , Alshalabi M , Arain F , Shaikh N , Buj M , Kenowsky S , Masurkar AV , Rabin L , Noroozian M , Sanchez-Saudinos MAB , Blesa R , Auer S , Zhang Y , de Leon M , Sadowski M , Wisniewski T , Gauthier S , Shao Y ((2019) ) Two year outcomes, cognitive and behavioral markers of decline in healthy, cognitively normal older persons with Global Deterioration Scale Stage 2 (subjective cognitive decline with impairment). J Alzheimers Dis 67: , 685–705. |
[47] | Wolfsgruber S , Polcher A , Koppara A , Kleineidam L , Frolich L , Peters O , Hull M , Ruther E , Wiltfang J , Maier W , Kornhuber J , Lewczuk P , Jessen F , Wagner M ((2017) ) Cerebrospinal fluid biomarkers and clinical progression in patients with subjective cognitive decline and mild cognitive impairment. J Alzheimers Dis 58: , 939–950. |
[48] | Slot RER , Sikkes SAM , Berkhof J , Brodaty H , Buckley R , Cavedo E , Dardiotis E , Guillo-Benarous F , Hampel H , Kochan NA , Lista S , Luck T , Maruff P , Molinuevo JL , Kornhuber J , Reisberg B , Riedel-Heller SG , Risacher SL , Roehr S , Sachdev PS , Scarmeas N , Scheltens P , Shulman MB , Saykin AJ , Verfaillie SCJ , Visser PJ , Vos SJB , Wagner M , Wolfsgruber S , Jessen F , Alzheimer’s Disease Neuroimaging Initiative; DESCRIPA working group; INSIGHT-preAD study group; SCD-I working group, van der Flier WM ((2019) ) Subjective cognitive decline and rates of incident Alzheimer’s disease and non-Alzheimer’s disease dementia. Alzheimers Dement 15: , 465–476. |
[49] | Ward A , Tardiff S , Dye C , Arrighi HM ((2013) ) Rate of conversion from prodromal Alzheimer’s disease to Alzheimer’s dementia: A systematic review of the literature. Dement Geriatr Cogn Disord Extra 3: , 320–332. |
[50] | Nasreddine ZS , Phillips NA , Bedirian V , Charbonneau S , Whitehead V , Collin I , Cummings JL , Chertkow H ((2005) ) The Montreal Cognitive Assessment, MoCA: A brief screening tool for mild cognitive impairment. J Am Geriatr Soc 53: , 695–699. |
[51] | Leoutsakos JM , Gross AL , Jones RN , Albert MS , Breitner JCS ((2016) ) ‘Alzheimer’s Progression Score’: Development of a biomarker summary outcome for AD prevention trials. J Prev Alzheimers Dis 3: , 229–235. |
[52] | Ashford JW , Schmitt FA ((2001) ) Modeling the time-course of Alzheimer dementia. Curr Psychiatry Rep 3: , 20–28. |
[53] | Gavrilov LA , Gavrilova NS ((2001) ) The reliability theory of aging and longevity. J Theor Biol 213: , 527–545. |
[54] | Creavin ST , Wisniewski S , Noel-Storr AH , Trevelyan CM , Hampton T , Rayment D , Thom VM , Nash KJ , Elhamoui H , Milligan R , Patel AS , Tsivos DV , Wing T , Phillips E , Kellman SM , Shackleton HL , Singleton GF , Neale BE , Watton ME , Cullum S ((2016) ) Mini-Mental State Examination (MMSE) for the detection of dementia in clinically unevaluated people aged 65 and over in community and primary care populations. Cochrane Database Syst Rev, CD011145. |
[55] | Ozer S , Young J , Champ C , Burke M ((2016) ) A systematic review of the diagnostic test accuracy of brief cognitive tests to detect amnestic mild cognitive impairment. Int J Geriatr Psychiatry 31: , 1139–1150. |
[56] | Pinto TCC , Machado L , Bulgacov TM , Rodrigues-Junior AL , Costa MLG , Ximenes RCC , Sougey EB ((2019) ) Is the Montreal Cognitive Assessment (MoCA) screening superior to the Mini-Mental State Examination (MMSE) in the detection of mild cognitive impairment (MCI) and Alzheimer’s disease (AD) in the elderly? Int Psychogeriatr 31: , 491–504. |
[57] | Rami L , Bosch B , Sanchez-Valle R , Molinuevo JL ((2010) ) The memory alteration test (M@T) discriminates between subjective memory complaints, mild cognitive impairment and Alzheimer’s disease. Arch Gerontol Geriatr 50: , 171–174. |
[58] | Ashford JW , Tarpin-Bernard F , Ashford CB , Ashford MT ((2019) ) A computerized continuous-recognition task for measurement of episodic memory. J Alzheimers Dis 69: , 385–399. |
[59] | Chinner A , Blane J , Lancaster C , Hinds C , Koychev I ((2018) ) Digital technologies for the assessment of cognition: A clinical review. Evid Based Ment Health 21: , 67–71. |
[60] | van der Hoek MD , Nieuwenhuizen A , Keijer J , Ashford JW ((2019) ) The MemTrax Test compared to the Montreal Cognitive Assessment estimation of mild cognitive impairment. J Alzheimers Dis 67: , 1045–1054. |
[61] | Hung SY , Fu WM ((2017) ) Drug candidates in clinical trials for Alzheimer’s disease. J Biomed Sci 24: , 47. |


