
Levels of Retinal Amyloid-β Correlate with Levels of Retinal IAPP and Hippocampal Amyloid-β in Neuropathologically Evaluated Individuals
Abstract
Background:
Previous studies have used immunohistology to demonstrate Alzheimer’s disease (AD) characteristic accumulation of amyloid-β (Aβ) in the retina of AD patients, a finding indicating retina examination as a potential diagnostic tool for AD pathology.
Objective:
To further explore this idea by investigating whether levels of Aβ42 and Aβ40 in retina are associated with corresponding levels in hippocampus, neuropathological assessments, apolipoprotein E (APOE) genotype, and levels of islet amyloid polypeptide (IAPP).
Methods:
Levels of high molecular weight (HMW) Aβ42, Aβ40, and IAPP in ultra-centrifuged homogenates of retina and hippocampus from patients with AD, multiple sclerosis, AD with Lewy bodies, and non-demented controls were analyzed using Mesoscale Discovery electrochemiluminescence technology employing immunoassay and enzyme-linked immunosorbent assay.
Results:
Higher levels of retinal and hippocampal Aβ42-HMW, Aβ40-HMW, and IAPP-HMW were found in individuals with high neuropathological scores of Aβ plaques and in individuals carrying the APOE ɛ4 allele. The retinal levels of Aβ42-HMW and Aβ40-HMW correlated with corresponding levels in hippocampus as well as with neurofibrillary tangles (NFT) and Aβ scores. Retinal IAPP-HMW correlated with retinal levels of Aβ42-HMW and with NFT and Aβ scores.
Conclusion:
These results show that different isoforms of Aβ can be detected in the human retina and moreover support the growing number of studies indicating that AD-related pathological changes occurring in the brain could be reflected in the retina.
INTRODUCTION
The highly vascularized light sensitive retina originates as an outgrowth of the developing brain and consists of several layers of neurons, which, similarly to brain neurons, are supported by glial cells [1]. This brain-eye interlink has led to the hypothesis that pathological changes occurring in the brain could be reflected in the retina. If this holds true, it opens up for new non-invasive methods to monitor and diagnose brain pathology. The research field of Alzheimer’s disease (AD) has started to explore this possibility and a number of studies have shown an association between AD pathology and pathological changes in the retina [2–6]. Most striking is the finding of amyloid-β (Aβ) depositions in retina of AD patients, as brain depositions of this peptide is widely known to be one of the hallmarks of AD. The presence of retinal Aβ depositions has foremost been revealed by immunohistological stainings using either antibodies directed against the Aβ42 or the Aβ40 peptides (the two Aβ variants foremost associated with AD) or curcumin [3, 4], a dye binding to amyloid peptides in general. The retinal Aβ is found primarily within the neuronal cell layer [4], both intracellularly [5] and extracellularly as well as outside vessels [7], but the peptide has also been found within retinal drusen [8]. However, even though previous studies have demonstrated increased levels of retinal Aβ42 in AD patients and transgenic AD mice [9] as well as a correlation between retinal Aβ depositions and AD severity [4], there are no studies verifying whether levels of Aβ correlate between brain and retina in humans. Thus, in order to search for further support of the potential use for retina observation as a diagnostic tool, the current study aims to investigate whether levels of Aβ42 and Aβ40 in retina correlate with the corresponding levels in hippocampus of individuals with low and high Aβ scores [non-demented controls (NC)) and patients with either multiple sclerosis (MS), AD, or AD with Lewy bodies (AD+LB)]. Since, we found it particularly interesting to investigate whether there is support for an association between Aβ depositions in the two organs, we ultra-centrifuged homogenates of retinas and hippocampi in order to yield high molecular weight samples before analyzing levels of Aβ42 and Aβ40. Since recent studies have suggested that islet amyloid polypeptide (IAPP), a pancreatic derived hormone peptide can seed Aβ [10] and thereby contribute to the Aβ plaque formation in the brain [11], we further found it interesting to investigate the potential relationship between IAPP and Aβ peptides in the retina. Thus, we also measured levels of IAPP in the ultra-centrifuged samples and analyzed its association with Aβ levels, neuropathological assessments, and Apolipoprotein E (APOE) genotype.
MATERIAL AND METHODS
Individuals included in the study
Frozen samples of midlevel hippocampus and retina (right eyeball) from clinically and postmortem verified patients with AD (n = 5), MS (n = 4), AD+LB (n = 3), and NC (n = 4) from the Netherlands Brain Bank (NBB) were included in the study. All individuals were included in the retinal and hippocampal Aβ40 and Aβ42 analysis and the hippocampal IAPP analysis. Five of these individuals (AD n = 1, MS n = 3, and NC n = 1) were missing in the retinal IAPP analysis. Single nucleotide polymorphisms at position rs429358 and rs7412 of the APOE genotype were determined by polymerase chain reactions using allele-specific primers as previously described [12]. Clinical diagnosis, APOE genotype, demographic data, and neuropathological assessment (Braak stages for presence of neurofibrillary tangles (NFT) and ABC stages for presence of Aβ burden) are presented in Table 1. Written consent for the use of tissue and clinical data for research purposes was obtained from all patients or their next of kin in accordance with the International Declaration of Helsinki. The medical ethics review committee of VU medical center, Amsterdam, has approved the procedures of tissue collection and the regional ethical review board in Lund has approved the study. All human data was analyzed anonymously.
Table 1
Demographic data, apolipoprotein E (APOE) genotype, neuropathological evaluation, and cause of death of the individuals included in the study
| Clinical diagnosis | Gender | Age (y) | Neuropathol. evaluation (NFT/Aβ/LB) | APOE genotype | Cause of death | Postmortem delay |
| NC | M | 70 | 1/O/3 | 3/2 | Pneumonia, cardiogenic shock | 6h 20min |
| NC | M | 81 | 3/C/0 | 4/3 | Pancreas carcinoma | 4h 30min |
| NC | F | 92 | 3/O/0 | 3/4 | Heart failure | 6h 35min |
| NC | F | 60 | 0/O/0 | 3/2 | Mammacarcinoma | 8h 10min |
| AD | F | 85 | 5/C/0 | 3/4 | Pneumonia | 8h 15min |
| AD | F | 70 | 6/C/0 | 4/3 | Atrioventricular block | 6h 10min |
| AD | F | 91 | 6/C/0 | 4/4 | Cachexia, severe AD | 4h 20min |
| AD | F | 78 | 6/C/0 | 4/4 | Cachexia, severe AD | 4h 45min |
| AD | F | 64 | 4/C/0 | 3/3 | Cerebrovascular accident | 6h 37min |
| MS | F | 60 | 0/A/na | 3/4 | Multiple sclerosis | 7h 25min |
| MS | M | 78 | 2/O/na | 3/3 | Euthanasia, Multiple sclerosis | 8h 45min |
| MS | F | 87 | 2/A/na | 3/3 | Renal insufficiency | 9h 30min |
| MS | F | 81 | 4/A/na | 3/3 | Cardiac asthma | 9h 35min |
| AD+LB | F | 83 | 4/C/6 | 3/3 | Gastro-enteritis, dementia | 6h 15min |
| AD+LB | F | 88 | 5/C/5 | 3/3 | Cachexia, vascular dementia | 5h 40min |
| AD+LB | M | 63 | 4/C/6 | 4/4 | Hepatic insufficiency, metastases | 4h 55min |
Individuals neuropathologically diagnosed as non-demented controls (NC) or patients with Alzheimer’s disease (AD), multiple sclerosis (MS), and Alzheimer’s disease with Lewy bodies (AD+LB) included in the study. Braak staging of neurofibrillary tangles (NFT) and Lewy bodies (LB) and ABC stages of amyloid (Aβ). F, female; M, male; na, not analyzed.
Tissue extraction
The right eyeball of the patients was enucleated and the anterior segment (including the lens and cornea) as well as the vitreous was removed. Thereafter the eyecups were filled with Tissue-Tek O.C.T. Compound (Sakura Finetek, Torrance, CA), snap frozen with isopentane cooled with liquid nitrogen and kept in –80°C until used. Retina samples (cut in 1.0×0.5 cm pieces 0.5 cm from the optic nerve in the far peripheral superior part) and hippocampal samples (CA1 and molecular layer) (approximately 30 mg), were homogenized in cell-lysis buffer (Sigma Aldrich, St. Louis, MO) together with protease inhibitors at 4°C and ultra-centrifuged 350,000×g for 1 h 4°C. The pellet was re-homogenized in 100% formic acid (10 μl/mg tissue), incubated 1 h room temperature and then centrifuged at 13,000×g for 20 min 4°C. The supernatant was lyophilized and then re-dissolved in DMSO to generate the high-molecular weight fraction (HMW) (for Aβ42 and Aβ40 analysis). The HMW fraction was then further processed by dissolving the fraction in guanine hydrochloride (GuHCl) (1:1) to create the HMW-GuHCl fraction (for IAPP analysis).
Analysis of Aβ40-HMW and Aβ42-HMW in retina and brain tissue
Levels of Aβ38-HMW, Aβ40-HMW, and Aβ42-HMW of retina and brain tissue were analyzed using MesoScale Discovery V-plex Aβ Peptide Panel 1 kit with electrochemiluminescence detection technology (MesoScale Discovery, Rockville, MD) according to manufacturers’ protocol. The electrochemiluminescence signal was quantified using a MesoScale Discovery SECTOR Imager 6000. The majority of the Aβ38 values was below detection and will therefore not be reported in this study. The dynamic range for Aβ40 were 2.26-14900 pg/ml and for Aβ42 0.482-1380 pg/ml. Protein concentrations were assessed using BCA Protein Assay (Thermo Fischer, Waltham, MA) according to the manufactures’ instructions, and used to normalize Aβ levels. Retinal Aβ42 and Aβ40 values from two individuals (NC n = 1 and MS n = 1) and hippocampal Aβ42 values from one individual (MS n = 1) were below detection and were set to the lowest detected normalized value divided by two.
Analysis of IAPP in retina and brain tissue
Levels of IAPP in HMW-GuHCl fraction of retina and brain tissue were analyzed using Amylin EIA Kit (Peninsula Laboratories, San Carlos, CA) according to manufacturers’ instructions. The absorbance was quantified using a Cytation 5 Cell Imaging Multi-Mode Reader (BioTek, Winooski, VT). Protein concentrations were assessed using BCA Protein Assay (ThermoFischer) according to the manufactures instructions and used to normalize IAPP.
Statistical analysis
Statistical analysis was performed using SPSS software 24.0 (SPSS Inc., Chicago, IL). The Wilk-Shapiro test was used to assess normal distribution. Levels of Aβ40-HMW and Aβ42-HMW were not normally distributed and logarithmic transformations were therefore used to correct for the skewed data distributions. Differences in levels of Aβ40-HMW, Aβ42-HMW, and IAPPHMW were analyzed by use of student t-test (when two groups were compared) and ANOVA followed by Tukey HSD test (when four groups were compared). Differences in levels of Aβ40-HMW and Aβ42-HMW were also analyzed using ANCOVA analysis with APOE as covariate. Correlations between the investigated variables were examined using two-tailed Pearson correlation test, except for in the correlation analyses involving NFT scores and Aβ scores, which were performed using Spearman correlation test . Results are presented as mean±standard deviation. A p < 0.05 was considered significant.
RESULTS
Individuals included in the study
The demographic data on individuals included in the study is showed in Table 1. No significant differences in age were found between the groups (NC: 76±14, AD: 78±11, MS: 77±12, AD+LB: 78±13 years). Both females and males were included in the NC, MS, and AD+LB groups, whereas the AD patient group contained only females. AD and AD+LB patients had disorder-characteristic high amyloid plaque burden (stage C) and high numbers of NFT (Braak stages 4 and above). The MS patients displayed low or none of the AD or AD+LB characteristic neuropathological alterations. The individuals included in the NC group showed presence of NFT (stage 3 and below) and two individuals also showed either high amyloid plaque load (stage C) or presence of Lewy bodies (stage 3). Finally, 4 out of 5 AD patients as well as 2 out of 4 NCs were APOE ɛ4 carriers, whereas only 1 out of 3 AD+LB and 1 out of 4 MS patients carried the APOE ɛ4 allele.
Levels of high molecular weight Aβ in hippocampus
Statistical analysis of hippocampal samples showed significantly higher levels of Aβ42-HMW in both AD patients and AD+LB patients compared to NC and patients with MS (Fig. 1A). One of the NC showed Aβ42-HMW levels in the same range as AD patients (Fig. 1A). This NC had also high Aβ scores, explaining its divergent Aβ42-HMW value as well as indicating a relationship between high Aβ scores and hippocampal Aβ42-HMW levels. To further investigate this relationship, we divided the individuals into groups based on Aβ scores. Comparison analysis of these groups showed significantly higher hippocampal Aβ42-HMW levels in individuals with high Aβ scores (stage C) compared to individuals with low Aβ scores (stage O or A) (Fig. 1B).
Fig.1
Levels of Aβ42-HMW and Aβ40-HMW in hippocampus of individuals included in the study. Image in (A) shows a column scatter graph demonstrating higher log Aβ42-HMW in patients with Alzheimer’s disease (AD) and Alzheimer’s disease with Lewy bodies (AD+LB) compared to both non-demented controls (NC) and to patients with multiple sclerosis (MS). Image in (B) shows a column scatter graph demonstrating higher log Aβ42-HMW in individuals with high Aβ scores (C) compared to individuals with low Aβ scores (O or A). Image in (C) shows a column scatter graph demonstrating higher log Aβ40-HMW in AD patients compared to patients with MS. Image in (D) shows a column scatter graph demonstrating higher log Aβ40-HMW in individuals with high Aβ scores compared to individuals with low Aβ scores. Data is analyzed using ANOVA followed by Tukey HSD (A and C) and student t-test (B and D). Values are presented as mean value±SD. Of note, Aβ42 values from one MS patient were below the detection limit and set to the lowest detected normalized value divided by two before logistic transformation. *Significant correlation at p < 0.05 level. ***Significant correlation at p < 0.001 level.
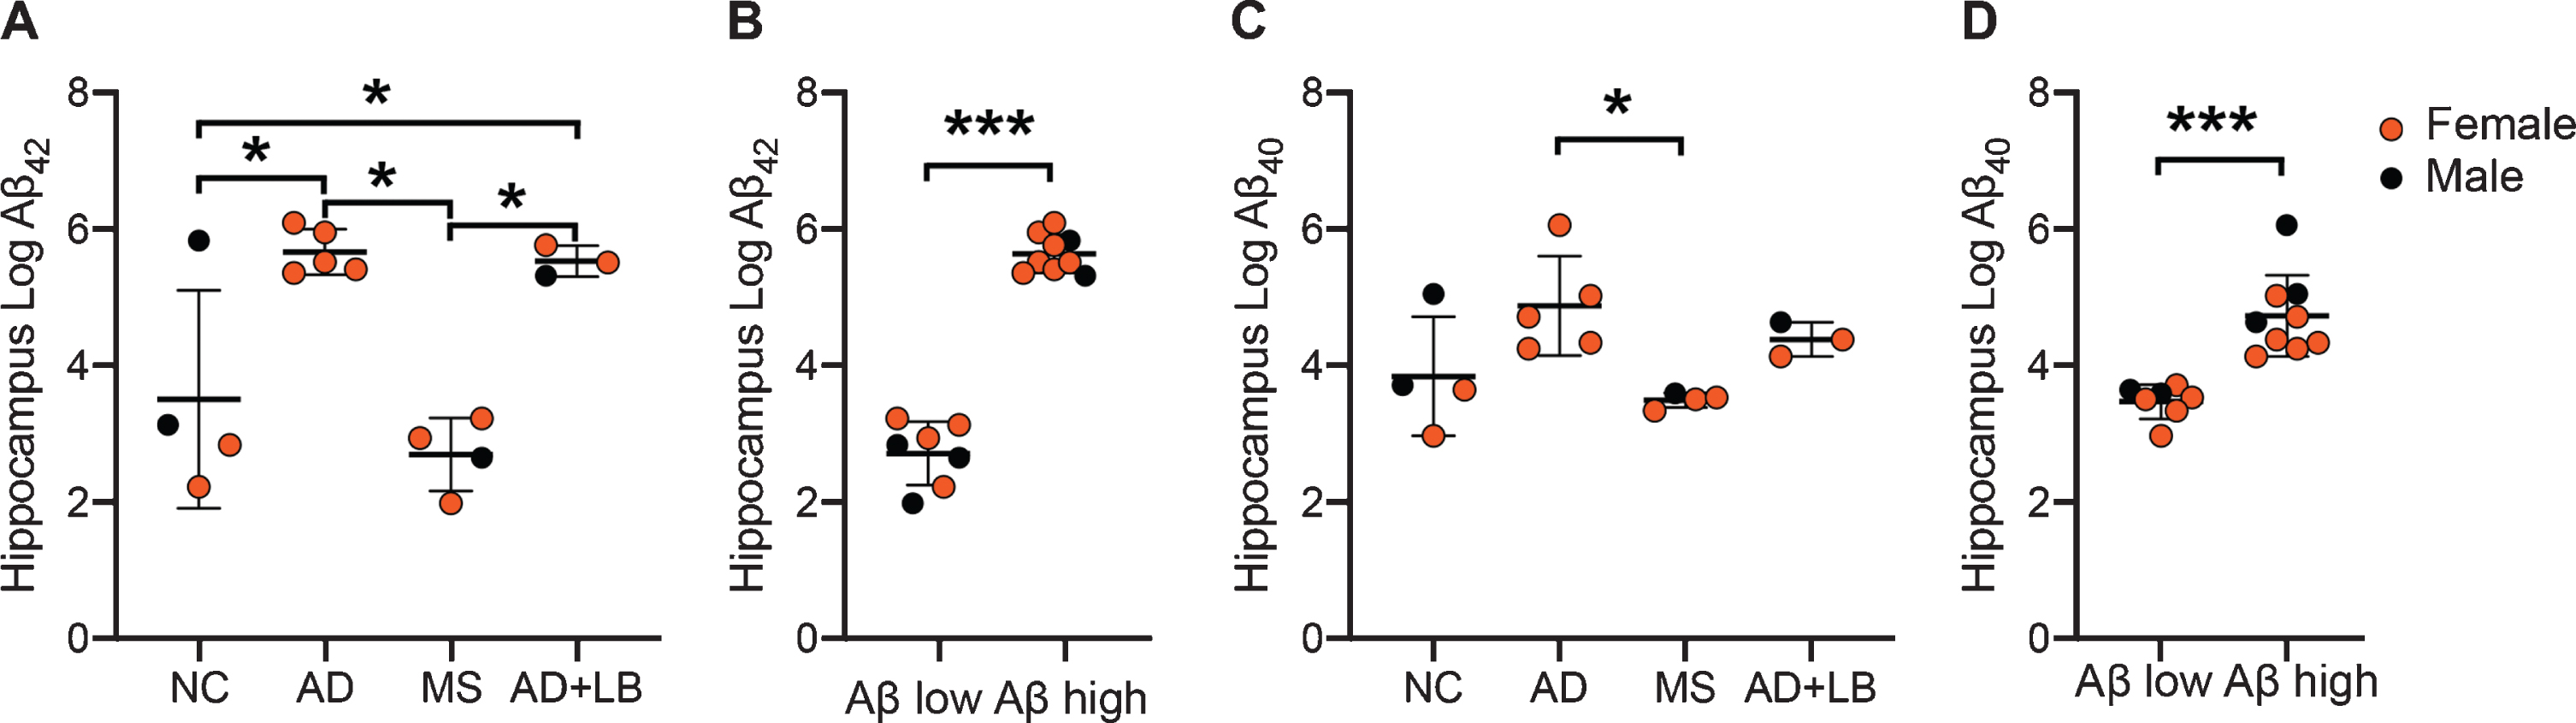
Hippocampal Aβ40-HMW levels were also significantly higher in AD patients compared to MS patients, whereas the higher levels in AD+LB patients compared to MS patients did not reach significance. The individual with high Aβ scores in the NC group also showed high Aβ40-HMW levels and thus there were no differences between NC and the other patient groups (Fig. 1C). Comparison analysis based on Aβ scores showed that individuals with high Aβ scores (C) had significantly higher hippocampal Aβ40-HMW levels compared to those with low Aβ scores (O or A) (Fig. 1D). Finally, analysis of Aβ-HMW levels in APOE ɛ4 carriers across the groups showed that individuals carrying the APOE ɛ4 allele displayed higher, but not significant, levels of both Aβ42-HMW (457.5±459.6 versus 159.4±211.5) and Aβ40-HMW (202.4±411.4 versus 133.6±137.6) .
Levels of high molecular weight Aβ in retina
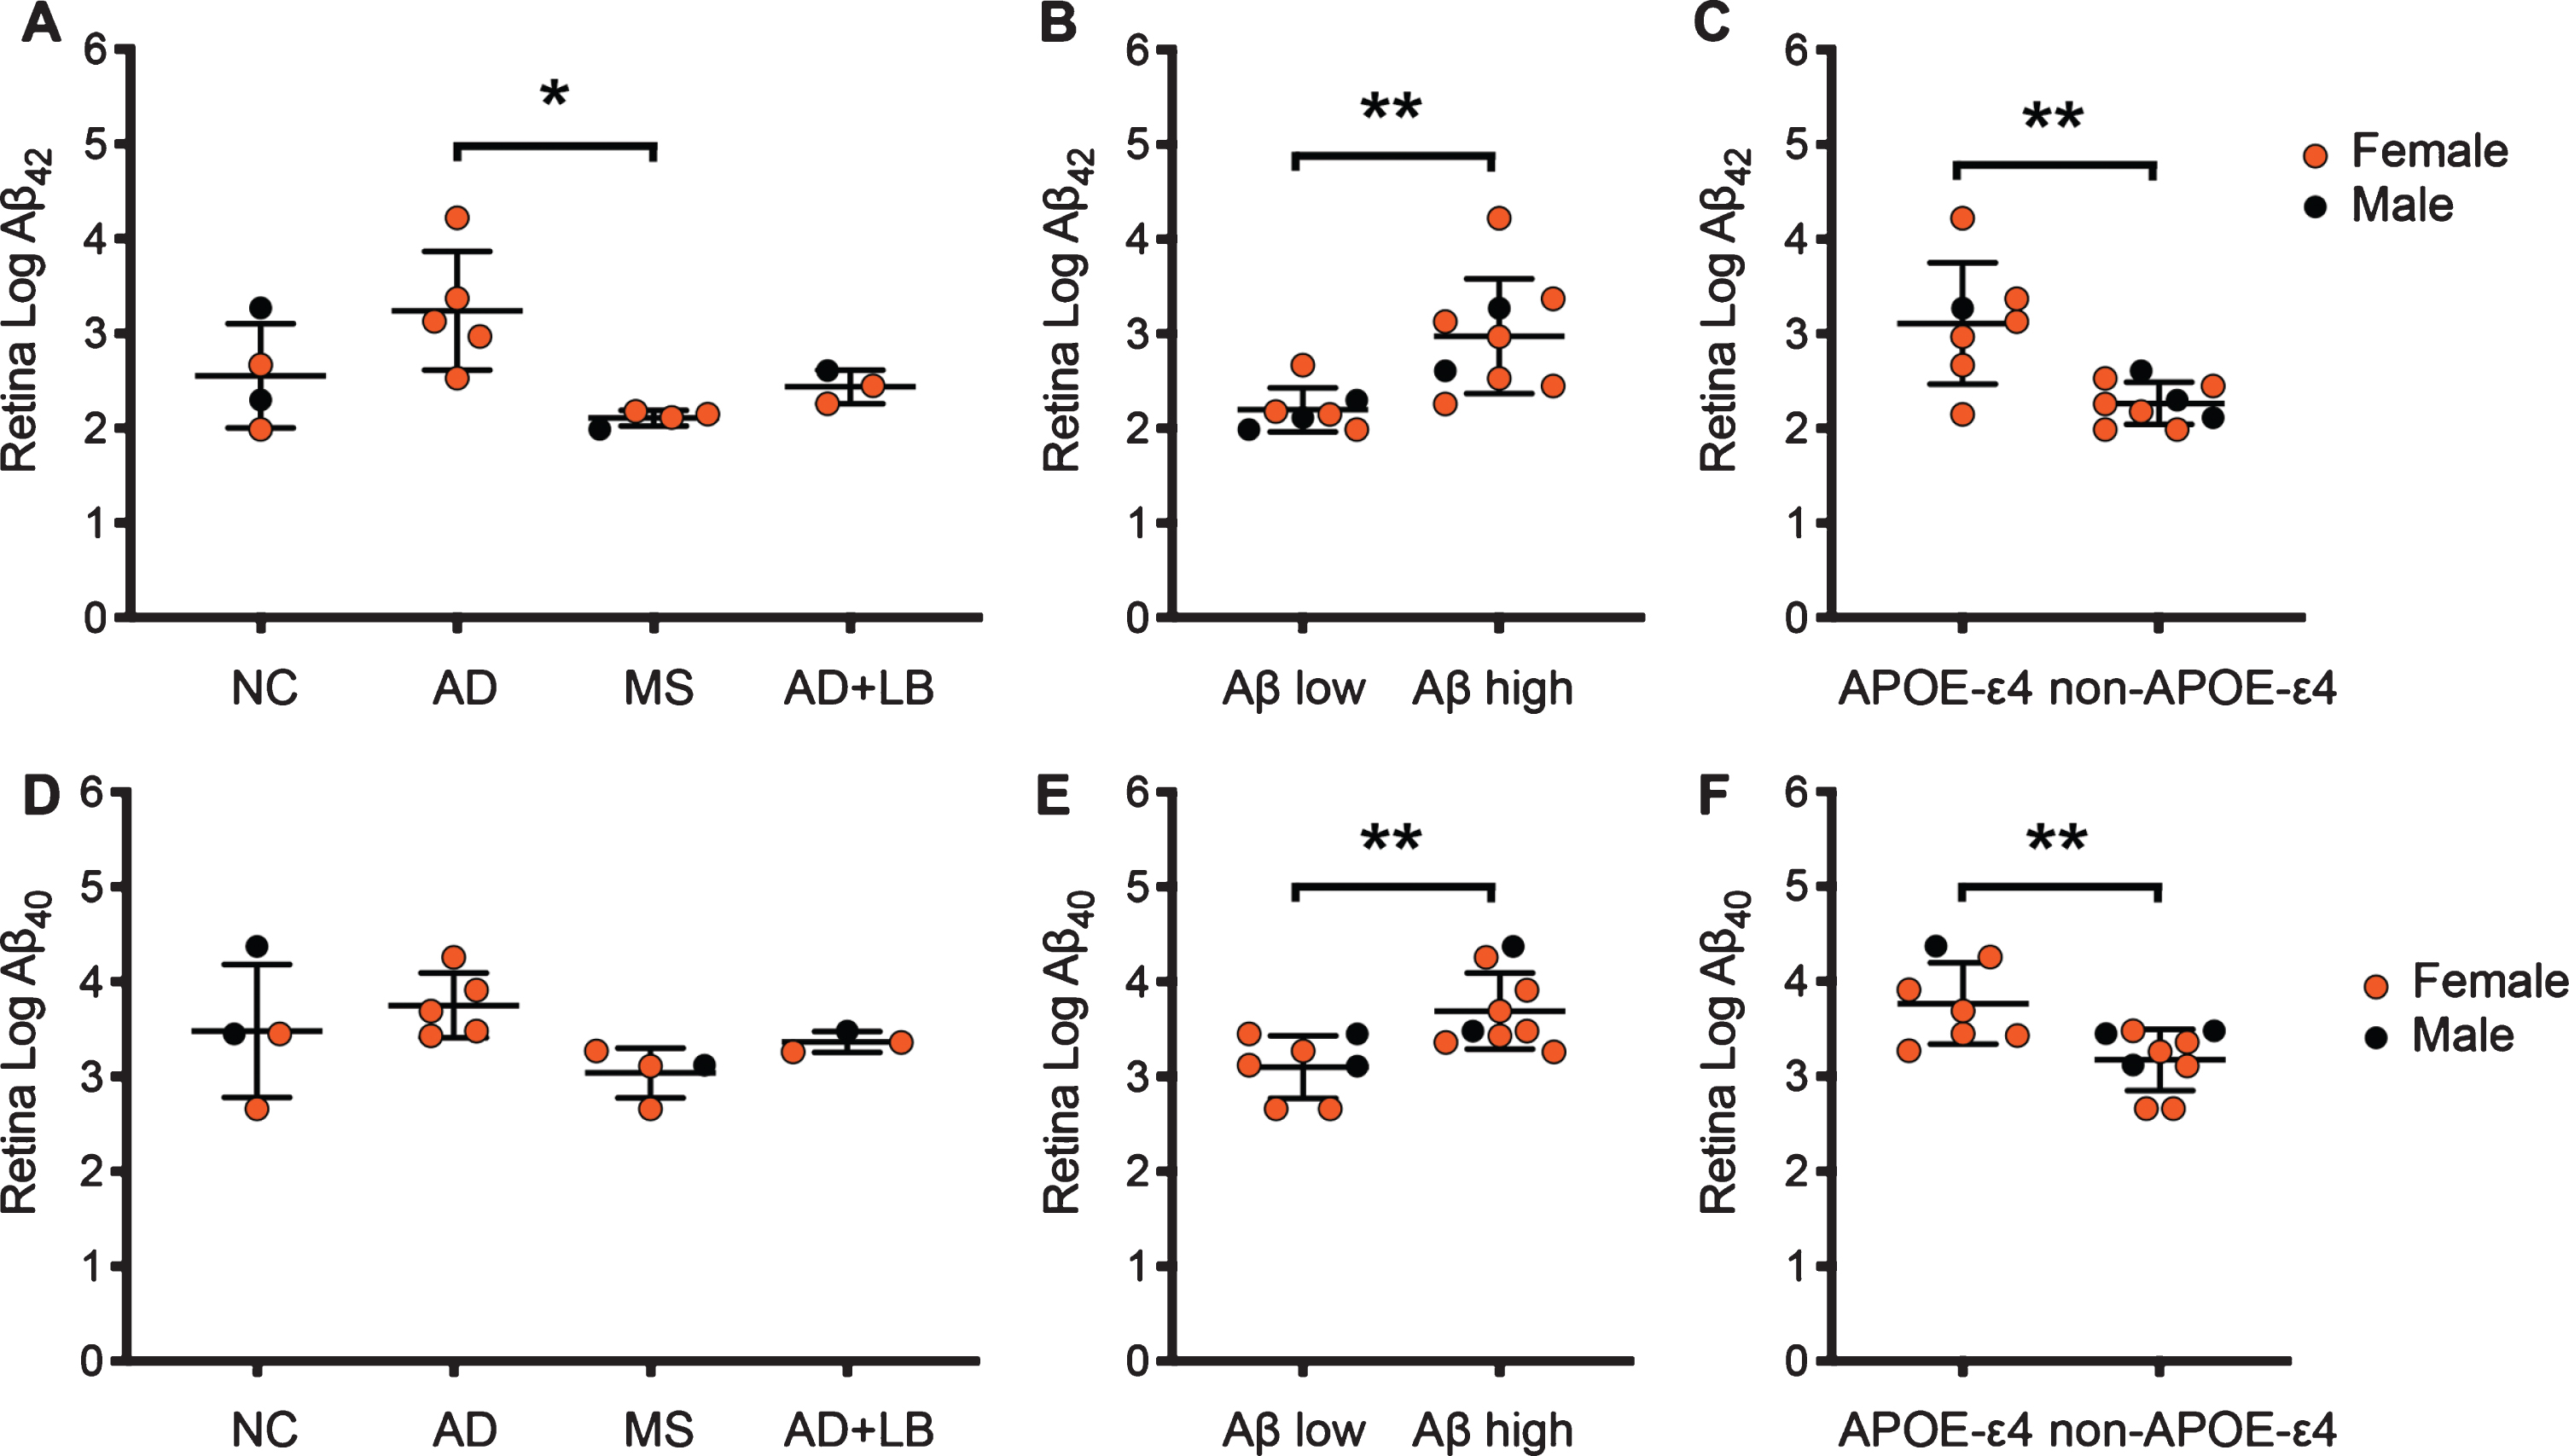
Levels of Aβ42-HMW in retina were, in similarity to the corresponding levels in hippocampus, significantly higher in AD patients compared to MS (Fig. 2A). The Aβ42-HMW levels in AD+LB patients did not significantly differ compared to MS or NC and Aβ42-HMW levels in NC did not differ from levels in AD patients due to the one NC with high Aβ42-HMW levels and high Aβ scores (Fig. 2A). Comparison analysis based on Aβ scores showed significantly higher retinal Aβ42-HMW levels in individuals with high Aβ scores compared to individuals with low Aβ scores (Fig. 2B). Individuals carrying one or two APOE4 ɛ4 alleles further displayed significantly higher retinal Aβ42-HMW levels compared to APOE ɛ4 non-carriers (Fig. 2C). Retinal levels of Aβ40-HMW showed a similar pattern as Aβ42-HMW levels, i.e., higher (although not significant) Aβ40-HMW levels in AD patients compared to MS but not to NC, due to high Aβ40-HMW levels in the individual with high Aβ scores (Fig. 2D). Levels of Aβ40-HMW were also significantly higher in individuals with high Aβ scores compared to individuals with low Aβ scores (Fig. 2E). Finally, individuals carrying one or two APOE ɛ4 alleles displayed significantly higher levels also of retinal Aβ40-HMW compared to APOE ɛ4 non-carriers (Fig. 2F). When the association to APOE was accounted for in an ANCOVA analysis (APOE as covariate) of Aβ-HMW levels in diagnostic groups, no significant differences between groups were found (Aβ42-HMW p = 0.078; Aβ40-HMW p = 0.341). The differences remained however significant when individuals with high versus low Aβ scores were compared (Aβ42-HMW p = 0.006; Aβ40-HMW p = 0.011).
Fig.2
Retinal levels of Aβ42-HMW and Aβ40-HMW of individuals included in the study. Image in (A) shows a column scatter graph demonstrating higher log Aβ42-HMW in patients with Alzheimer’s disease (AD) compared to patients with multiple sclerosis (MS). The column scatter graph in (B) demonstrates the higher log Aβ42-HMW in individuals with high Aβ scores (C) compared to individuals with low Aβ scores (O or A). The column scatter graph in (C) shows higher log Aβ42-HMW in individuals carrying the APOE ɛ4 allele compared to APOE ɛ4 non-carriers. Image in (D) shows a column scatter graph demonstrating no significant differences in log Aβ40-HMW between diagnosis groups. The column scatter graph in (E) shows higher log Aβ40-HMW in individuals with high Aβ scores compared to individuals with low Aβ scores and the column scatter graph in (F) demonstrates higher log Aβ40-HMW in individuals carrying the APOE ɛ4 allele compared to APOE ɛ4 non-carriers. Data is analyzed using ANOVA followed by Tukey HSD (A and D) and student t-test (B, C, E, and F). Values are presented as mean value±SD. Of note, Aβ42 and Aβ40 values from one NC and one MS patient were below the detection limit and set to the lowest detected normalized value divided by two before logistic transformation. *Significant correlation at p < 0.05 level. **Significant correlation at p < 0.01 level.
Correlations between retinal and hippocampal levels of high molecular weight Aβ
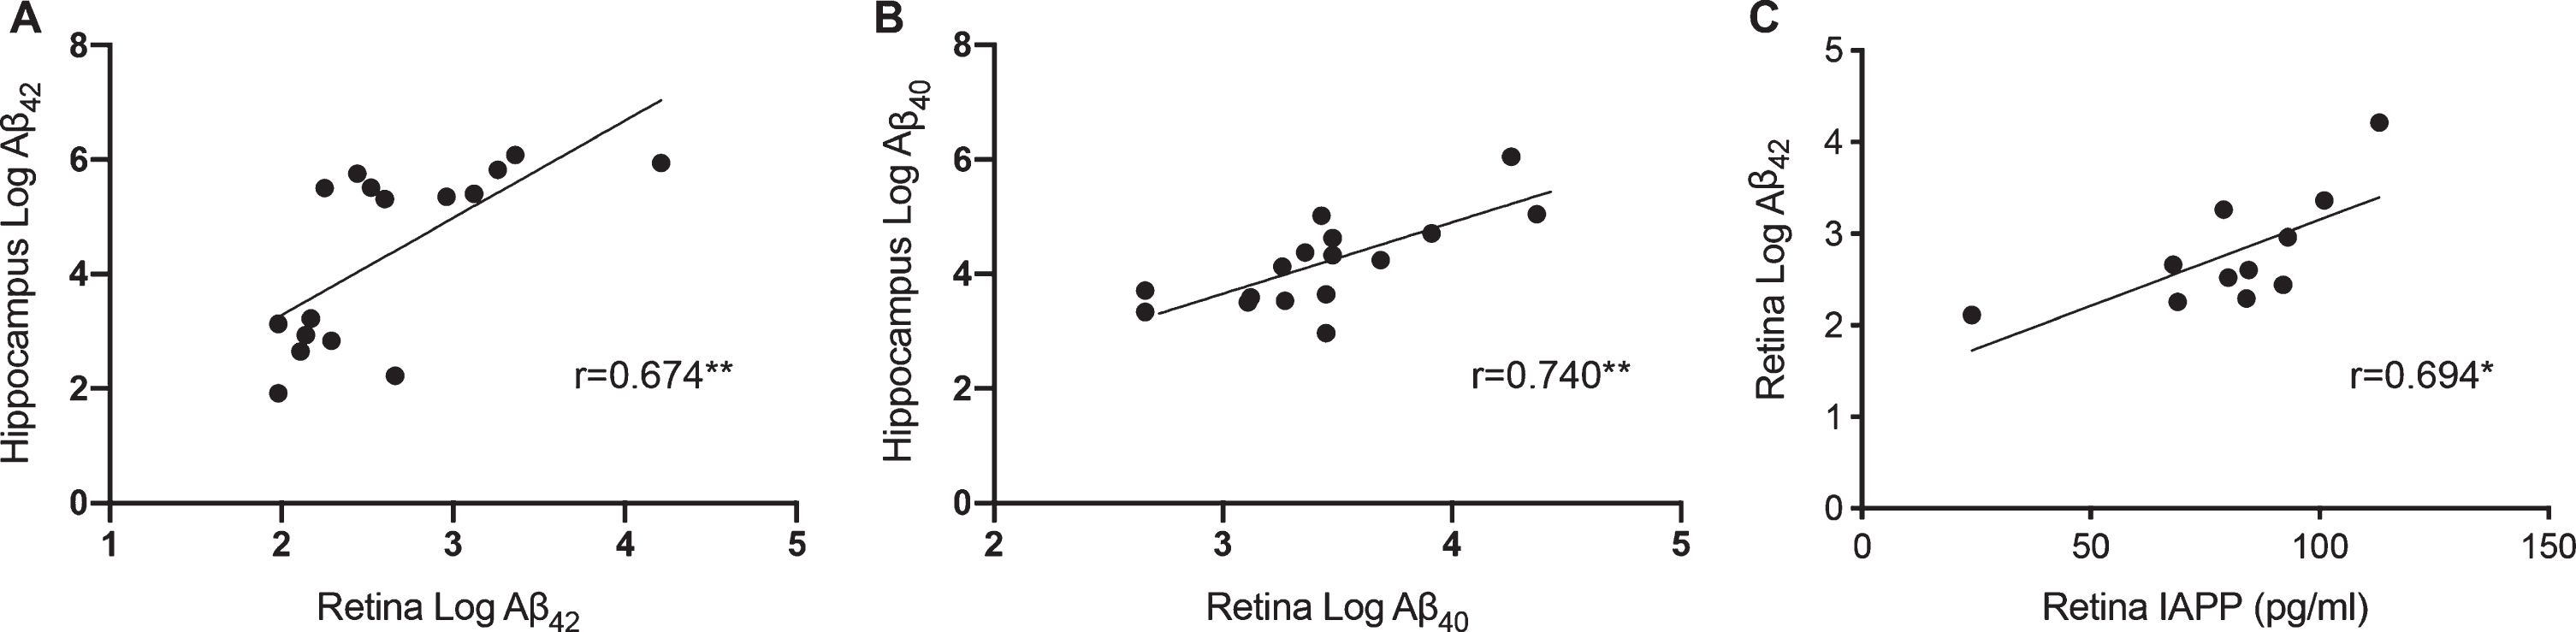
Retinal levels of both Aβ42-HMW and Aβ40-HMW correlated with the corresponding levels in hippocampus (Fig. 3A, B). Moreover, NFT scores and Aβ scores correlated significantly with retinal levels of Aβ42-HMW (r = 0.776, p = 0.001 and r = 0.693, p = 0.004, respectively) and Aβ40-HMW (r = 0.664 p = 0.007 and r = 0.630, p = 0.012, respectively). As expected, NFT scores and Aβ scores also correlated significantly with hippocampal levels of Aβ42-HMW (r = 0.682, p = 0.005 and r = 0.850, p = 0.00006, respectively) and Aβ40-HMW (r = 0.718, p = 0.003 and r = 0.850, p = 0.00006, respectively). The ratio between retinal and hippocampal Aβ42-HMW and Aβ40-HMW levels did not significantly differ although both the AD and AD+LB groups displayed lower retinal/hippocampus ratio of Aβ42-HMW and Aβ40-HMW compared to MS and NC (Aβ42-HMW : 0.57±0.09, 0.44±0.04, 0.80± 0.16 and 0.79±0.28, respectively; Aβ40-HMW: 0.77±0.08, 0.77±0.02, 0.87±0.06 and 0.92± 0.18, respectively). The Aβ42-HMW and Aβ40-HMW ratios were, however, significantly lower in individuals with high Aβ scores compared with low Aβ scores (Aβ42-HMW : 0.52±0.09 versus 0.84±0.21, p = 0.001, Aβ40-HMW : 0.79±0.66 versus 0.90±0.14, p = 0.045). No differences in either Aβ ratios were seen when comparing APOE ɛ4 carriers with APOE ɛ4 non-carriers (Aβ42-HMW: 0.70±0.23 versus 0.63±0.21, Aβ40-HMW : 0.86±0.16 versus 0.81±0.073). No associations between the different variables (retinal and hippocampal Aβ42-HMW, Aβ40-HMW, or Aβ ratios) and age or gender were found.
Fig.3
Correlations between retinal and hippocampal levels of Aβ42-HMW and Aβ40-HMW and between retinal Aβ42-HMW and IAPP-HMW. Scatter plot in (A) demonstrates correlations between retinal levels of Aβ42-HMW and hippocampal levels of Aβ42-HMW. Scatter plot in (B) shows the relationship between retinal levels of Aβ40-HMW and hippocampal levels of Aβ40-HMW. Scatter plot in (C) shows the association between retinal Aβ42-HMW and retinal IAPP-HMW. Data was analyzed with Pearson correlation test. Of note, retinal Aβ42 and Aβ40 values from one NC and one MS patient as well as hippocampal Aβ42 values from one MS patient were below the detection limit and set to the lowest detected normalized value divided by two before logistic transformation. *Significant correlation at p < 0.05 level. **Significant correlation at p < 0.01 level.
Levels of islet amyloid polypeptide in retina and hippocampus
No significant alterations in levels of retinal IAPP-HMW were found between any of the patient groups. However higher, but not significant, retinal IAPP-HMW levels were seen in individuals with high Aβ scores compared to those with low Aβ scores (69.1± 15.5 versus 44.9±28.1). In the corresponding hippocampal fraction, significantly higher levels of IAPP-HMW in AD+LB patients compared to AD (106.0±35.6 versus 54.8±19.2, p = 0.040) were found. No significant differences were seen between AD or MS patients compared to NCs (54.8±19.2 versus 57.7± 7.0; 65.5±7.7 versus 57.7±7.0, respectively) and the hippocampal IAPP-HMW levels did not differ between individuals with low or high Aβ scores (72.1±33.9 versus 62.6±8.4). No significant changes in retinal IAPP-HMW levels or hippocampal IAPP-HMW levels were seen when APOE ɛ4 carriers were compared to APOE ɛ4 non-carriers (74.2±16.0 versus 52.6±21.2 and 55.8±16.3 versus 81.6±31.1, respectively).
Correlations between retinal levels of IAPP-HMW and Aβ42-HMW
Finally, correlation analysis showed that retinal levels of IAPPHMW correlated with retinal levels of Aβ42-HMW (Fig. 3C), NFT (r = 0.822, p = 0.002) and a tendency with Aβ scores (r = 0.581, p = 0.061). No such correlations were found between retinal IAPP-HMW levels and retinal Aβ40-HMW levels or between hippocampal IAPP-HMW levels and hippocampal levels of Aβ42-HMW or Aβ40-HMW.
DISCUSSION
In the current study, we demonstrate higher levels of Aβ42-HMW and Aβ40-HMW in both retina and hippocampus from individuals with high Aβ scores and individuals carrying the APOE ɛ4 allele. The retinal levels of both amyloid peptides correlated with hippocampal levels of the same as well as with neuropathological evaluations of NFT and Aβ. We also demonstrate a correlation between levels of Aβ42-HMW and IAPP-HMW in the retina but not in the hippocampus. Retinal IAPP-HMW levels were higher in individuals with high Aβ scores and correlated positively with neuropathological assessments. No differences in hippocampal IAPP-HMW levels were seen and APOE ɛ4 carriers did not show altered retinal or hippocampal IAPP-HMW levels.
The number of analyzed individuals in each group was small with only 4 individuals in the NC group, 4 individuals in the MS group, 3 individuals in the AD+LB group, and 5 individuals in the AD group. Such a small sample size can undeniably lead to both under and over interpretations of the results and it is important to emphasize that the study needs to be repeated in a larger group of individuals. To increase the power and reduce potential misinterpretations, we have chosen to group the individuals based on their neuropathological staging for Aβ (high = stage C and low = stage O or A) instead of based on diagnosis and will in this discussion only reflect upon the results yielded after such grouping.
The analysis of hippocampal homogenates showed expected higher levels of Aβ40-HMW and Aβ42-HMW in individuals with high Aβ scores and individuals carrying the APOE ɛ4 allele, verifying that our tissue extraction and analysis is appropriate. Analysis of retinal samples further showed that individuals with high Aβ scores also had significantly higher retinal Aβ42-HMW and Aβ40-HMW levels, suggesting that individuals with high hippocampal Aβ burden also have high levels of Aβ present in the retina. This idea was confirmed by our correlation analysis demonstrating an association between retinal and hippocampal Aβ42-HMW and Aβ40-HMW levels. It is thus plausible that accumulation of Aβ in retina can reflect the corresponding accumulation in the brain, as suggested previously [4, 7]. In the current study we chose to compare Aβ levels in retina with the same levels in hippocampus. The rationale for choosing this brain region for the comparison analysis is the notion that hippocampus is affected by AD pathology [13], which eventually leads to the characteristic memory loss seen in AD patients. Inarguable, it would be of interest to also compare retinal Aβ levels with Aβ levels in other brain regions affected by AD pathology (for example, precuneus which is affected by AD at the earliest stages [14]) in order to further understand the temporal association between retina and brain accumulation of Aβ. Nevertheless, since the retinal Aβ42-HMW and Aβ40-HMW levels also correlated with NFT scores, it is tempting to speculate that retinal Aβ reflects general AD pathology. This idea is supported by several transgenic AD mice studies demonstrating a correlation between increased disease progression and retinal plaque load/Aβ42 levels [4, 9, 15, 16]. A similar correlation between retinal Aβ plaque load and AD severity has also been found in a human postmortem study [3].
The significant lower ratio of retinal and hippocampal Aβ42-HMW and Aβ40-HMW in individuals with high Aβ scores compared low Aβ scores suggests that Aβ in the retina does not form high molecular weight structures proportional to similar formation in the hippocampus. We thus draw the conclusion that Aβ accumulates and possibly aggregates at a higher degree in hippocampus compared to retina.
Our study further showed that individuals carrying one or two APOE ɛ4 alleles had significantly higher retinal levels of both Aβ42-HMW and Aβ40-HMW, a finding not previously reported. Interestingly, APOE has been shown to be important for vascular development and previous in vivo studies have demonstrated vascular and synaptic impairments in the retina of APOE ɛ4 mice [17]. However, even though no histological differences in retina were seen between native APOE ɛ4 or APOE ɛ3 mice, the previous study showed that APOE ɛ4 mice have a stronger inflammatory response after laser driven injury compared to APOE ɛ3 mice [18]. Although we can only speculate upon the significance of APOE ɛ4 in retinal Aβ accumulation, it is most likely that retinal APOE ɛ4, just like brain APOE ɛ4, affects metabolism, aggregation and clearance of Aβ (for review, see [19]).
Previous experimental studies have shown that IAPP can seed Aβ and thus the peptide has been suggested to be involved in Aβ plaque formation in the brain of AD patients. We have previously shown increased levels of low molecular weight IAPP and decreased levels of high molecular weight IAPP in the retina of AD patients. The ELISA that we used in the former study detects only IAPP with an intact disulfide bond and a N-terminal amide group, i.e., the biologically active version of IAPP considered to be less prone to form toxic aggregates. In the current study, we instead used an EIA assay, where the IAPP in the samples competitively is bound to antibodies directed against both intact and modified versions of IAPP. Using this kit, we detected higher levels of retinal IAPPHMW in individuals with high Aβ scores, and moreover a correlation between these levels and retinal levels of Aβ42-HMW . Since the Aβ-HMW samples theoretically foremost contain aggregates as in plaques, we draw the conclusion that our results support the idea that IAPP is associated with Aβ plaque formation as previously suggested [20].
Although previous studies have demonstrated increased levels of IAPP in temporal cortex of AD patients [21, 22], we found no alterations in hippocampal IAPP-HMW levels in individuals with high Aβ scores and no correlations between levels of retinal IAPP-HMW and hippocampal IAPP-HMW. We did however notice a positive correlation between levels of retinal IAPP-HMW and NFT as well as Aβ scores. These findings are in line with our previous study demonstrating unaltered hippocampal IAPP levels in AD patients, but positive correlations between retinal low molecular weight IAPP, NFT, and Aβ scores. The results are interesting as they could indicate that the presence of IAPP and its impact on Aβ plaque formation differ between brain regions and that IAPP only (if any) plays a minor seeding role in hippocampus. If this holds true, the association between retinal IAPP levels and neuropathological assessments could indicate that IAPP along with retinal IAPP is increased in other brain areas of AD patients. Further studies on homogenates from different brain regions are however required to verify this hypothesis. Another possibility is that IAPP accumulation in retina precedes the same in hippocampus, but this idea goes against the hypothesis that IAPP is involved in Aβ plaque formation.
Finally, our study analyses levels of AβHMW in homogenates of retina and hippocampus and does thus not provide information regarding the cellular localization of the analyzed peptide. However, when collecting the retina, we were careful to not include the retinal pigment epithelium cell layer in the samples. We can thus conclude that the Aβ40 and Aβ42 levels found in our samples most likely represent intracellular or extracellular Aβ in the retina and do not derive from amyloid depositions in drusen.
To conclude, our studies show that both Aβ40 and Aβ42 can be found in the human retina. They also indicate that elevated levels of high molecular weight Aβ40 and Aβ42 in hippocampus are associated with increased levels of the same in the retina, a finding supporting the idea that the retina can mirror senile plaque formation in the hippocampus. Moreover, since our studies also indicated that levels of Aβ42-HMW are associated with APOE ɛ4 and levels of IAPPHMW, we conclude that these two factors might be implicated in the accumulation of Aβ in the retina of individuals with high Aβ scores.
ACKNOWLEDGMENTS
The authors thank Camilla Orbjörn (Lund University) for technical support and Henrietta M. Nielsen (Stockholm University and Roskilde University) for apolipoprotein E genotyping. The authors wish to thank the Swedish Research Council (MW), Ögonfonden (MW), Royal Physiographic Society of Lund (MW), Olle Engkvist foundation (MW, NS), Petrus and Augusta Hedlund foundation (MW), Swedish Dementia foundation (MW), Åhlén foundation, Crafoord foundation (MW), the Greta and Johan Kocks foundations (MW) for financially supporting this study.
Authors’ disclosures available online (https://www.j-alz.com/manuscript-disclosures/19-0868r1).
REFERENCES
[1] | London A , Benhar I , Schwartz M ((2013) ) The retina as a window to the brain-from eye research to CNS disorders. Nat Rev Neurol 9: , 44–53. |
[2] | Frost S , Kanagasingam Y , Sohrabi H , Vignarajan J , Bourgeat P , Salvado O , Villemagne V , Rowe CC , Macaulay SL , Szoeke C , Ellis KA , Ames D , Masters CL , Rainey-Smith S , Martins RN , AIBL Research Group ((2013) ) Retinal vascular biomarkers for early detection and monitoring of Alzheimer’s disease. Transl Psychiatry 3: , e233. |
[3] | Koronyo Y , Biggs D , Barron E , Boyer DS , Pearlman JA , Au WJ , Kile SJ , Blanco A , Fuchs DT , Ashfaq A , Frautschy S , Cole GM , Miller CA , Hinton DR , Verdooner SR , Black KL , Koronyo-Hamaoui M ((2017) ) Retinal amyloid pathology and proof-of-concept imaging trial in Alzheimer’s disease. JCI Insight 2: , 93621. |
[4] | Koronyo-Hamaoui M , Koronyo Y , Ljubimov AV , Miller CA , Ko MK , Black KL , Schwartz M , Farkas DL ((2011) ) Identification of amyloid plaques in retinas from Alzheimer’s patients and noninvasive in vivo optical imaging of retinal plaques in a mouse model. Neuroimage 54 Suppl 1: , S204–217. |
[5] | den Haan J , Morrema THJ , Verbraak FD , de Boer JF , Scheltens P , Rozemuller AJ , Bergen AAB , Bouwman FH , Hoozemans JJ ((2018) ) Amyloid-beta and phosphorylated tau in post-mortem Alzheimer’s disease retinas. Acta Neuropathol Commun 6: , 147. |
[6] | Chiquita S , Rodrigues-Neves AC , Baptista FI , Carecho R , Moreira PI , Castelo-Branco M , Ambrosio AF ((2019) ) The retina as a window or mirror of the brain changes detected in Alzheimer’s disease: Critical aspects to unravel. Mol Neurobiol 56: , 5416–5435. |
[7] | La Morgia C , Ross-Cisneros FN , Koronyo Y , Hannibal J , Gallassi R , Cantalupo G , Sambati L , Pan BX , Tozer KR , Barboni P , Provini F , Avanzini P , Carbonelli M , Pelosi A , Chui H , Liguori R , Baruzzi A , Koronyo-Hamaoui M , Sadun AA , Carelli V ((2016) ) Melanopsin retinal ganglion cell loss in Alzheimer disease. Ann Neurol 79: , 90–109. |
[8] | Anderson DH , Talaga KC , Rivest AJ , Barron E , Hageman GS , Johnson LV ((2004) ) Characterization of beta amyloid assemblies in drusen: The deposits associated with aging and age-related macular degeneration. Exp Eye Res 78: , 243–256. |
[9] | Alexandrov PN , Pogue A , Bhattacharjee S , Lukiw WJ ((2011) ) Retinal amyloid peptides and complement factor H in transgenic models of Alzheimer’s disease. Neuroreport 22: , 623–627. |
[10] | Berhanu WM , Yasar F , Hansmann UH ((2013) ) In silico cross seeding of Abeta and amylin fibril-like oligomers. ACS Chem Neurosci 4: , 1488–1500. |
[11] | Banks WA , Kastin AJ , Maness LM , Huang W , Jaspan JB ((1995) ) Permeability of the blood-brain barrier to amylin. Life Sci 57: , 1993–2001. |
[12] | Schultz N , Brannstrom K , Byman E , Moussaud S , Nielsen HM , Netherlands Brain Bank, Olofsson A , Wennstrom M ((2018) ) Amyloid-beta 1–40 is associated with alterations in NG2+ pericyte population ex vivo and in vitro. Aging Cell 17: , e12728. |
[13] | Braak H , Braak E ((1991) ) Neuropathological stageing of Alzheimer-related changes. Acta Neuropathol 82: , 239–259. |
[14] | Palmqvist S , Scholl M , Strandberg O , Mattsson N , Stomrud E , Zetterberg H , Blennow K , Landau S , Jagust W , Hansson O ((2017) ) Earliest accumulation of beta-amyloid occurs within the default-mode network and concurrently affects brain connectivity. Nat Commun 8: , 1214. |
[15] | Dutescu RM , Li QX , Crowston J , Masters CL , Baird PN , Culvenor JG ((2009) ) Amyloid precursor protein processing and retinal pathology in mouse models of Alzheimer’s disease. Graefes Arch Clin Exp Ophthalmol 247: , 1213–1221. |
[16] | Tsai Y , Lu B , Ljubimov AV , Girman S , Ross-Cisneros FN , Sadun AA , Svendsen CN , Cohen RM , Wang S ((2014) ) Ocular changes in TgF344-AD rat model of Alzheimer’s disease. Invest Ophthalmol Vis Sci 55: , 523–534. |
[17] | Campochiaro PA ((2013) ) Ocular neovascularization. J Mol Med (Berl) 91: , 311–321. |
[18] | Antes R , Salomon-Zimri S , Beck SC , Garcia Garrido M , Livnat T , Maharshak I , Kadar T , Seeliger M , Weinberger D , Michaelson DM ((2015) ) VEGF mediates ApoE4-induced neovascularization and synaptic pathology in the choroid and retina. Curr Alzheimer Res 12: , 323–334. |
[19] | Uddin MS , Kabir MT , Al Mamun A , Abdel-Daim MM , Barreto GE , Ashraf GM ((2019) ) APOE and Alzheimer’s disease: Evidence mounts that targeting APOE4 may combat Alzheimer’s pathogenesis. Mol Neurobiol 56: , 2450–2465. |
[20] | Fawver JN , Ghiwot Y , Koola C , Carrera W , Rodriguez-Rivera J , Hernandez C , Dineley KT , Kong Y , Li J , Jhamandas J , Perry G , Murray IV ((2014) ) Islet amyloid polypeptide (IAPP): A second amyloid in Alzheimer’s disease. Curr Alzheimer Res 11: , 928–940. |
[21] | Jackson K , Barisone GA , Diaz E , Jin LW , DeCarli C , Despa F ((2013) ) Amylin deposition in the brain: A second amyloid in Alzheimer disease? Ann Neurol 74: , 517–526. |
[22] | Oskarsson ME , Paulsson JF , Schultz SW , Ingelsson M , Westermark P , Westermark GT ((2015) ) In vivo seeding and cross-seeding of localized amyloidosis: A molecular link between type 2 diabetes and Alzheimer disease. Am J Pathol 185: , 834–846. |


