
An Exploratory Phase IIa Study of the PPAR delta/gamma Agonist T3D-959 Assessing Metabolic and Cognitive Function in Subjects with Mild to Moderate Alzheimer’s Disease
Abstract
Background:
T3D-959 is a chemically unique, brain penetrant, dual PPAR delta/gamma agonist with 15-fold higher PPAR delta selectivity. Ubiquitous brain expression of PPAR delta, its critical role in regulating glucose and lipid metabolism, and the Alzheimer’s disease (AD)-like phenotype of PPAR delta null mice motivated this study.
Objective:
To determine safety and tolerability of multiple doses of T3D-959 in subjects with mild to moderate AD, examine systemic and central drug pharmacology and in an exploratory manner, perform cognitive assessments.
Methods:
Thirty-four subjects with mild-to-moderate AD were orally administered 3, 10, 30, or 90 mg of T3D-959 daily for 14 days. There was no inclusion of a placebo arm. Safety and tolerability were monitored. Systemic drug pharmacology was examined via plasma metabolomics LC-MS-MS analysis, cerebral drug pharmacology via FDG-PET measures of changes in Relative CMRgl (R CMRgl, AD-effected regions relative to brain reference regions), and cognitive function assessed before and after drug treatment and again one week after completion of drug treatment, by ADAS-cog11 and the Digit Symbol Substitution Test (DSST).
Results:
T3D-959 was in general safe and well tolerated. Single point pharmacokinetics at the Tmax showed dose dependent exposure. Plasma metabolome profile changes showed dose-dependent systemic effects on lipid metabolism and metabolism related to insulin sensitization. Relative FDG-PET imaging demonstrated dose-dependent, regional, effects of T3D-959 on R CMRgl based on the use of multiple reference regions. ADAS-cog11 and DSST cognitive assessments showed improvements with possible ApoE genotype association and pharmacodynamics related to the mechanism of drug action.
Conclusions:
Exploratory data from this Phase IIa clinical trial supports further clinical investigation of T3D-959 in a larger placebo-controlled clinical study.
INTRODUCTION
The brain requires integral insulin signaling for metabolic homeostasis and neuronal plasticity. It has been proposed that resistance to the actions of insulin in the brain disrupts energy balance and signaling networks needed for a broad range of functions and may promote key pathologies in Alzheimer’s disease (AD), as evidenced by observed changes in levels of insulin signaling molecules in AD forebrains and associated changes in memory [1]. Impaired insulin signaling in neurons enhances apoptosis, promotes oxidative cell death induced by amyloid-β (Aβ)1-42, increases secretion of Aβ1-42, blocks removal of extracellular Aβ oligomers, and increases plaque loads [1–4].
Cerebral glucose hypometabolism is an early change in the AD brain that occurs prior to cognitive decline and is one of the better predictors of AD progression. Compared to age-matched controls, AD subjects show regional glucose hypometabolism [5], in specific brain regions including the hippocampus, parietotemporal areas, posterior cingulate cortex, and mediotemporal lobe which may be due to reductions in glycolytic flux [6]. Dysfunctional axon-oligodendrocyte metabolic coupling has also been implicated in AD [7]. Glucose hypo-metabolism causes decreased O-GlcNAcylation which regulates tau pathology and promotes neurodegeneration [8]. Insulin and IGF-1 resistance increase the activity of GSK-3β and CDK5 to increase tau phosphorylation leading to tau tangles [1].
A brain penetrant drug therapy targeting insulin-dependent signaling pathways could potentially enhance glucose metabolism in brain regions preferentially affected by AD, and in other brain regions, thereby improving the function of compromised, but viable, brain cells of different types [2]. Peroxisome proliferator-activated receptors (PPARs) are nuclear hormone receptors that function as transcription factors which regulate gene expression [9]. PPAR delta and PPAR gamma agonists target insulin-dependent pathways to produce insulin sensitizing, anti-inflammatory, and antioxidant therapeutic effects, and bypass insulin receptor resistance by directly activating insulin- and IGF-responsive target genes. PPAR gamma, while widely expressed peripherally, has restricted regional expression centrally. In contrast, PPAR delta is widely expressed throughout the brain and is enriched in brain areas involved in energy homeostasis [10]. In the hippocampus PPAR delta expression is enriched in the dentate gyrus/CA1 region while PPAR gamma expression is restricted to the CA3 region.
PPAR delta presents an attractive target in AD as evidenced by the phenotype of PPAR delta null mice which display many attributes of AD. These phenotypic traits include [11]: 1) cognitive impairment, 2) impaired canonical wnt signaling pathway, a key memory pathway, 3) increased tau phosphorylation, 4) increased inflammation in cerebral cortex, 5) altered myelination, 6) altered brain phospholipid composition, 7) inactivation of peroxisomal β oxidation, 8) increased oxidative stress (increase in malondialdehyde, decrease in Mn-SOD and glutathione), and 9) brain atrophy. Oral administration of a PPAR delta agonist in a transgenic mouse model expressing mutant form of human APP significantly reduces plaque burden and brain inflammation and increase expression of plaque degrading enzymes [12, 13]. PPAR delta agonists increase gene expression of the antioxidants catalase and SOD, suppress inflammation evoked by Aβ peptides, and inhibit astrocyte and microglia activation [12]. PPAR delta activation also stimulates the production of acetylcholine, a key neurotransmitter with an important role in learning.
PPAR delta agonists have not been studied clinically in AD. In clinical studies only PPAR gamma-selective agonists have been assessed in AD subjects and have demonstrated little or no success in improving cognitive and functional decline which may be attributed to improper dose selection, poor drug penetration into the brain, limited regional expression of the target PPAR gamma and/or ApoE genotype-specific differences in response [9]. Current clinical PPAR gamma-selective agonists have extensive pharmacologic, pharmacokinetic and ADME (Absorption, Distribution, Metabolism, Excretion) limitations such that their use in investigating a metabolic approach to AD drug therapy cannot be rationalized.
T3D-959 is an orally administered, brain penetrant, potent insulin sensitizer and regulator of multiple pathways involved in energy metabolism through its agonism of PPAR delta, its primary target. Uniquely, this drug also activates PPAR gamma, albeit at 15-fold lower potency, PPAR delta (human ED50 = 19 nM) and PPAR gamma (human ED50 = 297 nM) [14]. Activation of both PPAR delta and PPAR gamma may provide potential additive or synergistic effects in regulating dysfunctional brain energy metabolism in AD. T3D-959 has been tested in the sporadic AD rat model generated by the intracerebral administration of streptozotocin. In this model T3D-959, dosed therapeutically, significantly improved spatial learning and memory, significantly improved culture viability and brain morphology, reduced levels of oxidative stress and Aβ, and normalized expression of phospho-tau, choline acetyltransferase, and myelin-associated glycoprotein. T3D-959 also significantly improved motor performance, preserved cortical and normalized white matter structure, increased/normalized IGF-1R, IRS-1, Akt, p70S6K, and S9-GSK-3β, and decreased expression of multiple pro-inflammatory cytokines [14–16].
The therapeutic approach of using the PPAR delta/gamma dual agonist T3D-959 is based on two suppositions: 1) ameliorating multiple pathologies in the disease with a single therapy may provide a superior clinical benefit than therapeutic approaches which target only a single pathology and 2) correcting insulin resistance in the brain, a potential key driver of AD pathophysiology, may be disease modifying. The purpose of the exploratory clinical study described herein was to determine whether T3D-959 could safely be tested in a clinical setting at multiple doses and demonstrate expected systemic and brain pharmacology consistent with the action of a PPAR delta agonist, in a dose-dependent fashion. The systemic pharmacology of T3D-959 was assessed in a plasma metabolomic analysis, while cerebral pharmacology was assessed with FDG-PET neuroimaging.
Monitoring metabolites over a range of doses can provide powerful insight into the systemic pharmacological action of a potential therapeutic. Systemic data confirms the expected pharmacology of T3D-959 where it can be readily measured. Metabolomic data in the current study is of an exploratory nature monitoring more than 800 metabolites from multiple chemical classes. The metabolites are chemically defined, but their quantification is relative, not absolute.
Brain metabolic imaging using [18F] fluorodeoxyglucose positron emission tomography ([18F] FDG-PET) has consistently shown reductions in glucose utilization in vulnerable brain regions in sporadic AD [17]. The relative cerebral metabolic rate of glucose from FDG-PET studies (R CMRgl) is correlated with the severity of dementia [18–20]. FDG-PET can predict AD neuropathology and is included in the recent AD biomarker (ATN) guidelines from the NIA-AA. However, in this clinical study FDG-PET is being used to provide an indicator of T3D-959 brain pharmacodynamics. Changes in FDG-PET by a therapeutic that modulates brain glucose metabolism, such as a PPAR delta agonist, would provide indirect evidence of T3D-959 brain exposure.
ADAS-cog11 (Alzheimer’s Disease Assessment Scale, Cognitive Subscale 11) and DSST (Digit Symbol Substitution Test) were used to assess cognition and higher executive function respectively for each dose group. Cognitive data is limited in this study by a lack of placebo control, small numbers of subjects in each dose group, and the very short treatment period.
METHODS
Study design
This Phase IIa study was a randomized, parallel, 4-dose design in subjects with mild-to-moderate AD [Mini-Mental State Examination (MMSE) of 20–26 for mild and 14–19 for moderate]. A total of 36 subjects were randomized to one of 4 doses of T3D-959, 3 mg (n = 9), 10 mg (n = 9), 30 mg (n = 10), or 90 mg (n = 8) administered orally once-a-day for 14 days then followed-up at day 21 (7-days post-dosing discontinuation).
The study was designed as an open-label study, where subjects (and caregivers), study personnel and investigators were knowledgeable of dose, but the imaging evaluators and clinical laboratory assessors were blinded. The study was not placebo-controlled; observations of intra-subject changes in metabolome profile and relative CMRgl (via FDG-PET) were of primary importance in this mechanistic feasibility study where each subject serves as its own control; metabolomic profiling and neuroimaging scans obtained at baseline being the control for data acquired after study drug administration. The study population enrolled included males and females, aged 50–90 years, who met the following key criteria: 1) mild-to-moderate AD with MMSE score of 14 through 26 at visit 1, 2) Clinical Dementia Rating = 0.5 to 2.0 at visit 1, 3) modified Hachinski less than or equal to 4 at visit 1, 4) a clinical diagnosis of AD per NINCDS-ADRDA criteria.
Stable doses of current AD therapy were allowed. Diabetic or impaired glucose tolerant subjects were allowed to be on stable doses of current therapies for glucose control with the exceptions of insulin and PPAR gamma agonists.
Subjects were evaluated for changes in efficacy measures from baseline (BL) to end of drug treatment (EOT) at day 14 and for changes from baseline to follow-up (FU) at day 21 (7-days post-dosing discontinuation). Safety and tolerability to T3D-959 were monitored throughout the study. Detailed description of the clinical protocol, including the inclusion and exclusion criteria, are detailed in clinicaltrials.gov, listing NCT02560753.
Study assessments: Pharmacokinetics and safety
Approximate steady state plasma concentrations of T3D-959 at single time points were determined for all four dose groups. Plasma samples were taken on the last day of dosing (day 14) 3–4 h after dose administration, the approximate Tmax observed in Phase 1 studies in normal healthy volunteers. Safety monitoring parameters in this clinical study were assessed as required by the FDA.
Study assessments: Metabolomics
For all subjects, venous blood was drawn after a minimal 4-h fast for metabolomic profiling at BL and EOT. Plasma samples were split into equal parts for analysis on LC/MS/MS, and Polar LC platforms. Plasma samples for metabolomics analysis were assayed by Metabolon Inc. (Morrisville, NC) using Metabolon’s global untargeted biochemical profiling platform (DiscoveryHD4TM) [21]. Classes of metabolites in the DiscoveryHD4TM platform include: Amino Acids, Carbohydrates, Lipids, Nucleotides, Microbiota Metabolites, Energy Metabolites, Cofactors and Vitamins, Xenobiotics, and Novel Metabolites. In this study, a total of 821 metabolites were assessed. Proprietary software was used to match ions to an in-house library of standards for metabolite identification and for metabolite quantitation by peak area integration. Metabolite matched structures in the Metabolon reference library, and their relative quantitation (relative to added internal standards) was determined. Two-way Repeated Measures Analysis of Variance (ANOVA) were used to analyze the natural log-transformed metabolomics data. Multiple analyses of metabolomics data were done, but the data presented herein involves statistical analyses of calculated fold changes for the four different dose groups from baseline to end of treatment.
Study assessments: FDG-PET
The cerebral metabolic rate of glucose utilization can be collected in either an absolute manner and expressed in units of amount of glucose, volume and time CMRgl (μg cm–3 min–1), or the FDG-PET data can be reported as a unitless ratio of a brain region of interest to a reference region such as average whole brain (Relative CMRgl or R CMRgl). The extensive and ongoing collection of FDG-PET data in the Alzheimer’s Disease Neuroimaging Initiative (ADNI) data set is of the latter type (R CMRgl) collected with a protocol that uses 5 mCi of [18F]-fluorodeoxyglucose, and six dynamic 3D 5-min frames collected 30–60 min post injection [22]. An absolute FDG-PET protocol collects 3D images starting immediately after the injection of [18F]-fluorodeoxyglucose. The current study followed the ADNI protocol and provides, unitless, relative rates of cerebral glucose metabolism only (R CMRgl). This method is technically easier and less demanding on patients; however, the results are more difficult to interpret especially in a therapeutic setting where CMRgl in the reference region(s) may also be affected by drug. It should be emphasized that the purpose of the FDG PET data in this study is to provide indirect evidence of T3D-959 brain penetration.
The neuroimaging component of this study was performed in collaboration with the Banner Alzheimer’s Institute. FDG-PET scans were obtained at baseline and again at end of the 14-day drug treatment for subjects in all four dosage groups. The imaging protocol developed for the ADNI2 was used to collect the data [22]. Fasted subjects (blood glucose <180 mg/dL) received IV injection of 5 mCi [F18]-fluorodeoxyglucose as a single bolus. Thirty minutes after dosing, six 5-min (total 30-min) emission scans were acquired in an eyes open state. The inter-frame, realigned FDG-PET multiple frame images were smoothed to 8 mm full-width-half-maximum (FWHM), and then averaged for each subject and at each time point. The EOT FDG-PET scan was then realigned to the BL FDG-PET scan using SPM8 (http://www.fil.ion.ucl.ac.uk/spm/). The realigned EOT FDG-PET scan and BL FDG-PET scan were linearly and nonlinearly transformed to the Montreal Neurological Imaging (MNI) template. Partial volume corrections were avoided by limiting comparisons to all grey matter or all white matter. The raw data for each dose group was analyzed at the Banner Alzheimer’s Institute to provide three main outcome measures.
One of the three major outcome measures from the FDG-PET studies was change in relative cerebral metabolic rate of glucose, ΔR CMRgl (EOT-BL), for an empirically pre-specified statistical region of interest (sROI) known to be affected by AD, normalized by an AD-spared reference region. This unitless measure of AD related glucose hypometabolism is designated: sROIindex. This approach was developed using data from ADNI and may provide improved statistical power for evaluation of treatment effects in multi-center AD treatment trials [23]. This outcome provides a single unitless value (ΔsROI index) for each dose group over the treatment period (EOT-BL). In the untreated disease population sROIindex would be expected to decrease over time so ΔsROI index would be negative over a significant time period. In a short therapeutic setting with a PPAR agonist, the ΔsROIindex might be expected to increase; however, this interpretation is complicated by possible drug-induced changes in the “AD spared” reference region used in the calculations.
A second main outcome measure was the determination of the Δ R CMRgl (EOT-BL) for four pre-specified anatomical regions of interest (ROIs) known to be involved in AD: 1) posterior cingulate (PC), 2) precuneus (PreC), 3) bilateral middle temporal gyrus (BMTG), and 4) right inferior parietal lobe (RIPL). The Δ R CMRgl (EOT-BL) for each ROI was calculated using two different reference regions (RR) to help interpret the relative FDG-PET neuroimaging data. The data from this outcome is a table of Δ R CMRgl (EOT-BL) for each of the four ROIs calculated for each RR. The Δ R CMRgl (EOT-BL) values would not be expected to change due to disease over 2-weeks, but over the longer-term values would be negative. In response to a PPAR delta agonist, these values might be expected to increase over two weeks of treatment; however, because R CMRgl (EOT-BL) is a ratio of ROI to RR, the change could also be negative.
The third main outcome measure was a voxel-wise, statistical parametric mapping (SPM), analysis of the whole brain, to determine regions of statistically significant differences (ROSD) at the voxel level, where for each voxel ΔR CMRgl (EOT-BL) is statistically significant (p < 0.005). Again, this was done using two separate RR. It should be noted that ROSDs do not capture the magnitude of Δ R CMRgl (EOT-BL) for each voxel, instead it is collection of voxels where that change is statistically significant. A more stringent p value (0.005) is used to compensate for the lack of correction for multiple comparisons. The voxel-wise analysis provides an extensive series of brain images with ROSDs shown in yellow. The yellow area in each image can represent either a positive or a negative ROSD. An increase in the spatial extent of negative ROSDs would be expected in a voxel-wise analyses of AD subjects with an interval between scans of greater than 6 months. In response to a PPAR delta agonist the initial presumption would be that the spatial extent of the positive ROSDs would increase with increasing dose, with the caveat that drug could also have a measurable effect in the RR used to determine the ROSD, and thus negative ROSDs could result. To help understand the relative FDG-PET data, given the ubiquitous cerebral expression of PPAR delta, two different RR, average whole brain grey matter (WB), and brain white matter, corpus callosum, and centrum semiovale (WM), were used in the calculation of all three major outcomes, ΔsROIindex, ΔR CMRgl (EOT-BL) for four anatomical ROIs, and the voxel-wise SPM analysis.
Study assessments: Cognitive tests
ADAS-cog11 and DSST were administered four times: at pre-screening (1 to 3 weeks prior to randomization), at BL, at end of treatment Day 14 (EOT), and at Day 21 follow-up (FU). Change from baseline results from day 1 to days 14 (EOT-BL) and 21 (FU-BL) were summarized by dose group using the intent-to-treat population.
RESULTS
Subject disposition
The disposition of subjects screened and enrolled in this study is summarized in Table 1. Thirty-four subjects completed the study. Two subjects discontinued treatment. Subject 1006 (3 mg) was an 85-year-old female who discontinued due to unstable medical condition of deep vein thrombosis. This condition was noted as present at screening, but required intervention with medication on study day 2. The subject was discontinued. Subject 1001 (30 mg) was an 87-year-old male who developed weakness in his legs and requested to discontinue. Because there is no EOT feasibility data for either subject, these subjects are not included in the summaries of change from baseline results for metabolomics, imaging, or cognitive assessments.
Table 1
Summary of subject disposition
| 3 mg (N = 9) | 10 mg (N = 9) | 30 mg (N = 10) | 90 mg (N = 8) | |
| Subjects Randomized | 9 | 9 | 10 | 8 |
| ITT/Safety Population | 9 (100%) | 9 (100%) | 10 (100%) | 8 (100%) |
| mITT Population | 8 (89%) | 9 (100%) | 9 (90%) | 8 (100%) |
| Number Discontinued | 1 (11%) | 0 | 1 (10%) | 0 |
| Reasons for Discontinuation [2]: | ||||
| Adverse Event (Not Death) | 0 | 0 | 0 | 0 |
| Subject Decision to Withdraw | 0 | 0 | 1 (10%) | 0 |
| Physician Decision to Withdraw | 0 | 0 | 0 | 0 |
| Death | 0 | 0 | 0 | 0 |
| Other | 1 (11%) | 0 | 0 | 0 |
Subject baseline demographics and characteristics
The average age was 75 years with subjects ranging between ages of 57 and 90. Males and females were equally represented across all dose levels. The majority were non-Hispanic and of white origin. In the total study population, 17 subjects were ApoE4 positive and 17 were ApoE4 negative. One half of the subjects (n = 17) had mild AD (MMSE = 20–26) and one half (n = 17) had moderate AD (MMSE = 14–19). See Table 2.
Table 2
Patient demographics and baseline characteristics for each dose arm
| 3 mg (N = 9) | 10 mg (N = 9) | 30 mg (N = 10) | 90 mg (N = 8) | |
| Age (y) | ||||
| Mean (STD) | 75 (10.0) | 71 (8.2) | 76 (11.4) | 75 (7.4) |
| Median | 75 | 71 | 75 | 77 |
| Min-Max | 60–88 | 57–82 | 61–90 | 61–84 |
| Age Group | ||||
| ≤65 y | 2 (22%) | 2 (22%) | 3 (30%) | 1 (13%) |
| 65–74 y | 2 (22%) | 4 (44%) | 2 (20%) | 2 (25%) |
| 75–84 y | 3 (33%) | 3 (33%) | 1 (10%) | 5 (63%) |
| >84 y | 2 (22%) | 0 | 4 (40%) | 0 |
| Gender | ||||
| Male | 4 (44%) | 4 (44%) | 4 (40%) | 4 (50%) |
| Female | 5 (56%) | 5 (56%) | 6 (60%) | 4 (50%) |
| Ethnicity | ||||
| Hispanic or Latino | 0 | 2 (22%) | 2 (20%) | 1 (13%) |
| Not Hispanic or Latino | 9 (100%) | 7 (78%) | 8 (80%) | 7 (88%) |
| Race | ||||
| White | 9 (100%) | 7 (78%) | 9 (90%) | 8 (100%) |
| Black or African | 0 | 2 (22%) | 1 (10%) | 0 |
| ApoE ɛ4 Genotype | ||||
| None (W/W) | 6 (67%) | 2 (22%) | 5 (50%) | 5 (63%) |
| 1 allele (W/4) | 1 (11%) | 6 (67%) | 4 (40%) | 2 (25%) |
| 2 alleles (4/4) | 2 (22%) | 1 (11%) | 1 (10%) | 1 (13%) |
| Weight (kg) | ||||
| Mean (STD) | 66.4 (14.50) | 82.0 (14.47) | 74.3 (13.48) | 65.1 (14.23) |
| Median | 63.2 | 84.4 | 71.2 | 66.1 |
| Min-Max | 45–95 | 57–99 | 59–99 | 44–86 |
| Height (cm) | ||||
| Mean (STD) | 168.4 (11.49) | 169.9 (12.66) | 167.9 (8.66) | 164.9 (11.68) |
| Median | 168.0 | 167.0 | 168.5 | 160.0 |
| Min-Max | 150–187 | 152–189 | 158–180 | 152–186 |
| BMI (Kg/m2) | ||||
| Mean (STD) | 23.2 (3.66) | 28.1 (4.81) | 25.8 (5.15) | 23.9 (4.17) |
| Median | 23.0 | 27.3 | 25.1 | 23.0 |
| Min-Max | 16–29 | 22–36 | 18–33 | 19–32 |
| Mini Mental State Exam | ||||
| Mean (STD) | 19.0 (3.94) | 19.9 (3.69) | 22.4 (2.76) | 18.8 (3.01) |
| Median | 19.0 | 19.0 | 23.0 | 17.5 |
| Min-Max | 14–25 | 15–26 | 18–26 | 15–24 |
| Clinical Dementia Rating | ||||
| Mean (STD) | 3 (33%) | 5 (56%) | 5 (50%) | 2 (25%) |
| Median | 2 (22%) | 0 | 4 (40%) | 3 (38%) |
| Min-Max | 4 (44%) | 4 (44%) | 1 (10%) | 3 (38%) |
| Hachinski Score | ||||
| Mean (STD) | 0.4 (0.88) | 0.6 (0.53) | 0.9 (0.88) | 0.9 (0.83) |
| Median | 0 | 1.0 | 1.0 | 1.0 |
| Min-Max | 0–2 | 0–1 | 0–3 | 0–2 |
Pharmacokinetics
Steady state plasma concentrations of T3D-959 at single time points close to Tmax (4 h) were determined for all four dose groups. Results were consistent with previous Phase I human exposure data and were roughly dose proportional, with approximately 29 ng/mL observed in plasma for every mg dosed (Table 3). T3D-959 at 10 ng/mL is equal to approximately 25 nM. Thus, even at the lowest 3 mg dose, the Cmax values for T3D-959 are well above the PPARδ ED50 (19 nM). Assuming a 35% brain to plasma ratio, based on pre-clinical rat studies, brain concentrations of a 3 mg T3D-959 oral dose would also be well above the PPARδ ED50 near Tmax. Approximate Cmax values are roughly dose proportional with a R2 value of 0.996.
Table 3
Tmax (4 h) T3D-959 plasma concentrations (Day 14) and estimated brain concentrations
| 3 mg (N = 9) | 10 mg (N = 9) | 30 mg (N = 10) | 90 mg (N = 8) | |
| Approximate | ||||
| Cmax (ng/mL) | ||||
| Mean (STD) | 86.5 (57.9) | 290 (128) | 763 (447) | 2765 (1450) |
| Median | 65.9 | 244 | 540 | 2360 |
| Min – Max | 16–174 | 128–464 | 282–1650 | 1120–4970 |
| Estimated brain ED50 Multiples* at Tmax | ||||
| PPAR delta | 3.6X | 12.0X | 31.7X | 114.9X |
| PPAR gamma | 0.3X | 0.8X | 2.0X | 7.4X |
*Calculated based on 35% brain to plasma ratio in rats
Safety
A total of 4 subjects (11%) experienced 8 adverse events of which there were not serious or severe adverse events (see Table 4). Only one event was considered to be treatment related. The adverse event of muscular weakness was assessed by the investigator as related due to missing other known reasons and the timely association to the study treatment, and resolved one day later. One clinically significant ECG finding was observed for another subject on Day 14. This subject had a QTcF of 419 ms on Day 1, and 458 ms on Day 14. This finding resolved by the follow-up visit. There were no clinically significant abnormal laboratory results, no clinically significant vital sign changes, no weight or respiratory changes, and no increases in suicidal behaviors. T3D-959 at these four doses appears to be safe and well tolerated in elderly subjects with mild to moderate AD with no apparent side effects associated with PPAR gamma agonism. In an 18-week extension sub-study involving 4 subjects (dosed 15 mg q.d.) who completed the main 2-week study, there were no clinically significant abnormal laboratory results, no clinically significant vital sign changes, and no increases in suicidal behaviors and no tolerability issues.
Table 4
Summary of adverse events
| 3 mg (N = 9) | 10 mg (N = 9) | 30 mg (N = 10) | 90 mg (N = 8) | |
| Subjects with at Least One Adverse Event | 2 (22%) | 0 | 2 (20%) | 0 |
| Total Number of Events | 3 | 0 | 5 | 0 |
| Subjects with at Least One Serious Adverse Event | 0 | 0 | 0 | 0 |
| Total Number of Events | 0 | 0 | 0 | 0 |
| Subjects with at Least One Drug-related Adverse Event | 0 | 0 | 1 (10%) | 0 |
| Total Number of Events | 0 | 0 | 1 | 0 |
| Subjects with at Least One Adverse Event Rated as Mild | 2 (22%) | 0 | 1 (10%) | 0 |
| Total Number of Events | 2 | 0 | 1 | 0 |
| Subjects with at Least One Adverse Event Rated as Moderate | 1 (11%) | 0 | 2 (20%) | 0 |
| Total Number of Events | 1 | 0 | 4 | 0 |
| Subjects with at Least One Adverse Event Rated as Severe | 0 | 0 | 0 | 0 |
| Total Number of Events | 0 | 0 | 0 | 0 |
Effects of T3D-959 on the plasma metabolome
Fasted plasma metabolomics biomarkers were examined seeking evidence of systemic pharmacological effects of T3D-959 to confirm the expected pharmacology of a PPAR delta agonist. It would be expected that systemic and central pharmacology would be similar, although no direct measure of central pharmacology such as CSF metabolomics were made. Over 800 chemically defined metabolites were examined for each dose group and a ratio before and after drug treatment (EOT/BL) was calculated with an associated p value. In general, the 30 and 90 mg T3D-959 dose groups had the largest impact on the metabolomics profile, each with 120 metabolite changes with p < 0.05, while the 3 and 10 mg groups had smaller effects (40 and 61 metabolite changes with p < 0.05, respectively). Metabolites were split into 60 families. Several of these families showed consistent and significant changes with T3D-959 treatment. All three branched chain amino acids (BCAA), Leu, Ile, and Val were significantly decreased (p < 0.05) in the 90 mg T3D-959 group. BCAAs are positively correlated with insulin resistance and diabetes [24, 25]. Supporting this observation, several key products of BCAA catabolism in the form of acyl carnitines are similarly decreased in treatment in the 90 mg group (Table 5). Some of these metabolites, such as isovaleryl and isobutyryl carnitine are part of a principal component shown to be positively associated with insulin resistance [24, 25].
Table 5
T3D-959 elicited changes in branched chain amino acids
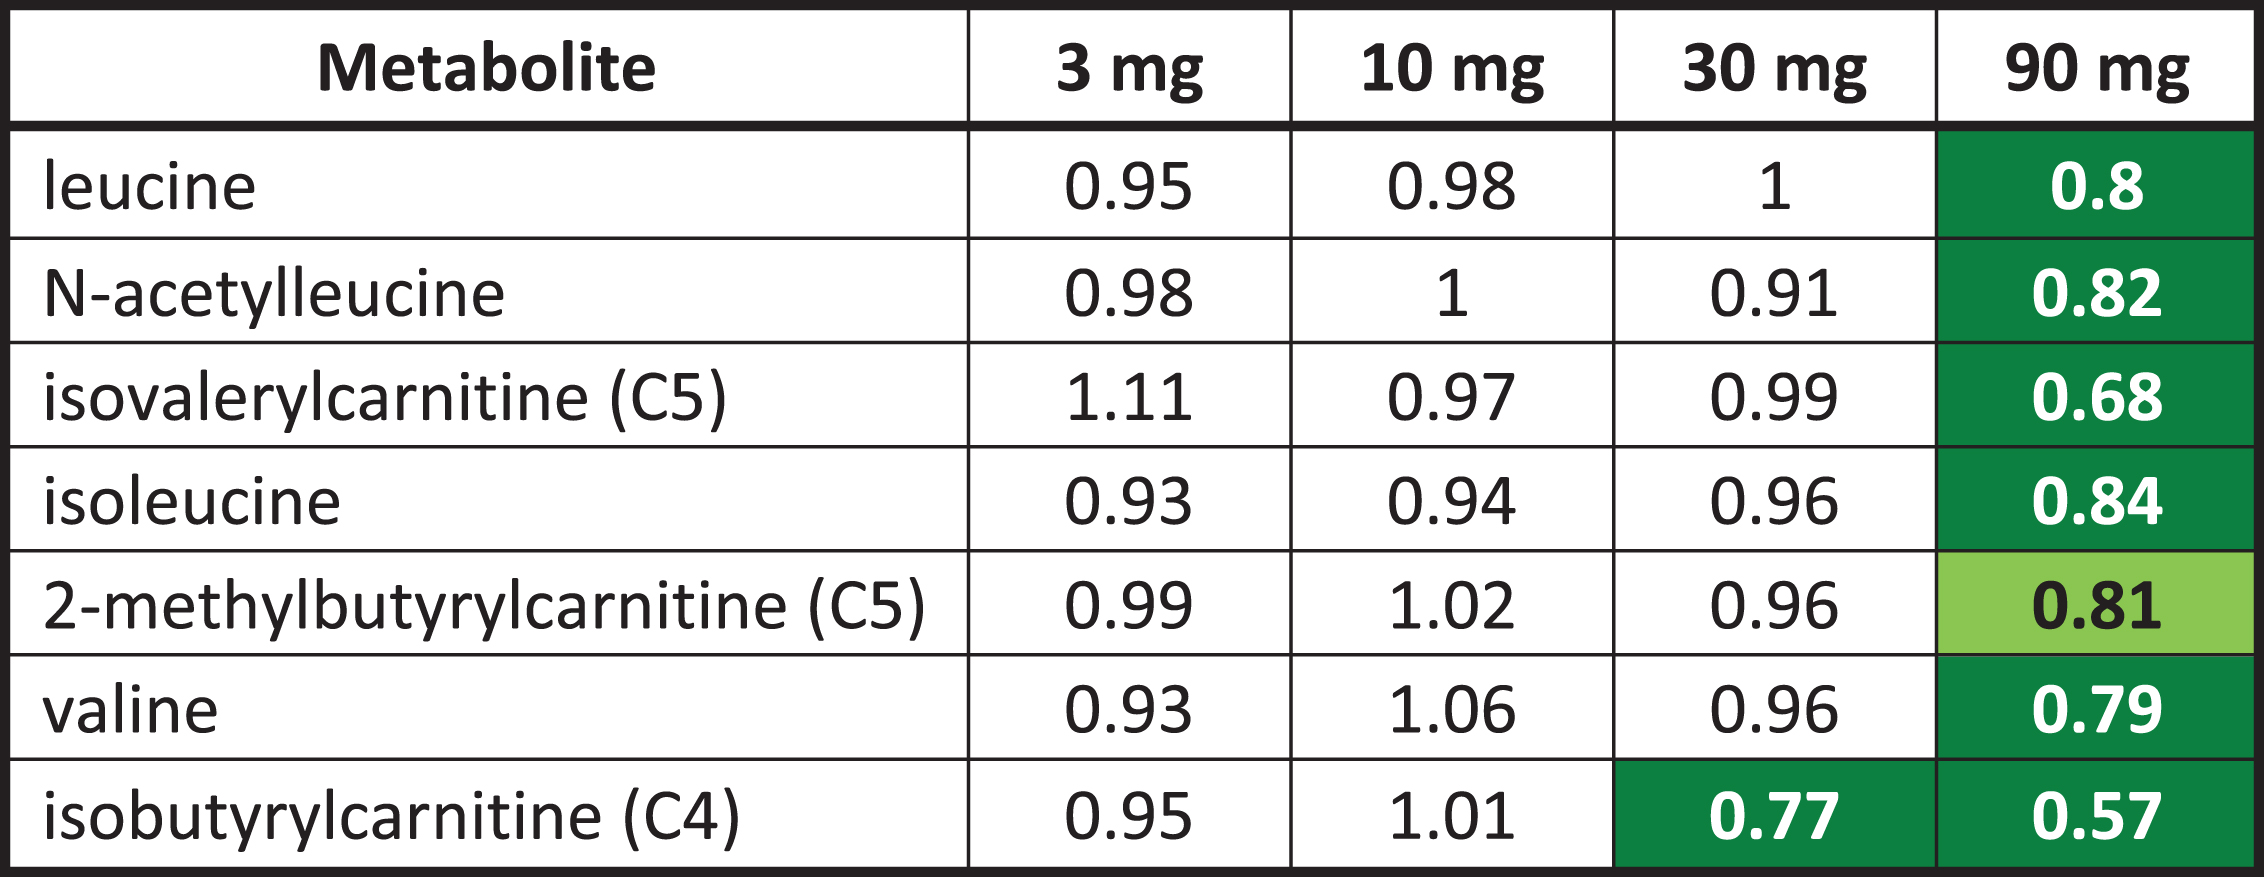 |
Numbers are ratios of the dose group averages end of treatment (EOT) to baseline (BL). Green highlighted numbers indicate a statistically significant (p < 0.05) decrease in metabolite. The light green highlighted number indicates the p value is between 0.05 and 0.1. Statistical comparisons between doses and visits were conducted using Two-Way Repeated Measure ANOVA.
A limited number of ceramides (8) and N-acyl sphingosines (2) were included in the exploratory metabolomic analysis. T3D-959 decreased the levels of several ceramides, including N-palmitoyl and N-stearoyl sphingosine at the higher doses, as shown in Table 6. Ceramides are postulated to be mediators of insulin resistance and metabolic disease. Recent reports suggest strong association of specific ceramide species (e.g., C16:0, or N-palmitoyl-sphingosine) with metabolic diseases [26].
Table 6
T3D-959 elicited changes in ceramides
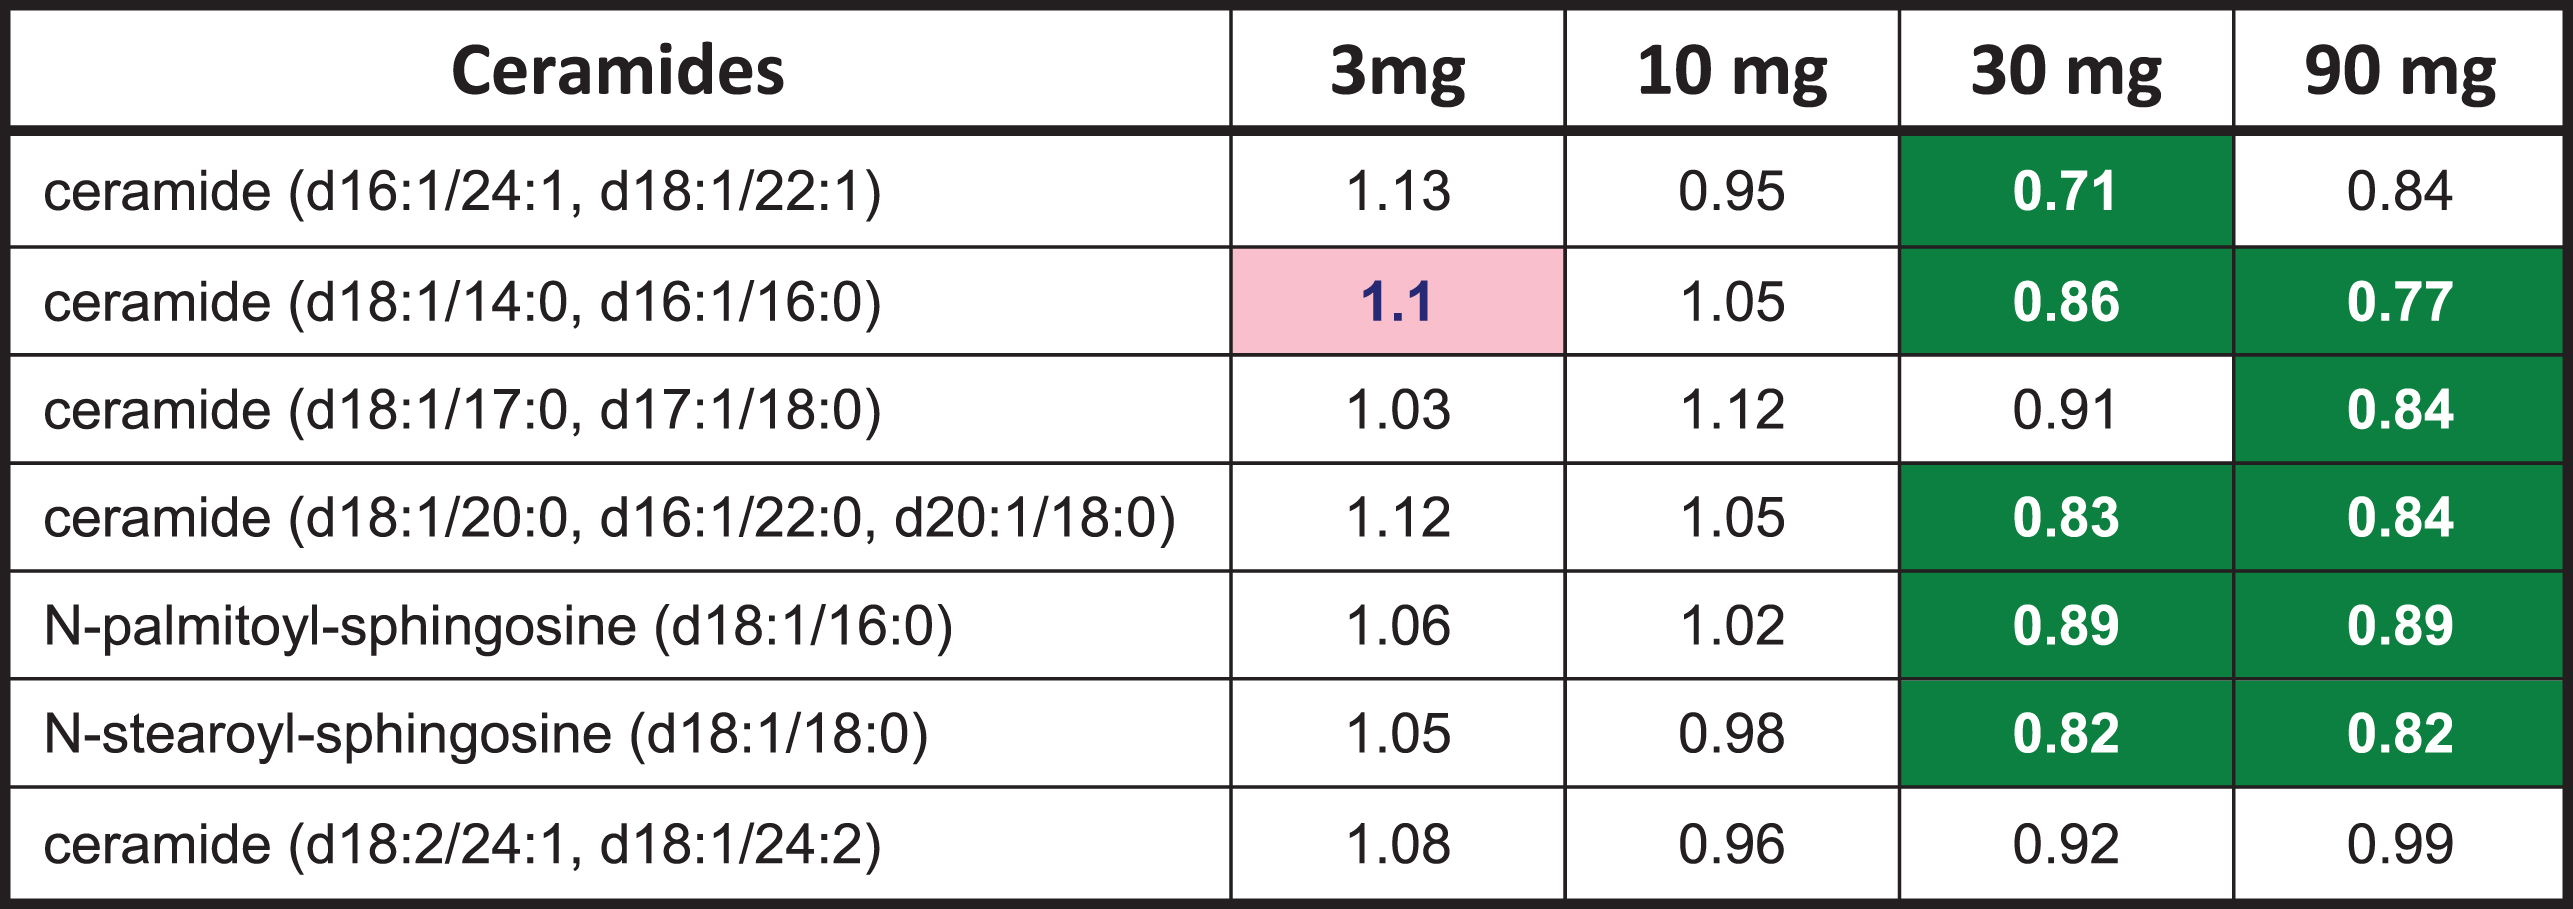 |
Numbers are ratios of the dose group averages end of treatment (EOT) to baseline (BL). Green highlighted numbers indicate a statistically significant (p < 0.05) decrease in metabolite. Statistical comparisons between doses and visits were conducted using Two-Way Repeated Measure ANOVA.
The overall profile from the metabolomic data suggests that higher doses of T3D-959 increased fatty acid oxidation. Thirty-three (33) acyl carnitine species were measured in this metabolomic analysis. The two highest doses of T3D-959 increased a wide array of these fatty acid-derived acylcarnitine species, ranging from the end-product C2 (acetyl) carnitine through the even-chain medium (C4 to C12) and long chain (C14-C22) species (Table 7). This profile is consistent with increased flux of fatty acids into the beta-oxidation pathway [27].
Table 7
T3D-959 increases levels of acyl carnitines
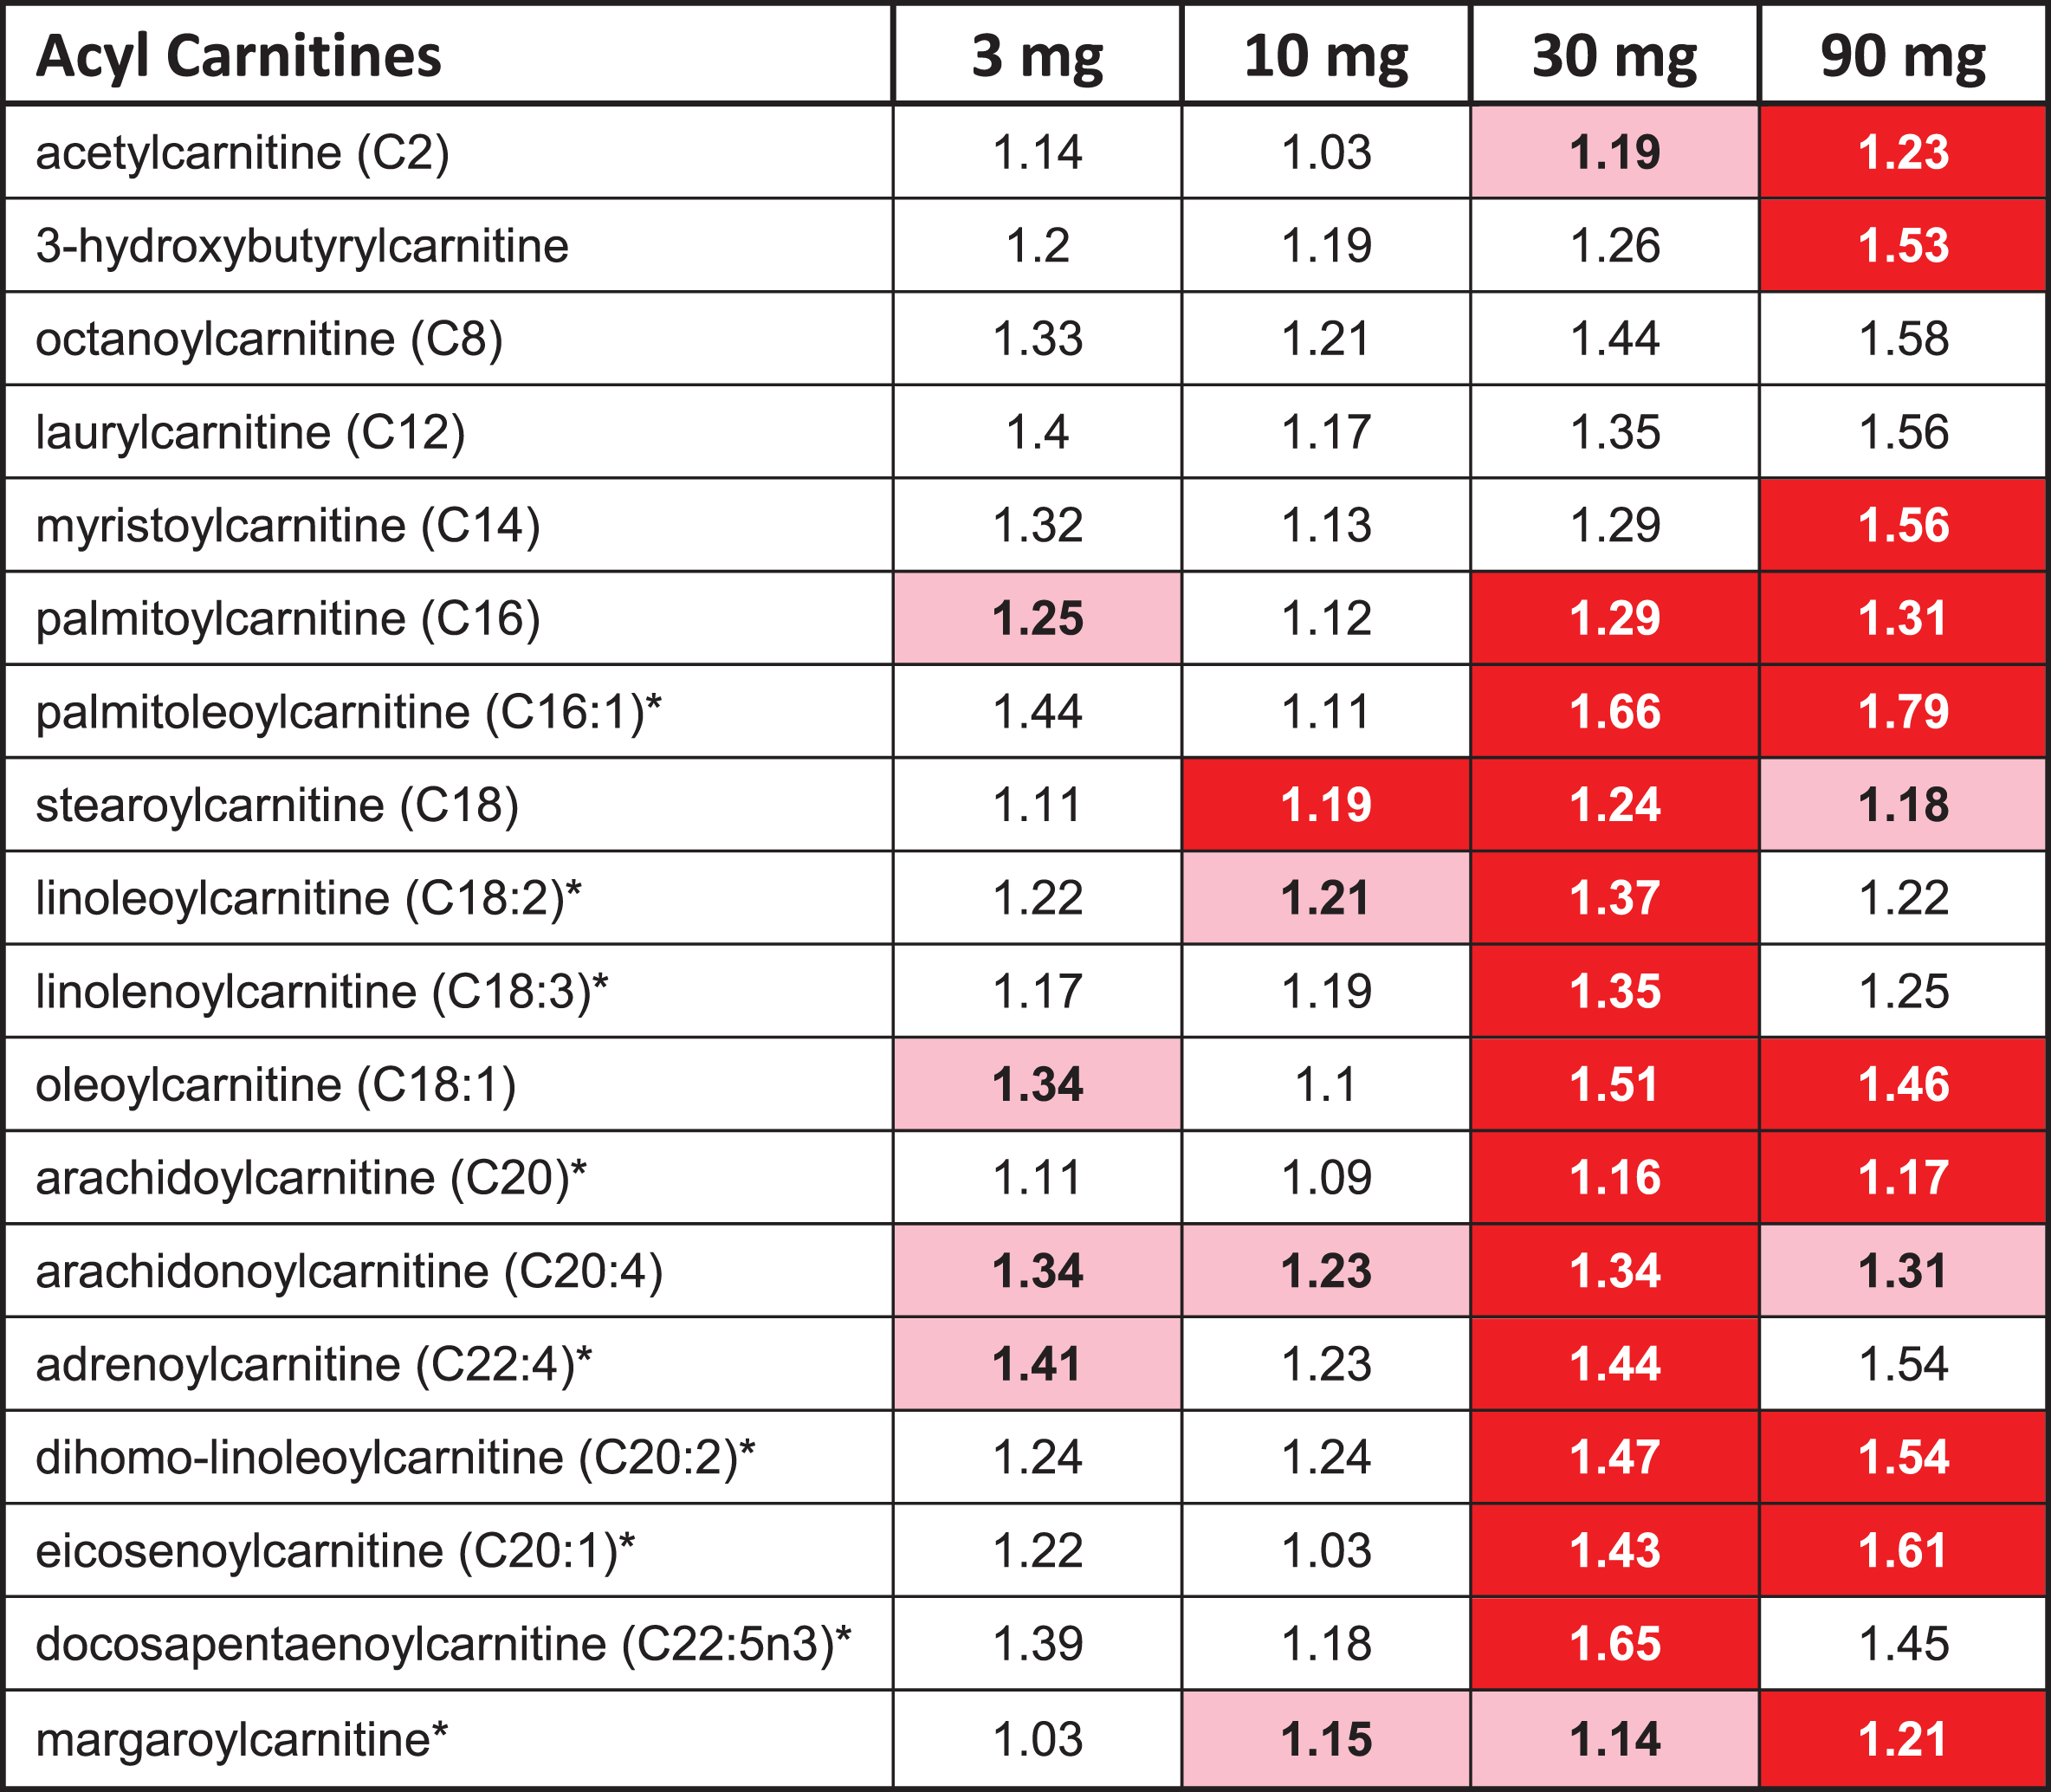 |
The red highlighted entries in Table 7 indicate a statistically significant (p < 0.05) increase in the ratio (EOT/BL) for a metabolite, while pink indicates a p value between 0.05 and 0.1.
Consistent with a profile of decreased insulin resistance, the ratio of glycine levels (EOT/BL) was increased to 1.26 (p < 0.05) in the highest dose group. Glycine is negatively correlated to insulin resistance and diabetes [24]. Another interesting observation from the data was a significant increase in six of eleven measured plasmalogens (data not shown). Decreases in plasmalogens have been postulated to correlate to AD [28].
Effects of T3D-959 on relative brain glucose metabolism: FDG-PET neuroimaging
T3D-959 alters cerebral metabolism of glucose in a dose-dependent manner
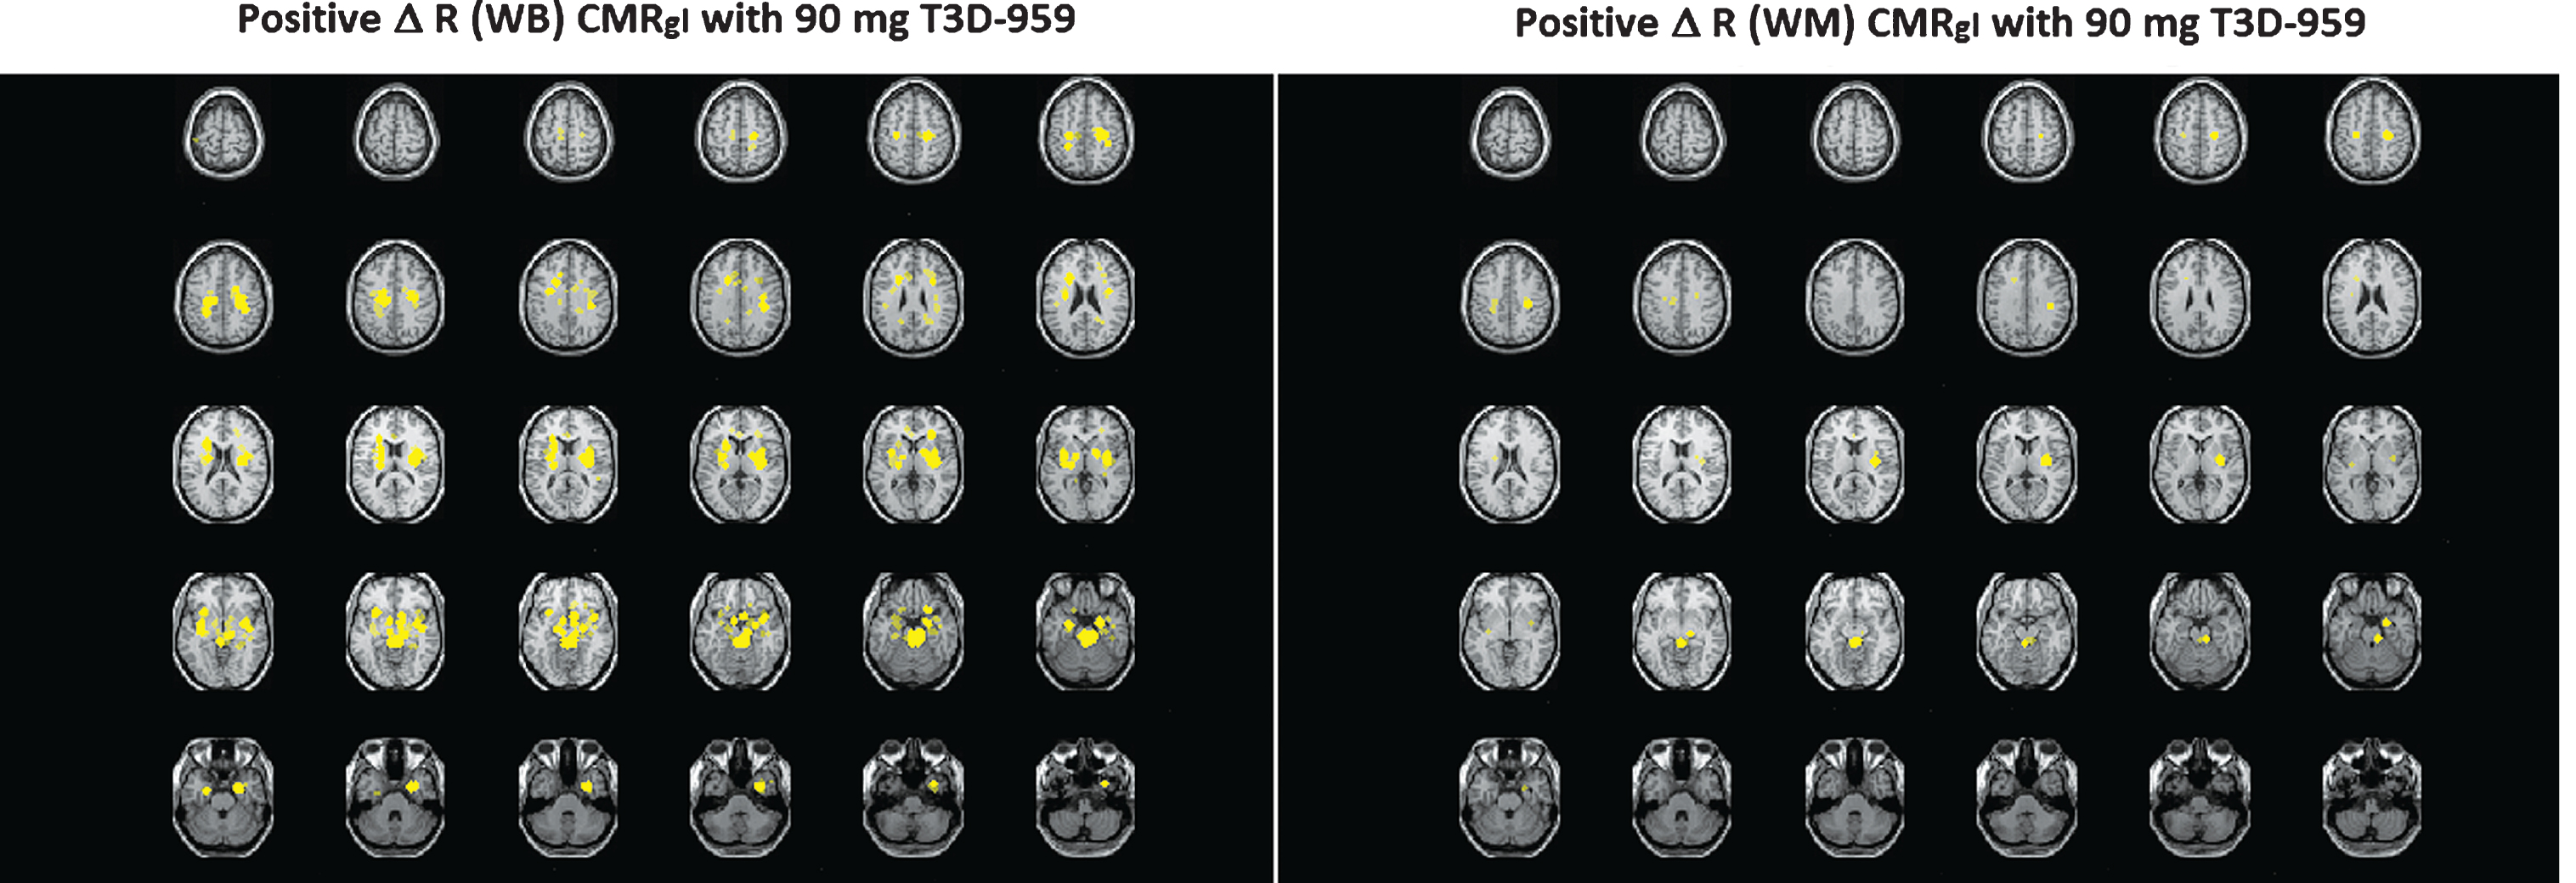
Data from all three major FDG-PET outcomes [Δ sROIindex, Δ R CMRgl (EOT-BL) for four anatomical ROIs, and the voxel-wise SPM analysis] demonstrate that T3D-959 alters cerebral glucose metabolism in a dose-dependent fashion. Higher doses of T3D-959 clearly have larger effects on the major FDG-PET outcomes than the lower doses, as shown by the Δ sROIindex and anatomical ROI analyses as well as the exploratory voxel-wise SPM analysis. From the voxel-wise analysis data, with average WB as the RR, Fig. 1 shows a numerical increase in the spatial extent of the yellow regions as the dose increases from 10 mg to 90 mg. There is a significant trend (R2 = 0.998, p = 0.026) from 10 mg (70 voxels), to 30 mg (518 voxels), to 90 mg (2136 voxels). The absolute number of highlighted voxels is small because they represent changes in the ratio of rates of cerebral glucose metabolism, and because the p value is set to 0.005 to compensate for lack of a multiple comparisons correction. For the 3 mg group, the positive ROSD is made up of 863 voxels; however, it has an unusual unilateral pattern with the ROSD occurring on the left side of the brain.
Fig.1
Regions of Statistically Significant Differences (ROSDs) with Positive Δ R CMRgl (EOT-BL) Relative to Whole Brain (p < 0.005) for the four dose groups. Voxel-wise SPM Analysis. Yellow regions (ROSD) represent voxels with statistically significant increases from baseline (BL) to end of treatment (EOT) (positive ΔR CMRgl (EOT – BL)>0, p = 0.005). ROSDs are defined as brain regions where Δ R CMRgl = [voxeli(EOT) / RRave (EOT)] – >0 or <0, with a p value < 0.005 across a dose group. ROSDs are referred to as positive (Δ R CMRgl>0) or negative (Δ R CMRgl<0) ROSDs, and are strictly spatial regions, shown as yellow regions in the image displays. The spatial extent of an ROSD can be quantified by the number of voxels in an ROSD.
![Regions of Statistically Significant Differences (ROSDs) with Positive Δ R CMRgl (EOT-BL) Relative to Whole Brain (p < 0.005) for the four dose groups. Voxel-wise SPM Analysis. Yellow regions (ROSD) represent voxels with statistically significant increases from baseline (BL) to end of treatment (EOT) (positive ΔR CMRgl (EOT – BL)>0, p = 0.005). ROSDs are defined as brain regions where Δ R CMRgl = [voxeli(EOT) / RRave (EOT)] – >0 or <0, with a p value < 0.005 across a dose group. ROSDs are referred to as positive (Δ R CMRgl>0) or negative (Δ R CMRgl<0) ROSDs, and are strictly spatial regions, shown as yellow regions in the image displays. The spatial extent of an ROSD can be quantified by the number of voxels in an ROSD.](https://content.iospress.com:443/media/jad/2020/73-3/jad-73-3-jad190864/jad-73-jad190864-g001.jpg)
Other images from the voxel-wise analysis capture this dose dependent effect, for example, the negative ROSD calculated with whole brain grey matter as the RR showed a statistically significant (p = 0.024) difference between the 3 mg dose 55 voxels and the 90 mg dose 9655 voxels (image not shown). Dose dependent effects were also observed in the anatomical ROI analysis and the Δ sROIindex analysis, and are discussed below.
Brain glucose metabolism in WM and WB RR are differentially altered by T3D-959
Increases and decreases in relative regional glucose metabolism (Δ R CMRgl (EOT-BL) were observed over the treatment period in the three major FDG-PET outcomes. Two RR, average WB and average cerebral WM, were used to help interpret the relative FDG-PET data in the possible event that whole brain grey matter or white matter CMRgl were preferentially affected by T3D-959. One explanation for drug-elicited “decreases” in regional Δ R CMRgl values may be that the RR used to calculate this value may also be affected by T3D-959 since its primary target, PPAR delta, is ubiquitously expressed in the brain. In addition, similar changes in both cortical and RR reduce our sensitivity to detect changes in regional-to-RR CMRgl by normalizing out the regional effect. A visual representation of the observed differences in the two RR is shown in Fig. 2. This data comes from comparison of SPM results calculated with WB and WM RRs, and shows the ROSDs with positive Δ R CMRgl (EOT-BL) (p < 0.005) when WB and WM are used as RRs, as yellow regions.
Fig.2
Comparison of Slice by Slice Image Displays of ROSDs with Positive Δ R CMRgl (EOT-BL) (p < 0.005) when WB and WM are used as RRs.
It should be noted that the positive ROSDs identified with WB and WM are in similar brain regions, but the spatial extent of the positive ROSD calculated with WB is greater than that calculated with WM as the RR. One interpretation is that WM in fact responds better to T3D-959 than the average WB at the high dose. The ROSDs highlighted in the left panel respond to T3D-959 just as those in the right panel; the difference is entirely due to how the respective RRs respond. Multiple other images from the SPM analysis, and the two other main outcomes, support the conclusion that outcome values are dependent on which RR is used in the analysis. This observation leads to an important understanding. The WM RR (corpus callosum and centrum semiovale) used in this therapeutic study can be affected by the different doses of T3D-959, just as the regions such as the putamen, or precuneus are. If WM responds better than a region like the precuneus, then a relative FDG-PET outcome for that region may have a negative value.
Multiple brain regions had increased glucose metabolism elicited by T3D-959
A full summary of the regions of the brain with positive Δ R CMRgl (EOT-BL) values is shown in Table 8. In this analysis, the mean value was found for eight Automated Anatomical Labeling (AAL) defined regions: left and right putamen, orbital frontal, insula, and anterior cingulum. Another 8 regions were determined by intersecting the above regions with the positive ROSD map created from the voxel-wise SPM analysis. For this analysis, the RR is the WB. It should be pointed out, that these anatomical regions are not specifically identified as AD-affected regions
Table 8
Brain regions with positive changes in relative CMRgl (EOT-BL) relative to average whole brain
| Brain Regions | Δ R CMRgl (EOT-BL) | p |
| Orbital front intersection L | 0.03±0.04 | 3.0E-05 |
| Orbital front intersection R | 0.03±0.03 | 3.0E-05 |
| Insula intersection L | 0.03±0.03 | 1.0E-6 |
| Insula L | 0.02±0.03 | 1.1E-04 |
| Insula intersection R | 0.03±0.04 | 2.0E-05 |
| Insula R | 0.02±0.04 | 1.3E-03 |
| Cingulum Ant intersection L | 0.04±0.05 | 1.3E-04 |
| Cingulum Ant L | 0.03±0.04 | 5.2E-04 |
| Cingulum Ant intersection R | 0.03±0.04 | 1.9E-04 |
| Cingulum Ant R | 0.02±0.05 | 7.9E-03 |
| Putamen intersection L | 0.06±0.06 | 1.0E-05 |
| Putamen L | 0.05±0.07 | 5.0E-05 |
| Putamen intersection R | 0.06±0.06 | 1.0E-05 |
| Putamen R | 0.05±0.06 | 3.0E-05 |
In this ad hoc ROI analysis, mean values and statistical measurements were determined for the combined dose groups, so this data does not provide information about dose-dependent effects. Importantly, this analysis identifies multiple regions with statistically significant, positive Δ R CMRgl (EOT-BL) values, across dose groups indicating that some brain areas respond better than average whole brain. A similar analysis with WM as RR provides a smaller list of brain regions with positive Δ R CMRgl (EOl-BL).
ApoE4 genotype has limited effect of T3D-959 on relative glucose metabolism
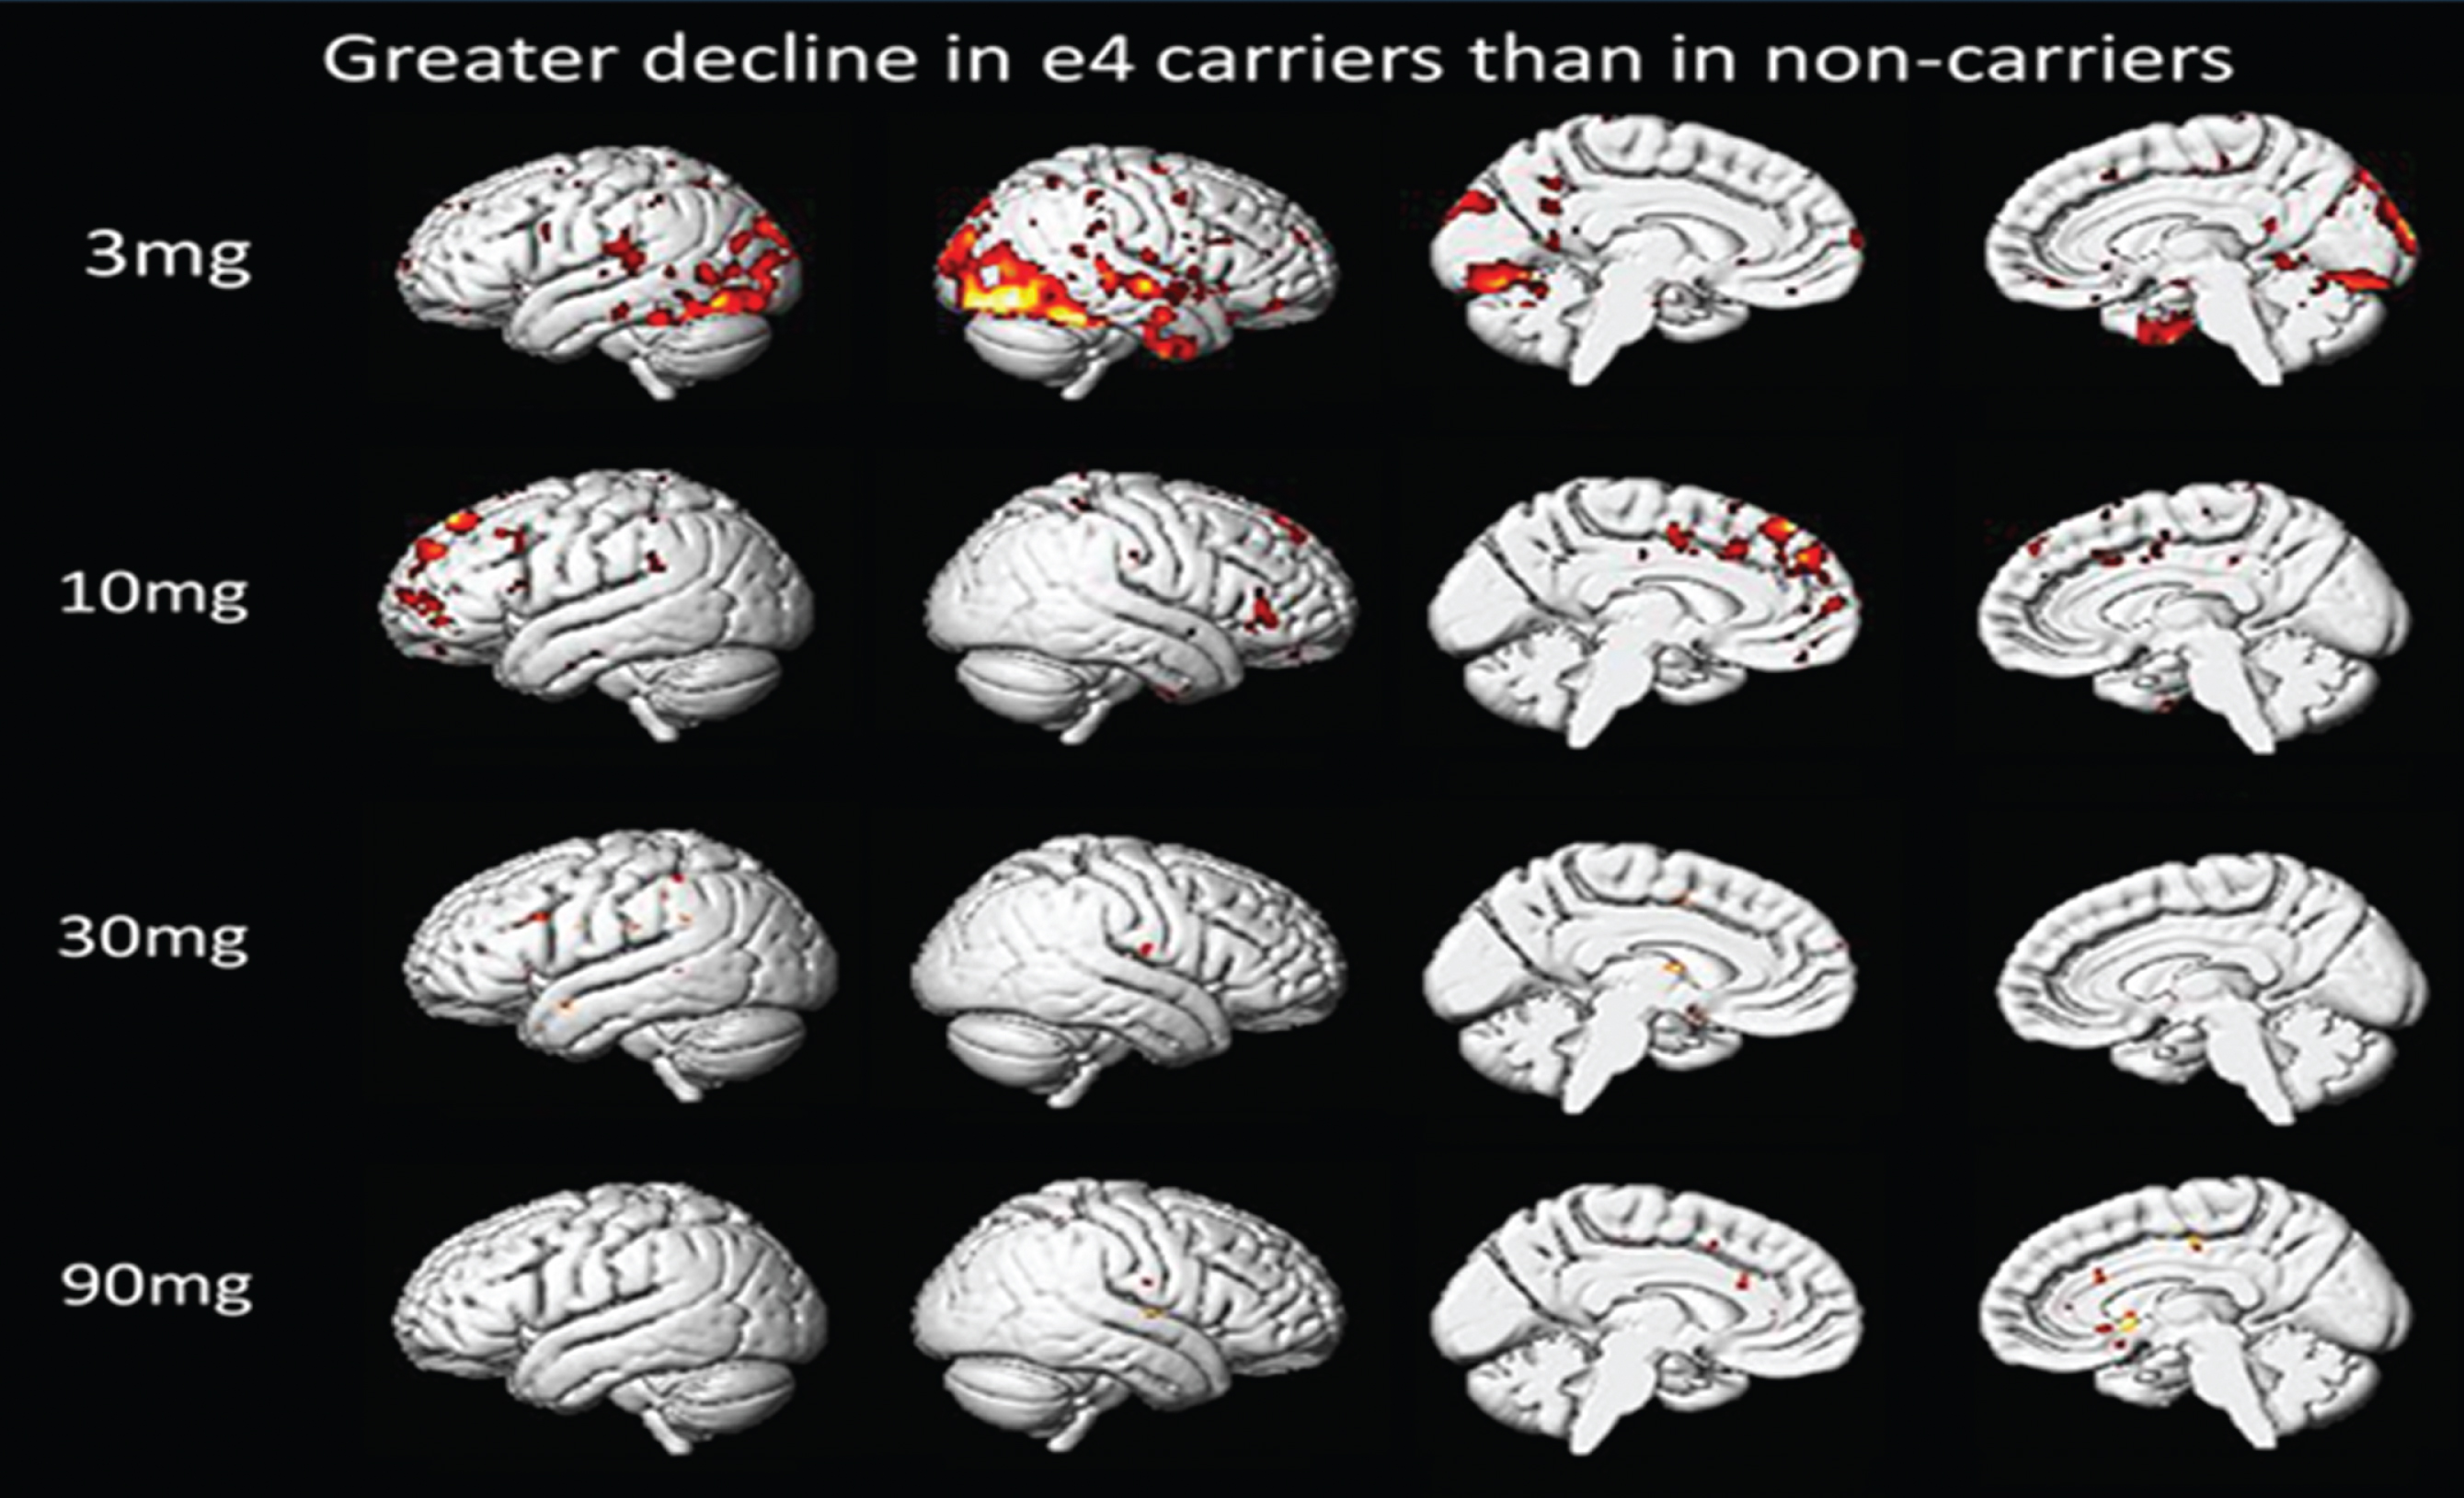
Based on the whole brain voxel-wise analysis, ApoE4-positive subjects are slightly less responsive in restricted brain regions to drug than ApoE4-negative subjects at the 3 mg dose. As dose is increased this difference disappears (Fig. 3). In this voxel-wise analysis, greater decline in ApoE4-positive subjects means: Δ R CMRglApoE4-positive < Δ R CMRglApoE4-negative, and colored regions are regions of statistically significant differences in these two calculated values.
Fig.3
Comparison of ApoE4-Positive and ApoE4-Negative Subjects. Voxel-wise SPM Analysis.
Effects of T3D-959 on cognitive function
Effects of T3D-959 on higher executive function: DSST test
The DSST test was administered to subjects at four time points to minimize potential practice effects: 1) prior to dosing (PS) at screening; 2) at BL immediately prior to treatment on day 1 of dosing; 3) at EOT on day 14 of dosing; and 4) at FU, one week after end of dosing. Positive score changes in the DSST denotes improvement. and a 4-point change is deemed clinically meaningful in this test. Changes in DSST scores BL-PS, EOT-BL, FU-BL, and FU-EOT are shown in Table 9. For all 34 subjects, the change in DSST score for BL-PS was –0.21 (SD = 4.23) indicating minimal practice effect. The change in score after drug treatment (FU-EOT) was 3.5 (SD = 5.51) significantly different from the BL-PS value, with an unpaired t-test p-value of 0.005. All four dose groups had positive values for EOT-BL; however, the values did not show dose-dependency. All FU-BL change values across dose groups were positive, and the values from 10 mg to 90 mg increased with dose, giving a modest dose dependent trend (R2 = 0.65). All FU-EOT values were positive and a dose-dependent trend from 3 mg to 90 mg (R2 = 0.957) was observed. The 10, 30, and 90 mg dose groups were all similar in that a small positive change from baseline was observed at end of treatment (EOT-BL), followed by a larger positive change at follow-up (FU-BL). The 3 mg group diverged from this only because of the unexpected large (–3.5) decrease in score from screening to baseline.
Table 9
Changes in DSST scores by dose and genotype
| Result | Stats | 3 mg | 10 mg | 30 mg | 90 mg |
| BL-PS | |||||
| All | Ave (SD)N | –3.50 (4.57)8 | 1.22 (2.68)9 | 1.44 (2.96)9 | –0.38 (5.18)8 |
| E4-positive | Ave (SD)N | –3.00 (4.36)3 | 1.29 (3.04)7 | 3.50 (2.89)4 | –1.67 (8.50)3 |
| E4-negative | Ave (SD)N | –3.80 (5.17)6 | 1.00 (1.41)2 | –0.20 (1.92)5 | 0.40 (2.97)5 |
| EOT-BL | |||||
| All | Ave (SD)N | 4.43 (9.16)7 | 1.00 (5.50)9 | 0.33 (3.61)9 | 1.13 (4.55)8 |
| E4-positive | Ave (SD)N | 11.50 (16.3)2 | 0.71 (6.29)7 | –1.00 (2.94)4 | 1.33 (7.09)3 |
| E4-negative | Ave (SD)N | 1.60 (4.98)6 | 2.00 (1.41)2 | 1.40 (4.04)5 | 1.00 (3.32)5 |
| FU-BL | |||||
| All | Ave (SD)N | 5.38 (8.50)8 | 3.11 (5.01)9 | 4.00 (5.68)9 | 6.63 (11.4)8 |
| E4-positive | Ave (SD)N | 6.67 (12.4)3 | 3.86 (5.52)7 | 0.25 (3.30)4 | 15.00 (15.1)3 |
| E4-negative | Ave (SD)N | 4.60 (6.88)6 | 0.50 (0.71)2 | 7.00 (5.57)5 | 1.60 (5.55)5 |
| FU-EOT | |||||
| All | Ave (SD)N | 1.86 (4.91)8 | 2.11 (3.95)9 | 3.67 (4.30)9 | 5.50 (8.35)8 |
| E4-positive | Ave (SD)N | –1.00 (1.41)3 | 3.14 (3.80)7 | 1.25 (4.99)4 | 13.67 (8.50)3 |
| E4-negative | Ave (SD)N | 3.00 (5.48)6 | –1.50 (2.12)2 | 5.60 (2.79)5 | 0.60 (2.41)5 |
Effects of T3D-959 on cognition: ADAS-cog11
The ADAS-cog11 test was administered to subjects at the same four time points as the DSST test. In this test negative score change denotes cognitive improvement. ADAS-cog11 change scores are presented in Table 10. Historical placebo control data was not available for comparisons for this short treatment duration. Average total scores at screening (PS) indicate that the low dose (3 mg) and high dose (90 mg) groups may have been more cognitively impaired (as assessed in this test) than the 10 mg and 30 mg middle dose groups prior to drug treatment [3 mg, 27.06 (SD = 10.52), 10 mg, 21.85 (SD = 13.64), 30 mg, 20.62 (SD = 12.10), and 90 mg, 28.87 (SD = 11.34)]. A practice effect was not evidenced in this test when one looks at the average score for all 34 subjects at screening (24.4) and at baseline (24.22).
Table 10
Change in ADAS-Cog 11 scores by dose and genotype
| Result | Stats | 3 mg | 10 mg | 30 mg | 90 mg |
| BL-PS | |||||
| All | Ave (SD)N | 1.63 (5.17)8 | –1.60 (3.86)9 | 1.04 (3.25) 9 | –1.81 (4.85) 8 |
| E4-positive | Ave (SD)N | –1.07 (5.45)3 | –0.82 (3.79)7 | 1.42 (3.70)4 | 2.00 (2.00)3 |
| E4-negative | Ave (SD)N | 3.26 (4.81) 5 | –4.33 (3.77) 2 | 0.73 (3.26) 5 | –4.09 (4.66) 5 |
| EOT-BL | |||||
| All | Ave (SD)N | –2.37 (4.04) 8 | –0.55 (3.15) 9 | –0.89 (5.98) 9 | 1.97 (5.22) 8 |
| E4-positive | Ave (SD)N | –0.11 (2.78)3 | 0.53 (2.59)7 | –0.91 (2.33)4 | –2.33 (4.34)3 |
| E4-negative | Ave (SD)N | –3.72 (4.32)5 | –4.34 (1.41)2 | –0.87 (8.22)5 | 4.55 (4.01)5 |
| FU-BL | |||||
| All | Ave (SD)N | –3.41 (3.52)8 | –0.62 (3.81)9 | –3.97 (3.48)9 | 2.80 (4.16)8 |
| E4-positive | Ave (SD)N | –0.33 (1.16)3 | 0.96 (2.26)7 | –3.52 (3.68)4 | –1.00 (3.21)3 |
| E4-negative | Ave (SD)N | –5.25 (3.10)6 | –6.17 (2.59)2 | –4.34 (3.70)5 | 5.07 (2.79)5 |
| FU-EOT | |||||
| All | Ave (SD)N | –1.04 (2.60)8 | –0.07 (1.76)9 | –3.08 (4.30)9 | 0.83 (2.48)8 |
| E4-positive | Ave (SD)N | –0.22 (2.15)3 | 0.43 (1.60)7 | –2.60 (2.20)4 | 1.33 (3.53)3 |
| E4-negative | Ave (SD)N | –1.53 (2.95)6 | –1.83 (1.17)2 | –3.47 (5.47)5 | 0.52 (2.06)5 |
Results were most consistent in the 30 mg dose group where the average FU-BL score change from BL-PS was statistically significant (p = 0.006) as well as the average EOT-BL score change from BL-PS (p = 0.037). Dose group comparisons indicated the 90 mg dose group experienced a worsening in cognition at end of treatment and follow-up, while the 3 mg group had a marked improvement above the other dose groups. This observation is mainly a consequence of the marked change score difference from PS to BL in the 3 mg and 90 mg dose groups which in both groups was driven by ApoE4-negative subject score differences from ApoE4-positive subjects (discussed below).
ApoE genotype affected ADAS-cog 11 response to T3D-959
When dose group results were segregated by ApoE genotype, a substantial BL-PS change score for the 3 mg ApoE-negative group of 3.26 points (SD = 4.63, n = 5), and the 90 mg ApoE4-negative group of –4.09 (SD = 4.66, n = 5) were noted. As a result, these same two groups also showed the most substantial changes at EOT-BL and FU-BL. The 3 mg ApoE4-negative subjects’ average EOT-BL improved to –3.85 (SD = 4.41, n = 5) while the 90 mg ApoE4-negative subjects’ average EOT-BL worsened to 4.55 (SD = 4.01, n = 5). This is the result of small group randomizations, and produces an apparent inverse dose correlation for E4-negative subjects. However, this inverse correlation is not apparent when scores at screening are used. In addition, the ApoE4-negative subject FU-EOT scores are similar across all dose groups.
Despite the limitations of this small exploratory trial, as noted previously, there were findings of notable interest. For example, by the time of assessment at FU all subjects, regardless of ApoE genotype, in the 30 mg dose group had improved scores much greater than at EOT [–3.86 FU avg. versus –1.04 EOT avg.]. The ApoE4-negative subjects in this 30 mg group showed little change at EOT (EOT-BL = –0.87) but substantial improvement at FU (FU-BL = –4.34), which was a statistically significant change from BL-PS (p = 0.05). In fact, all ApoE4-negative subjects in the 3 mg (n = 5), 10 mg (n = 2), and 30 mg (n = 5) dose groups showed improved ADAS-cog11 scores at FU but not at EOT [–5.02 FU avg. versus –2.69 EOT avg.].
DISCUSSION
This study is the first human clinical trial test of a PPAR delta/gamma dual agonist, T3D-959, in mild-to-moderate AD subjects. The purpose of this clinical study is to examine the safety of and systemic and central pharmacology of T3D-959, as a requisite step towards assessing a metabolic therapeutic approach in AD. The main hypothesis tested this study is that T3D-959 has systemic pharmacology consistent with an PPAR delta agonist, and achieves sufficient levels in the brain to have that same pharmacological effect centrally, and is safe at the doses required to do so. Understanding the systemic pharmacology of T3D-959 builds confidence that similar pharmacology is happening centrally, which is much more difficult to measure. The underpinning rational for testing a PPAR delta agonist is that AD is in some measure a metabolic disorder that is intimately linked to structural (plaques, tangles) and stress events (inflammation, oxidative stress) and that, regardless of the initiating event in AD, there is a massive positive feedback loop where each perpetuates the other. The aim of a metabolic approach is to break this feedback loop at a distinct point, correcting aberrant glucose and lipid metabolism. The high metabolic demands of the brain to maintain normal function (e.g., cognition, motor function) create a high vulnerability to glucose and lipid metabolic dysfunctions and resulting pathophysiology. That pathophysiology in AD involves, among other events, loss of neurons, Aβ plaque deposits, tau neurofibrillary tangles, activation of cell death genes, deficiencies in energy metabolism, mitochondrial dysfunction, inflammation, DNA damage, and increased oxidative stress.
Rosiglitazone, a thiazolidinedione class PPAR gamma-selective agonist, had been the prior benchmark compound used to assess a metabolic approach to AD therapy. This marketed drug is indicated for the treatment of Type 2 diabetes and effectively treats peripheral insulin resistance. In Phase II and III AD clinical trials, it met with little or no success [29]. Multiple deficiencies of this molecule do not allow for rigorous hypothesis testing in AD. Rosiglitazone has extremely poor brain penetration, in part because it is a good substrate for the brain P-glycoprotein efflux transporter. In CD-1 mice, only 0.045% of an IV dose was found in brain. Rat studies have shown similar results [30]. Safety pharmacology of rosiglitazone also prohibits higher dosing to overcome the low brain penetration [29]. Lastly, the PPAR gamma target of rosiglitazone has very restricted regional expression in the brain as opposed to PPAR delta which is ubiquitously expressed in the brain. To rigorously test the neurometabolic hypothesis for AD, a brain penetrant PPAR delta agonist is desirable.
The purpose of this exploratory feasibility Phase IIa clinical study in AD subjects was to demonstrate proof of concept that T3D-959, can produce desired changes in cerebral glucose metabolism and other evidence of changes in brain function that may indicate potential for cognitive improvement in established AD. This clinical study was designed to: 1) determine short term safety; 2) assess multiple outcome measures for incorporation into the design of future studies; 3) aid in dose selection for future studies by examination of a wide range of doses and; 4) assess the potential for a pharmacodynamic lag as might be expected from a transcriptional regulating mechanism of action by re-testing 7 days after dose discontinuation.
Single time point PK analysis at the approximate Tmax confirmed Phase I findings that T3D-959 provided systemic exposure after oral dosing and exposure increased in a dose dependent manner. Even at the lowest 3 mg dose plasma Cmax was well above the PPAR delta ED50 (19 nM), and at the high 90 mg dose plasma Cmax values were > 100 fold the ED50. Assuming human brain to plasma ratios approximate that observed in rat studies (ca. 35% brain to plasma ratio) one would predict that cerebral exposures at all doses were above the ED50 for PPAR delta activation.
None of the high 90 mg dose subjects experienced adverse events, and there were no serious adverse events in any dose group. In this study population in the dose range of 3–90 mg with administration for 14-days T3D-959 appears to be safe and well tolerated.
Mass spectroscopy-based plasma metabolomics has become a powerful tool to investigate mechanisms of metabolic regulation and fuel homeostasis in mammalian systems. Non-targeted, or exploratory metabolomics is a useful tool for identifying changes in relative concentrations of a broad range of metabolites in response to disease or therapy. The primary aims of the metabolomic profiling were to demonstrate that T3D-959 displays the expected dose-dependent systemic pharmacology of a PPAR delta/gamma agonist, to identify doses producing substantive pharmacological effects, and to aid in interpretation of FDG-PET data. Although CSF metabolomics would have provided useful information on central nervous system pharmacology, it would have substantially increased the demands on subjects and was not included in this study. In this study it can only be argued that observed systemic effects implies similar central pharmacology. Plasma data indicated that T3D-959 altered insulin-dependent metabolic pathways in the periphery. T3D-959 decreased plasma levels of the branched-chain amino acids, and their metabolites, with the highest dose (90 mg) having the greatest effect. An increased flux of fatty acids into the beta-oxidation pathway was observed in the form of increased levels of a wide array of acyl carnitine species in the two highest dose groups. In addition, glycine levels increased in the highest dose group. These three measures are all consistent with a systemic decrease in insulin resistance [24]. Consistent with this, a dose-dependent decrease in fasting plasma blood glucose was also observed (data not shown). Other metabolomic signatures consistent with increased systemic insulin sensitivity, such as a decrease from baseline at end of treatment in the aromatic amino acids phenylalanine and tyrosine and a decreased glutamine:glutamate ratio were also observed. Metabolomic results were consistent with observed dose-dependent increases in adiponectin (an insulin sensitizing hormone released from fat cells) observed in a Phase I clinical trial with T3D-959 in normal volunteers.
Plasma biomarkers with relevance to both systemic insulin resistance and AD are of significant interest. Plasma ceramides are a candidate biomarker. Ceramides, the core of all sphingolipids, are generated in response to a variety of factors, including proinflammatory cytokines, oxidative stress, and increased levels of free fatty acids, conditions that characterize the obese adipose tissue. Evidence suggests that ceramides may link excess nutrients such as saturated free fatty acids and inflammatory cytokines such as TNF-α to the metabolic syndrome [26]. In addition, high serum ceramides are associated with memory impairment and hippocampal volume loss [31]. In a Women’s Health and Aging Study, serum ceramides were shown to increase the risk of AD [32]. In this study ten different ceramides were monitored across the treatment period. The ratio of end of treatment to baseline levels was shown to decrease in a statistically significant manner for seven of the ten at the two higher doses (30 mg and 90 mg). These include ceramide (16:0) or N-palmitoyl sphingosine, which has been associated with systemic insulin resistance, and longer chain ceramides which correlate to increased risk of AD, such as ceramide (18:20). The number of ceramides (33) examined in this study was limited. Data suggests evaluation of a more extensive ceramide set in future targeted metabolomics studies.
Changes in other biomarkers with relevance to neurodegenerative diseases were noted. Multiple plasmalogens (six out of eleven) were significantly increased by the two higher doses of T3D-959 (30 mg and 90 mg). Plasmalogen deficiencies have been noted in early AD, postmortem AD brain samples, and animal models of AD [28, 33]. In total, ceramide, BCAA and acyl carnitine data provide convincing evidence that T3D-959 decreases systemic biomarkers of insulin resistance and does so in a dose-dependent manner. Since subjects in this study were non-diabetic (HbA1c<6.5), it appears that the effect of high dose (90 mg) T3D-959 was quite profound, and that doses in the 3 to 90 mg range are relevant to future studies.
A significant effort was made by subjects and researchers to obtain FDG-PET data in this clinical trial. FDG-PET has been used extensively in cross-sectional and longitudinal AD studies to monitor disease progression. However, in this study FDG-PET was used as a neuroimaging biomarker for indirectly measuring T3D-959 brain penetration and pharmacology and examining potential dose-dependent effects. With the short course of this study any change in relative CMRgl measured by FDG PET can be assumed to be due to drug activity and not disease progression.
Though preferable to assess absolute CMRgl change via FDG PET, limitations in data processing, test burden on patients and protracted image collection time needed for absolute CMRgl measures obviated its use. The well-established ADNI FDG PET protocol for relative CMRgl measurements was used. In seeking to measure drug-elicited change in AD-affected ROIs (the numerator in a relative CMRgl measure) mis-interpretation of relative CMRgl data is likely if standard AD-spared RR (the denominator in a relative CMRgl measure) also respond to the drug which would thereby mask CMRgl change in a particular region of interest (AD-spared RR show limited changes due to AD in disease progression studies). Coupling metabolomics analysis with relative CMRgl measures can aid in interpreting relative CMRgl change. Relative CMRgl measurement with FDG-PET does not establish whether positive or negative absolute changes rates of glucose metabolism are occurring in response to drug, as absolute FDG PET would. Metabolomics data collected in this study supports the expected systemic pharmacology of T3D-959 to decrease insulin sensitivity and increase glucose metabolism, particularly at higher doses. It is reasonable to extrapolate this observed systemic effect, and assume that relative CMRgl changes we observed result from variable increases in absolute CMRgl from region to region in the brain, even if the outcome measure is a negative value. It is antithetical to assert that systemically T3D-959 decreases insulin resistance, but has the opposite effect in the brain.
To further aid in the interpretation of the relative (ADNI type) CMRgl data, the original dose group analysis using average WB as the RR, was repeated with average brain WM as the RR (corpus callosum and centrum semiovale) to give a second set of results for the three major outcomes described above (sROI, anatomical ROIs, and the voxel-wise SPM). Calculated values for all three outcomes changed depending on which RR was used. For example, Fig. 2 shows a comparison of two slice by slice image displays of ROSDs with positive ΔR CMRgl (EOT-BL) (p < 0.005) when WB and WM are used as RRs. The WB image clearly shows a greater spatial extent of positive ROSDs (yellow region) than the WM image. This effectively argues that different parts of the brain, for instance WB and WM respond differently to drug. The same argument can be made with negative ROSDs from the SPM analysis (data not shown). An important corollary to this argument is that the outcome changes we observe are reduced in absolute value, by a normalizing effect of RRs which also respond to drug. With these understandings, relative CMRgl data can be interpreted, leading to the important observation of a dose-dependent change in relative FDG PET outcomes. Evidence of the dose dependency comes from all three major outcomes. Figure 1 shows results from the voxel wise SPM analysis. There is a significant trend (R2 = 0.998, p = 0.026) in the increase in spatial extent of positive ROSDs from 10 mg (70 voxels), to 30 mg (518 voxels), to 90 mg (2136 voxels). For the 3 mg group, the positive ROSD has an unusual unilateral pattern, different from the other three dose groups with all the ROSDs occurring on the left side of the brain. The spatial extent of negative ROSDs also shows a dose-dependent effect (image data not shown), increasing from 55 voxels for the 3 mg group to 9655 voxels for the 90 mg group. The ΔsROIindex outcome measure described above, also shows dose dependency when WM is the RR, changing from 0.0016 (SD = 0.040) at 3 mg, to 00053 (0.025) at 10 mg, –0.020 (0.020) at 30 mg, and –0.035 (0.023) at 90 mg (R2 = 0.98).
ΔR CMRgl values were measured for four pre-specified anatomical ROIs, PC, PreC, BMTG, and RIPL known to be involved in AD. Of these, the ΔR CMRgl values for the precuneus ROI, when calculated with WM as RR showed good correlation to dose with the mean dose group value changing from 0.0060 (SD = 0.023) at 3 mg to –0.0427 (SD = 0.047) at 90 mg. For both of these outcome measures, the negative values should not be misconstrued for decreases in cerebral rates of glucose metabolism for reasons described above.
Using WB as the RR we also sought to determine which regions of the brain are more responsive to drug. The data (Table 8) show positive Δ R CMRgl (EOT-BL) values ranging from 0.02 for the left insula to 0.06 for the putamen, with (uncorrected) p values well below 0.05. The increase for the putamen is statistically significant and survives multiple comparison with a family-wise error (FWE) of 0.05. The putamen appears to be significantly more responsive to T3D-959 at the high dose than average WB. Theses brain regions (Table 8) are not recognized as AD-affected regions, but the response in these areas indicates T3D-959 has effects throughout the brain. The four prespecified anatomical regions PC, PreC, BMTG, and RIPL, known to be involved in AD showed a similar response to T3D-959 as the average WB. The Δ R CMRgl (EOT-BL) values, with WB as the RR, are all close to zero across the doses, meaning the ROI to WB ratio did not change over 2 weeks of treatment for any dose. If this was the only CMRgl data obtained, one might errantly conclude T3D-959 did not get into the brain. However, the ROI/WB data suggests that these AD-affected ROIs respond as well as average whole brain grey matter up to perhaps the highest 90 mg dose. This conclusion can only be reached with coupling metabolomic data and FDG-PET dose-dependent data. The overall exploratory nature of this FDG-PET study limits rigorous hypothesis testing, given the small sample sizes, short duration of dosing, lack of a placebo arm and relative, as opposed to absolute, measures of CMRgl being determined. Interpretation of CMRgl data is complicated by the fact that all measurements are relative to a RR, either whole brain or white matter, and the high likelihood that a RR would also be affected by T3D-959 based on the ubiquitous cerebral expression of the primary target of the drug, PPAR delta.
ApoE genotype is a critical risk factor in AD and plays a role in disease progression. Association of CMRgl responses with ApoE genotype was examined. In this trial 50% of the subjects were ApoE4-positive and 50% ApoE4-negative. The exploratory data in Fig. 3 above shows that ApoE genotype appears to have little influence on the effect of T3D-959 on relative CMRgl. Perhaps a small difference is observed at the lowest dose T3D-959 (3 mg), but this disappears at the higher doses. Other similar data calculated with WM as RR and for Δ R CMRglAp ∘E4-p°sitive > Δ R CMRglAp ∘E4-negative show similar results (data not shown). These observations are important for two reasons. First, they provide limited evidence that even at the 3 mg dose T3D-959 penetrates the brain for pharmacodynamic effect, and secondly, there is little difference in how the ApoE4-positive and ApoE4-negative brains respond to T3D-959. These analyses should be viewed with caution as they are based on especially limited sample sizes since each dose group is further divided by ApoE status.
An exploratory objective in this study was to assess the effects of T3D-959 on cognition and higher executive function using ADAS-cog11 and DSST tests respectively. No dose-dependent response was observed for change in mean ADAS-cog11 and DSST scores after 14 days of dose administration (EOT). However, interesting observations emerge when one examines test results at day 21 (FU: 7 days post-dosing discontinuation) compared to baseline in both of these exploratory outcome measures that may point to a delay in pharmacodynamics (see [34] for a discussion of PK/PD models). First, in the ADAS-cog11 test, an apparent ApoE genotype influence on the results emerges. Note that ApoE genotype was blindly obtained on all subjects. All ApoE4-negative subjects in the 3, 10, and 30 mg dose cohorts had improved scores at FU. It should be noted that there are only two ApoE4-negative subjects in the 10 mg group, all dose groups are small and not powered for statistical significance. Second, in the DSST test, at FU but not at EOT, a dose-dependent improvement trend is observed from 3 to 90 mg when one examines the change in scores from EOT to FU where R2 = 0.957 (Table 9).
Administration of the same cognitive test four times within a four to six-week period may leave the results vulnerable to practice effects, even when efforts are made to mitigate this, and even though this was an impaired population. Caution should be taken in over interpreting the cognitive test results.
Open label clinical trials are prone to placebo effects. While the potential for placebo effects in this trial is acknowledged the amalgamation of different outcome measure results may indicate that potential to be low. First, metabolomic and FDG-PET studies were quantified and analyzed without the evaluators initial knowledge of drug dose and results indicated a dose dependency. Second, statistically significant association of ApoE genotype to drug-elicited changes in the plasma metabolome, and ADAS-cog11 were noted. Third, moderate severity subjects had much less improvement in DSST scores as would be expected in this test of higher executive function. Fourth, 7-days post dosing discontinuation, when patients know they are not on drug, ADAS-cog11 test scores might be expected to worsen; maintained or improved scores subsequent to end of treatment were observed.
Conclusions
The aim of this exploratory feasibility clinical study was to determine whether agonist stimulation of PPAR delta/gamma with the investigational new drug T3D-959 produced measurable changes in metabolism, both in the periphery and in brain, and whether changes in cognition, as an indirect measure of brain pharmacology, could be detected in subjects with mild-to-moderate AD after 14-days of drug exposure. Study results show that T3D-959 is safe and well tolerated upon short-term drug administration. T3D-959 elicited expected peripheral pharmacology as an insulin-sensitizing agent as evidenced from metabolomic analyses. FDG-PET analysis supports the contention that T3D-959 alters glucose metabolism in a dose dependent manner in the brain. Neuropsychological assessments provided some limited indications of T3D-959 improving cognition and higher executive function. An association of these cognitive findings with ApoE genotype also emerged. The coalescence of this data support further clinical study of T3D-959 in mild-to-moderate AD subjects in a larger, longer, randomized, double-blind, placebo-controlled clinical trial, which controls for ApoE status and explores dosing around the 30 mg dose.
ACKNOWLEDGMENTS
This work was supported in part by grant AG-049510 from the National Institutes of Health.
We thank Christopher B. Newgard, Ph.D., Director of the Duke Molecular Physiology Institute, Duke University Medical Center, for assistance in analyzing the metabolomic data from Metabolon, and Kewei Chen, Ph.D., Hillary Protas, Ph.D. and Eric Reiman, M.D., Executive Director of the Banner Alzheimer Institute, for assistance in analyzing the results of the FDG- PET data.
Authors’ disclosures available online (https://www.j-alz.com/manuscript-disclosures/19-0864r1).
REFERENCES
[1] | de la Monte SM , Wands JR ((2005) ) Review of insulin and insulin-like growth factor expression, signaling, and malfunction in the central nervous system: Relevance to Alzheimer’s disease. J Alzheimers Dis 7: , 45–61. |
[2] | de la Monte SM ((2012) ) Brain insulin resistance and deficiency as therapeutic targets in Alzheimer’s disease. Curr Alzheimer Res 9: , 35–66. |
[3] | de la Monte SM ((2009) ) Insulin resistance and Alzheimer’s disease. BMB Rep 42: , 475–481. |
[4] | De Felice FG ((2013) ) Alzheimer’s disease and insulin resistance: Translating basic science into clinical applications. J Clin Invest 123: , 531–39. |
[5] | L. Mosconi L , Tsui WH , De Santi S , Li J , Rusinek H , Convit A , Li Y , Boppana M , de Leon MJ ((2005) ) Reduced hippocampal metabolism in MCI and AD: Automated FDG-PET image analysis. Neurology 64: , 1860–1867. |
[6] | An Y , Varma VR , Varma S , Casanova R , Dammer E , Pletnikova O , Chia CW , Egan JM , Ferrucci L , Troncoso J , Levey AI , Lah J , Seyfried NT , Legido-Quigley C , O’Brien R , Thambisetty M ((2018) ) Evidence for brain glucose dysregulation in Alzheimer’s disease. Alzheimers Dement 14: , 318–329. |
[7] | Mot AI , Depp C , Nave KA ((2018) ) An emerging role of dysfunctional axon-oligodendrocyte coupling in neurodegenerative diseases. Dialogues Clin Neurosci 20: , 283–292. |
[8] | Gong CX , Liu F , Iqbal K ((2016) ) O-GlcNAcylation: A regulator of tau pathology and neurodegeneration. Alzheimers Dement 12: , 1078–1089. |
[9] | Heneka MT , Reyes-Irisarri E , Hüll M , Kummer MP ((2011) ) Impact and therapeutic potential of PPARs in Alzheimer’s disease. Curr Neuropharmacol 9: , 643–650. |
[10] | Woods JW , Tanen M , Figueroa DJ , Biswas C , Zycband E , Moller DE , Austin CP , Berger JP ((2003) ) Localization of PPARdelta in murine central nervous system: Expression in oligodendrocytes and neurons. Brain Res 975: , 10–21. |
[11] | Hall MG , Quignodon L , Desvergne B ((2008) ) Peroxisome proliferator-activated receptobeta/delta in the brain: Facts and hyothesis. PPAR Res 2008: , 780452. |
[12] | Kalinin S , Richardson JC , Feinstein DL ((2009) ) A PPAR delta agonist reduces amyloid burden and brain inflammation in a transgenic mouse model of Alzheimer’s disease. Curr Alzheimer Res 6: , 431–437. |
[13] | Iwashita A , Muramatsu Y , Yamazaki T , Muramoto M , Kita Y , Yamazaki S , Mihara K , Moriguchi A , Matsuoka N ((2007) ) Neuroprotective efficacy of the peroxisome proliferator-activated receptor delta-selective agonists in vitro and in vivo. J Pharmacol Exp Ther 320: , 1087–1096. |
[14] | Tong M , Deochand C , Didsbury J , de la Monte SM ((2016) ) T3D-959: A multi-faceted disease remedial drug candidate for the treatment of Alzheimer’s disease. J Alzheimers Dis 51: , 123–138. |
[15] | Tong M , Dominguez C , Didsbury J , de la Monte SM ((2016) ) Targeting Alzheimer’s disease neuro-metabolic dysfunction with a small molecule nuclear receptor agonist (T3D-959) reverses disease pathologies. J Alzheimers Dis Parkinsonism 6: , 238. |
[16] | De la Monte SM , Tong M , Schiano I , Didsbury J ((2017) ) Improved brain insulin/IGF signaling and decreased neuro-inflammation with T3D-959 in an experimental model of sporadic Alzheimer’s disease. J Alzheimers Dis 55: , 849–864. |
[17] | Silverman DH , Phelps ME ((2001) ) Application of positron emission tomography for evaluation of metabolism and blood flow in human brain: Normal develoment, aging, dementia, and stroke. Mol Genet Metab 74: , 128–138. |
[18] | Silverman DH , Small GW , Chang CY , Lu CS , Kung De Aburto MA , Chen W , Czernin J , Rapoport SI , Pietrini P , Alexander GE , Schapiro MB , Jagust WJ , Hoffman JM , Welsh-Bohmer KA , Alavi A , Clark CM , Salmon E , de Leon MJ , Mielke R , Cummings JL , Kowell AP , Gambhir SS , Hoh CK , Phelps ME ((2001) ) Positron emission tomography in evaluation of dementia: Regional brain metabolism and long-term outcome. JAMA 286: , 2017–2120. |
[19] | Minoshima S , Giordani B , Berent S , Frey KA , Foster NL , Kuhl DE ((1997) ) Metabolic reduction in the posterior cingulate cortex in very early Alzheimer’s disease. Ann Neurol 42: , 85–94. |
[20] | Jagust W , Reed B , Mungas D , Ellis W , Decarli C ((2007) ) What does fluorodeoxyglucose PET imaging add to a clinical diagnosis of dementia? Neurology 69: , 871–877. |
[21] | Evans AM , Bridgewater BR , Liu Q , Mitchell MW , Robinson RJ , Dai H , Stewart SJ , DeHaven CD , Miller LAD ((2014) ) High resolution mass spectrometry improves data quantity and quality as compared to unit mass resolution mass spectrometry in high-throughput profiling metabolomics. Metabolomics 4: , 132. |
[22] | ADNI PET Analysis, http://adni.loni.usc.edu/methods/pet-analysis-method/pet-analysis/ |
[23] | Chen K , Langbaum JBS , Fleisher AS , Reschke BS , Lee W , Xiaofen L , Napatkamon A , Bandy D , Alexander GE , Thompson PM , Foster NL , Harvey DJ , de Leon MJ , Koeppe RA , Jagust WJ , Weiner MW , Reiman EM ((2010) ) Twelve month metabolic declines in probable Alzheimer’s disease and amnestic mild cognitive impairment assessed using an empirically pre-defined statistical region-of-interest: Findings from the Alzheimer’s disease neuroimaging initiative. Neuroimage 51: , 654–664. |
[24] | Newgard CB , An J , Bain JR , Muehlbauer MJ , Stevens RD , Lien LF , Haqq AM , Shah SH , Arlotto M , Slentz CA , Rochon J , Gallup D , Ilkayeva O , Wenner BR , Yancy WE , Eisenson H , Musante G , Surwit R , Millington DS , Butler MD , Svetkey LP ((2009) ) A branched-chain amino acid-related metabolic signature that differentiates obese and lean humans and contributes to insulin resistance. Cell Metab 9: , 311–326. |
[25] | Wang TJ , Larson MG , Vasan RS , Cheng S , Rhee EP , McCabe E , Lewis GD , Fox CS , Jacques PF , Fernandez C , O’Donnell CJ , Carr SA , Mootha VK , Florez JC , Souza A , Melander O , Clish CB , Gerszten RE ((2011) ) Metabolic profiles and the risk of developing diabetes. Nat Med 17: , 448–453. |
[26] | Turpin SM , Nicholls HT , Willmes DM , Mourier A , Brodesser S , Wunderlich CM , Mauer J , Xu E , Hammerschmidt P , Bronneke HS , Trifunovic A , LoSassao G , Wunderlich FT , Kornfeld JW , Bluher M , Kronke M , Bruning JC ((2014) ) Obesity-induced CerS6-dependent C16:0 ceramide production promotes weight gain and glucose intolerance. Cell Metab 20: , 678–686. |
[27] | White PJ , Lapworth AL , An J , Wang L , McGarrah RW , Stevens RD , Ilkayeva O , George T , Muehlbauer MJ , Bain JR , Trimmer JK , Brosnan MJ , Rolph TP , Newgard CB ((2016) ) Branched-chain amino acid restriction in Zucker-obese rats improves muscle insulin sensitivity by enhancing efficiency of fatty acid oxidation and acyl-glycine export. Mol Metab 22: , 538–551. |
[28] | Han X , Holtzman DM , McKeel DW ((2001) ) Plasmalogen deficiency in early Alzheimer’s disease subjects and in animal models: Molecular characterization using electrospray ionization mass spectrometry. J Neurochem 77: , 168–180. |
[29] | Gold M , Alderton C , Zvartau-Hind M , Egginton S , Saunders AM , Irizarry M , Craft S , Landreth G , Linnamägi U , Sawchak S ((2010) ) Rosiglitazone monotherapy in mild-to-moderate Alzheimer’s disease: Results from a randomized, double-blind, placebo-controlled phase III study. Dement Geriatr Cogn Disord 30: , 131–146. |
[30] | Wang Q , Dryden S , Frankish HM , Bing C , Pickavance L , Hopkins D , Buckingham R , Williams G ((1997) ) Increased feeding in fatty Zucker rats by the thiazolidinedione BRL 49653 (rosiglitazone) and the possible involvement of leptin and hypothalamic neuropeptide Y. Br J Pharmacol 122: , 1405–1410. |
[31] | Lyn-Cook LE Jr , Lawton M , Tong M , Silbermann E , Longato L , Jiao P , Mark P , Wands JR , Xu H , de la Monte SM ((2009) ) Hepatic ceramide may mediate brain insulin resistance and neurodegeneration in type 2 diabetes and non-alcoholic steatohepatitis. J Alzheimers Dis 16: , 715–729. |
[32] | Mielke MM , Bandaru VV , Haughey NJ , Xia J , Fried LP , Yasur S , Albert M , Varma V , Harris G , Schneider EB , Rabins PV , Bandeen-Roche K , Lyketsos CG , Carlson MC ((2012) ) Serum ceramides increase the risk of Alzheimer disease: The Women’s Health and Aging Study II. Neurology 79: , 633–641. |
[33] | Ginsberg L , Rafique S , Xuereb JH , Rapoport SI , Gershfeld NL ((1995) ) Disease and anatomic specificity of ethanolamine plasmalogen deficiency in Alzheimer’s disease brain. Brain Res 698: , 223–226. |
[34] | Wright DF , Winter HR , Duffull SB ((2011) ) Understanding the time course of pharmacological effect: A PKPD approach. Br J Clin Pharmacol 71: , 815–823. |


