
Age-Related Intraneuronal Aggregation of Amyloid-β in Endosomes, Mitochondria, Autophagosomes, and Lysosomes
Abstract
This work provides new insight into the age-related basis of Alzheimer’s disease (AD), the composition of intraneuronal amyloid (iAβ), and the mechanism of an age-related increase in iAβ in adult AD-model mouse neurons. A new end-specific antibody for Aβ45 and another for aggregated forms of Aβ provide new insight into the composition of iAβ and the mechanism of accumulation in old adult neurons from the 3xTg-AD model mouse. iAβ levels containing aggregates of Aβ45 increased 30-50-fold in neurons from young to old age and were further stimulated upon glutamate treatment. iAβ was 8 times more abundant in 3xTg-AD than non-transgenic neurons with imaged particle sizes following the same log-log distribution, suggesting a similar snow-ball mechanism of intracellular biogenesis. Pathologically misfolded and mislocalized Alz50 tau colocalized with iAβ and rapidly increased following a brief metabolic stress with glutamate. AβPP-CTF, Aβ45, and aggregated Aβ colocalized most strongly with mitochondria and endosomes and less with lysosomes and autophagosomes. Differences in iAβ by sex were minor. These results suggest that incomplete carboxyl-terminal trimming of long Aβs by gamma-secretase produced large intracellular deposits which limited completion of autophagy in aged neurons. Understanding the mechanism of age-related changes in iAβ processing may lead to application of countermeasures to prolong dementia-free health span.
INTRODUCTION
Age has long been known to be the most significant risk factor for AD, but how age is related to disease and whether the relationship is mediated through amyloid-β (Aβ) and tau pathology remains unknown. The amyloid hypothesis [1–3] has formed the basis for the development and testing of many therapeutics; however, none of these have been successful and the gamma-secretase inhibitor, Semagacestat, actually led to a significant worsening of functional ability in human clinical trials [4]. Although gamma-secretase inhibitors were screened on the basis of their inhibition of the secretion of Aβ, a detailed analysis of the mechanism indicated that Semagacestat slows the tripeptide carboxypeptidase terminal triming of the primary products of gamma-secretase endoproteolysis leading to the accumulation of “long Aβs” ending at residues 45, 46, 48, and 49 of the Aβ sequence (Fig. 1), similar to many of the FAD mutations in presenilin, which interfere with the processivity of the tripeptidase trimming [5–7]. These results suggest that the reason that Semagacestat and Avagacestat [8] caused cognitive worsening is the same reason that FAD mutations in presenilins cause early onset AD: they lead to an increase in intraneuronal long Aβs, implicating them as key players in pathogenesis. Intraneuronal amyloid is a complex mixture of insoluble amyloid-β protein precursor (AβPP) carboxyl terminal fragments and Aβ species [9–13], reviewed in [14]. This material is aggregated in the same manner as amyloid aggregates because it reacts with a variety of aggregation-specific antibodies [15–17]. The accumulation of intraneuronal amyloid appears to be critical for neuritic plaque formation because treatment of 5xFAD mice with a CSF1R inhibitor that ablates microglia blocks intraneuronal amyloid accumulation and the subsequent deposition of neuritic plaques [18]. Here we report direct evidence for the acummulation of intraneuronal long Aβs as a function of age, endocytosis, and excitotoxicity.
Fig.1
Routes for intracellular Aβ for aggregation of insoluble “long Aβ” peptides. Above, red arrows mark initial endoprotease cleavage of AβPP. Smaller black arrows show trimming to Aβ45 and Aβ42. Normally, secreted soluble “short Aβ” peptides of 40 or less residues are rapidly degraded. Site of mOC78 antibody recognition sequence for aggregated Aβ shown at residues 9-13. Below, stimulation of endocytosis of AβPP is promoted with 1) BACE cleavage of AβPP to CTF1-99 at plasma membrane or 2) in endosome. 3) Subsequent processing by gamma-secretase cleavage of CTF99 into Aβ, 4) long Aβ forms aggregate in the membrane or in the lumen of late endosomes, 5) further aggregation leads to accumulation inside the endosome or endolysosome. Organelle markers are shown for co-localization studies. Separately, Aβ forms are associated with mitochondria and macroautophagy with markers for these compartments.
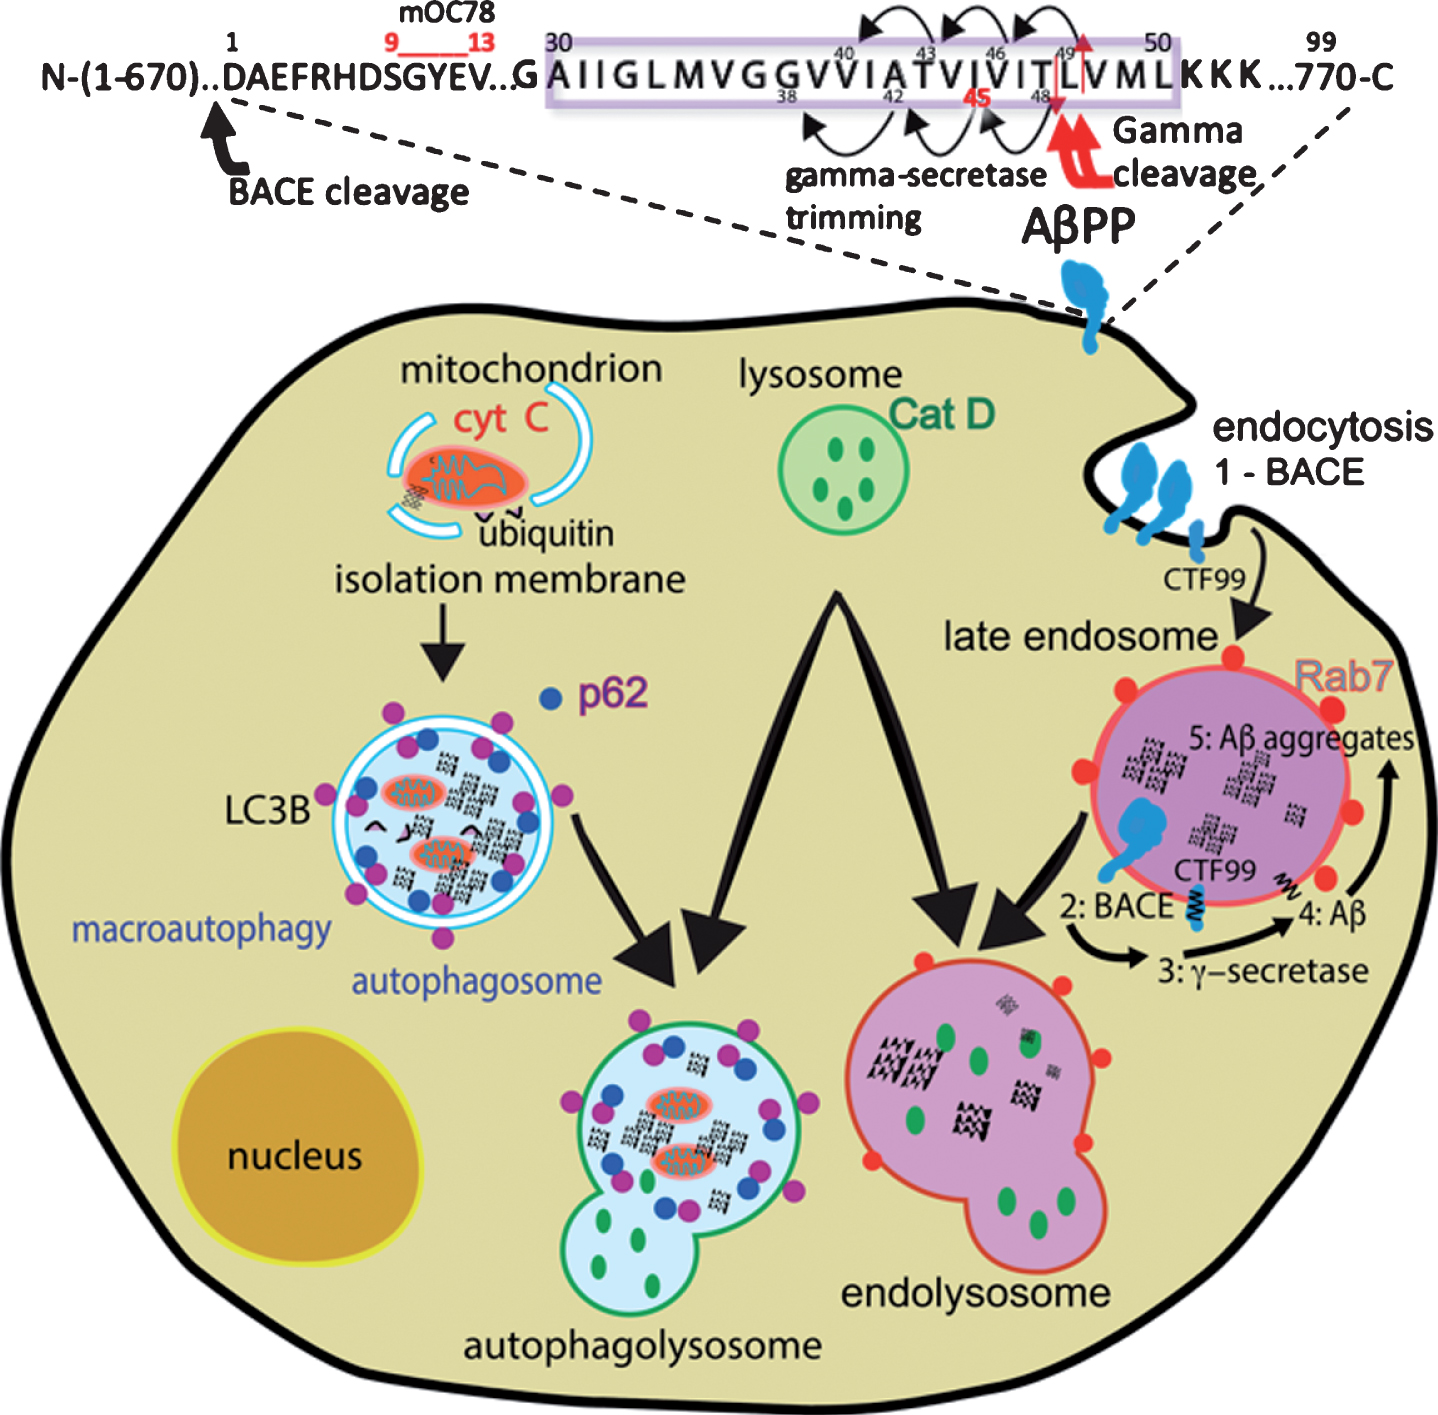
We have proposed a modified amyloid hypothesis that the intraneuronal amyloid contains “long” Aβ species ending at residues 45 to 49 that arise as a result of incomplete carboxy terminal trimming activity of gamma-secretase (Fig. 1) [17]. Although the standard model of the amyloid cascade hypothesis favored the view that soluble secreted Aβ is the central player in AD, the same facts support an alternative model that postulates a pathogenic role for intracellular aggregated Aβ (iAβ), longer fragments of AβPP containing the Aβ sequence, collectively named “long Aβs”. We hypothesize that long Aβ isoforms such as Aβ45 remain and aggregate inside neurons and are not secreted, in contrast to Aβ42, which is preferentially, though not exclusively secreted (Fig. 1).
Many assume that a lifelong buildup of extracellular amyloid or reactive oxygen species (ROS) damage eventually reaches a clinical threshold for dementia. However, neither mouse models nor human anti-amyloid or anti-oxidant therapies have validated this assumption. We have proposed that metabolic adaptation to a sedentary lifestyle impairs mitochondrial function with less energy for healthy management of amyloid and tau proteostasis, synaptic function, inflammation [18], ROS, and other stressors. This Epigenetic Oxidized Redox Shift (EORS) theory of aging postulates that an age-related oxidized redox shift causes a metabolic shift, epigenetic changes and a futile cycle of declining capacity with age [19, 20]. Here, we hypothesize that these changes increase Aβ processing and intracellular aggregation. We examine these changes in iAβ at the single-cell level.
To elucidate the age-related processing of these forms, we cultured neurons from adult brains of the 3xTg-AD mouse, compared to non-transgenic neurons in which synthesis and processing of AβPP is naturally driven. This transgenic model incorporates human mutations for accelerated overproduction of Aβ, yet memory impairment is delayed for many months. Our methods provide uniform conditions for comparing epigenetically enforced, age-related changes, removed from individual variations in hormones, vasculature, and the immune system. This allowed us to address the largest risk factor for AD, age. Here we report that iAβ contains long Aβ45 and its accumulation in mitochondria, endosomes, and autophagosomes is dramatically increased with aging and upon glutamate treatment.
MATERIALS AND METHODS
Mouse models
We used the triple transgenic mouse model of AD (3xTg-AD) with human transgenes AβPP (Swe, KM670/671NL) and Tau (P301L) under the control of Thy1.2 promotors in a PS1 (M146V) transgenic mouse [21]. The mice were housed 1 to 5 per cage and fed rodent diet 2020X (Envigo Teklad, Placentia, CA) with 24% calories from protein, 16% from fat, and 60% from carbohydrates). Room temperature was controlled at 70° F, humidity at 16–25% with a 12-h light dark cycle. Non-transgenic controls were C57/BL6, bred in house but obtained originally from Charles River (San Diego, CA). The 5XFAD (B6SJL-Tg(AβPPSwFlLon,PSEN1*M146 L*L286V)6799Vas/Mmjax) mice from The Jackson Laboratory [22] were genotyped by qPCR (automated genotyping using human AβPP and PS1 primers, TransnetYX, Cordova, TN) to ensure expression of comparable levels of the human AβPP and PS1 genes.
Primary neuron culture
1 mL isoflurane, USP (Piramal Healthcare, Bethlehem, PA 66794-013-25) was used to anesthetize the mice. Adult hippocampal and overlaying cortical neurons were isolated separately from female or male young (2, 4, and 6 months), middle-age (9, 10, and 11 months) and old (21 months) nTg and 3xTg-AD mice [23]. The combined hippocampus and overlying frontal cortex of each hemisphere were sliced at 0.5 mm and combined in Hibernate AB (BrainBits LLC, Springfield, IL, #HAB 500) and placed into 30°C bath for 8 min. The tissue was digested with 2 mg/ml papain (Worthington, Lakewood, NJ, LS003119) in Hibernate A minus Calcium (BrainBits HACA) and 0.5 mM Glutamax (Thermo Fisher, Waltham, MA, 35050-061) for 30 min in 30°C dry bath while shaking at 170 rpm. The slices were triturated, and each hippocampus and hemicortex was transferred to a separate 15 mL tube of Optiprep (Cosmo Bio, Carlsbad, CA, AXS-1114542) of 4 layered densities. The two gradients were centrifuged at 800 g for 15 min. The neuron enriched fractions were collected and transferred to 5 mL of Hibernate AB. The cell suspension was centrifuged twice for 1 min at 200 g and the supernatant was discarded. The cells were plated onto Poly-D-lysine (Sigma-Aldrich, St Louis, MO, P6407-5MG) coated 12 mm coverslips (Carolina Biologicals, Burlington, NC, 41001112) at 50,000 cell/cm2 in Neurobasal plus with B27 plus (Thermo Fisher A3653401) supplemented with 5 ng/mL each mouse FGF2 (Thermo Fisher, PMG0035 or Pepro-Tech 450-33) and PDGF-BB (PMG0045 or Pepro-Tech 315-18) for trophic support. The medium was adjusted from 235 to 270 mOsm with 5 M NaCl. One-half medium changes were made on days 4 and 7 with 10 ng/mL growth factors, assuming consumption of the prior growth factors. The cells were cultured for 10–15 days at 37°C in 5% CO2 and 9% O2 at saturated humidity (Thermo-Forma, Marietta, OH, Model 3130). Quality control was maintained above 80% viability at all time points in about 90% of cultures by a live-dead assay.
Live-dead assay
The live neurons on glass coverslips were stained with fluorescein diacetate (15μg/mL; Sigma-Aldrich, F7378) and propidium iodide (4.6μg/mL; Sigma-Aldrich, P4170) [24]. After 2 min of incubation, the cells were rinsed once with Hibernate A Low Fluorescence (BrainBits LLC, HALF), and the wash was saved so the suspended dead cells could also be examined. Images were taken with the fluorescent microscope Olympus IX83 at 20X magnification for green (live) and red (dead) fluorescence. Viability was calculated as the average percent live divided by the total adherent cells (live + dead) in 10 adjacent fields, added to non-adherent dead cells.
Polyclonal serum against Aβ45
A peptide corresponding to residues 36–45 of the Aβ/AβPP-CTF99 sequence (VGGVVIATVI) was synthesized and coupled to keyhole limpet hemocyanin via its amino terminus using disuccinimidyl suberate (DSS, Thermo Fisher 21555) according to the manufacturer’s instructions. Two New Zealand white rabbits were immunized with 1 mg of the resulting antigen in incomplete Freund’s adjuvant and boosted at monthly intervals and bled according to an IACUC approved protocol under contract with ProMab Biotechnologies, Richmond, CA. We also immunized rabbits with 10 residue peptides corresponding to the carboxyl terminus of Aβ ending at residues 46, 47, 48, and 49, but these immunizations did not result in a detectable, specific immune response (data not shown). The specificity of the resulting antisera from bleed 4 was determined by spotting 1μg of Aβ40, Aβ42, Aβ36 - 45, Aβ37 - 46, Aβ38 - 47, Aβ39 - 48, Aβ40 - 49, and a bridging peptide corresponding to Aβ36 - 54. Aβ45 specific antibodies were affinity purified by passing the serum over a column of the bridging peptide Aβ36 - 54, adsorbing the eluate on a column of Aβ36 - 45 and eluting the bound antibody with 0.2 M glycine, pH 2.3. The eluted antibody was rapidly neutralized with 10 mM Tris buffer, pH 8.0 and stored at 4°C.
Immunocytochemistry
The cultured neurons attached to glass coverslips were fixed with 4% paraformaldehyde (Electron Microscopy Science, Hatfield, PA, 19200) in Dulbecco’s phosphate buffered saline minus calcium (Thermo Fisher, 14190-144) for 10 min. A blocking buffer containing 2% Bovine Serum Albumin (Sigma-Aldrich, SLBT0168), 0.5% Triton X-100 (Sigma-Aldrich, X100-100ML) in DPBS minus Ca was added to the coverslips for 1 h. Table 1 lists the primary antibodies used and their dilutions in antibody dilution buffer (ABD, 1% bovine serum albumin (BSA), 0.05% Triton X-100 in DPBS-CA): anti-MAP2 for characterizing neurons, mOC78 [16] for oligomeric amyloid fibrils, anti-Ab45 for long Aβ protein with residue 45 at the C-terminus, anti-cathepsin D for lysosomes [25], anti-Rab7a for endocytic vesicles [26, 27], anti-cytochrome C for mitochondria [28] and anti-p62 for autophagosomes [29]. The primary antibodies were allowed to bind over night at 4°C. Secondary antibodies were diluted in antibody dilution buffer (1% BSA, 0.05% Triton X-100 in PBS) and were allowed to bind for 1 h at room temperature. As a specificity control, we expressed a fusion protein consisting of the carboxyl terminus of GST fused to the amino terminus Aβ45 in E. coli and purified the fusion protein on glutathione agarose beads. The conjugate (1:250) was mixed with primary anti-Aβ45 (1:1000) for specific adsorption immediately before binding to neurons.
Table 1
Antibodies used for immunocytology
| Antibody | Type | Source | Dilution |
| Primary antibodies | |||
| Anti-mOC78 | Rabbit monoclonal Residues 8–11(SGY), 20–24(FEV) | [17, 30] | 1:40 |
| Anti-Aβ45 | Rabbit affinity purified polyclonal | this work | 1:1000 |
| Anti-AβPP CTF Rabbit polyclonal | [17] Residues 676–695 of AβPP695 | 1:1000 | |
| Anti-amyloid 6E10 | Mouse monoclonal Residues 5–7 | Covance Signet [30] | 1:1000 |
| Alz-50 | Mouse monoclonal | [31, 32] | 1:20 |
| Anti-Rab5a | Mouse monoclonal | Sigma-Aldrich (R7904) | 1:100 |
| Anti-Rab7a | Mouse monoclonal | Sigma-Aldrich (R8779) | 1:500 |
| Anti-Cathepsin D | Mouse monoclonal | Calbiochem (IM03) | 1:100 |
| Anti-MAP2 | Mouse monoclonal | Sigma-Aldrich (M4403) | 1:250 |
| Anti-cytochrome C | Mouse monoclonal | BD Bioscience (556432) | 1:1000 |
| Anti-p62 | Mouse monoclonal | Novus Biologicals (NBP2-23490) | 1:500 |
| Secondary antibody conjugates | |||
| Anti-mouse | Goat anti-mouse Alexafluor488 | Thermo Fisher (A11029) | 1:2000 |
| Anti-rabbit | Donkey anti-rabbit AlexaFluor555 | Thermo Fisher (A31572) | 1:500 |
The stained slips were washed 3 times in antibody dilution buffer with 5 min between each wash. The nuclei were stained for 2 min with 1 ng/mL bisbenzamide (from a 1μg/mL stock, Sigma-Aldrich, B1155). The stained coverslips were mounted on glass slides using 1 drop of Aqua-Mount (Thermo Fisher, 13800).
The stained coverslips were imaged using an Olympus IX83 epi-fluorescent microscope with 60X oil-immersion objective using Olympus dichroic filters for DAPI (bisbenzamide), GFP (Cathepsin D, MAP2, Alz50 or Rab7), and RFP (mOC78 or Ab45). Images were collected by a Retiga Exi camera (12-bit resolution, CCD; QImaging, Surrey, BC, Canada) controlled by Metamorph software (Molecular Devices, San Jose, CA). Illumination, exposure times, camera gain were held constant for each single experiment within each antibody, but exposures were different for detection of each color, avoiding saturation. ImageJ v1.51n (NIH, Bethesda, MD) software was used for analysis of fluorescence images. Background fluorescence was first removed from all images with a rolling ball radius of 20 pixels. Minimum threshold was set to minimize objects from samples with the primary antibodies omitted. Integrated density per cell was the area of fluorescent objects multiplied by their intensity per field divided by the number of neurons in that field. The number of fluorescent objects/cell and their size was also analyzed. Co-localization with automatic thresholding (Image J, FIJI version) is based on a pixel by pixel measure of the Pearson correlation of intensities after automatic subtraction of pixels with zero correlation [33, 34]. Pixel size was 0.012μm2 with a minimum of 3 pixels (0.036μm2) above threshold to count as an object. Note that endosomes and lysosomes are 0.01–0.16μm2 in cross section [25].
Statistics
Results are presented as mean and standard error. Statistical significance was determined by using single factor ANOVA with significance considered at p < 0.05. Follow-up Fisher’s exact t-tests were adjusted for repeated measures (Pro-Stat, Pearl River, NY). File names provided with each figure allow tracing to original data files for authentication.
RESULTS
Characterization of “long” Aβ antibody and intraneuronal staining
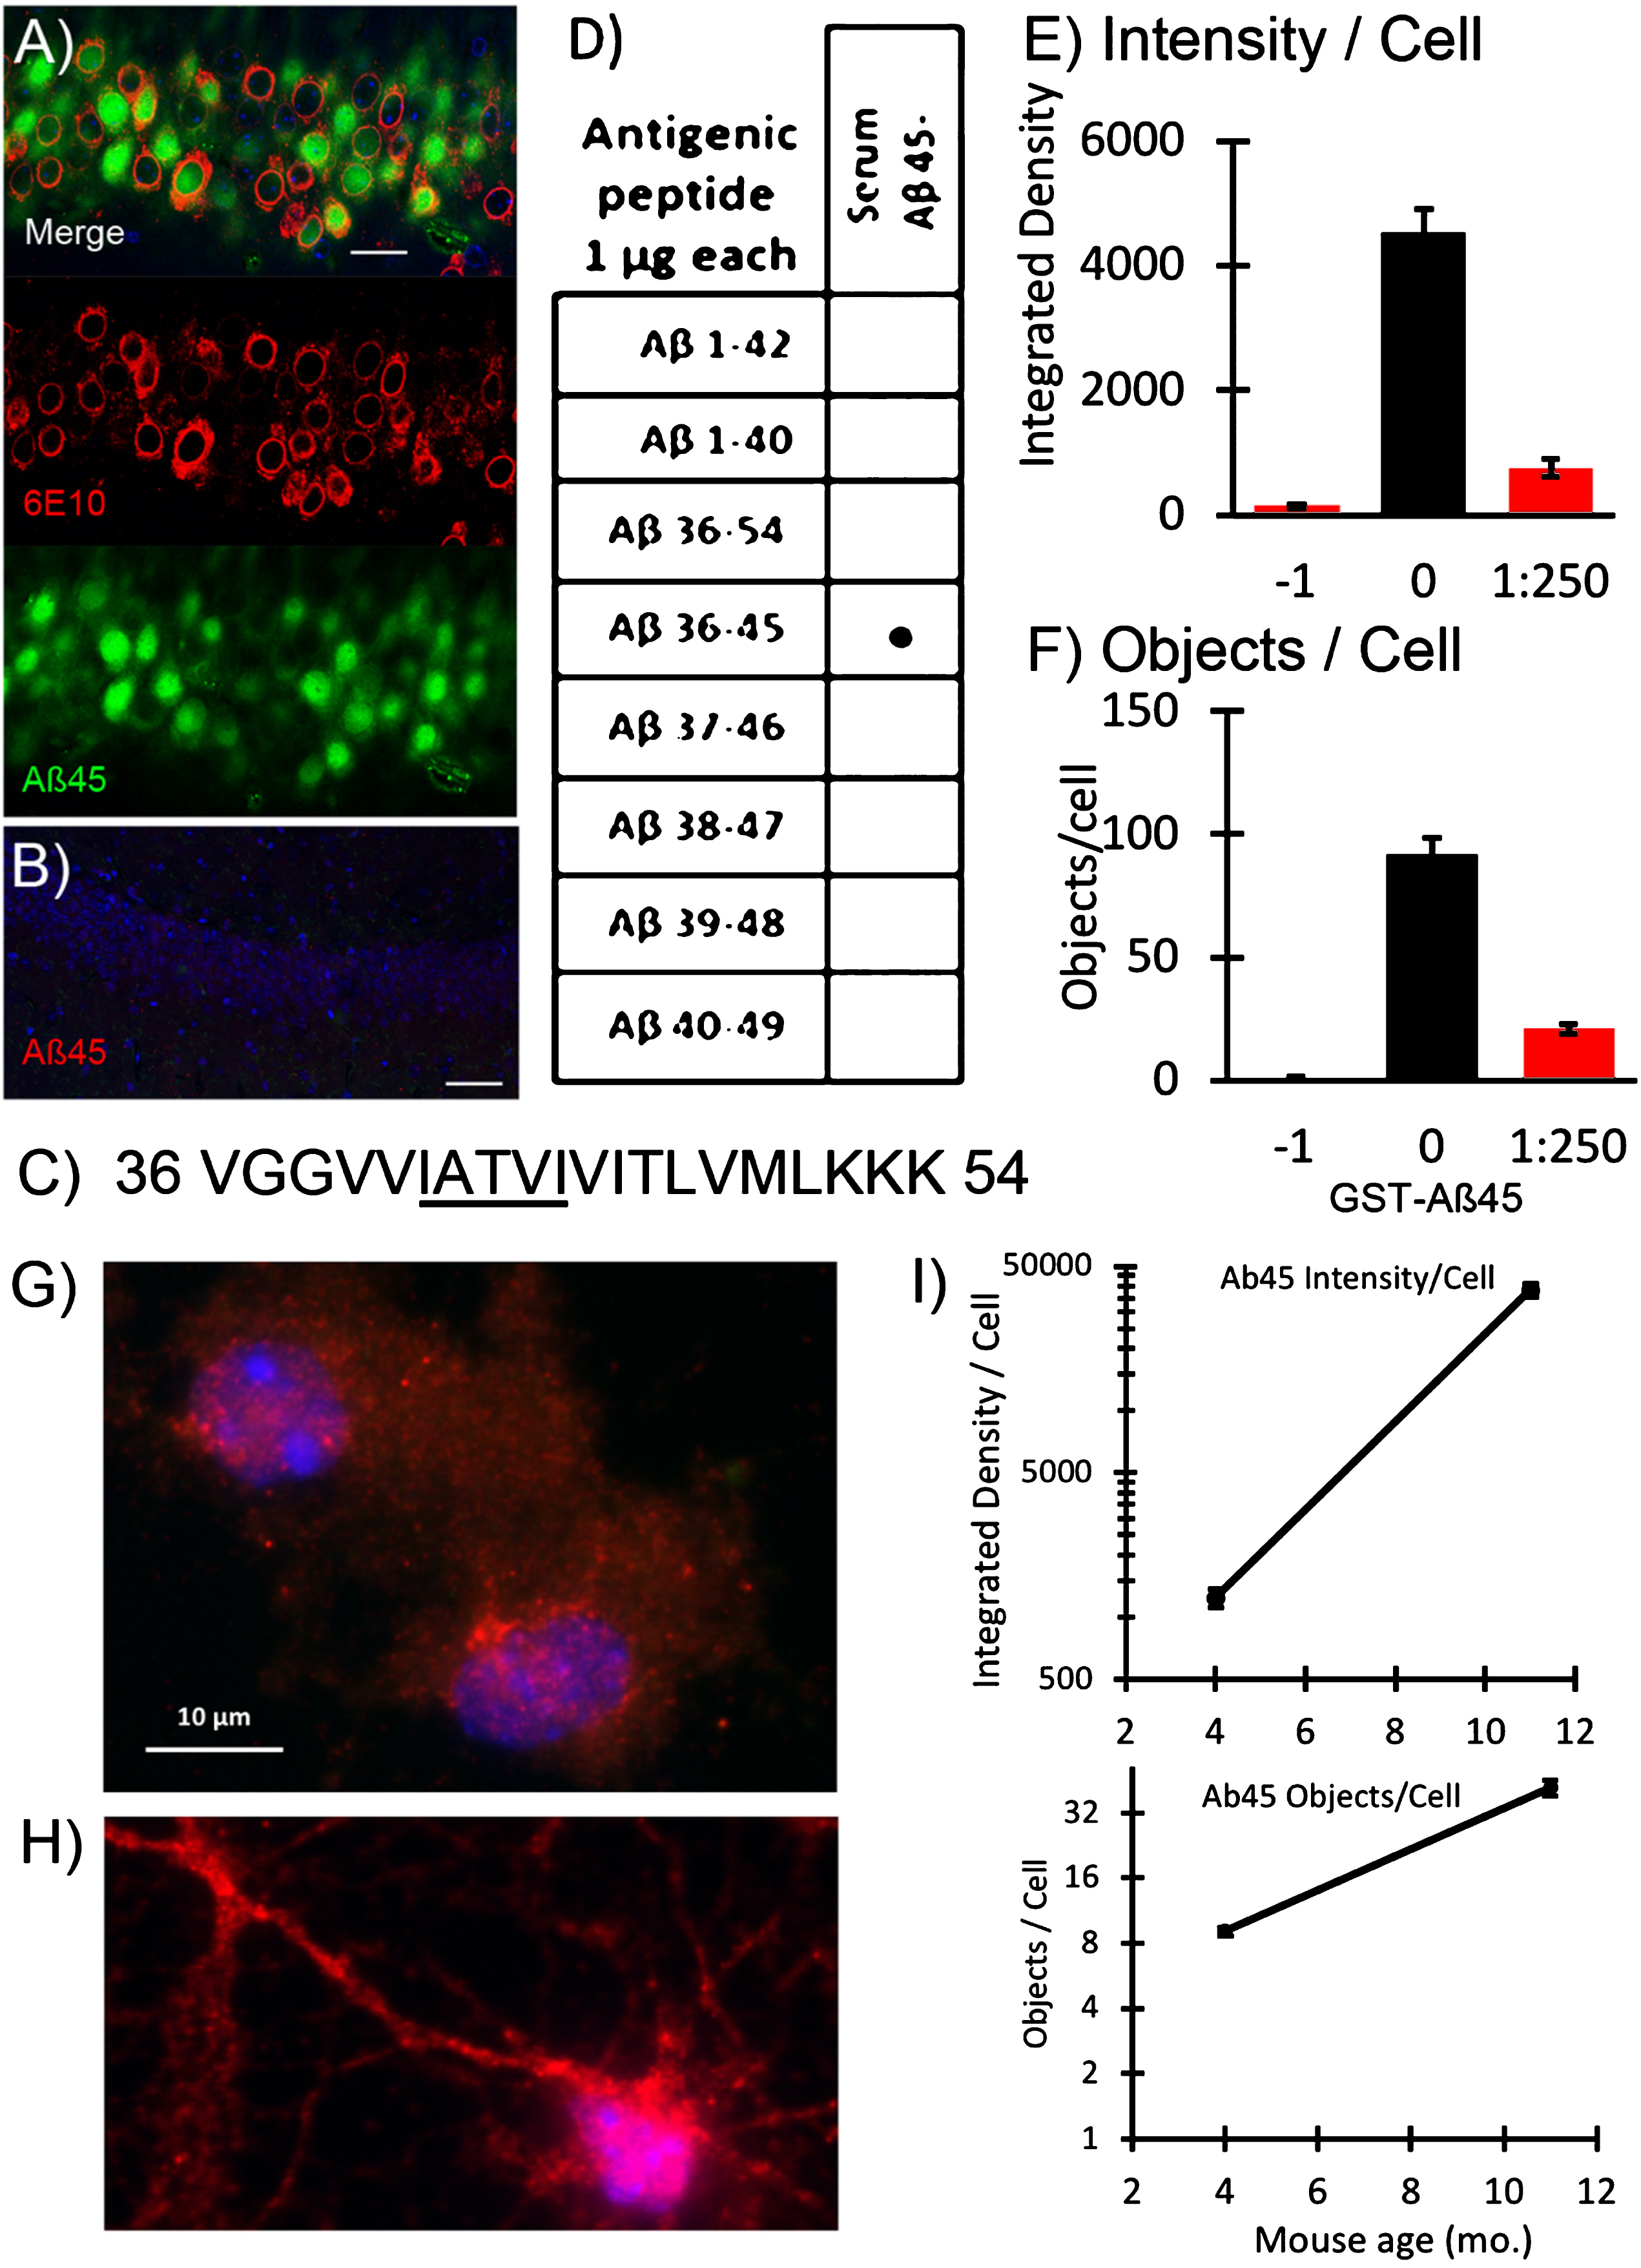
In order to test the hypothesis that long Aβs accumulate intraneuronally (iAβ), we immunized rabbits with the 10-residue peptide of the Aβ sequence ending at residue 45. By immunofluorescence of brain sections with affinity purified IgG from this serum (Fig. 2A, B), iAβ45 was seen in most of the hippocampal neurons in a 2-month-old 5xTg-AD mouse and much less in nTg mice. These neurons also stained with the commonly used 6E10 for residues N1-16 which could tag the commonly reported Aβ40, Aβ42, or CTF. The serum directed against Aβ45 reacted specifically with only the antigenic peptide ending at residue 45 (Fig. 2C) and not Aβ42 or any of the longer peptides in dot blots (Fig. 2D). Specificity was demonstrated by decreased staining after adsorption of the Aβ45 antiserum with an Aβ45-GST conjugate (Fig. 2E, F). We will use this novel end-specific antiserum against longer Aβ45 and a conformation dependent, aggregation specific monoclonal mOC78 to monitor iAβ accumulation [17, 30].
Fig.2
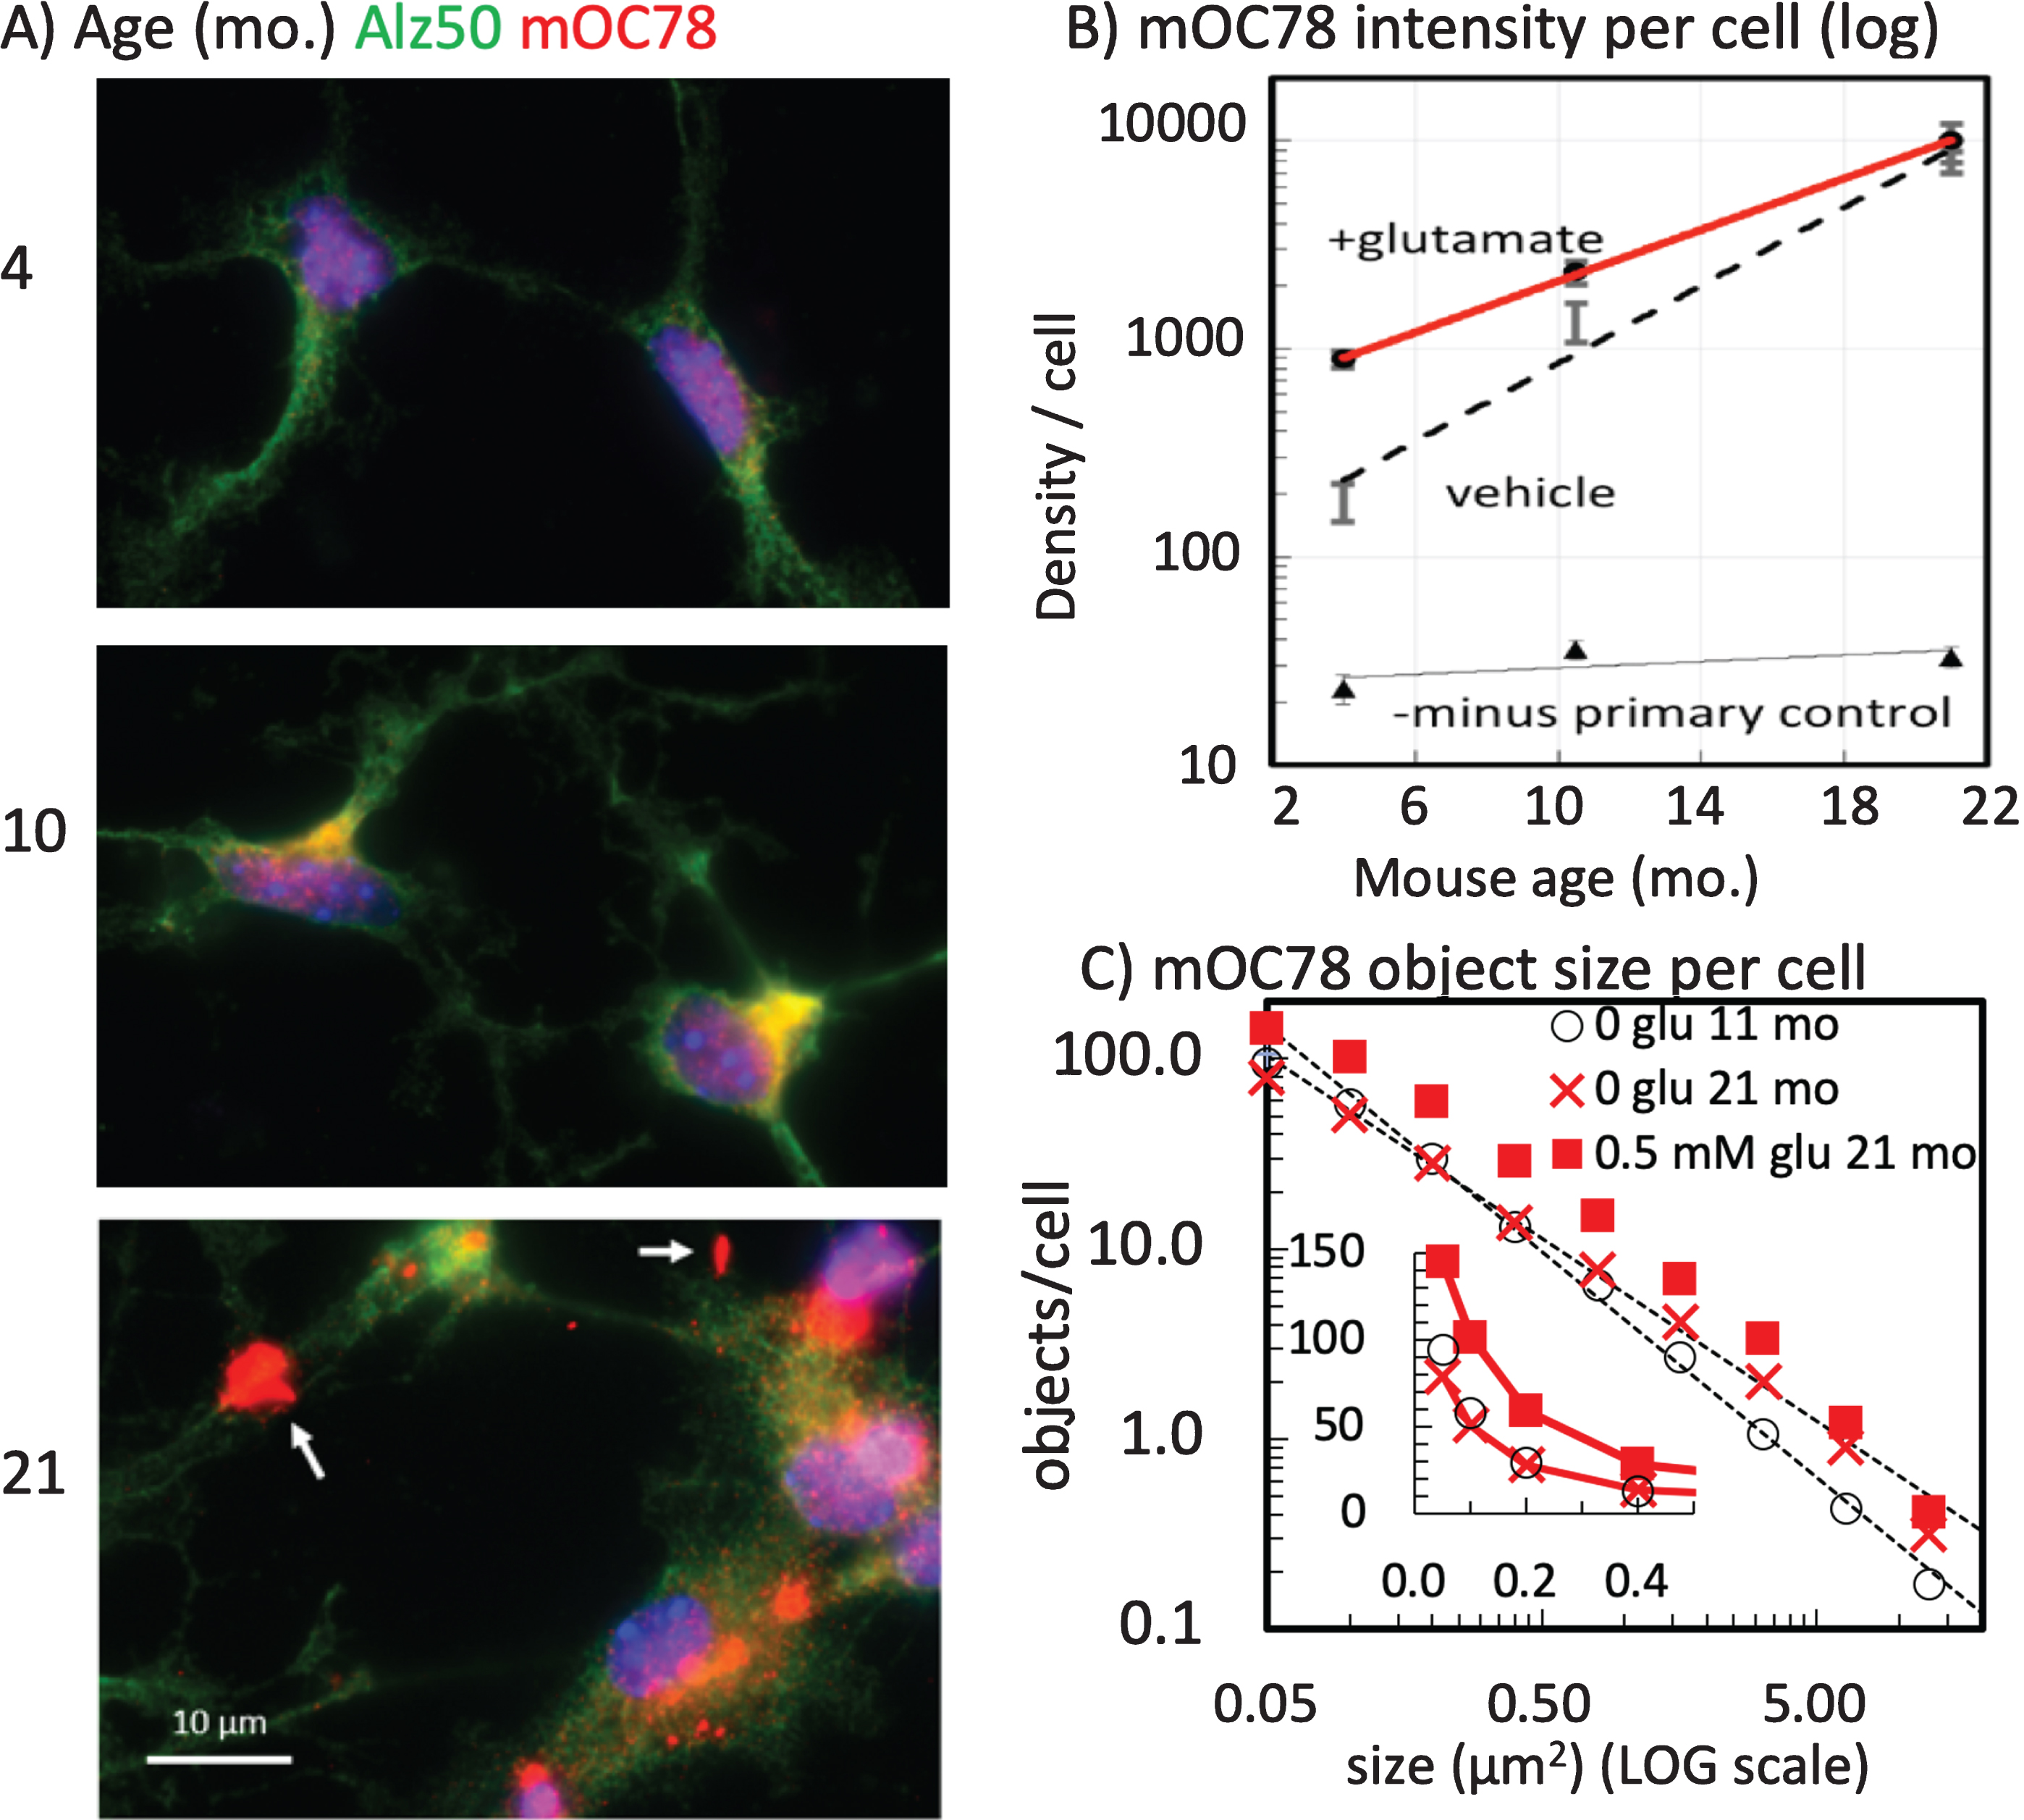
Prominent long form of intracellular Aβ45 increases with age of neurons. A new C-terminal antiserum identified iAβ45 (red) compared to N-terminal 6E10 (green) in CA1 of A) 2-month-old 5xTg-AD and B) 14-month-old non-Tg mouse. C) AβPP sequence from residues 36–54 of the Aβ sequence with residues 41–45 underlined. D) Specificity of serum Aβ45 for only its own antigenic peptide on dot blot. E) Competitive antigen adsorption of the Aβ45 antiserum: –1 is no Aβ45 antiserum, just secondary antibody; 0 is Aβ45 antiserum with no antigen adsorption; 1:250 is dilution of GST-Aβ45 conjugate premixed with Aβ45 antiserum before binding to cells (n = 33–47 cells, file 180608). G) Aβ45 immunoreactivity in 4-month-old male 3xTg-AD neurons compared to H) neurons from an 11-month-old mouse cultured at the same time and co-processed. I) Average integrated intensity of iAβ45 immunoreactivity per cell and objects per cell with age. Note log scale. Control staining for neurons treated without primary antibody was a density of 113 and 0.2 objects per cell for 4-month neurons; for 11-month neuron density was 442 and 0.1 objects per cell (N = 35–79 cells each; standard error bars are slightly larger than symbols, file 180329).
Age increases iAβ accumulation in adult neurons
We compared the effect of age on the intracellular abundance and distribution of Aβ45 immunoreactivity (iAβ45) by isolating and culturing neurons from 3xTg-AD mice of different ages. We wanted to determine if age from which neurons were isolated had a differential effect on iAβ45 levels. Coincident processing of neurons from 4- and 11-month-old middle-age male mice indicated a 30-fold increase in iAβ45 immunoreactivity compared to 4-month neurons (Fig. 2G-I). This difference was exhibited with similar neurite outgrowth at these two ages (Supplementary Figure 1), as previously shown [35–37]. We note that the objects per cell are low numbers as a result of fixed scaling for comparison of bright objects in both the 4- and 11-month neurons.
Parallel log-log distribution of mOC78 imaged particle sizes in 3xTg-AD and non-Tg neurons
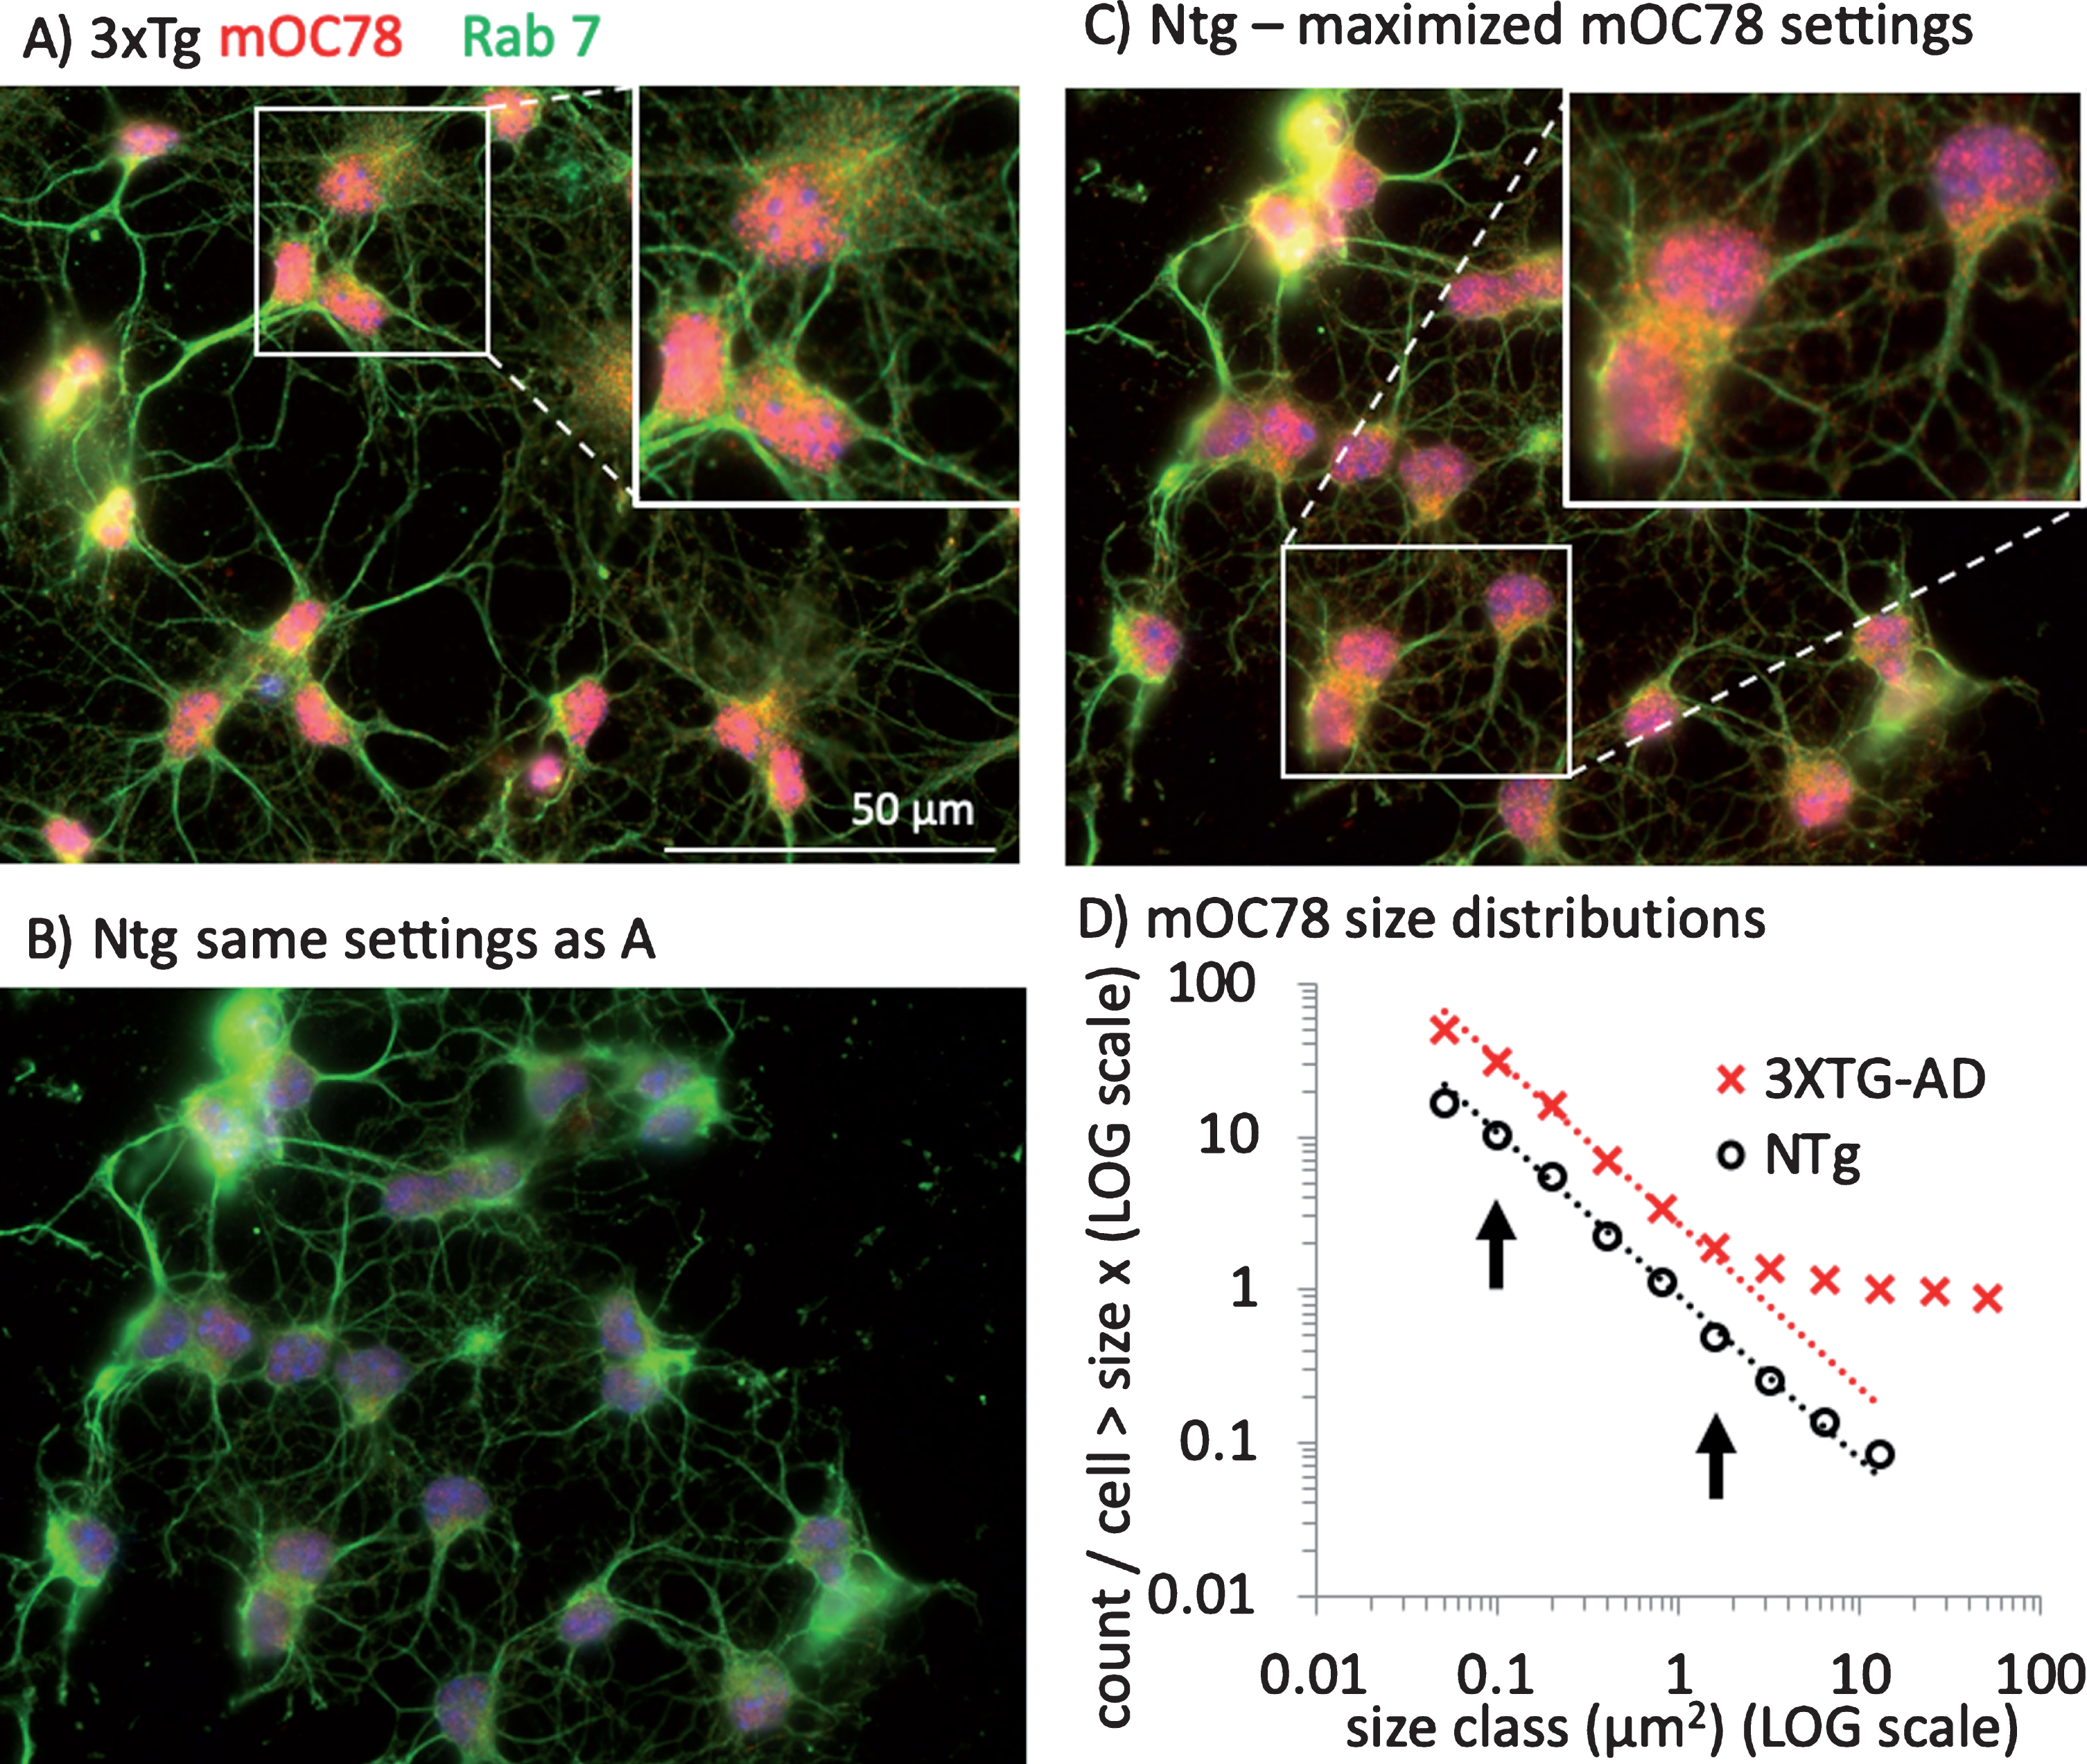
mOC78 reacts with aggregates of Aβ, but not with AβPP [9, 17, 30]. The epitope for mOC78 maps to residues 8–11 (SGYE) of Aβ, but immunoreactivity is strongly dependent on aggregation and common to amyloid fibrils from unrelated sequences, suggesting a generic amyloid epitope [23]. Although mouse Aβ contains an F residue at position 10 instead of a Y, mOC78 binds equally well to peptides containing an F instead of Y (SG(Y/F)E) [Reyes-Ruiz and Glabe, manuscript in preparation). We wanted to determine whether there was a principle size class of iAβ aggregates driven by their aggregation or compartmentalization and how the particles related to organelles involved in intracellular uptake and turnover of plasma membrane proteins such as AβPP and its fragments. Figure 3A shows the abundance of red punctate mOC78 immunoreactivity in neurons from a 3xTg-AD mouse compared to considerably lower intensities from a non-Tg control (Fig. 3B), while the green Rab-7 co-labeling for late endosomes [38, 39] were similar. By enhancing gain of the non-Tg image in Fig. 3C, we can also see red mOC78 immunoreactivity that was present as far lower intensity (concentration). The increased gain in Fig. 3C of the same non-Tg field in Fig. 3B results in the visualization of similar size mOC78-immunoreactive particles to those in the 3xTg-AD neurons and suggests that they were present from endogenous Aβ at a much lower concentration in the non-Tg neurons and that the size distribution does not depend on the overexpression of the transgenes. Surprisingly, Fig. 3D shows that the distribution of mOC78 imaged particle sizes was not gaussian but fit well to a log-log distribution. The slopes from sizes of 0.1 to 2μm2 fit within 1% of each other, but particles in 3xTg-AD neurons were 8 times more abundant, due to the overexpression of AβPP genes in these mice. This size range fits with the size of lysosomes and endosomes [25]. The yellow in Fig. 3 indicates overlap of the mOC78 and the Rab-7 stains, suggesting that mOC78 accumulates in late-endosomes. Notice also that the size range of mOC78 immunoreactive particles for the 3xTg-AD neurons extends to the size of the whole neuron, nearly 100μm2 (Fig. 3D). The marked deviation from linearity at approximately 2μm2 suggests the termination of a normal mechanism of formation that exceeds the cell’s ability to degrade these iAβ objects. Below (Fig. 8), we specifically address quantitative analysis of autophagic co-localization with various Aβ forms.
Fig.3
Parallel distributions of intracellular mOC78 amyloid imaged particle sizes in neurons from 3xTg-AD and non-Tg (NTg) mice. A) Neurons from a male 11-month-old 3xTg-AD mouse stained with mOC78 (red), Rab7 (green), and bisbenzimide (blue). Enlarged field is 55μm wide. B) Neurons from a male 11-month-old non-Tg mouse cultured and stained at the same time and imaged at the same settings as in A. C) Same field as B, but with gain increased to better visualize mOC78 particle sizes. Enlarged field is 46μm wide. D) Distribution of mOC78 particle sizes on log-log scale. Data was log-binned and least squares fit over the range indicated by arrows. 3xTg-AD from 79 cells, 3899 particles, fit to count/cell = 0.430*10∧(–1.073*size), R2 = 0.999; non-Tg from 96 cells, 1593 particles fit to count/cell = –0.050 * 10∧(–1.067*size), R2 = 0.998. File 180511
Alz-50 tau, Aβ45, and mOC78 immunoreactivities are stimulated by glutamate
Memantine is approved by the FDA for treatment of AD. It acts as an uncompetitive antagonist of glutamate binding to NMDA receptors [40]. In AD, excess glutamate is postulated to cause intracellular calcium overload [41], reductions in AMPA receptors GluR1 and GluR2/3 in CA1 with increased density in the dentate gyrus [42], decrements in glutamate re-uptake [43], and metabotropic receptor activation [44]. Here we compare the effects of short-term (2 h) glutamate exposure on a pathology-related conformer of tau aggregation detected with the Alz-50 antibody [31, 32], mOC78, and iAβ45. Short-term glutamate treatment produced a large increase in red iAβ45 deposits in neurons from an old 3xTg-AD brain (Fig. 4A-C). In the neurons treated with glutamate for only 2 h, Alz-50 tau immunoreactivity greatly increased and redistributed into dendrites (Fig. 4A, B, D). Glutamate rapidly increased the density of iAβ45 per cell 4-fold while the Alz-50 density increased 2-fold. In another experiment, with neurons from a middle-age 3xTg-AD brain (Fig. 4E, F), we also saw strong colocalization of mOC78 with Alz-50. Treatment with glutamate increased both markers and altered the Alz-50 distribution into dendrites, where others have seen neurofibrillary tangles by electron microscopy [45, 46]. Figures 2 and 3 showed data for male neurons. The experiments in Fig. 4 involved neurons from female mice. Comparison of male to female expression of mOC78 indicated only small differences that scaled with Rab7 immunoreactivity (Fig. 5). Since mOC78 male measures were increased over females in proportion to the mass effect of sex on Rab7, these results suggest that sex is not a major factor in the iAβ accumulation of mOC78 immunoreactivity. With the age-dependence of Aβ45 production (Fig. 2) and its exacerbation by glutamate (Fig. 4), we inquired how age and glutamate affected the larger aggregates of mOC78. Figure 6A and B show relative amounts of mOC78 immunoreactivity increased exponentially (50-fold) with age with age from 4 to 21 months. In old age, many large mOC78 aggregates greater than 1μm2 were seen (arrows in Fig. 6A). A brief treatment with glutamate increased mOC78 density per cell in the young and middle-age neurons but less so in neurons from old mice. The distribution of object sizes followed a log-log distribution so that mean size was not a relevant statistic (Fig. 6C). Instead, for 21-month neurons the calculated slope of object size was 20% lower and intercept 20% higher compared to 11-month size distributions. For small objects, mOC78 size was similar for 11- and 21-month neurons, suggesting a similar mechanism of formation. For larger objects above 1μm2, objects from the old mouse were 2-fold more frequent than those for the 11-month-old mouse (due to a slope 40% more shallow). With a short glutamate treatment in 21-month neurons, object size grew rapidly with an increase in intercept of 1.8-fold and a slope 20% more shallow. These results suggest that age contributes to an increased rate of formation of iAβ mOC78 immunoreactivity, exacerbated by glutamate and possibly a decreased rate of clearance (see autophagy studies below).
Fig.4
Large increase in Aβ45 and Alz-50 with glutamate with relocalization of Alz-50 tau to dendrites. A) Alz-50 tau in axons and soma (green) with low Aβ45 puncta (red) B) increases with 2 h treatment with 0.5 mM glutamate and moves to dendrites (arrow), with colocalization to anti-Aβ45 puncta in 23-month-old male 3xTg-AD neurons. C) 4-fold increase in Aβ45 with glutamate exceeds D) 2-fold increase in Alz-50. N = 17–35 cells. File 170406. E) 10-month-old female neurons rescaled to show individual mOC78 objects and overlap with Alz-50. F) Increase in mOC78 with glutamate treatment and large objects resembling neurofibrillary tangles (arrow). 10-month-old female 3xTg-AD neurons. File 170726.
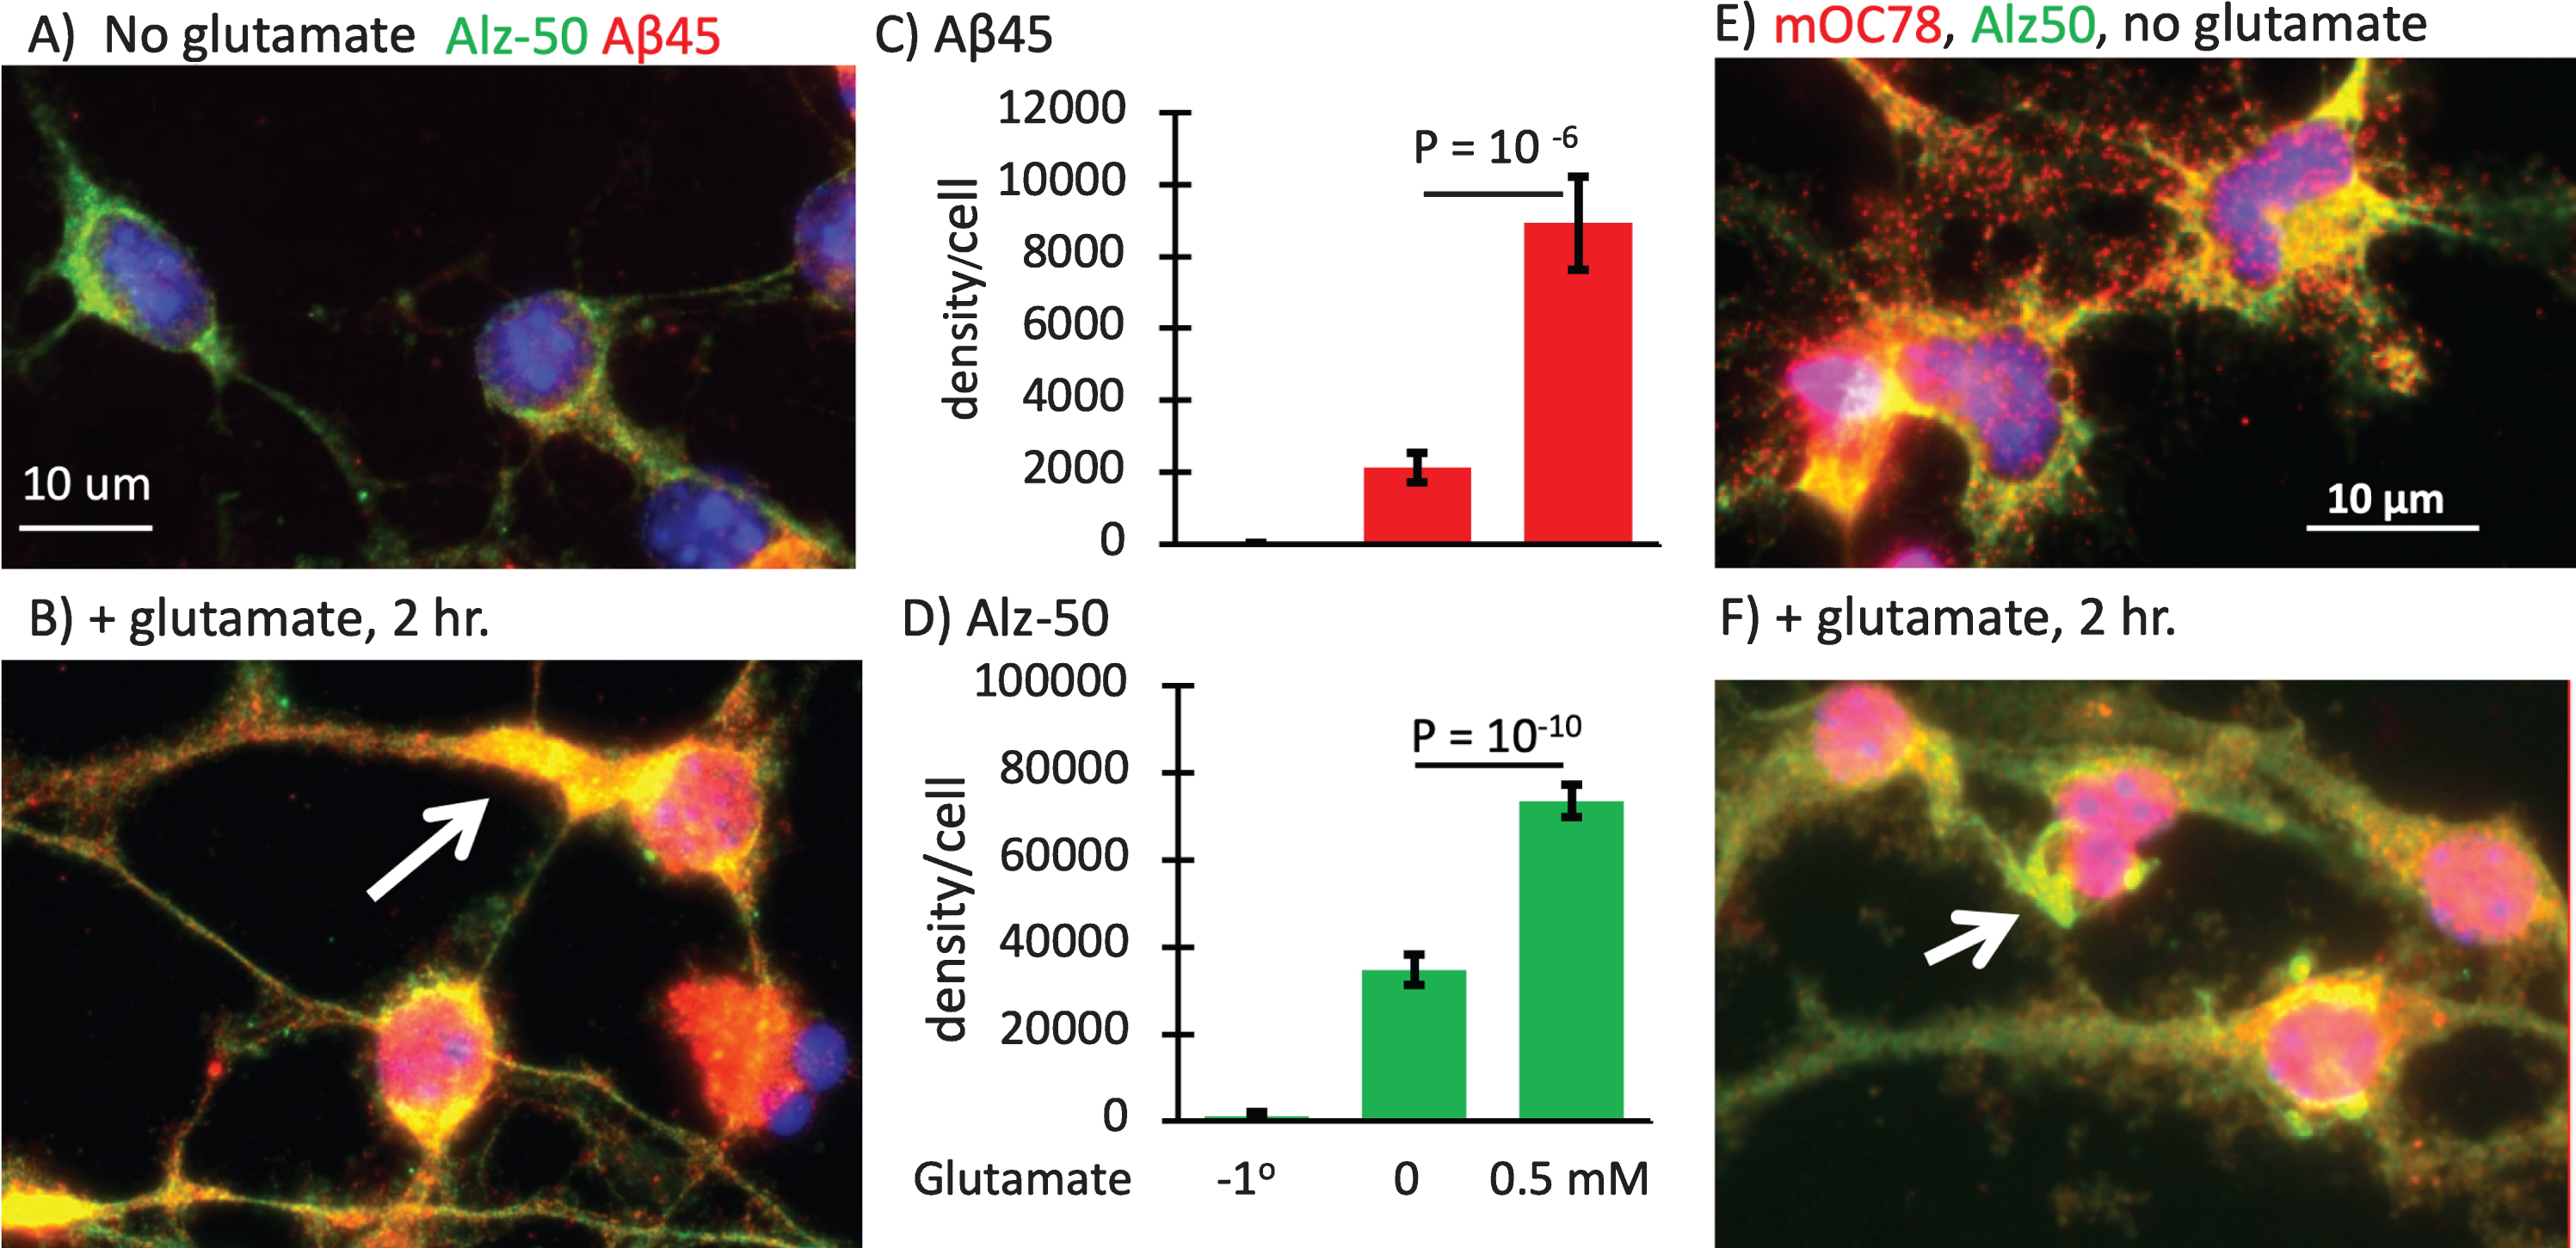
Fig.5
Small effect of mouse gender on mOC78 and Rab7 immunoreactivity. Male to female comparisons of A) mOC78 and B) rab7 immunoreactivity in neurons from 4-month-old mice. i) integrated density; ii) object counts/cell; iii) area per object. We have reported results from both male and female mice. To determine how dependent the results were on gender, in one experiment we explicitly compared mOC78 and Rab7 immunoreactivity in neurons from a female to a male 4-month-old 3xTg-AD mouse. A shows an insignificant 15% increase in mOC78 immunoreactive density per cell in the male compared to the female. The object counts per cell were 43% higher in the male with 33% smaller areas, compared to the female. B shows Rab7 immunoreactive density per cell was 22% higher in the male compared to the female. The object counts per cell were 36% higher in the male with only 6% smaller areas, compared to the female. Colocalization of mOC78 with Rab7 was 0.83 for both sexes. Since mOC78 male measures were increased over females in proportion to the mass effect of sex on Rab7, these results suggest that sex is not a major factor in the iAβ accumulation of mOC78 immunoreactivity. File 171013.
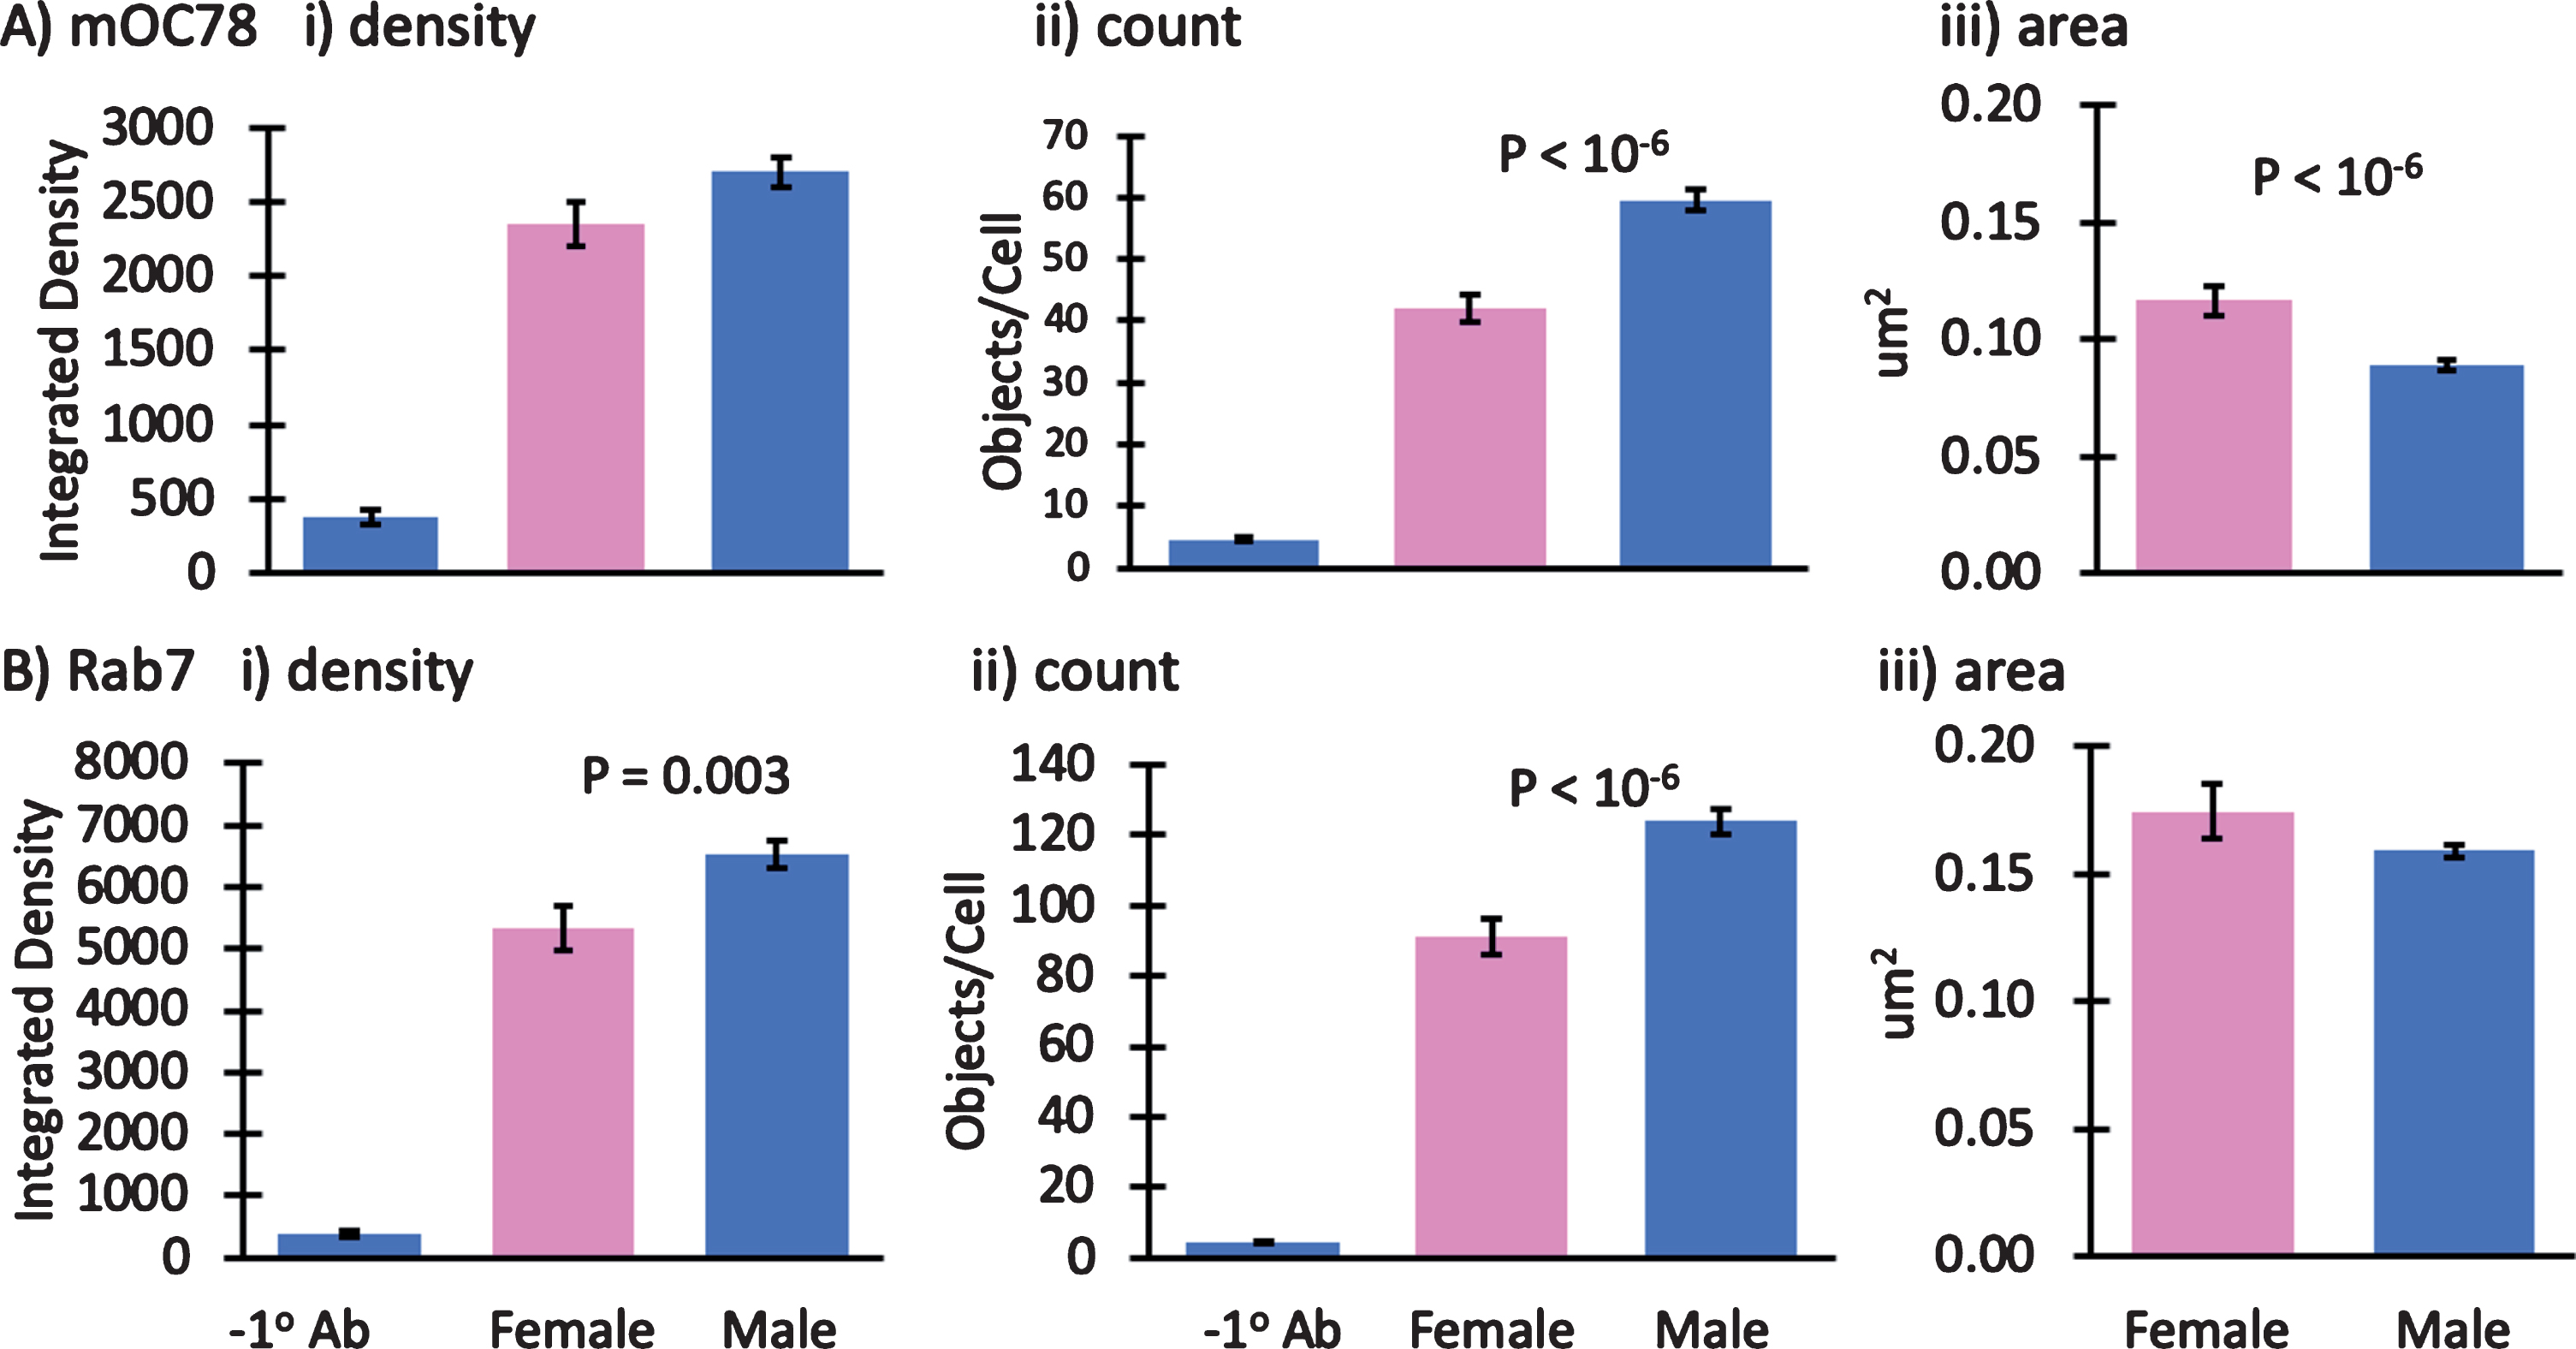
Fig.6
Exponential deposition of intracellular mOC78 Aβ deposits (red) and misfolded tau (Alz-50 tau, green) with age is accelerated by glutamate. A) Neurons stained and imaged in the same batch, at the same exposure and gain. Neurons from the 21-month-old mouse showed large extracellular deposits of mOC78i immunoreactive material (arrows). B) Exponential relationship of mOC78 increase with age. Zero glutamate: y = 98*100.22x; glutamate: y = 511*100.14x. C) Increase in mOC78 object size with age and glutamate. Distributions were fit by least squares over the range of 0.1 to 5μm2: 11-month objects = 0.634*10–1.18 *size, R2 = 0.997, 35 cells, 3306 objects; 21-month objects = 0.772*10–0.959 *size, R2 = 0.998, 48 cells, 4801 objects; 21-month with 0.5 mM glutamate objects = 1.021*10–1.053 *size, R2 = 0.994, 51 cells, 4807 objects. Inset shows small sizes on a linear scale with large effect of glutamate. Neurons were from female mice of indicated ages. File 170726. Density changes with age confirmed in male as exponential, file 180329.
Aβ45, mOC78, and AβPP-CTF colocalize with mitochondria, autophagosomes, endosomes, and lysosomes
Since the forms of iAβ processed by autophagy are unclear, we sought to determine the relationship of iAβ forms to cytochrome C as a mitochondrial marker, p62 that attaches to LCB3 and ubiquitin of autophagosomes, Rab7a as a marker that links late endosomes to dynein and kinesin molecular motors, and cathepsin D for lysosomes [25]. To be more quantitative than the yellow overlap of merged colors, we correlated pixel intensities between Aβ forms and autophagic markers for cell compartments using the colocalization function in Image J. Correlations of intensities at each pixel can range from no correlation of 0 to 1 for perfect correlation. The threshold for each color is determined automatically. An advantage of this approach is that the degree of correlation is insensitive to the maximum intensity of each color [33, 34]. This enabled investigation of which forms of iAβ collected in specific autophagic organelles, known to be affected in AD [45, 46].
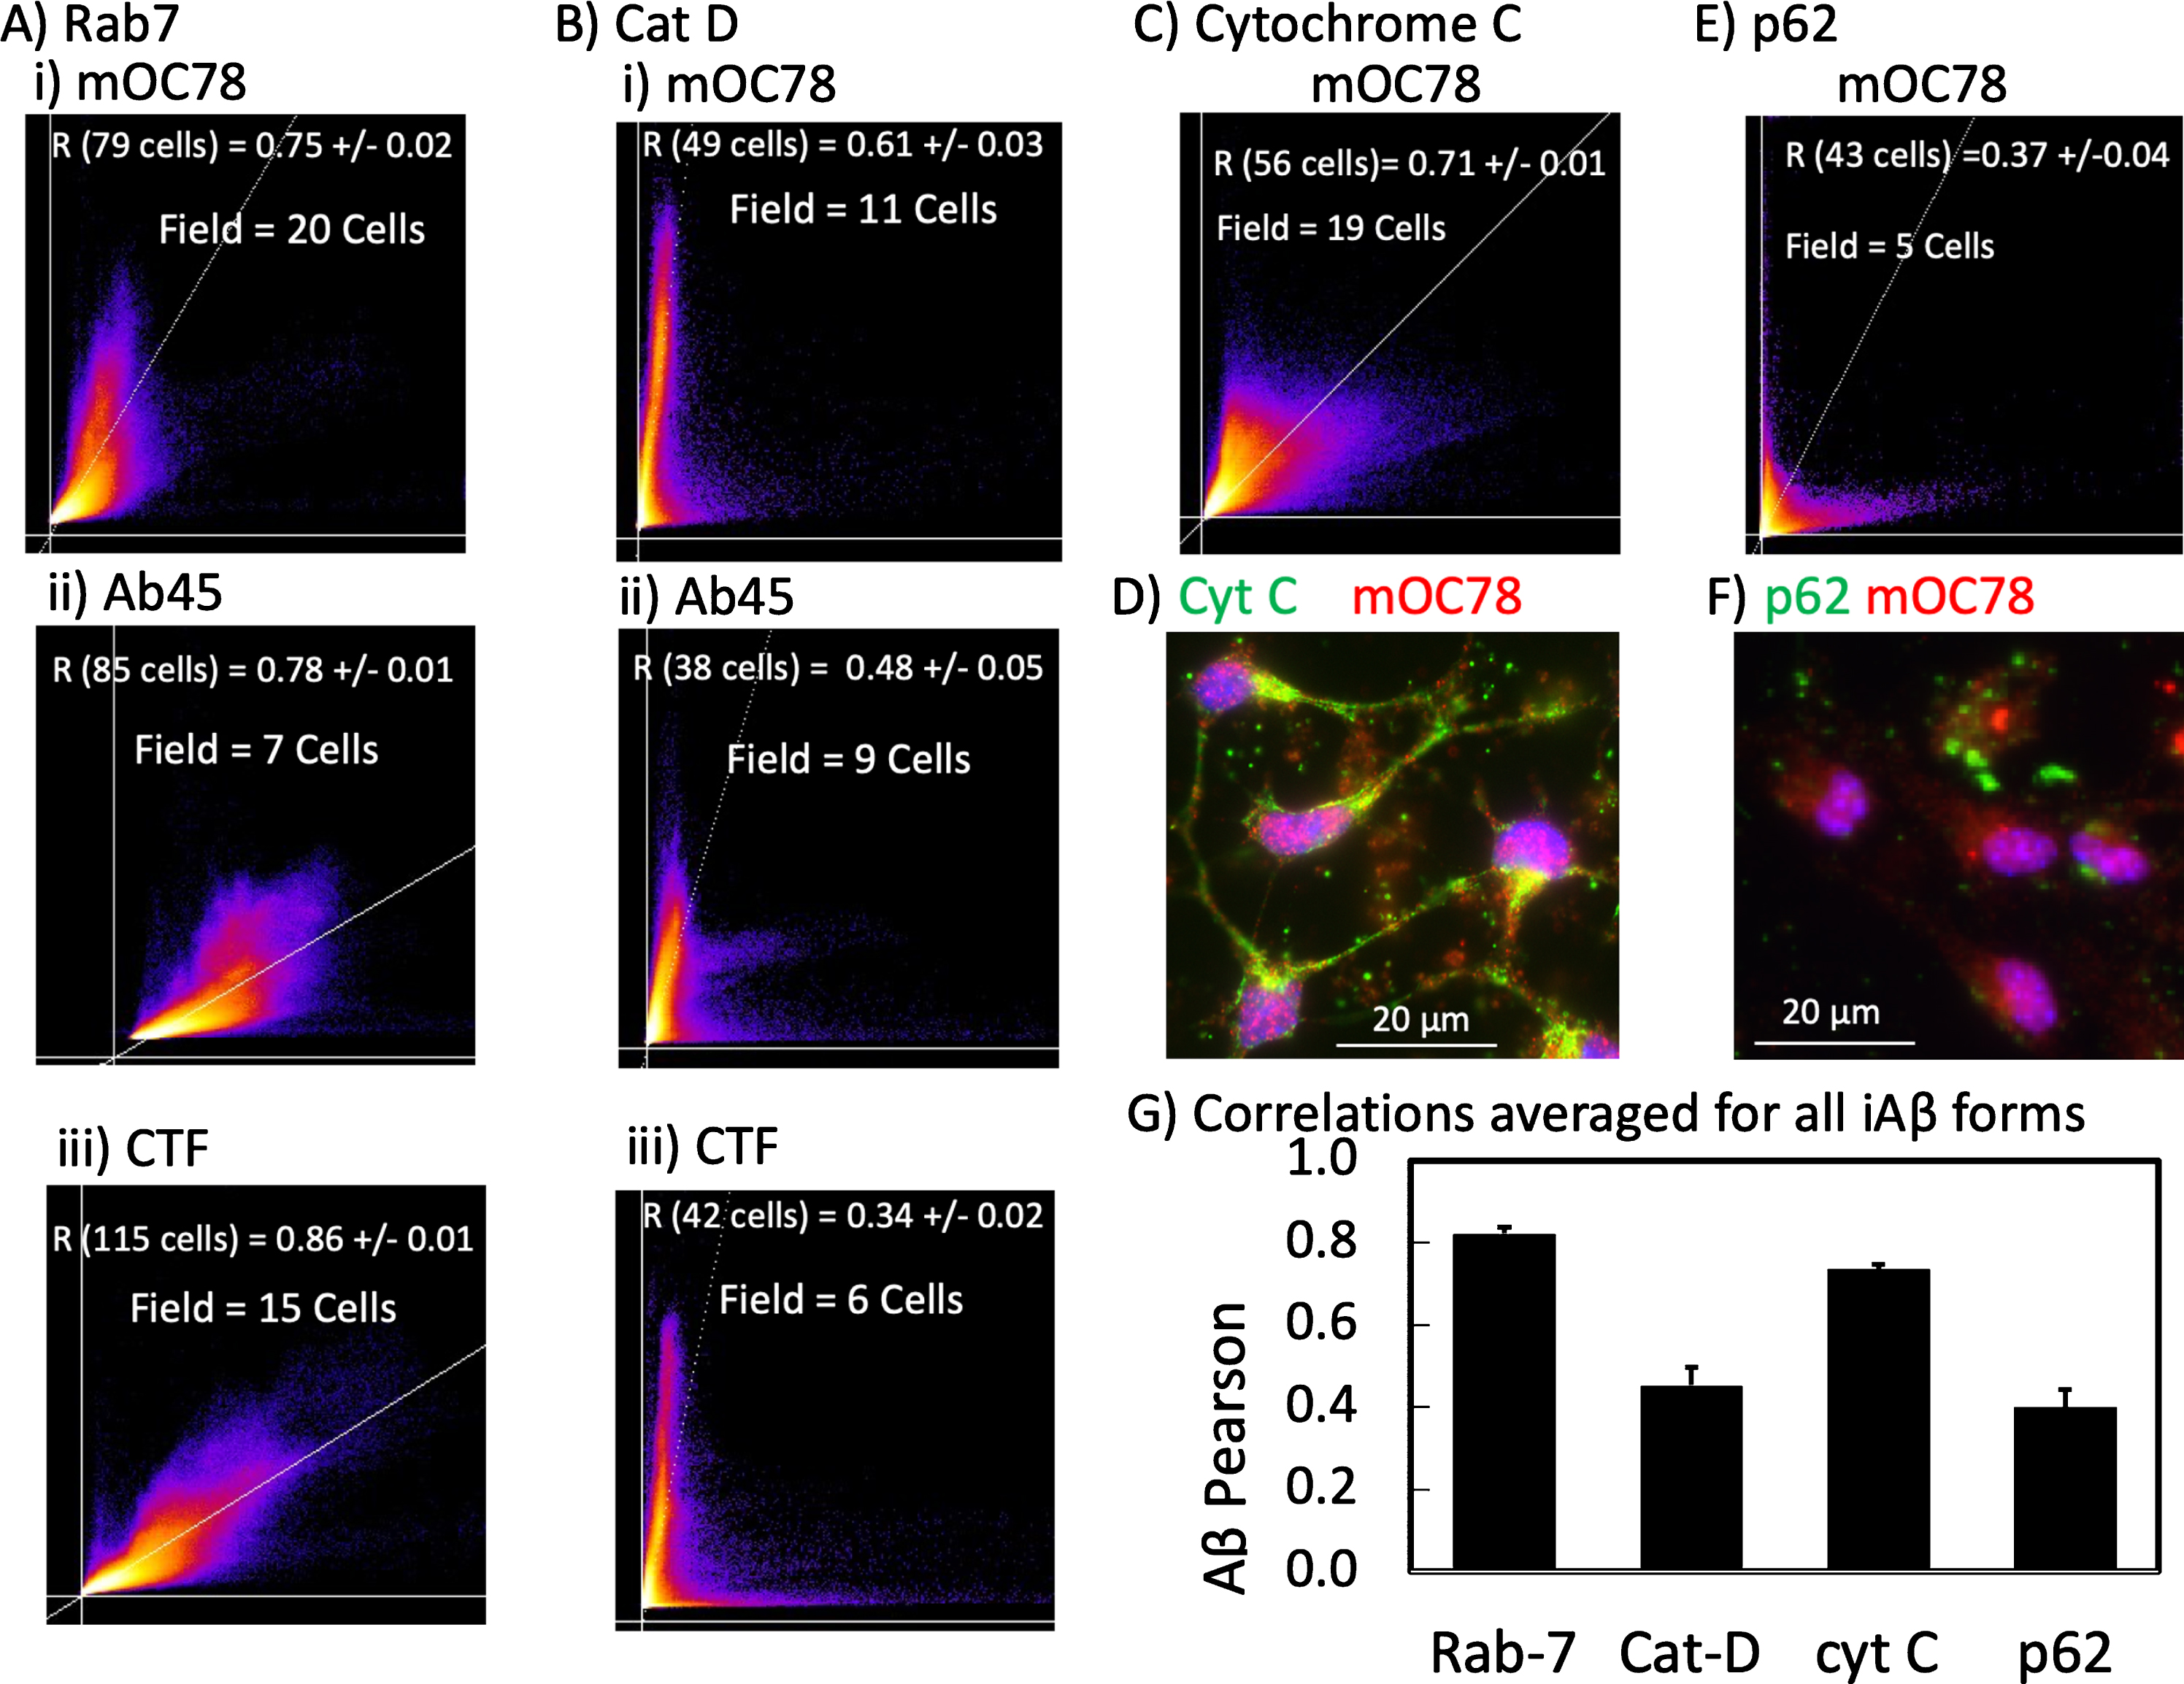
Each Aβ form (mOC78, Aβ45, and AβPP-CTF) most strongly correlated with the late endosome marker Rab-7 (Fig. 7A, G) (R = 0.82±0.02, n = 7 cultures (one from Fig. 3), independent of age from 5-11-month-old mice, 2-3 cultures per Aβ form). As expected mOC78 co-localized strongly with the commonly used anti-amyloid antibody 6E10 (R = 0.80±0.02, data not shown). Importantly, an age-matched control in non-Tg neurons from a 5-month-old mouse showed a similar correlation of 0.89±0.03 for mOC78 colocalization with Rab7, despite higher Rab-7 and 5-fold lower mOC78 signal intensity. One of these was from a non-Tg 5-month-old male with an r = 0.89±0.03 (n = 58 cells) and another from an 11-month-old male. In contrast, Fig. 7B shows the correlation of lysosomal cathepsin D to decrease from 0.61±0.03 for mOC78 to 0.48±0.05 for Aβ45 and 0.34±0.02 for AβPP-CTF. We interpret these results as less AβPP-CTF reaching fusion with lysosomes than Aβ45 and more mOC78 in lysosomal compartments; however, better clearance of AβPP-CTF cannot be ruled out. Overall Aβ forms were less detectable in lysosomes than the earlier stage of late endosomes. In Fig. 7C and G, the mitochondrial marker cytochrome C correlated with Aβ forms at r = 0.71, almost as strongly with mOC78 as Rab-7. The average of 4 experiments ranging in age from 2 to 11 months, including 1 non-Tg was fairly consistent at 0.73±0.02. An example of the strong co-localization is shown in Fig. 7D. Cytochrome C colocalization with Aβ45 produced a correlation of 0.73 as well (n = 2, a 5-month-old non-Tg male and an 11-month-old 3xTg-AD male, files 171005 and 180511, respectively). In Fig. 7E, p62 as a marker of macroautophagy including mitochondrial autophagy was considerably lower at r = 0.37±0.04 as exemplified in Fig. 7F and averaged in Fig. 7G. Together these results suggest a strong presence of iAβ forms in late endosomes and mitochondria with lower levels and sequential processing in lysosomes and autophagosomes from AβPP-CTF to Aβ45 and then mOC78. They suggest impairment in iAβ processing in the 3xTg-AD neurons at the level of fusion of late-endosomes with lysosomes.
Fig.7
iAβ forms colocalize with markers of autophagy, most strongly for mOC78 with late endosome Rab-7. Each flame graph contains the pixels from 7–20 neurons of one field. Each point is the Pearson correlation of intensities in one pixel with brighter colors indicating higher prevalence of specific colocalization intensities. Axes show automated cutoffs for pixels with no overlap. Statistics are for 6 fields. A) Equally high Rab-7 colocalization (y-axis) with i) mOC78, ii) Aβ45, and iii) CTF (each x-axis). Neurons from an 11-month-old male 3xTg-AD mouse, file 180511, composite images shown in Fig 3. B) Slightly lower colocalization of Cat D with i) mOC78 than with Rab-7; much lower cathepsin D correlations with ii) Aβ45 and iii) AβPP-CTF. Neurons from a 6-month-old female 3xTg-AD mouse, file 170901. C) Strong colocalization of cytochrome C with mOC78 as exemplified in D) field 1 from a 5-month-old 3xTg-AD male, file 171005. E) Poor colocalization of p62 with mOC78 as exemplified from F) field 4 from a 12-month-old 3xTg-AD female, file 170804 of data. G) Highest Pearson correlations averaged for three iAβ forms with Rab-7, followed by cytochrome C (similar for all forms, 2-month-old non-Tg and 3xTg-AD female file 171017, 5-month-old non-Tg and 3xTg-AD male file 171005, 11-month-old 3xTg-AD male file 180511. Significantly lower correlations for cathepsin D and p62 (cat-D: CTF average r = 0.37, n = 2 6-month-old 3xTg-AD female file 171213, 11-month-old female file 170830. Aβ45 average r = 0.49, n = 3 6-month-old 3xTg-AD female file 170901, 9-month-old 3xTg-AD male file 170428, 10-month-old 3xTg-AD male file 170428. p62: r = 0.43 10-month-old 3xTg-AD male file 170512, r = 0.37 11-month-old 3xTg-AD female file 170804).
Differential in vitro kinetics of accumulation of iAβ markers
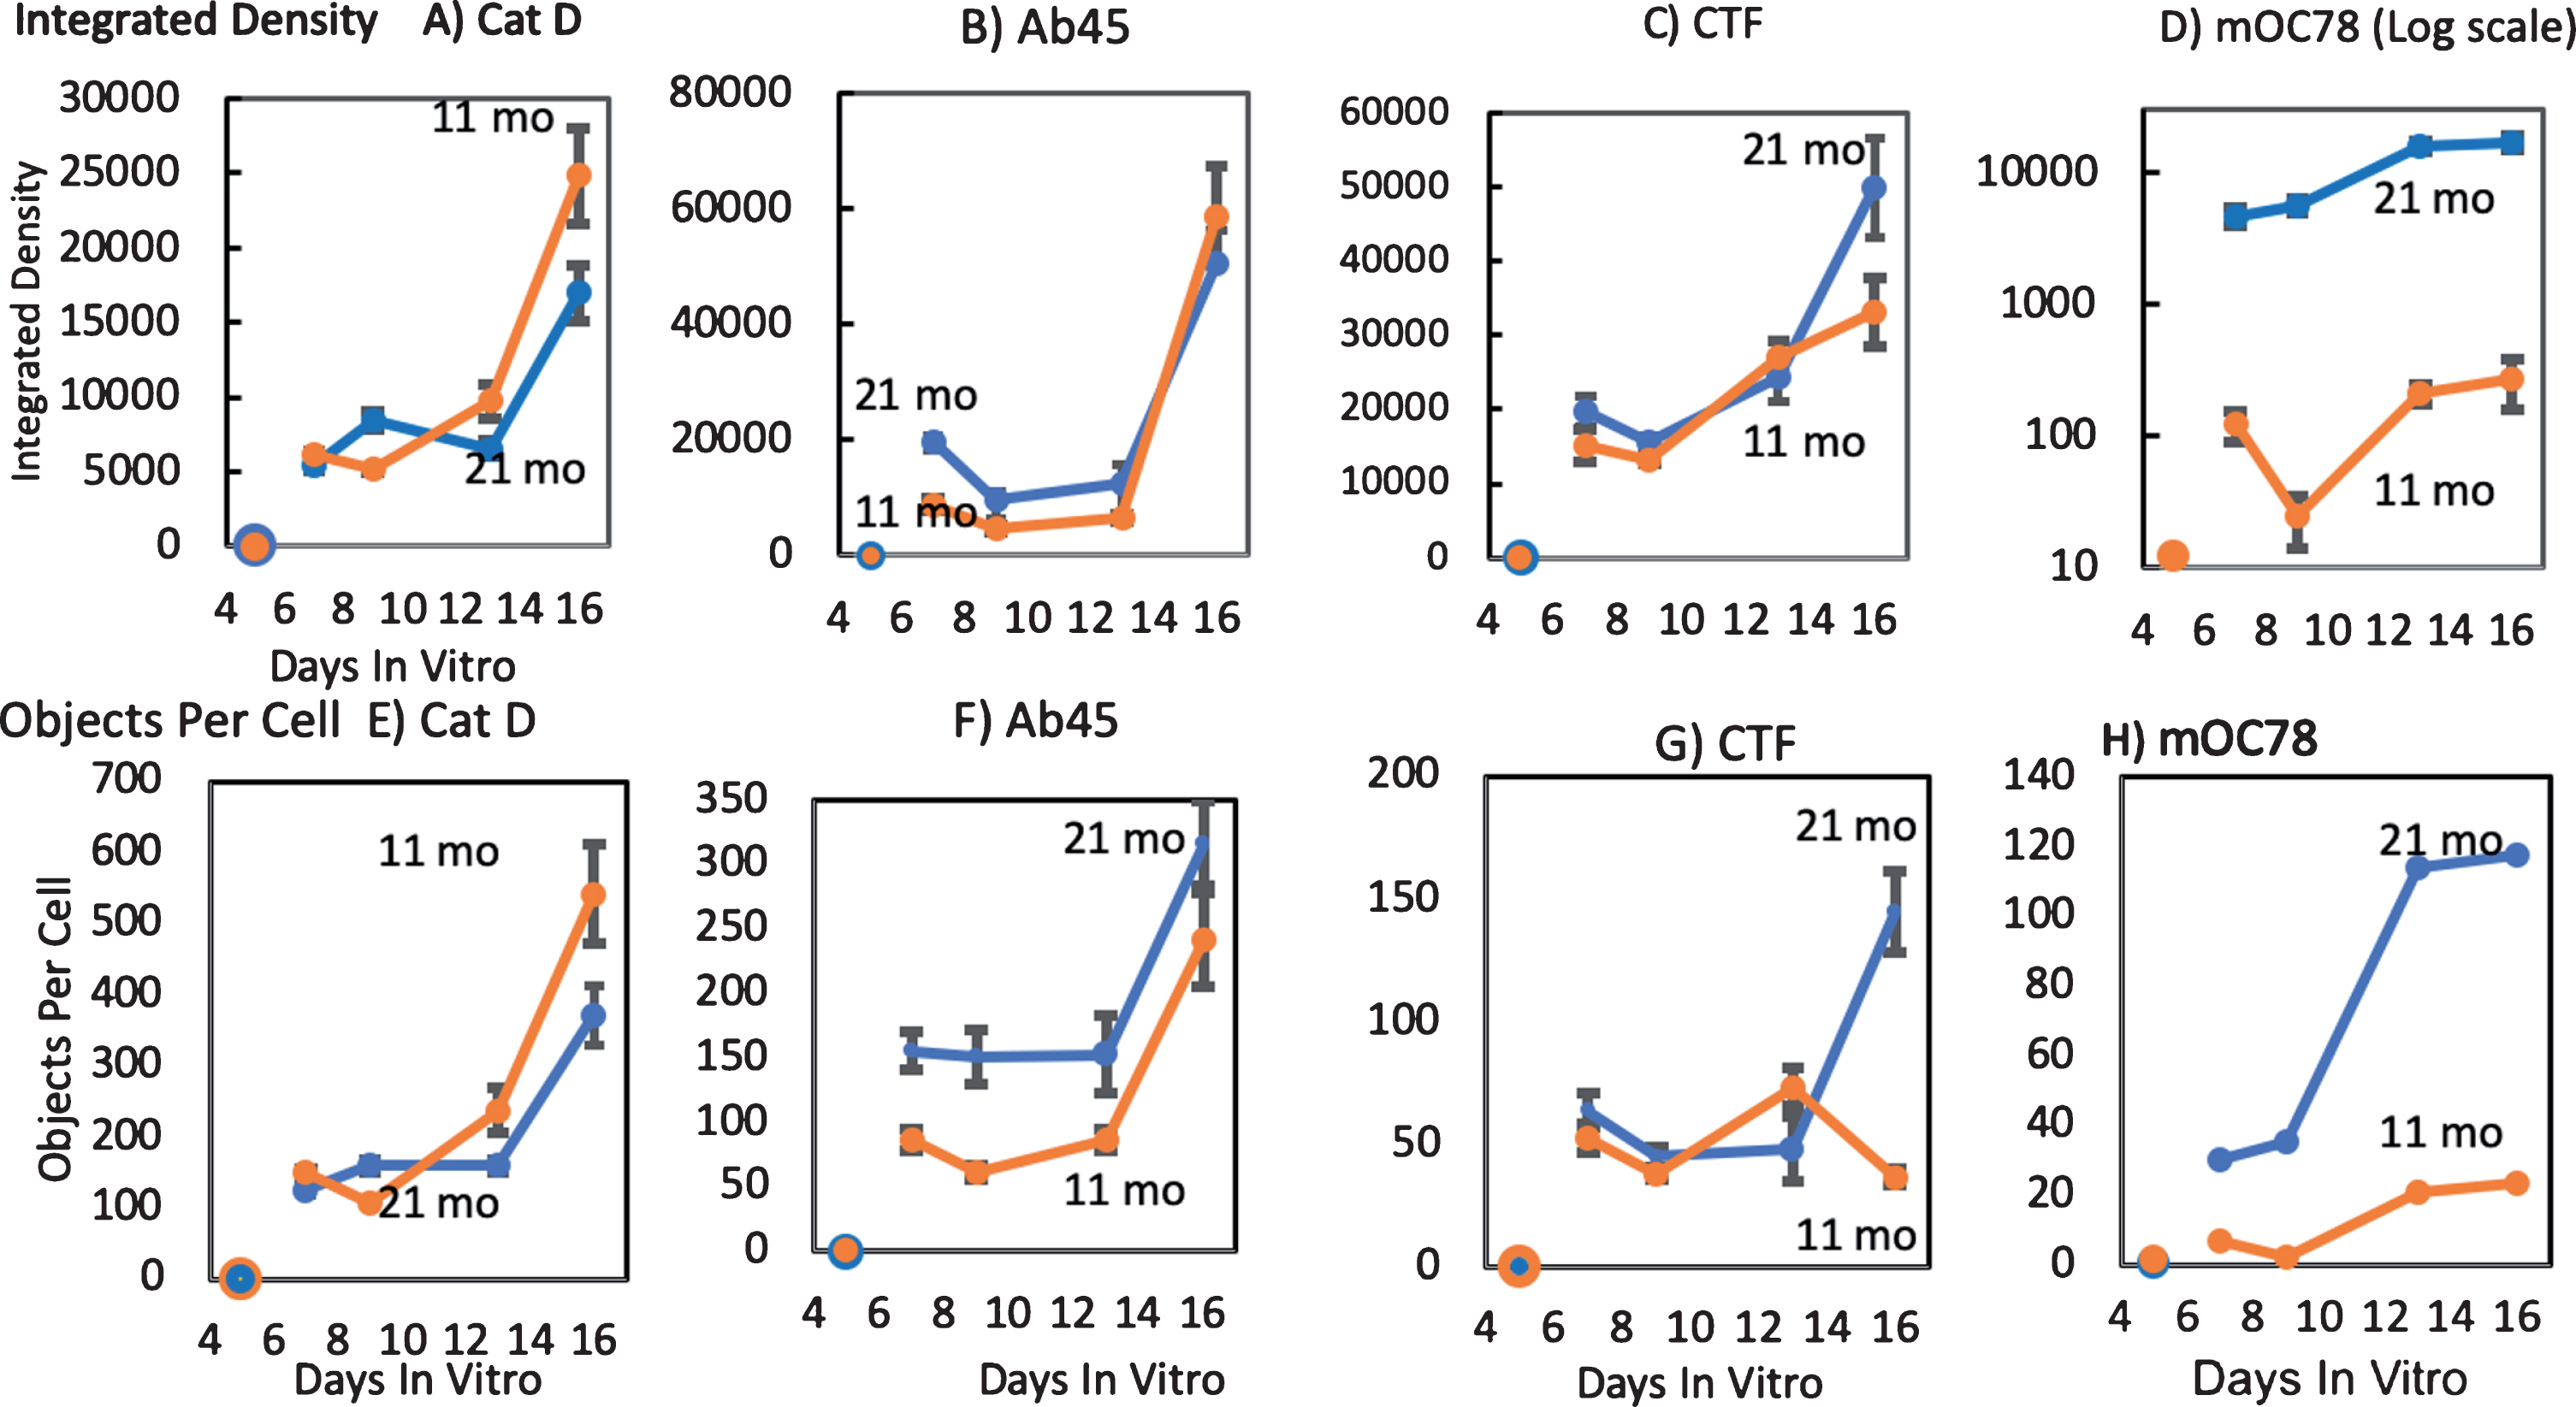
Neurons isolated from adult brains begin as spherical somata. As they regenerate axons and dendrites in culture, the total cellular mass increases. We compared this mass effect to production of iAβ forms as determined by antibodies against Aβ45, mOC78, anti-AβPP-CTF, and the lysosomal marker Cat D. With days in vitro, mass as integrated density per cell and objects per cell increased at least four-fold in both ages in all measures (Fig. 8). The older age levels of Aβ45 were about double those of the middle-age neurons at early times (Fig. 8B, F). At later times, AβPP-CTF production increased (Fig. 8C, G). Old-age neuronal mOC78 levels were almost 100-fold higher in density and 6-fold higher in objects per cell than middle-age neurons (Fig. 8D, H). These large effects suggest that age alters the development and maturation of mOC78 iAβ aggregate forms in excess of the increase in neuron mass or CTF.
Fig.8
Greatest age-related increases in mOC78 by in vitro kinetics. Immunoreactive integrated density of (A) lysosomal Cathepsin D and (B-D) iAβ forms for neurons from an 11 (orange) and a 21-month-old (blue) female 3xTg-AD mouse. These results are paralleled by measures of objects counted per cell (E-H) from the same cells. Similar kinetics for anti-cathepsin D immunoreactivity (A, E), and iAβ forms (A, E), Aβ45 (B,F), AβPP-CTF (C, G), and mOC78 (D, H). Note that panel D, Y axis is log scale. File 170712.
Modulation of autophagy and glutamate affects Aβ45 levels
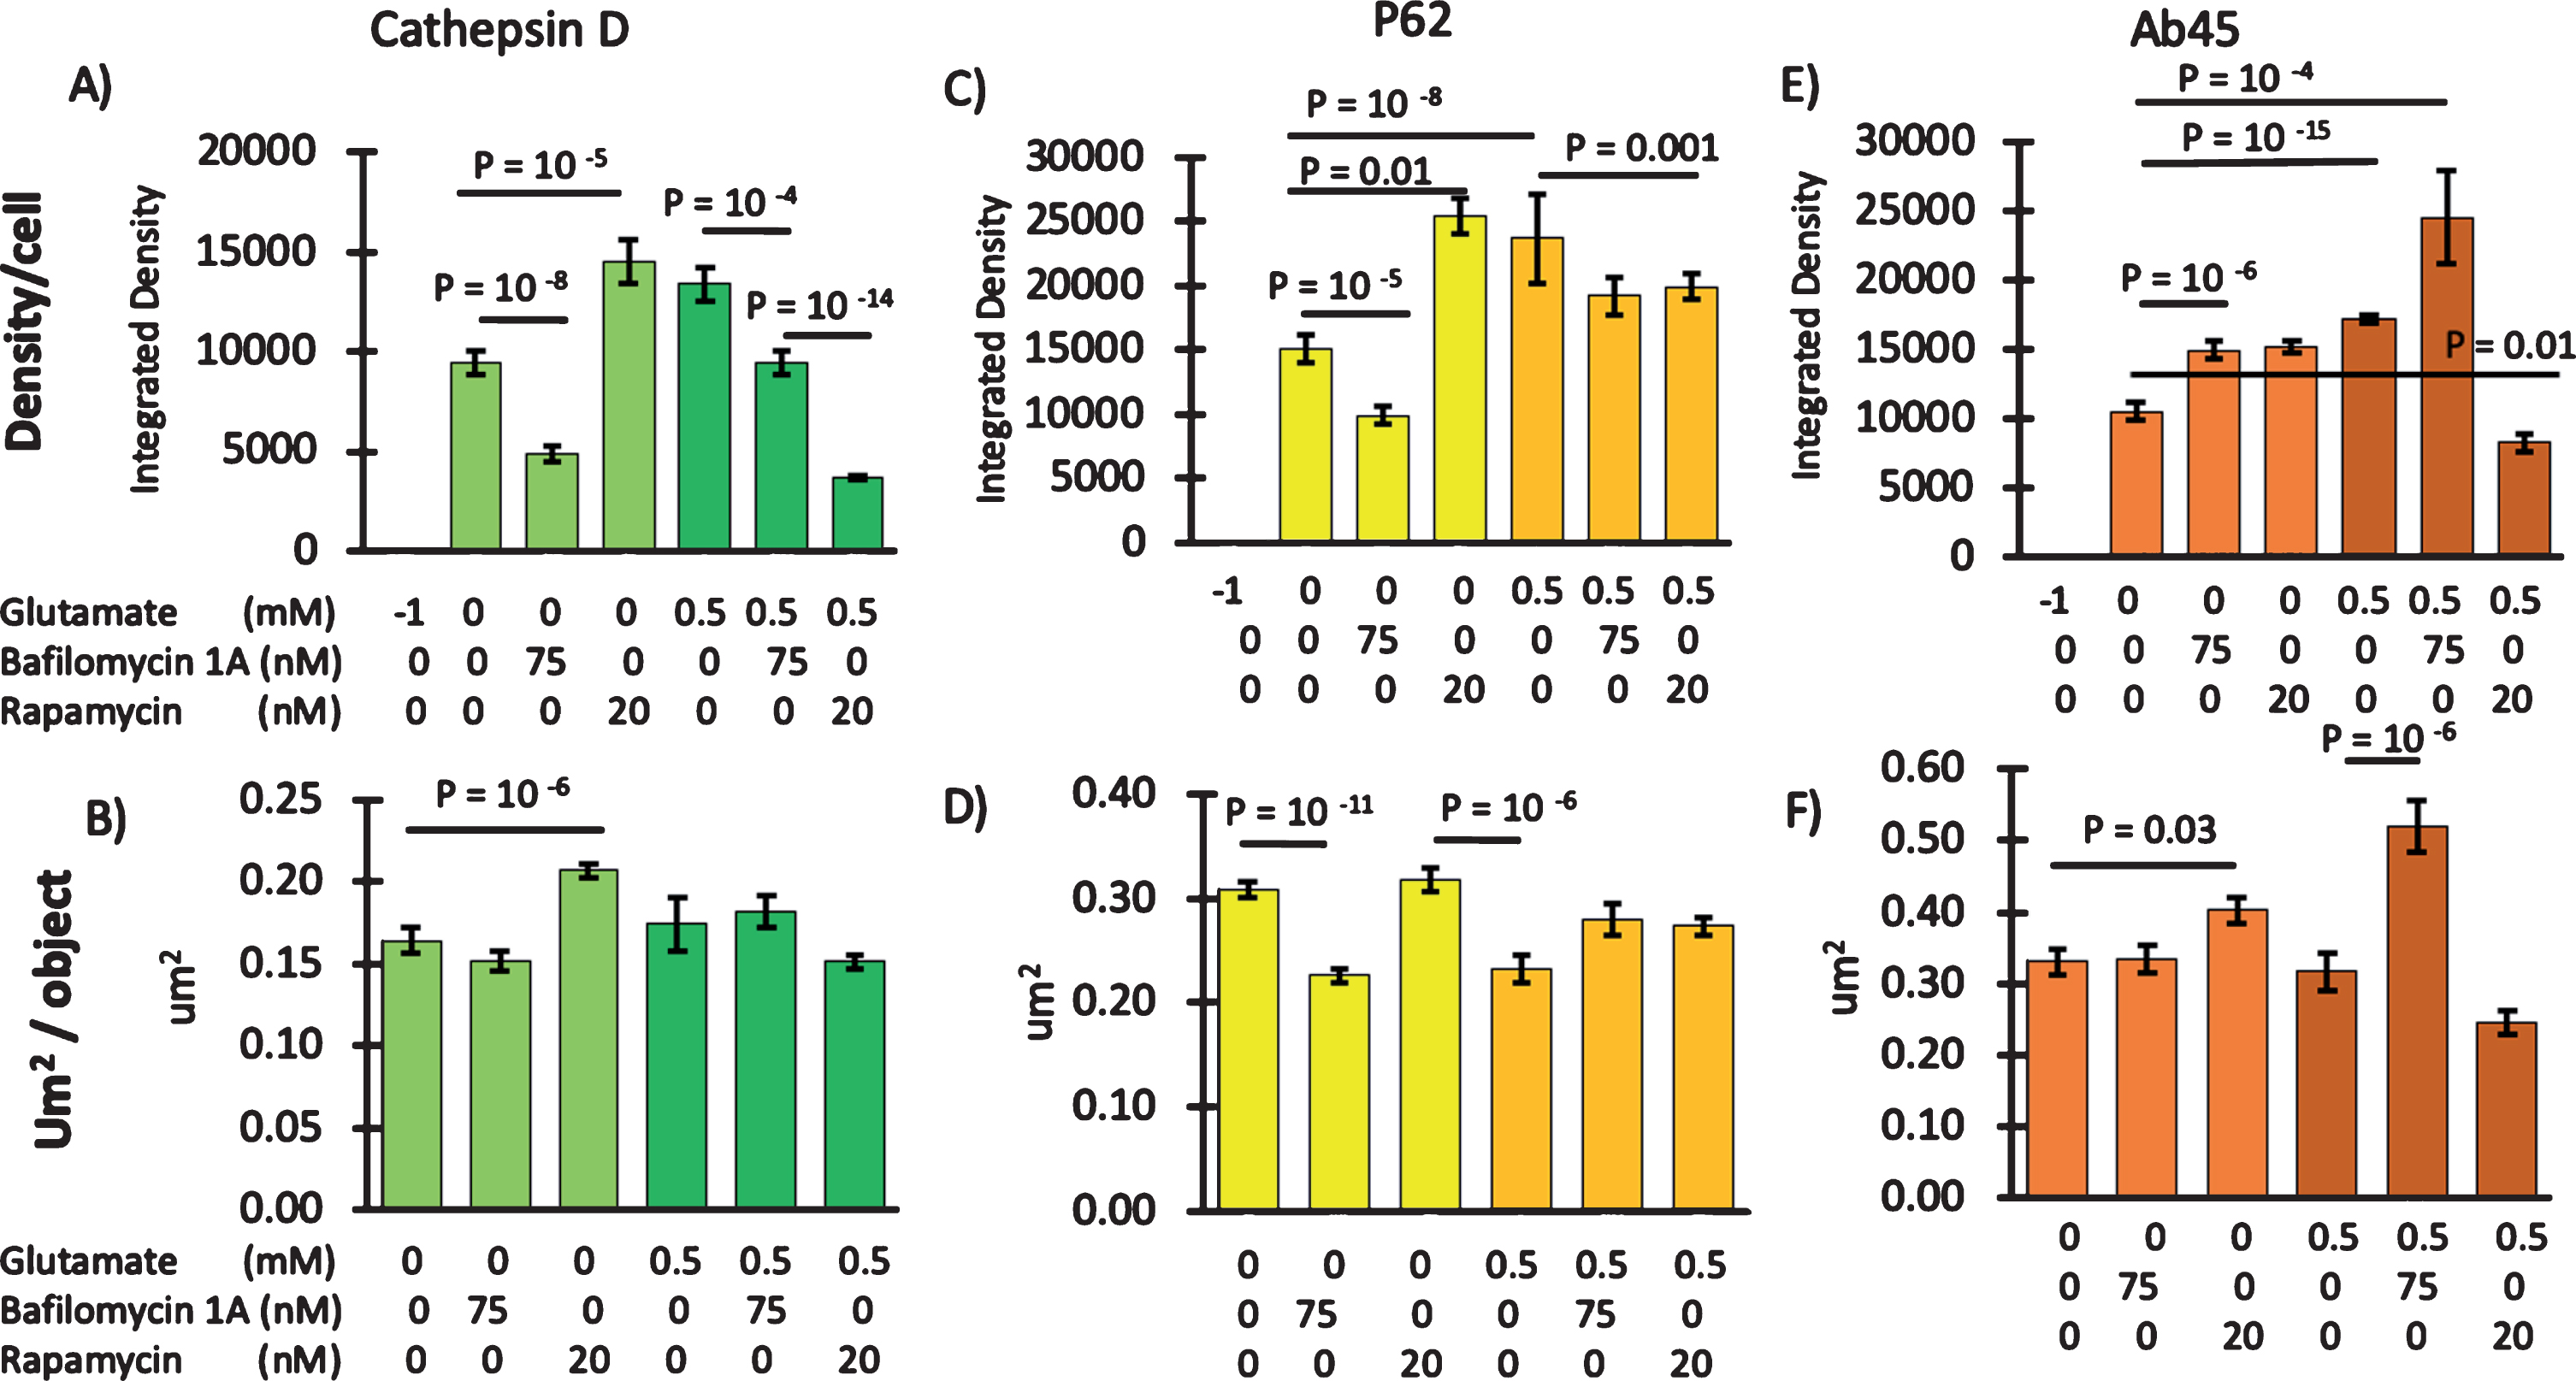
We pharmacologically modulated autophagy to determine the effects on Aβ45 levels. If Aβ45 was being cleared by autophagy, then inhibition of autophagy would be expected to cause Aβ45 accumulation and promotion of autophagy would accelerate Aβ45 clearance. As a negative control, we used bafilomycin to inhibit the proton-pumping ATPase that acidifies lysosomes [47] and prevent fusion of lysosomes with autophagic vesicles [48]. Figure 9A shows the expected decrease in cathepsin D immunoreactive density with bafilomycin, although the size of reactive objects per cell did not decrease (Fig. 9B). Independently, p62 for assembly of autophagosomes also responded with a decrease in density and object size (Fig. 9C, D). As a positive control to stimulate autophagy, we used the inhibitor of mTOR, rapamycin [49]. Rapamycin increased cathepsin D and p62 levels (Fig. 9A, C) as well as cathepsin object size (Fig. 9B) and objects per cell from 112 to 184 (not shown). Interestingly, iAβ45 immunoreactivity increased with either inhibition or promotion of autophagy (Fig. 9E) and imaged particle sizes increased with rapamycin (Fig. 9F). Furthermore, colocalization of iAβ45 with cathepsin D was unchanged by either change in autophagy (r = 0.58±0.04). In contrast, the lower correlation of iAβ45 with p62 (r = 0.43±0.03) was decreased further by promotion of autophagy with rapamycin to 0.32±0.03. These results need to be viewed in two contexts, differences in iAβ45 localization to the endosomal versus the macroautophagy branch of autophagy and which pathway is affected in the 3xTg-AD neurons. Figure 9A and C show that bafilomycin inhibition of lysosomal acidification and degradation activity increased iAβ and long iAβ. Rapamycin which increases autophagy and increases the uptake of AβPP and CTF substrates into endosomes and autophagosomes, resulted in an increase in iAβ and long iAβ steady state levels by a different mechanism. Thus, Fig. 9E and F treatment with glutamate further shows that iAβ45 immunoreactivity is increased by the Ca and energetic load of glutamate as well as bafilomycin alone, but the combination of bafilomycin + glutamate further increased iAβ45. This suggests that an energetic load contributes to iAβ45 production. The reduction in Aβ levels following stimulation by rapamycin + glutamate suggests both that autophagic clearance was impaired at rest and more so following a glutamate pulse, but that inhibition of an intact autophagic machinery needed rapamycin to reverse it. We interpret these results as increased iAβ45 accumulation from backup of inhibited autophagy and increased iAβ45 buildup from promotion of autophagy with inability to degrade or secrete iAβ45.
Fig.9
Autophagy of iAβ45 compared to a glutamate burden. A) Cathepsin D immunoreactiivty for lysosomes as integrated density per cell and B) as object size. C, D) Same measures in sister cultures for macroautophagic marker p62. E, F) same measures for iAβ45. For each stain paired with Aβ45 stain, sister cultures were treated with the indicated concentrations of glutamate, the autophagic inhibitor bafilomycin 1A or the autophagic stimulator rapamycin. “–1” represents the adjustment of detection threshold to zero for a sister culture in which the primary antibody was omitted. Each bar is the average from 31–45 neurons from a 3xTg 10-month-old male, file 170512.
DISCUSSION
New antibodies dissect autophagic steps for accumulation of iAβ
The composition and aggregation state of iAβ has been one of the major controversies surrounding the significance of iAβ. Because of limitations on the specificity of anti-Aβ antibodies, many investigators have argued that intraneuronal amyloid was actually “normal” AβPP or AβPP-CTF99. In cultured adult neurons from 3xTg-AD mice across the age-span with novel antibodies against Aβ45 and aggregated forms (mOC78 [17]), we address important mechanistic questions about the pathways of iAβ production and removal with implications for possible pathology and therapeutics. Here, we found evidence for substantial accumulation of intracellular Aβ-related forms, including AβPP-CTF, long Aβ peptides ending at residue 45 C-terminal peptide and aggregated Aβ in the form of mOC78 immunoreactive material. Interestingly, all three forms were present in Rab-7 late endosomes, while accumulation into cathepsin D positive lysosomes was strongest for the mOC78 aggregated iAβ (Fig. 1), which may be indicative of further autophagic processing of the late endosomes.
Autophagy
AD-related deficits in lysosomal and autophagic processing are well established [45, 46], but the contributions of aging to different forms of iAβ are not well documented. Here we were able to compare the colocalization of three forms of iAβ to four steps in autophagy in two pathways, endocytosis and macroautophagy. AβPP interacts with BACE (β-secretase) at the plasma membrane [50], is internalized and concentrated with BACE in endosomes [51–53]. Whether BACE cleavage of AβPP to AβPP-CTF99 occurs first at the plasma membrane or only subsequent to endocytosis is unclear, especially since most studies of AβPP processing are done in non-neuronal cells and have not studied how an aging environment and signaling affect this process [53, 54] (Fig. 1). Early endosomal trafficking is controlled by Rab5. Maturation proceeds by replacement of Rab5 with Rab7 in late endosomes. The next step is either return to the plasma membrane for receptor recycling and exocytosis [51] or fusion with lysosomes, termed autophagolysosomes. Here we see higher levels of Aβ45 and aggregated Aβ in late endosomes than in cathepsin D positive autophagolysosomes, suggesting that some CTF99 is processed by gamma-secretase to Aβ in late endosomes. Localized activation of BACE in endosomes and binding of BACE1 to Rab5 and AβPP is thought to generate CTF99 and vesicle enlargement [45]. Separately, mitochondrial macroautophagy enters from a separate pathway for fusion with lysosomes. Both a late endosomal compartment and mitochondria showed strong colocalization with iAβ forms. A weaker colocalization signal with p62-directed formation of macro autophagosomes together with the above-mentioned weaker lysosomal colocalization may indicate age and AD-related deficits in several steps of autophagy. Autophagy may be blocked by the neuron’s inability to degrade or secrete aggregates of Aβ45. Age-related deficits in bioenergetic capacity [55] may be an upstream cause of endosomal or lysosomal limitations on ATPase acidification of these organelles [56]. Our results here by bafilomycin inhibition of acidification showed decreased cathepsin D positive lysosomes, and macroautophagic p62 levels, while Aβ45 levels increased. These results suggest additional capacity in these neurons to produce more Aβ45. A further increase by glutamate in the presence of bafilomycin indicates additional signaling mechanisms for increased Aβ45. Conversely, rapamycin treatment to stimulate the mTOR pathway of autophagy promoted cathepsin D and p62 levels, while only modestly increased Aβ45 levels were seen with glutamate stimulated inhibition of autophagy. Recently, Fang et al. 57] demonstrated that stimulation of mitophagy through NAD+ supplementation, urolithin A, and actinonin diminished iAβ in human neuroblastoma cells and improved cognition in AβPP/PS1 mice. These results support age- and AD-related deficits in the mTOR pathway [50] and deficits in pAkt modulation of this pathway [58]. Further work is needed to discriminate between the fusion process, aspects of energized motor proteins for vesicle trafficking [59], processing of the Aβ-CTF motif [11, 60], processing of cytoplasmic Aβ by chaperone mediated autophagy [61] in age-related effects on iAβ accumulation. These results confirm and extend histology and immunoblot results of age-related changes in late-endosome regulation in the AβPP/PS1 mouse brain [39].
Aging
Age contributed the largest effects seen here on iAβ, both as Aβ45 and aggregated mOC78 immunoreactivity. Aβ45 and mOC78 were seen to increase logarithmically with age. The increases were greater than 10-fold across the age-span of the transgenic mouse, both in terms of immunoreactive material per neuron and objects per neuron. The distribution of object sizes was well-fit by a log-log relationship, with similar slopes for non-Tg and 3xTg-AD neurons, suggesting a similar mechanism of formation without the transgenes. An excess of large particles in the 3xTg-AD neurons from middle to old age, particles approaching a large portion of a whole cell, suggest a process unable to be controlled. Our kinetic studies of development in culture with constant nutrients, first of dendrites, then axons and synapses, indicate the strongest effects on mOC78 aggregation of iAβ. These log-log distributions are reminiscent of particle nucleation followed by increasing creation of surface area for additional aggregation, a snow-ball effect. Intracellular aggregation of externally added Aβ1 - 42 was seen to aggregate up to 0.2μm diameter in SH-SY5Y neuroblastoma cells [62], but the extent could have been influenced by the size of the label, the undifferentiated state of the cells and lack of an aging epigenome. The differences with age suggest that either the rate of formation of iAβ increases or their rate of autophagic clearance decreases with age. Glutamate could do either. Dissection of the mechanism could be informed by age-related effects of inhibition or promotion of autophagy. Age-related energetic deficits in neurons may be partially responsible [55, 63–66], since age-related deficits in NADH levels can be restored in neurons with precursors to NAD [45, 67].
Tau and glutamate
We also found phosphorylated tau as Alz-50 immunoreactivity deposited in forms resembling neurofibrillary tangles in neurons with iAβ, especially in neurons from old animals. Alz-50 is an early marker seen in neurofibrillary tangles in AD brains as well as in normal-appearing neurons [31, 32]. It remains to be determined how similar our structures are to the paired helical filaments induced by glutamate in cultured human fetal spinal cord neurons [68] or embryonic rat neurons [69]. A mechanism for the calcium effects on iAβ45 and aggregated tau could be due to the well-known effects of glutamate on Ca++ entry to stimulate calcineurin [70], old-age limits on calcineurin activity through phosphorylation [71], effects on AβPP processing of AD-related inhibition of calcineurin by DSCR1 [72], or the bioenergetic load on the Na-K-ATPase and Ca-ATPase pumps. Alternatively, the oxidative stress of glutamate exposure could induce energy deficits or impair other essential functions that contribute to iAβ, as it does in neuroblastoma cells [73].
Processing and conclusion
We speculate that age-related signaling for inhibition of C-terminal trimming by gamma-secretase increases Aβ45 levels whose hydrophobic properties promote aggregation [Brewer et al., in preparation]. Previous studies have reported that long Aβ peptides Aβ1 - 47 and Aβ1 - 52 aggregate much faster than even Aβ42 [74] and that these long Aβs are retained and not secreted from cells [75, 76]. Early work proposed dynamic controls of the processing of Aβ to regulate the routing toward intra- versus extracellular accumulation of Aβ [77]. The interpretations of these results have metabolic and possibly mechanistic implications for impaired cognition. Some gamma-secretase inhibitors may promote the increase of toxic iAβ due to inhibition of the processivity [78]. Even shorter amyloid fragments of Aβ40 and Aβ42 may be more easily exported from the neurons and vasculature. Understanding the mechanism of age-related changes in iAβ processing may finally lead to application of countermeasures to prolong dementia-free health span [19, 79].
ACKNOWLEDGMENTS
This work was supported by funds from the UC Irvine Foundation to GB, R56 AG056507-01 to CG, and RF1 AG058218 to GB and CG.
Authors’ disclosures available online (https://www.j-alz.com/manuscript-disclosures/19-0835r1).
SUPPLEMENTARY MATERIAL
[1] The supplementary material is available in the electronic version of this article: https://dx.doi.org/10.3233/JAD-190835.
REFERENCES
[1] | Selkoe DJ ((1991) ) The molecular pathology of Alzheimer’s disease. Neuron 6: , 487–498. |
[2] | Hardy J , Allsop D ((1991) ) Amyloid deposition as the central event in the aetiology of Alzheimer’s disease. Trends Pharmacol Sci 12: , 383–388. |
[3] | Cline EN , Bicca MA , Viola KL , Klein WL ((2018) ) The amyloid-beta oligomer hypothesis: Beginning of the third decade. J Alzheimers Dis 64: , S567–S610. |
[4] | Doody RS , Raman R , Farlow M , Iwatsubo T , Vellas B , Joffe S , Kieburtz K , He F , Sun X , Thomas RG , Aisen PS , Alzheimer’s Disease Cooperative Study Steering Committee, Siemers E , Sethuraman G , Mohs R , Semagacestat Study Group ((2013) ) A phase 3 trial of semagacestat for treatment of Alzheimer’s disease. N Engl J Med 369: , 341–350. |
[5] | Quintero-Monzon O , Martin MM , Fernandez MA , Cappello CA , Krzysiak AJ , Osenkowski P , Wolfe MS ((2011) ) Dissociation between the processivity and total activity of gamma-secretase: Implications for the mechanism of Alzheimer’s disease-causing presenilin mutations. Biochemistry 50: , 9023–9035. |
[6] | Cacquevel M , Aeschbach L , Houacine J , Fraering PC ((2012) ) Alzheimer’s disease-linked mutations in presenilin-1 result in a drastic loss of activity in purified gamma-secretase complexes. PLoS One 7: , e35133. |
[7] | Fernandez MA , Klutkowski JA , Freret T , Wolfe MS ((2014) ) Alzheimer presenilin-1 mutations dramatically reduce trimming of long amyloid beta-peptides (Abeta) by gamma-secretase to increase 42-to-40-residue Abeta. J Biol Chem 289: , 31043–31052. |
[8] | Coric V , van Dyck CH , Salloway S , Andreasen N , Brody M , Richter RW , Soininen H , Thein S , Shiovitz T , Pilcher G , Colby S , Rollin L , Dockens R , Pachai C , Portelius E , Andreasson U , Blennow K , Soares H , Albright C , Feldman HH , Berman RM ((2012) ) Safety and tolerability of the gamma-secretase inhibitor avagacestat in a phase 2 study of mild to moderate Alzheimer disease. Arch Neurol 69: , 1430–1440. |
[9] | Billings LM , Oddo S , Green KN , McGaugh JL , LaFerla FM ((2005) ) Intraneuronal abeta causes the onset of early Alzheimer’s disease-related cognitive deficits in transgenic mice. Neuron 45: , 675–688. |
[10] | Gimenez-Llort L , Blazquez G , Canete T , Johansson B , Oddo S , Tobena A , LaFerla FM , Fernandez-Teruel A ((2007) ) Modeling behavioral and neuronal symptoms of Alzheimer’s disease in mice: A role for intraneuronal amyloid. Neurosci Biobehav Rev 31: , 125–147. |
[11] | Muresan V , Varvel NH , Lamb BT , Muresan Z ((2009) ) The cleavage products of amyloid-beta precursor protein are sorted to distinct carrier vesicles that are independently transported within neurites. J Neurosci 29: , 3565–3578. |
[12] | Leon WC , Canneva F , Partridge V , Allard S , Ferretti MT , DeWilde A , Vercauteren F , Atifeh R , Ducatenzeiler A , Klein W , Szyf M , Alhonen L , Cuello AC ((2010) ) A novel transgenic rat model with a full Alzheimer’s-like amyloid pathology displays pre-plaque intracellular amyloid-beta-associated cognitive impairment. J Alzheimers Dis 20: , 113–126. |
[13] | Currais A , Fischer W , Maher P , Schubert D ((2017) ) Intraneuronal protein aggregation as a trigger for inflammation and neurodegeneration in the aging brain. FASEB J 31: , 5–10. |
[14] | Takahashi RH , Nagao T , Gouras GK ((2017) ) Plaque formation and the intraneuronal accumulation of beta-amyloid in Alzheimer’s disease. Pathol Int 67: , 185–193. |
[15] | Ferretti MT , Bruno MA , Ducatenzeiler A , Klein WL , Cuello AC ((2012) ) Intracellular Abeta-oligomers and early inflammation in a model of Alzheimer’s disease. Neurobiol Aging 33: , 1329–1342. |
[16] | Bayer TA , Wirths O ((2011) ) Intraneuronal Abeta as a trigger for neuron loss: Can this be translated into human pathology? Biochem Soc Trans 39: , 857–861. |
[17] | Pensalfini A , Albay R 3rd , Rasool S , Wu JW , Hatami A , Arai H , Margol L , Milton S , Poon WW , Corrada MM , Kawas CH , Glabe CG ((2014) ) Intracellular amyloid and the neuronal origin of Alzheimer neuritic plaques. Neurobiol Dis 71: , 53–61. |
[18] | Sosna J , Philipp S , Albay R 3rd , Reyes-Ruiz JM , Baglietto-Vargas D , LaFerla FM , Glabe CG ((2018) ) Early long-term administration of the CSF1R inhibitor PLX3397 ablates microglia and reduces accumulation of intraneuronal amyloid, neuritic plaque deposition and pre-fibrillar oligomers in 5XFAD mouse model of Alzheimer’s disease. Mol Neurodegener 13: , 11. |
[19] | Brewer GJ ((2010) ) Epigenetic oxidative redox shift (EORS) theory of aging unifies the free radical and insulin signaling theories. Exp Gerontol 45: , 173–179. |
[20] | Kumar A , Yegla B , Foster TC ((2018) ) Redox signaling in neurotransmission and cognition during aging. Antioxid Redox Signal 28: , 1724–1745. |
[21] | Oddo S , Caccamo A , Shepherd JD , Murphy MP , Golde TE , Kayed R , Metherate R , Mattson MP , Akbari Y , LaFerla FM ((2003) ) Triple-transgenic model of Alzheimer’s disease with plaques and tangles. Intracellular abeta and synaptic dysfunction. Neuron 39: , 409–421. |
[22] | Oakley H , Cole SL , Logan S , Maus E , Shao P , Craft J , Guillozet-Bongaarts A , Ohno M , Disterhoft J , Van Eldik L , Berry R , Vassar R ((2006) ) Intraneuronal beta-amyloid aggregates, neurodegeneration, and neuron loss in transgenic mice with five familial Alzheimer’s disease mutations: Potential factors in amyloidplaque formation. J Neurosci 26: , 10129–10140. |
[23] | Brewer GJ , Torricelli JR ((2007) ) Isolation and culture of adult neurons and neurospheres. Nat Protoc 2: , 1490–1498. |
[24] | Brewer GJ , Torricelli JR , Evege EK , Price PJ ((1993) ) Optimized survival of hippocampal neurons in B27-supplemented Neurobasal, a new serum-free medium combination. J Neurosci Res 35: , 567–576. |
[25] | Cataldo AM , Hamilton DJ , Barnett JL , Paskevich PA , Nixon RA ((1996) ) Properties of the endosomal-lysosomal system in the human central nervous system: Disturbances mark most neurons in populations at risk to degenerate in Alzheimer’s disease. J Neurosci 16: , 186–199. |
[26] | Vardarajan BN , Bruesegem SY , Harbour ME , Inzelberg R , Friedland R , St George-Hyslop P , Seaman MN , Farrer LA ((2012) ) Identification of Alzheimer disease-associated variants in genes that regulate retromer function. Neurobiol Aging 33: , 2231 e2215–2231 e2230. |
[27] | Hyttinen JM , Niittykoski M , Salminen A , Kaarniranta K ((2013) ) Maturation of autophagosomes and endosomes: A key role for Rab7. Biochim Biophys Acta 1833: , 503–510. |
[28] | Arnoult D , Grodet A , Lee YJ , Estaquier J , Blackstone C ((2005) ) Release of OPA1 during apoptosis participates in the rapid and complete release of cytochrome c and subsequent mitochondrial fragmentation. J Biol Chem 280: , 35742–35750. |
[29] | Joshi G , Gan KA , Johnson DA , Johnson JA ((2015) ) Increased Alzheimer’s disease-like pathology in the APP/ PS1DeltaE9 mouse model lacking Nrf2 through modulation of autophagy. Neurobiol Aging 36: , 664–679. |
[30] | Hatami A , Albay R 3rd , Monjazeb S , Milton S , Glabe CG ((2014) ) Monoclonal antibodies against Abeta42 fibrils distinguish multiple aggregation state polymorphisms in vitro and in Alzheimer disease brain. J Biol Chem 289: , 32131–32143. |
[31] | Wolozin B , Davies P ((1987) ) Alzheimer-related neuronal protein A68: Specificity and distribution. Ann Neurol 22: , 521–526. |
[32] | Hyman BT , Van Hoesen GW , Wolozin BL , Davies P , Kromer LJ , Damasio AR ((1988) ) Alz-50 antibody recognizes Alzheimer-related neuronal changes. Ann Neurol 23: , 371–379. |
[33] | Brewer GJ ((1997) ) Isolation and culture of adult rat hippocampal neurons. J Neurosci Meth 71: , 143–155. |
[34] | Patel JR , Brewer GJ ((2003) ) Age-related changes in neuronal glucose uptake in response to glutamate and beta-amyloid. J Neurosci Res 72: , 527–536. |
[35] | Jones TT , Brewer GJ ((2010) ) Age-related deficiencies in complex I endogenous substrate availability and reserve capacity of complex IV in cortical neuron electron transport. Biochim Biophys Acta 1797: , 167–176. |
[36] | Costes SV , Daelemans D , Cho EH , Dobbin Z , Pavlakis G , Lockett S ((2004) ) Automatic and quantitative measurement of protein-protein colocalization in live cells. Biophys J 86: , 3993–4003. |
[37] | Adler J , Parmryd I ((2010) ) Quantifying colocalization by correlation: The Pearson correlation coefficient is superior to the Mander’s overlap coefficient. Cytometry A 77: , 733–742. |
[38] | Wong YC , Ysselstein D , Krainc D ((2018) ) Mitochondria-lysosome contacts regulate mitochondrial fission via RAB7 GTP hydrolysis. Nature 554: , 382–386. |
[39] | Ba L , Chen XH , Chen YL , Nie Q , Li ZJ , Ding FF , Zhang M ((2017) ) Distinct Rab7-related endosomal-autophagic-lysosomal dysregulation observed in cortex and hippocampus in APPswe/PSEN1dE9 mouse model of Alzheimer’s disease. Chin Med J (Engl) 130: , 2941–2950. |
[40] | Rogawski MA , Wenk GL ((2003) ) The neuropharmacological basis for the use of memantine in the treatment of Alzheimer’s disease. CNS Drug Rev 9: , 275–308. |
[41] | Disterhoft JF , Moyer JR , Thompson LT ((1994) ) The calcium rationale in aging and Alzheimer’s disease. Ann NY Acad Sci 747: , 382–406. |
[42] | Ikonomovic MD , Sheffield R , Armstrong DM ((1995) ) AMPA-selective glutamate receptor subtype immunoreactivity in the hippocampal formation of patients with Alzheimer’s disease. Hippocampus 5: , 469–486. |
[43] | Masliah E , Alford M , Deteresa R , Mallory M , Hansen L ((1996) ) Deficient glutamate transport is associated with neurodegeneration in Alzheimer’s disease. Ann Neurol 40: , 759–766. |
[44] | Um JW , Kaufman AC , Kostylev M , Heiss JK , Stagi M , Takahashi H , Kerrisk ME , Vortmeyer A , Wisniewski T , Koleske AJ , Gunther EC , Nygaard HB , Strittmatter SM ((2013) ) Metabotropic glutamate receptor 5 is a coreceptor for Alzheimer abeta oligomer bound to cellular prion protein. Neuron 79: , 887–902. |
[45] | Colacurcio DJ , Pensalfini A , Jiang Y , Nixon RA ((2018) ) Dysfunction of autophagy and endosomal-lysosomal pathways: Roles in pathogenesis of Down syndrome and Alzheimer’s disease. Free Radic Biol Med 114: , 40–51. |
[46] | Reddy PH , Yin X , Manczak M , Kumar S , Jangampalli Adi P , Vijayan M , Reddy AP ((2018) ) Mutant APP and Amyloid beta-induced defective autophagy, mitophagy, mitochondrial structural and functional changes and synaptic damage in hippocampal neurons from Alzheimer’s disease. Hum Mol Genet 27: , 2502–2516. |
[47] | Mousavi SA , Kjeken R , Berg TO , Seglen PO , Berg T , Brech A ((2001) ) Effects of inhibitors of the vacuolar proton pump on hepatic heterophagy and autophagy. Biochim Biophys Acta 1510: , 243–257. |
[48] | Yamamoto A , Tagawa Y , Yoshimori T , Moriyama Y , Masaki R , Tashiro Y ((1998) ) Bafilomycin A1 prevents maturation of autophagic vacuoles by inhibiting fusion between autophagosomes and lysosomes in rat hepatoma cell line, H-4-II-E cells. Cell Struct Funct 23: , 33–42. |
[49] | Talboom JS , Velazquez R , Oddo S ((2015) ) The mammalian target of rapamycin at the crossroad between cognitive aging and Alzheimer’s disease. Aging Mech Disease 1: , 15008. |
[50] | Kinoshita A , Fukumoto H , Shah T , Whelan CM , Irizarry MC , Hyman BT ((2003) ) Demonstration by FRET of BACE interaction with the amyloid precursor protein at the cell surface and in early endosomes. J Cell Sci 116: , 3339–3346. |
[51] | Cirrito JR , Kang JE , Lee J , Stewart FR , Verges DK , Silverio LM , Bu G , Mennerick S , Holtzman DM ((2008) ) Endocytosis is required for synaptic activity-dependent release of amyloid-beta in vivo. Neuron 58: , 42–51. |
[52] | Das U , Wang L , Ganguly A , Saikia JM , Wagner SL , Koo EH , Roy S ((2016) ) Visualizing APP and BACE-1 approximation in neurons yields insight into the amyloidogenic pathway. Nat Neurosci 19: , 55–64. |
[53] | Sun J , Roy S ((2018) ) The physical approximation of APP and BACE-1: A key event in Alzheimer’s disease pathogenesis. Dev Neurobiol 78: , 340–347. |
[54] | Cole SL , Vassar R ((2007) ) The Alzheimer’s disease beta-secretase enzyme, BACE1. Mol Neurodegener 2: , 22. |
[55] | Ghosh D , LeVault KR , Barnett AJ , Brewer GJ ((2012) ) A reversible early oxidized redox state that precedes macromolecular ROS damage in aging nontransgenic and 3xTg-AD mouse neurons. J Neurosci 32: , 5821–5832. |
[56] | Eitan E , Suire C , Zhang S , Mattson MP ((2016) ) Impact of lysosome status on extracellular vesicle content and release. Ageing Res Rev 32: , 65–74. |
[57] | Fang EF , Hou Y , Palikaras K , Adriaanse BA , Kerr JS , Yang B , Lautrup S , Hasan-Olive MM , Caponio D , Dan X , Rocktaschel P , Croteau DL , Akbari M , Greig NH , Fladby T , Nilsen H , Cader MZ , Mattson MP , Tavernarakis N , Bohr VA ((2019) ) Mitophagy inhibits amyloid-beta and tau pathology and reverses cognitive deficits in models of Alzheimer’s disease. Nat Neurosci 22: , 401–412. |
[58] | Ghosh D , Brewer GJ ((2014) ) External cys/cySS redox state modification controls the intracellular redox state and neurodegeneration via Akt in aging and Alzheimer’s disease mouse model neurons. J Alzheimers Dis 42: , 313–324. |
[59] | Bejarano E , Murray JW , Wang X , Pampliega O , Yin D , Patel B , Yuste A , Wolkoff AW , Cuervo AM ((2018) ) Defective recruitment of motor proteins to autophagic compartments contributes to autophagic failure in aging. Aging Cell 17: , e12777. |
[60] | Park JS , Kim DH , Yoon SY ((2016) ) Regulation of amyloid precursor protein processing by its KFERQ motif. BMB Rep 49: , 337–342. |
[61] | Kaushik S , Cuervo AM ((2018) ) The coming of age of chaperone-mediated autophagy. Nat Rev Mol Cell Biol 19: , 365–381. |
[62] | Esbjorner EK , Chan F , Rees E , Erdelyi M , Luheshi LM , Bertoncini CW , Kaminski CF , Dobson CM , Kaminski Schierle GS ((2014) ) Direct observations of amyloid beta self-assembly in live cells provide insights into differences in the kinetics of Abeta(1-40) and Abeta(1-42) aggregation. Chem Biol 21: , 732–742. |
[63] | Ghosh D , Levault KR , Brewer GJ ((2014) ) Relative importance of redox buffers GSH and NAD(P)H in age-related neurodegeneration and Alzheimer disease-like mouse neurons. Aging Cell 13: , 631–640. |
[64] | Ghosh D , Levault KR , Brewer GJ ((2014) ) Dual-energy precursor and nuclear erythroid-related factor 2 activator treatment additively improve redox glutathione levels and neuron survival in aging and Alzheimer mouse neurons upstream of reactive oxygen species. Neurobiol Aging 35: , 179–190. |
[65] | Dong Y , Sameni S , Digman MA , Brewer GJ ((2019) ) Reversibility of age-related oxidized free NADH redox states in Alzheimer’s disease neurons by imposed external Cys/CySS redox shifts. Sci Rep 9: , 11274. |
[66] | Dong Y , Digman MA , Brewer GJ ((2019) ) Age- and AD-related redox state of NADH in subcellular compartments by fluorescence lifetime imaging microscopy. Geroscience 41: , 51–67. |
[67] | Liu D , Gharavi R , Pitta M , Gleichmann M , Mattson MP ((2009) ) Nicotinamide prevents NAD+ depletion and protects neurons against excitotoxicity and cerebral ischemia: NAD+ consumption by SIRT1 may endanger energetically compromised neurons. Neuromolecular Med 11: , 28–42. |
[68] | De Boni U , McLachlan DR ((1985) ) Controlled induction of paired helical filaments of the Alzheimer type in cultured human neurons, by glutamate and aspartate. J Neurol Sci 68: , 105–118. |
[69] | Brewer GJ , Ashford JW ((1992) ) Human serum stimulates Alzheimer markers in cultured hippocampal neurons. J Neurosci Res 33: , 355–369. |
[70] | Hopp SC , Bihlmeyer NA , Corradi JP , Vanderburg C , Cacace AM , Das S , Clark TW , Betensky RA , Hyman BT , Hudry E ((2018) ) Neuronal calcineurin transcriptional targets parallel changes observed in Alzheimer disease brain. J Neurochem 147: , 24–39. |
[71] | Foster TC , Sharrow KM , Masse JR , Norris CM , Kumar A ((2001) ) Calcineurin links Ca2+ dysregulation with brain aging. J Neurosci 21: , 4066–4073. |
[72] | Shaw JL , Zhang S , Chang KT ((2015) ) Bidirectional regulation of amyloid precursor protein-induced memory defects by Nebula/DSCR1: A protein upregulated in Alzheimer’s disease and Down syndrome. J Neurosci 35: , 11374–11383. |
[73] | Misonou H , Morishima-Kawashima M , Ihara Y ((2000) ) Oxidative stress induces intracellular accumulation of amyloid beta-protein (Abeta) in human neuroblastoma cells. Biochemistry 39: , 6951–6959. |
[74] | Burdick D , Soreghan B , Kwon M , Kosmoski J , Knauer M , Henschen A , Yates J , Cotman C , Glabe C ((1992) ) Assembly and aggregation properties of synthetic Alzheimer’s A4/beta amyloid peptide analogs. J Biol Chem 267: , 546–554. |
[75] | Takami M , Nagashima Y , Sano Y , Ishihara S , Morishima-Kawashima M , Funamoto S , Ihara Y ((2009) ) gamma-Secretase: Successive tripeptide and tetrapeptide release from the transmembrane domain of beta-carboxyl terminal fragment. J Neurosci 29: , 13042–13052. |
[76] | Olsson TT , Klementieva O , Gouras GK ((2018) ) Prion-like seeding and nucleation of intracellular amyloid-beta. Neurobiol Dis 113: , 1–10. |
[77] | Oddo S , Caccamo A , Smith IF , Green KN , LaFerla FM ((2006) ) A dynamic relationship between intracellular and extracellular pools of Abeta. Am J Pathol 168: , 184–194. |
[78] | Tagami S , Yanagida K , Kodama TS , Takami M , Mizuta N , Oyama H , Nishitomi K , Chiu YW , Okamoto T , Ikeuchi T , Sakaguchi G , Kudo T , Matsuura Y , Fukumori A , Takeda M , Ihara Y , Okochi M ((2017) ) Semagacestat is a pseudo-inhibitor of gamma-secretase. Cell Rep 21: , 259–273. |
[79] | Miller RA ((2009) ) “Dividends” from research on aging–can biogerontologists, at long last, find something useful to do? J Gerontol A Biol Sci Med Sci 64: , 157–160. |

