
Characteristic Biomarker and Cognitive Profile in Incipient Mixed Dementia
Abstract
Background:
Research has shown that mixed dementia is more common than previously believed but little is known of its early stages.
Objective:
To examine if incipient mixed dementia can be differentiated from incipient Alzheimer’s disease (AD) and subcortical ischemic vascular dementia (SVD) using neuropsychological tests, cerebrospinal fluid (CSF) markers, and magnetic resonance imaging markers.
Methods:
We included 493 patients and controls from the Gothenburg MCI study and used the dementia groups for marker selection (CSF total-tau (T-tau), phospho-tau (P-tau), and amyloid-β42 (Aβ42), 11 neuropsychological tests, and 92 regional brain volumes) and to obtain cut-off values which were then applied to the MCI groups.
Results:
Incipient mixed dementia was best differentiated from incipient AD by the Word fluency F-A-S test and the Trail making test A. CSF T-tau, P-tau, and Aβ42 differentiated incipient mixed dementia from incipient SVD.
Conclusion:
Incipient mixed dementia is characterized by an AD-like biomarker profile and an SVD-like cognitive profile. Incipient mixed dementia can be separated from incipient AD and incipient SVD using CSF markers and cognitive testing.
INTRODUCTION
Alzheimer’s disease (AD) is the most common cause of dementia followed by vascular dementia, where subcortical ischemic vascular dementia (SVD) is the most common subtype [1, 2]. Mixed dementia, i.e., AD with cerebrovascular disease, increases in prevalence in older patients and is generally regarded as the third most common cause of dementia but its prevalence may be underreported. [3, 4]. While the biomarker and clinical manifestations of the individual diseases AD and SVD are fairly well characterized, the presence of concomitant pathologies presents a clinical challenge. Although the clinical profile of mixed dementia has been described, its pattern of biomarker deviations and neuropsychological deficits have not been fully established, especially so for the early phases of the disease [5].
Several studies have examined differential diagnostics in dementia patients using biomarkers and cognitive testing [6]. Pathological levels of the cerebrospinal fluid (CSF) markers amyloid-β (Aβ)42, total-tau (T-tau), and phosphorylated tau (P-tau) are typical for AD but deviation from normal levels may also be seen in SVD [7]. Although markers such as neurofilament light protein and CSF/serum albumin ratio have been examined, there are currently no reliable disease-specific CSF markers for SVD [8]. Explicit cognitive profiles have been established in AD and SVD, and are reflected in the criteria used to diagnose the diseases. SVD is further characterized by the presence of white matter changes (WMC), which can easily be detected using magnetic resonance imaging (MRI).
Less is known, however, about differential diagnostics in the mild cognitive impairment (MCI) stage. The many studies of incipient AD have encompassed neuroimaging, cerebrospinal fluid (CSF) markers and cognitive testing and have led to the discovery of several important predictors of the risk of progression to AD [9]. In contrast, only a few studies have included MCI patients with aetiologies other than AD, and in most of these incipient SVD and mixed dementia have shared the same biomarker and cognitive characteristics as their manifest stages [10-12]. Furthermore, these studies have described deviations in biomarkers and cognition in MCI subpopulations, there is presently no study that has evaluated the relative benefit of commonly used disease markers for the differentiation of incipient mixed dementia from incipient AD or SVD.
Moreover, in terms of mixed dementia, there is an increasing interest and an ongoing debate whether the AD-like and cerebrovascular pathological processes have an independent or interactive effect on the decline of cognitive functioning [13]. Some researchers have found that AD and cerebrovascular disease contribute independently to cognitive impairment [14], but others have reported an interactive effect [15].
Since the biomarker and cognitive profile of incipient mixed dementia has not been determined, we intend to investigate how incipient mixed dementia could be best distinguished from AD and SVD, using sequential CSF samples, structural imaging markers and a neuropsychological test battery in consecutive memory clinic patients and controls. Additionally, in incipient mixed dementia, we examined if marker levels suggested an independent or interactive effect of AD and cerebrovascular pathology on cognitive functioning.
MATERIAL AND METHODS
The Gothenburg MCI study
The Gothenburg MCI study is a clinically based longitudinal study that aims at identifying neurodegenerative and vascular disorders prior to the development of dementia [16]. The Gothenburg MCI study was approved by the local ethics committee in Gothenburg (approval number: L091-99, 1999; T479-11, 2011). Participants (or their close relatives) gave their consensus for participating in the study as well as for future results being published, which was directed in accordance with the provisions of the Helsinki Declaration. Inclusion required verifications of a progressive cognitive impairment for more than 6 months, age≥50 and≤79 years, and Mini-Mental State Examination (MMSE) score > 18. Exclusion criteria were acute/unstable somatic disease, severe psychiatric disorder, or substance abuse. For an overview of the findings based on the Gothenburg MCI study, please see [17].
Healthy controls were primarily recruited from senior citizens’ organisations. Inclusion and exclusion criteria were the same as for the patients with the exception that controls were not included if they had subjective or objective signs of cognitive disorders.
Classification
The patients’ degree of cognitive decline was staged according to the Global Deterioration Scale (GDS) [18]. The GDS classifications were made by means of the following instruments: Variables 13-20 of the Stepwise Comparative Status Analysis (STEP) [19] (i.e., memory disturbance, disorientation, reduced abstract thinking, visuospatial disturbance, poverty of language, sensory aphasia, visual agnosia and apraxia); IFlex, which is a short form of the Executive Interview (EXIT) [20] (i.e., number-letter task, word fluency, anomalous sentence repetition, interference task, Luria hand sequences and counting task); MMSE [21]; and Clinical Dementia Rating (CDR) [22]. The CDR assessment was based on information from both the patient and an informant. The guidelines for the classification were as follows: For GDS 3 (MCI) participants should have MMSE≥26, CDR > 0.5, I-FLEX≤3 and one or less positive outcomes on variables 13-20 of STEP, and GDS 4 (mild dementia) participants should have MMSE≤25, CDR > 1.0, STEP > 1, I-FLEX>3. When the guidelines were not applicable, a consensus decision among the physicians at the clinic was made to determine the appropriate GDS score. Participants classified as GDS 4 were further classified according to the following etiological dementia criteria; AD according to the NINCDS-ADRDA criteria [23] and SVD according to the Erkinjuntti criteria [24]. For mixed dementia, AD criteria had to be fulfilled as well as moderate/severe WMC (Fazekas score≥2) on MRI or mild WMC in combination with a marked frontosubcortical-dysexecutive syndrome. The clinician who set the dementia diagnoses had access to MRI images but was blinded to volumetric data, neuropsychological test results and CSF biomarker data. The guidelines and diagnostic procedures have been described in detail previously [16]. Vascular burden was classified as two or more vascular risk factors (arterial hypertension, symptomatic arterial hypotension, congestive heart failure, angina pectoris, cardiac dysrhythmia, myocardial infarction, transient ischemic attack, stroke (also silent), hyperlipidemia, diabetes mellitus, and claudicatio intermittens) and the presence of not insignificant WMC.
The study population
The study population (N = 493) consisted of 152 patients with dementia at baseline (83 with AD, 46 with mixed dementia, and 23 with SVD), 85 patients with MCI that converted to dementia at subsequent follow-ups (of which 43 converted to AD (MCI-AD), 26 converted to mixed dementia (MCI-mix), and 16 converted to SVD (MCI-SVD)), 130 MCI patients that remained cognitively stable until last follow-up (MCI-MCI), and 126 healthy controls. Study participants were included between 1999 and 2014. Patients with other forms of dementia than AD, SVD or mixed dementia at baseline or follow-up were not included in the study. The presented follow-up times are time until conversion for MCI patients subsequently converting to dementia, and time until last follow-up examination for the other groups.
Cerebrospinal fluid and genetic analysis
CSF samples were collected by lumbar puncture, which were performed in the morning to exclude influence on the results from possible diurnal fluctuations in biomarker levels. Twenty milliliter (mL) of CSF were collected in a polypropylene tube and immediately transported to the local laboratory for centrifugation at 2 000×g at room temperature for 10 minutes. The supernatant was collected, gently mixed to avoid possible gradient effects, and aliquoted in 0.5 mL aliquots in screw-cap polypropylene tubes that were stored at –80°C, without being thawed and refrozen, pending biochemical analyses. CSF levels of total (T)-tau, phosphorylated (P)-tau181, and amyloid-β amino acids 1 to 42 (Aβ42) were determined using sandwich enzyme-linked immunosorbent assays (INNOTEST® hTau Ag, INNOTEST® PHOSPHO-TAU (181P) , and INNOTEST® β-AMYLOID (1 –42) , respectively) from Innogenetics, Gent [25]. The CSF samples were processed at the Clinical Neurochemical Laboratory at Gothenburg University as part of clinical routine on multiple occasions during the course of the study. The analytical variability was low [26].To obtain apolipoprotein E (APOE) ɛ4 status, blood was drawn from all study participants and subsequently analysed using solid-phase minisequencing.
Neuroimaging
MRI data from a 1.5 T scanner (Siemens Symphony, Erlangen, Germany) was available for a subset of participants: Dementia group: 73 patients (i.e., AD: 41, mixed dementia: 25, SVD: 7), MCI converting to dementia: 31 patients (i.e., MCI-AD: 17, MCI-mix: 11, MCI-SVD: 3), stable MCI: 84 patients and controls: 55 participants.
Volumetry was performed on T1 3D IR/GR images (repetition time 1610 ms, echo time 2.38 ms, flip angle 15°, coronal slices, field of view 250*203 mm, slice thickness 1 mm, pixel spacing 0.49*0.49 mm, matrix size 512*416).
Brain volumes were measured using the automated segmentation software FreeSurfer version 5.3.0. The FreeSurfer analyses were performed on a computing cluster running 64 bit CentOS 6. These analyses were performed on nodes based on Supermicro X9DRT Intel E5-2670 (Sandy Bridge) running at 2.6 GHz. A few analyses were also performed using a MacPro 3.1 with 64bit 2x2.8 GHz quad-core Intel Xeon processors and Mac OSX 10.8.5.
Once the analysis process had finished, subcortical volumes were extracted using the aparcstats2table script. Quality control of the FreeSurfer output was performed using the FreeSurfer graphical user interface Freeview (https://surfer.nmr.mgh.harvard.edu/fswiki/FreeviewGuide/FreeviewIntroduction). Minor errors were accepted but larger errors resulted in the exclusion of the affected region. The quality controller was blinded to group belonging and other patient data. Only a few patients had more than one region excluded from the analyses. The following data were excluded: temporal lobes: AD: 8 left,12 right, mixed dementia: 3 left,7 right, SVD: 1 left,1 right, MCI-AD: 1 left,3 right, MCI-mix: 2 left,3 right, MCI-SVD: 1 right, MCI-MCI: 10 left,19 right, controls 5 left,14 right; frontal lobes: AD: 2 left,1 right, mixed dementia: 1 left, MCI-AD: 1 left, MCI-mix: 1 left,1 right, MCI-MCI: 5 right, controls: 1 left, 3 right.
FreeSurfer measurements for white matter “hypointensities” (i.e., WMC) are included in Table 1 but were excluded from further analysis to avoid circularity as visual assessment of WMC is included in the diagnostic procedure. All FreeSurfer volumes were normalized using FreeSurfer’s estimate of intracranial volume (eTIV). The residual normalization method has been described in a previous publication [27]. Briefly, a regression analysis was performed in the control group to obtain a regression coefficient (k) reflecting the association between eTIV and the region of interest, which was then applied to the study sample.
Table 1
Demographic data
| Group | N | Age | MMSE score | Male sex, % | APOE ɛ4, % | Education, y | F-U time, months | WMC volume, cm3 | Vascular burden, % |
| AD | 83 | 67.2±7.1 | 23.5±3.5† | 29 | 67† | 10.8±3.5† | 15.5±17.3 | 4.3±2.9 | 13 |
| Mixed | 46 | 71.2±6.0† | 23.8±3.0† | 30† | 67† | 10.7±3.4 | 11.5±16.8 | 9.0±6.1 | 46 |
| SVD | 23 | 70.3±7.1† | 25.0±2.3† | 74† | 39 | 11.4±3.3 | 14.8±17.2 | 17.0±9.4† | 78† |
| Controls | 126 | 65.4±7.5 | 29.4±1.2 | 38 | 32 | 12.2±2.9 | 10.2±19.8 | 4.1±6.1 | 19 |
| MCI-AD | 43 | 66.1±6.4 | 27.8±1.3 | 44 | 72* | 11.8±3.5 | 27.1±12.3 | 4.3±6.9 | 22 |
| MCI-Mix | 26 | 70.0±6.3* | 26.9±2.2* | 31 | 69* | 11.2±4.1 | 25.7±9.7 | 8.0±5.3 | 38 |
| MCI-SVD | 16 | 68.8±7.5 | 28.3±1.7 | 56 | 50 | 11.9±3.8 | 38.7±29.9 | 23.8±7.8* | 94* |
| MCI-MCI | 130 | 65.4±8.1 | 28.3±1.5 | 44 | 38 | 11.3±3.4 | 37.8±25.3 | 5.4±6.6 | 38 |
Dementia groups (AD, Mixed, and SVD) were compared with controls. Converting MCI subgroups (MCI-AD, MCI-Mix, and MCI-SVD) were compared with MCI-MCI. APOE ɛ4 %, Percentage of study participant with at least one APOE ɛ4 allele; F-U time, follow up time (time until conversion for converting MCI groups, total follow up time for the other groups); WMC volume, white matter changes volume; Vascular burden, Percentage of study participants with at least two vascular risk factors and not insignificant WMCs. †p-value<0.05 versus Controls after Bonferroni correction. *p-value<0.05 versus MCI-MCI after Bonferroni correction.
Neuropsychological assessment
The Gothenburg MCI study includes a comprehensive neuropsychological test battery. The tests and testing procedure have previously been described in detail [28]. The following tests were analysed in the present study: Trail Making Test (TMT) A and B, Rey Auditory Verbal Learning Test (RAVLT, we applied the following measures: total learning (RAVLT TL), trials 1-5 and delayed recall, (RAVLT DR), Rey Complex Figure (RCFT) recall, Visual Object and Space Perception (VOSP) Silhouettes subtest, Rey Complex Figure copy and recall, Token test, Word fluency F-A-S, Parallel Serial Mental Operations (PASMO), and Stroop Test Victoria version. Not all study participants completed the neuropsychological test battery, i.e., 35 from the dementia groups, 44 from the control group, 20 from the MCI-MCI group, 4 from the MCI-AD group, 2 from the MCI-Mix group.
Statistical analyses
Demographic differences were analyzed using the unpaired t-test (age, MMSE, and years of education) and χ2 (APOE ɛ4 status and sex). Patients with dementia at baseline were compared with healthy controls. Patients with MCI subsequently converting to dementia were compared to stable MCI patients. Group differences in biomarkers were evaluated using analysis of covariance (ANCOVA) with age as a covariate (age and years of education for neuropsychological tests). Significance levels presented in Tables 1 and 2 were corrected for multiple comparisons within each group using the Bonferroni method.
Table 2
Baseline data in converting MCI groups (MCI-AD, MCI-Mix, and MCI-SVD) compared to MCI-MCI for variables obtained from variable selection
| MCI-AD | MCI-Mix | MCI-SVD | MCI-MCI | |
| N | 43 | 26 | 16 | 130 |
| Aβ42 | 447±132* | 408±110* | 529±172 | 652±239 |
| T-tau | 744±451* | 660±304* | 365±156 | 356±214 |
| P-tau | 91±41* | 76±24* | 51±19 | 56±23 |
| 3rd ventricle vol. | 1.6±0.7 | 1.7±0.8 | ||
| Left ERC | 1.7±0.1 | 1.9±0.1 | ||
| R. caudate vol. | 3.0±1.0 | 3.5±0.8 | ||
| R. paracentral vol. | 3.2±0.6 | 3.4±0.7 | ||
| RAVLT TL | 30±9* | 39±10 | ||
| Token test | 17±4* | 19±2 | ||
| F-A-S | 36±10 | 38±13 | ||
| RCF copy | 29±8* | 32±4 | ||
| RAVLT DR | 2.7±3* | 7.1±4 | ||
| TMT A | 59±17* | 44±15 |
CSF markers (ng/L), volumetric data (cm3) and neuropsychological test scores are presented as mean value±SD. Data is only presented for the variables. Left ERC, left entorhinal cortex volume; R. caudate vol., right caudate volume; R. paracentral vol., right paracentral volume. *p-value<0.05 versus MCI-MCI after Bonferroni correction.
Variable selection and cut-off scores
Variable selection and generation of cut-off scores was performed using the dementia groups (AD, mixed dementia, and SVD) with the control group to derive the best discriminating variables and their cut-off values, which were then applied to the converting MCI groups and the stable MCI group. Volumetric variables and test scores were analyzed separately, and only three variables from each modality were used to complement the three CSF markers available. For variable selection, we performed a forward stepwise logistical regression (likelihood ratio) to select the best discriminating variables in up to three steps. We used all volumes calculated by FreeSurfer except for “WM-hypointensities”, totaling 92 variables.
For AD, left entorhinal cortex volume, 3rd ventricle and left hippocampus had the highest explained variance with a Nagelkerke R2 of 0.69; RAVLT TL, F-A-S total score, and RCFT copy score had an R2 of 0.84. For mixed dementia, left hippocampal volume, right caudate volume and right paracentral volume had a R2 of 0.77; Token test and RAVLT DR had a R2 of 0.711. For SVD, right lateral ventricle and right posteriocingulate volume had an R2 of 0.78; TMT A had an R2 of 0.51.
Receiver operating characteristic (ROC) analysis was then performed for each variable to calculate cut-off values based on the maximum of the sum of sensitivity and specificity. See Supplementary Table 1 for mean values and their corresponding area under the curve (AUC) and derived cut-off values. These cut-offs were used to calculate AUC, sensitivity/specificity and positive likelihood ratio where cut-offs from AD/control groups were applied to MCI-AD/MCI-MCI groups, mixed dementia/control groups to MCI-Mix/MCI-MCI groups etc. To provide complementary predictive information, all variables were z-transformed and then entered into a logistical regression that also included age as a covariate. The results from the ROC analyses and logistical regressions are displayed in Table 3.
Table 3
Predictive values
| MCI-AD versus MCI-MCI | MCI-mix versus MCI-MCI | MCI-SVD versus MCI-MCI | |
| Aβ42 | |||
| AUC (Sens, spec) % | 69 (67, 70) | 72 (64, 70) | 62 (94, 29) |
| Pos LR (95% CI) | 2.2 (1.6-3.2) | 2.8 (2.0-3.9) | 1.3 (1.1-1.6) |
| Odds ratio (95% CI) | 4.2 (2.2-7.7) | 5.7 (2.3-14.1) | 1.8 (0.9-3.5) |
| T-tau | |||
| AUC (Sens, spec) % | 78 (81, 77) | 75 (60, 78) | 63 (92, 23) |
| Pos LR (95% CI) | 3.6 (2.4-5.2) | 2.7 (1.7-4.4) | 1.4 (1.1-1.7) |
| Odds ratio (95% CI) | 4.0 (2.1-7.6) | 3.8 (1.9-7.4) | 1.1 (0.4-2.7) |
| P-tau | |||
| AUC (Sens, spec) % | 79 (67, 84) | 81 (45, 89) | 55 (85, 40) |
| Pos LR (95% CI) | 4.2 (2.5-6.9) | 4.1 (2.0-8.5) | 1.4 (1.1-1.9) |
| Odds ratio (95% CI) | 6.1 (3.1-11.8) | 2.6 (1.3-5.2) | 2.1 (0.6-6.8) |
| Left HC | |||
| AUC (Sens, spec) % | 67 (47, 71) | 69 (91, 64) | |
| Pos LR (95% CI) | 1.7 (0.9-3.0) | 2.6 (1.8-3.6) | |
| Odds ratio (95% CI) | 1.5 (0.9-2.4) | 3.0 (1.5-6.0) | |
| 3rd ventricle | |||
| AUC (Sens, spec) % | 56 (53, 57) | ||
| Pos LR (95% CI) | 1.2 (0.7-2.1) | ||
| Odds ratio (95% CI) | 1.2 (0.7-2.0) | ||
| Left ERC | |||
| AUC (Sens, spec) % | 68 (36, 75) | ||
| Pos LR (95% CI) | 1.45 (0.6-3.3) | ||
| Odds ratio (95% CI) | 1.1 (0.6-2.2) | ||
| Right caudate volume | |||
| AUC (Sens, spec) % | 80 (27, 87) | ||
| Pos LR (95% CI) | 2.1 (0.7-6.3) | ||
| Odds ratio (95% CI) | 1.8 (0.98-3.4) | ||
| Right paracentral volume | |||
| AUC (Sens, spec) % | 60 (80, 25) | ||
| Pos LR (95% CI) | 1.1 (0.8-1.5) | ||
| Odds ratio (95% CI) | 1.2 (0.7-1.8) | ||
| RAVLT TL | |||
| AUC (Sens, spec) % | 75 (44, 87) | ||
| Pos LR (95% CI) | 3.3 (1.8-6.0) | ||
| Odds ratio (95% CI) | 4.1 (2.1-8.2) | ||
| RAVLT DR | |||
| AUC (Sens, spec) % | 74 (72, 75) | ||
| Pos LR (95% CI) | 2.8 (1.9-4.2) | ||
| Odds ratio (95% CI) | 5.4 (2.3-12.4) | ||
| F-A-S | |||
| AUC (Sens, spec) % | 56 (38, 63) | ||
| Pos LR (95% CI) | 1.0 (0.7-1.6) | ||
| Odds ratio (95% CI) | 1.4 (0.8-2.3) | ||
| RCF copy | |||
| AUC (Sens, spec) % | 74 (38, 85) | ||
| Pos LR (95% CI) | 2.6 (1.4-4.9) | ||
| Odds ratio (95% CI) | 1.8 (1.2-2.9) | ||
| Token test | |||
| AUC (Sens, spec) % | 73 (65, 75) | ||
| Pos LR (95% CI) | 2.6 (1.6-4.0) | ||
| Odds ratio (95% CI) | 3.0 (1.5-6.0) | ||
| TMT A | |||
| AUC (Sens, spec) % | 70 (78, 69) | ||
| Pos LR (95% CI) | 2.5 (1.5-4.2) | ||
| Odds ratio (95% CI) | 6.9 (2.0-24.7) |
AUC, area under the curve; Sens, sensitivity; Spec, specificity; Pos LR, positive likelihood ratio; CI, confidence interval; Left HC, left hippocampal volume; Left ERC, left entorhinal cortex volume.
Additionally, we performed a direct comparison between the converting MCI groups using ANCOVA with age as a covariate (age and education for neuropsychological tests) to investigate if differences seen between the converting and stable MCI groups could also be detected between the converting MCI groups. Finally, we produced Kaplan-Meier curves to illustrate differences in survival between MCI patients with pathological or non-pathological values of selected markers based on the cut-off values derived from the dementia groups and control group (for Aβ42/T-tau ratio we used AD/controls, for WMC volume we used SVD/controls comparisons) The cut-off values from were then applied to the MCI-AD/MCI-MCI group etc. All analyses were performed using IBM SPSS software (version 19.0).
RESULTS
Demographic data of the study is presented in Table 1, where patients with dementia diagnoses (AD, mixed dementia, and SVD) were compared to controls and MCI patients converting to AD, mixed dementia or SVD (MCI-AD, MCI-Mix, and MCI-SVD) were compared with patients of stable MCI (MCI-MCI). Patients with AD and mixed dementia at baseline or follow-up were more likely than the control and stable MCI groups to carry the APOE ɛ4 allele. Although small in terms of mean difference, MCI-Mix had lower MMSE scores compared to MCI-MCI. Women were generally overrepresented in all groups except for the SVD group. Sex and years of education had no impact on conversion to dementia but had an effect on some of the dementias compared to controls.
Table 2 displays the baseline data for CSF markers as well as FreeSurfer volumes and neuropsychological tests derived from variable selection. There was a clear difference between the converting MCI groups and the stable MCI group in many of the selected markers. Both MCI-AD and MCI-Mix were different from MCI-MCI for all the tested CSF biomarkers, while the MCI-SVD group did not differ from the MCI-MCI group. For the imaging data, the left hippocampus of the MCI-Mix group differed from the MCI-MCI group; otherwise there were no differences between groups. Most cognitive tests differed between converters and the stable MCI group.
Table 3 shows predictive values for the selected markers using the cut-off values derived from the dementia-controls comparisons. Again, CSF markers and neuropsychological tests performed better in the MCI-AD group and the MCI-Mix groups. For the MCI-AD and MCI-Mix, P-tau and Aβ42 were the best predictors, while for the MCI-SVD group TMT A provided the best predictive value.
A direct comparison between the MCI subgroups that developed dementia is presented in Table 4. The CSF markers separated between MCI-AD/MCI-Mix and MCI-SVD. MCI-AD and MCI-Mix were best differentiated using hippocampal volume, and the TMT A and F-A-S tests. The imaging markers were the least discriminating modality; the only between-group difference was the smaller left hippocampal volume in the MCI-Mix group compared to the other groups.
Table 4
Direct comparison between the converting groups
| MCI-AD | MCI-Mix | MCI-SVD | |
| N | 43 | 26 | 16 |
| Aβ42 | 447±132 | 408±110† | 529±172* |
| T-tau | 744±451† | 660±304† | 365±156* |
| P-tau | 91±41† | 76±24† | 51±19* |
| Left hippocampus | 3.1±1.0* | 2.3±0.8† | 3.3±0.3* |
| 3rd ventricle | 1.6±0.7 | 1.8±0.9 | 2.3±0.6 |
| L. ERC | 1.7±0.6 | 1.7±0.7 | 1.8±0.3 |
| R. caudate volume | 3.1±1.0 | 3.0±1.0 | 3.4±0.6 |
| R. paracentral volume | 3.5±0.9 | 3.2±0.6 | 3.9±0.2 |
| RAVLT TL | 30±9 | 28±9 | 29±9 |
| Token test | 19±2 | 17±4 | 17±4 |
| F-A-S | 36±10*† | 30±12 | 28±9 |
| RCF copy | 29±8 | 30±4 | 28±4 |
| RAVLT DR | 2.7±3† | 2.7±3† | 4.9±3* |
| TMT A | 49±15*† | 57±27 | 59±17 |
CSF markers (ng/L), volumetric data (cm3) and neuropsychological test scores are presented as mean values±SD. *p-value<0.05 versus MCI-mix, †p-value<0.05 versus MCI-SVD.
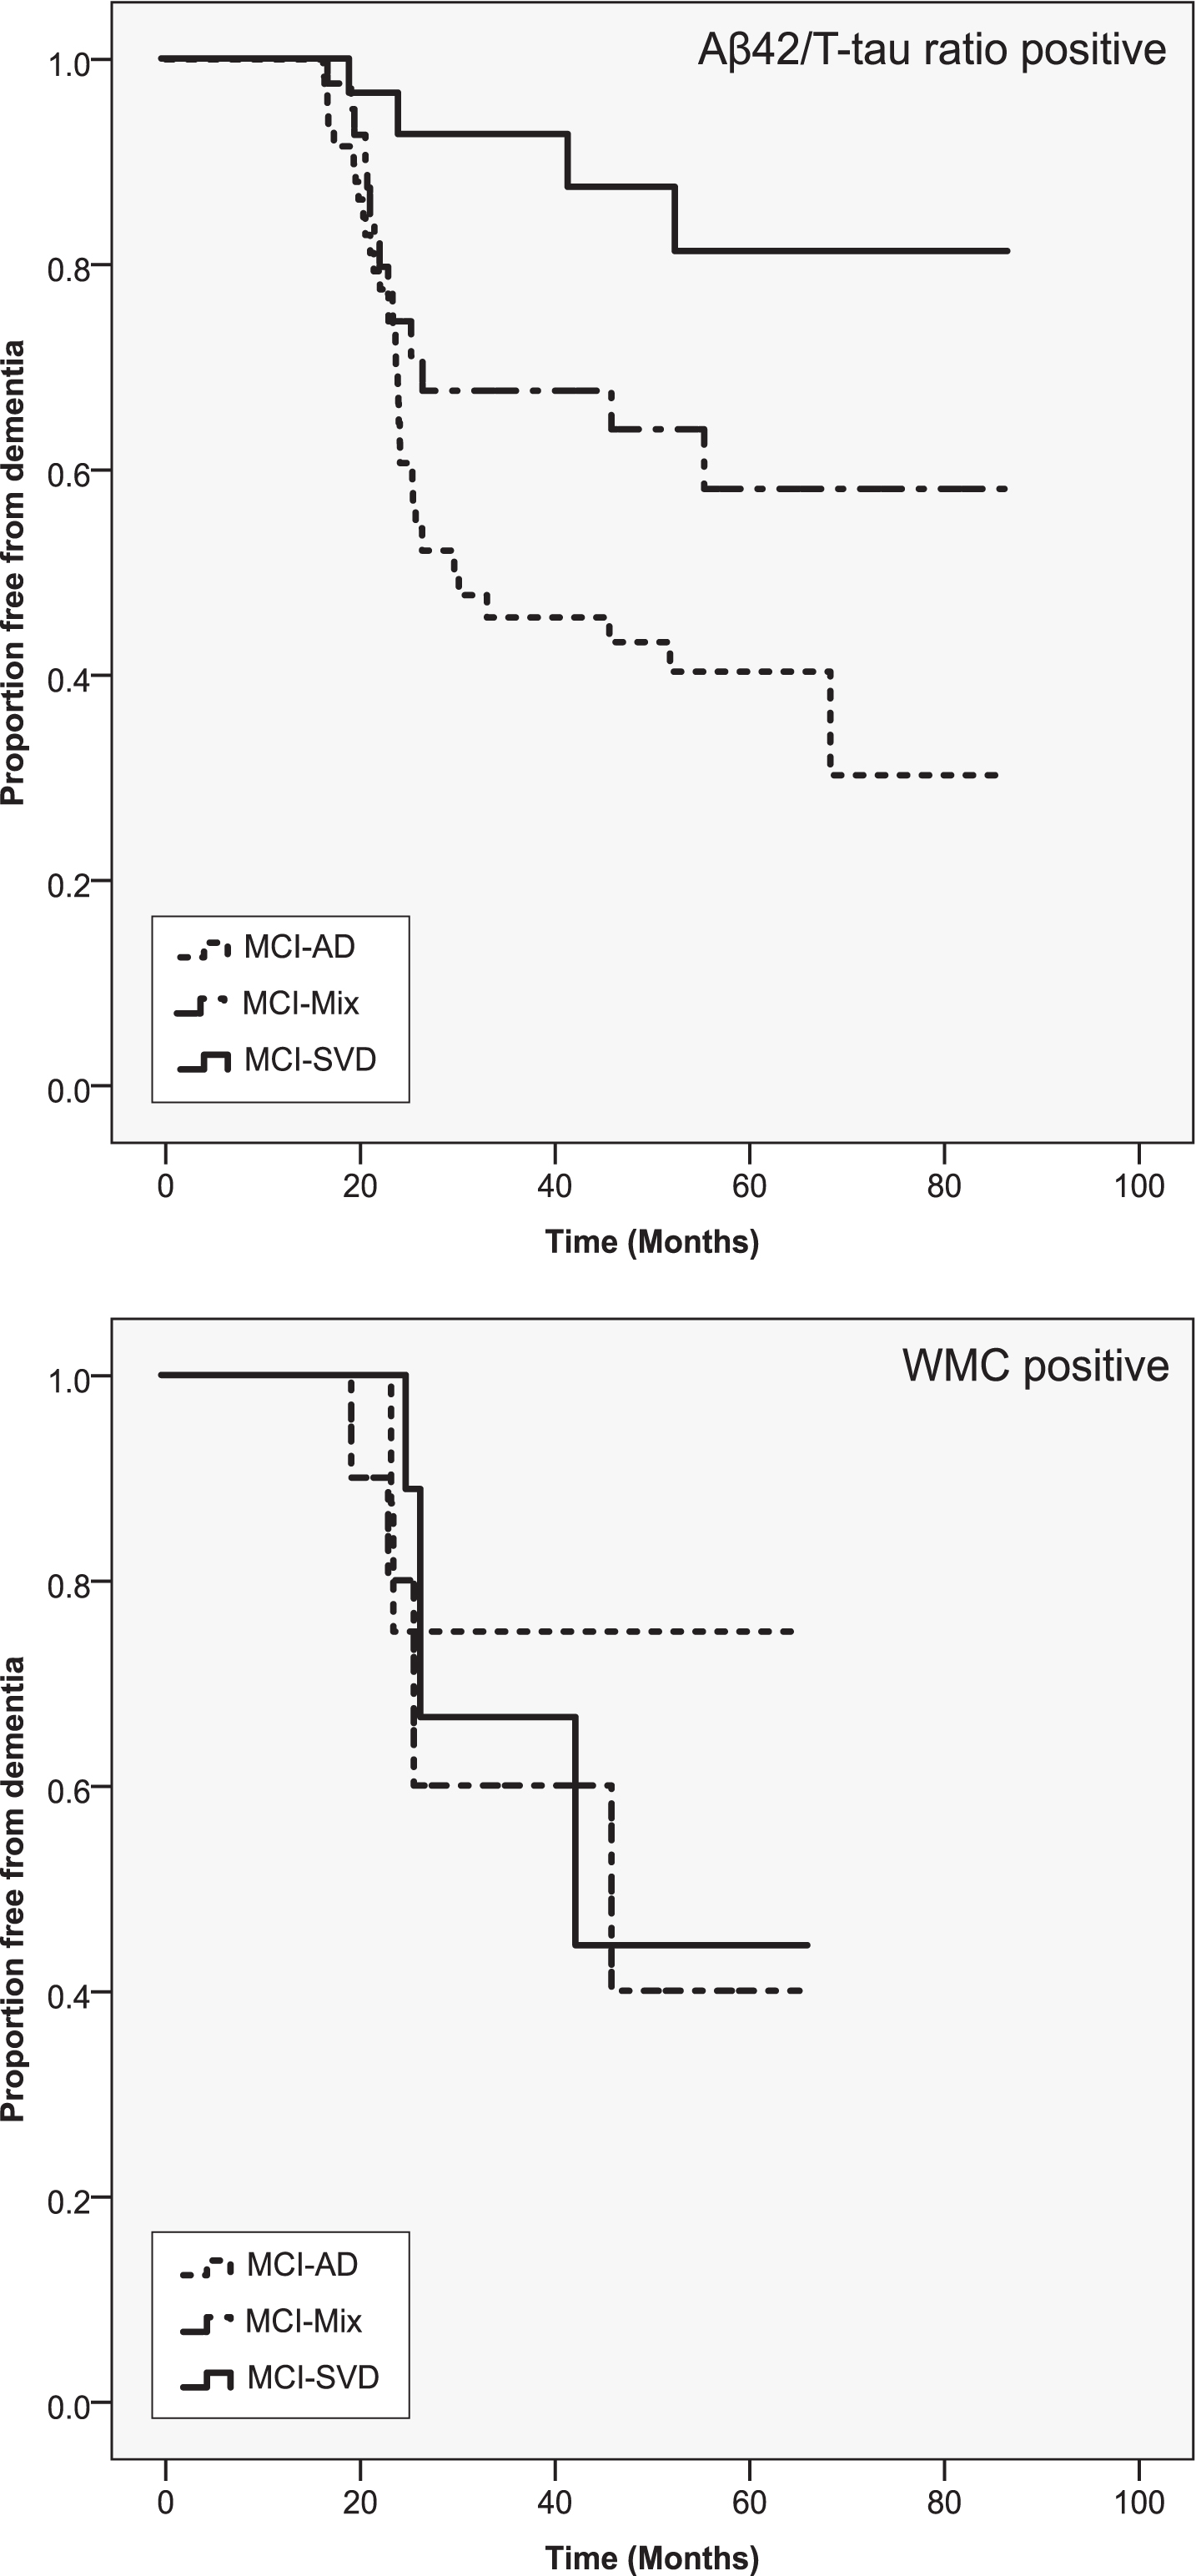
Figure 1 displays survival curves for the converting MCI groups individually compared to the MCI-MCI group. It shows that using a cut-off derived from AD/controls, MCI patients converting to mixed dementia are more likely to have pathological levels of Aβ42/T-tau ratio compared than converters to SVD, but less likely than converters to AD. It also shows that pathological levels of WMC is as common in MCI-Mix as in MCI-SVD.
Fig.1
Survival curves stratified by levels of Aβ42/T-tau ratio and WMC. Only patients with pathological values are displayed. Marker values were designated pathological or non-pathological based on the cut-off scores derived from dementia-control group comparisons. X axis shows proportion of non-demented patients at a given time (months) as shown on the y axis.
DISCUSSION
Our main objective was to investigate if incipient mixed dementia could be distinguished from the incipient forms of AD and SVD using neuropsychological tests, brain volumetric and CSF markers. We found that incipient mixed dementia was characterized by an AD-like biomarker pattern combined with an SVD-like cognitive profile. Similar findings have been reported in studies of patients with manifest dementia, but this is the first comprehensive study to report such findings on a group of patients with incipient mixed dementia. Although Aβ42 levels were lowest in the MCI-Mix group, intermediate levels of P-tau, T-tau and WMC suggest an interactive effect on cognitive functioning from AD pathology and SVD pathology in the MCI-Mix group.
The CSF markers did not differentiate between MCI-AD and MCI-Mix, but CSF P-tau and T-tau, unlike Aβ42 in the MCI-AD group, effectively discriminated the former groups from both MCI-MCI and MCI-SVD. The low levels of Aβ42 in the MCI-Mix group was unexpected but a recently published cross-sectional study has also found lower than expected levels of Aβ42 in a group of memory clinic patients with both AD and cerebrovascular pathology [29]. Additionally, albeit CSF Aβ42 is considered a marker for Aβ deposition in the brain, P-tau seem to be a more AD specific marker which is in line with our findings [30]. WMC, the hallmark of SVD, have been linked to deviations in levels of several CSF Aβ isoforms [31, 32], but as WMC are present in mixed dementia as well as in normal aging, these findings are difficult to interpret. CSF markers that more accurately reflect the pathological processes in SVD have been tested [33, 34], but are currently not widely available and need to be validated further.
The imaging markers analyzed provided the least value in terms of positive likelihood ratio and odds ratio for separating converting MCI from stable MCI. These findings should be interpreted with caution, however, as MRI data was missing for some study participant which could have affected the results. For MCI-AD, the resulting markers from the variable selection (hippocampus, entorhinal cortex, and 3rd ventricle) directly or indirectly reflect central atrophy in areas affected by early accumulation of AD pathology. The markers in the MCI-Mix group were, however, less predictable, assigning hippocampal volume, caudate nucleus and right paracentral volume as the best markers. Surprisingly, the left hippocampus did in this study differentiate MCI-Mix from MCI-AD and MCI-SVD. While hippocampal atrophy is an established marker of AD, the small volumes in the MCI-Mix group could reflect an interactive effect from both AD pathology and WMC on hippocampal volume [35, 36]. The proposed mechanism is deafferentation of neuronal tracts by WMC, resulting in atrophy and reduced function of the affected region [37, 38].
The three derived neuropsychological tests from the AD group represent functions previously linked to AD, i.e., memory, verbal fluency, and visuo-spatial function. Although episodic memory impairment (RAVLT TL) best discriminated MCI-AD from MCI-MCI, MCI-AD outperformed MCI-Mix/MCI-SVD on phonemic verbal fluency (F-A-S). Previous studies have found that while both semantic and phonemic fluency are deteriorated in SVD, phonemic verbal fluency is relatively preserved in AD compared with SVD [39]. Impaired phonemic fluency in MCI has been described previously but has not been deemed a strong predictor for subsequent conversion to AD [40]. Our finding of impaired phonemic fluency in MCI patients with prodromal AD compared to stable MCI might be less important than the finding that the test seems to effectively discriminate AD from mixed dementia/SVD. Whereas the RAVLT TL suggested risk for general cognitive deterioration, the delayed recall subtest discriminated well between AD/mixed dementia and SVD. The most prominent cognitive feature of prodromal AD in our sample was impaired delayed recall, while prodromal SVD was predominantly characterized by reduced mental speed and verbal fluency. Prodromal mixed dementia had features resembling both AD and SVD, suggesting that both these pathological processes influenced the mixed dementia phenotype. Furthermore, our findings are similar to those of previous studies in manifest AD and mixed dementia [41]. In summary, impaired delayed recall is seen in both incipient mixed dementia and AD, but mixed dementia also exhibits impaired verbal fluency and mental speed which is not seen in AD.
There are discrepancies regarding the reported prevalence and incidence of mixed dementia, and especially so regarding its early phases. The current view is that the proportion of patients with mixed dementia increases with age, and a community-based autopsy study observed that AD pathology and cerebrovascular disease were common findings in very old patients [4]. When examining the proportion of mixed dementia as a part of AD, we found that 38% of MCI patients progressing to dementia with AD characteristics converted to mixed dementia, which is slightly higher than that in a recent study by Claus et al., in which mixed dementia patient made up a third of all cases with AD characteristics [42]. The fact that the prevalence in the present study was higher despite the younger age of our patients might mirror differences in classification of mixed dementia. Both our study as well as the study by Claus et al. classified AD patients with moderate to severe WMC as mixed dementia with the difference that we also classified AD patients with mild WMC and a marked frontosubcortical-dysexecutive syndrome as mixed dementia. The rationale for our approach is based on the objective of the Gothenburg MCI study as a naturalistic study and variation concerning presentation of disease is consequently given a high rank in the classification process. Additionally, WMC may not be the best indicator of progressive disease. Although severe WMC have been linked to cognitive impairment [43], there are still uncertainties regarding the link between mild-moderate WMC and cognitive impairment and whether there are qualitative differences between WMC in regard to cognitive outcome [44, 45]. Further research will hopefully not only elucidate the connection between WMC and cognition, but also provide a foundation for a more accurate classification of mixed dementia.
Limitations
Limitations of the present study include uneven distribution of incipient dementia disorders, and incomplete MRI and neuropsychological test data of the patient cohort. The results, and especially the non-significant results in the study should therefore be interpreted with caution due to the low number of patients in the MCI-mix and MCI-SVD group. Additionally, the study was performed on patients actively seeking care at a memory clinic and thus may not necessarily reflect the general population. Furthermore, as a result of the low number of patients in the converting MCI groups, we chose to perform the variable selection on patients with dementia/controls instead of a different set of MCI patients which may have affected the results as, compared with neuropsychological and imaging markers [46], CSF markers reach a threshold level relatively early in the disease process [47]. Consequently, our approach may have provided an advantage to CSF markers compared to cognitive tests and volumetric markers.
Conclusions
Incipient mixed dementia can be separated from incipient AD and SVD using CSF markers and cognitive testing. Intermediate levels of pathological markers suggest an interactive effect on cognitive function in incipient mixed dementia.
ACKNOWLEDGMENTS
We would like to thank statistician Kjell Pettersson at Health Metrics for statistical assistance and consultation, Marie Johansson and Eva Bringman for administrating the study, Erik Olsson and Niklas Klasson for help with the MRI analyses and the staff at the memory clinic in Mölndal and the staff at the Neurochemical laboratory for data collection and analyses.
This work was financed by grants from the Swedish state under the agreement between the Swedish government and the county councils, the ALF agreement [Grant number ALFGBG-784831]. Additional support was received from the Sahlgrenska University Hospital, the Swedish Research Council, Swedish Brain Power, the Swedish Dementia Foundation, the Swedish Alzheimer Foundation, Stiftelsen Psykiatriska forskningsfonden, and Konung Gustaf V:s och Drottning Victorias Frimurarestiftelse. The funding sources were not involved in the drafting of this manuscript.
Authors’ disclosures available online (https://www.j-alz.com/manuscript-disclosures/19-0651r2).
SUPPLEMENTARY MATERIAL
[1] The supplementary material is available in the electronic version of this article: https://dx.doi.org/10.3233/JAD-190651.
REFERENCES
[1] | Qiu C , De Ronchi D , Fratiglioni L ((2007) ) The epidemiology of the dementias: An update. Curr Opin Psychiatry 20: , 380–385. |
[2] | Wallin A , Roman GC , Esiri M , Kettunen P , Svensson J , Paraskevas GP , Kapaki E ((2018) ) Update on vascular cognitive impairment associated with subcortical small-vessel disease. J Alzheimers Dis 62: , 1417–1441. |
[3] | Zekry D , Hauw JJ , Gold G ((2002) ) Mixed dementia: Epidemiology, diagnosis, and treatment. J Am Geriatr Soc 50: , 1431–1438. |
[4] | Ince G ((2001) ) Pathological correlates of late-onset dementia in a multicentre, community-based population in England and Wales. Neuropathology Group of the Medical Research Council Cognitive Function and Ageing Study (MRC CFAS). Lancet 357: , 169–175. |
[5] | Chui HC , Ramirez-Gomez L ((2015) ) Clinical and imaging features of mixed Alzheimer and vascular pathologies. Alzheimers Res Ther 7: , 21. |
[6] | Bruun M , Rhodius-Meester HFM , Koikkalainen J , Baroni M , Gjerum L , Lemstra AW , Barkhof F , Remes AM , Urhemaa T , Tolonen A , Rueckert D , van Gils M , Frederiksen KS , Waldemar G , Scheltens P , Mecocci P , Soininen H , Lotjonen J , Hasselbalch SG , van der Flier WM ((2018) ) Evaluating combinations of diagnostic tests to discriminate different dementia types. Alzheimers Dement (Amst) 10: , 509–518. |
[7] | Schoonenboom NS , Reesink FE , Verwey NA , Kester MI , Teunissen CE , van de Ven PM , Pijnenburg YA , Blankenstein MA , Rozemuller AJ , Scheltens P , van der Flier WM ((2012) ) Cerebrospinal fluid markers for differential dementia diagnosis in a large memory clinic cohort. Neurology 78: , 47–54. |
[8] | Skillback T , Delsing L , Synnergren J , Mattsson N , Janelidze S , Nagga K , Kilander L , Hicks R , Wimo A , Winblad B , Hansson O , Blennow K , Eriksdotter M , Zetterberg H ((2017) ) CSF/serum albumin ratio in dementias: A cross-sectional study on 1861 patients. Neurobiol Aging 59: , 1–9. |
[9] | Weiner MW , Veitch DP , Aisen PS , Beckett LA , Cairns NJ , Green RC , Harvey D , Jack CR Jr. , Jagust W , Morris JC , Petersen RC , Saykin AJ , Shaw LM , Toga AW , Trojanowski JQ , Alzheimer’s Disease Neuroimaging Initiative ((2017) ) Recent publications from the Alzheimer’s Disease Neuroimaging Initiative: Reviewing progress toward improved AD clinical trials. Alzheimers Dement 13: , e1–e85. |
[10] | Bombois S , Debette S , Bruandet A , Delbeuck X , Delmaire C , Leys D , Pasquier F ((2008) ) Vascular subcortical hyperintensities predict conversion to vascular and mixed dementia in MCI patients. Stroke 39: , 2046–2051. |
[11] | Bjerke M , Andreasson U , Rolstad S , Nordlund A , Lind K , Zetterberg H , Edman A , Blennow K , Wallin A ((2009) ) Subcortical vascular dementia biomarker pattern in mild cognitive impairment. Dement Geriatr Cogn Disord 28: , 348–356. |
[12] | Nordlund A , Rolstad S , Gothlin M , Edman A , Hansen S , Wallin A ((2010) ) Cognitive profiles of incipient dementia in the Goteborg MCI study. Dement Geriatr Cogn Disord 30: , 403–410. |
[13] | Kapasi A , DeCarli C , Schneider JA ((2017) ) Impact of multiple pathologies on the threshold for clinically overt dementia. Acta Neuropathol 134: , 171–186. |
[14] | Park JH , Seo SW , Kim C , Kim SH , Kim GH , Kim ST , Jeon S , Lee JM , Oh SJ , Kim JS , Choe YS , Lee KH , Shin JS , Kim CH , Noh Y , Cho H , Yoon CW , Kim HJ , Ye BS , Ewers M , Weiner MW , Lee JH , Werring DJ , Na DL ((2014) ) Effects of cerebrovascular disease and amyloid beta burden on cognition in subjects with subcortical vascular cognitive impairment. Neurobiol Aging 35: , 254–260. |
[15] | Rabin JS , Schultz AP , Hedden T , Viswanathan A , Marshall GA , Kilpatrick E , Klein H , Buckley RF , Yang HS , Properzi M , Rao V , Kirn DR , Papp KV , Rentz DM , Johnson KA , Sperling RA , Chhatwal JP ((2018) ) Interactive associations of vascular risk and beta-amyloid burden with cognitive decline in clinically normal elderly individuals: Findings from the Harvard Aging Brain Study. JAMA Neurol 75: , 1124–1131. |
[16] | Wallin A , Nordlund A , Jonsson M , Lind K , Edman A , Gothlin M , Stalhammar J , Eckerstrom M , Kern S , Borjesson-Hanson A , Carlsson M , Olsson E , Zetterberg H , Blennow K , Svensson J , Ohrfelt A , Bjerke M , Rolstad S , Eckerstrom C ((2016) ) The Gothenburg MCI study: Design and distribution of Alzheimer’s disease and subcortical vascular disease diagnoses from baseline to 6-year follow-up. J Cereb Blood Flow Metab 36: , 114–131. |
[17] | Wallin A , Nordlund A , Jonsson M , Blennow K , Zetterberg H , Ohrfelt A , Stalhammar J , Eckerstrom M , Carlsson M , Olsson E , Gothlin M , Svensson J , Rolstad S , Eckerstrom C , Bjerke M ((2016) ) Alzheimer’s disease–subcortical vascular disease spectrum in a hospital-based setting: Overview of results from the Gothenburg MCI and dementia studies. J Cereb Blood Flow Metab 36: , 95–113. |
[18] | Auer S , Reisberg B ((1997) ) The GDS/FAST staging system. Int Psychogeriatr 9 Suppl 1: , 167–171. |
[19] | Wallin A , Edman A , Blennow K , Gottfries CG , Karlsson I , Regland B , Sjogren M ((1996) ) Stepwise comparative status analysis (STEP): A tool for identification of regional brain syndromes in dementia. J Geriatr Psychiatry Neurol 9: , 185–199. |
[20] | Royall DR , Mahurin RK , Gray KF ((1992) ) Bedside assessment of executive cognitive impairment: The executive interview. J Am Geriatr Soc 40: , 1221–1226. |
[21] | Folstein MF , Folstein SE , McHugh PR ((1975) ) “Mini-mental state”. A practical method for grading the cognitive state of patients for the clinician. J Psychiatr Res 12: , 189–198. |
[22] | Morris JC ((1997) ) Clinical dementia rating: A reliable and valid diagnostic and staging measure for dementia of the Alzheimer type. Int Psychogeriatr 9 Suppl 1: , 173–176; discussion 177-178. |
[23] | McKhann G , Drachman D , Folstein M , Katzman R , Price D , Stadlan EM ((1984) ) Clinical diagnosis of Alzheimer’s disease: Report of the NINCDS-ADRDA Work Group under the auspices of Department of Health and Human Services Task Force on Alzheimer’s Disease. Neurology 34: , 939–944. |
[24] | Erkinjuntti T , Inzitari D , Pantoni L , Wallin A , Scheltens P , Rockwood K , Roman GC , Chui H , Desmond DW ((2000) ) Research criteria for subcortical vascular dementia in clinical trials. J Neural Transm Suppl 59: , 23–30. |
[25] | Andreasen N , Hesse C , Davidsson P , Minthon L , Wallin A , Winblad B , Vanderstichele H , Vanmechelen E , Blennow K ((1999) ) Cerebrospinal fluid beta-amyloid(1-42) in Alzheimer disease: Differences between early- and late-onset Alzheimer disease and stability during the course of disease. Arch Neurol 56: , 673–680. |
[26] | Mattsson N , Andreasson U , Persson S , Arai H , Batish SD , Bernardini S , Bocchio-Chiavetto L , Blankenstein MA , Carrillo MC , Chalbot S , Coart E , Chiasserini D , Cutler N , Dahlfors G , Duller S , Fagan AM , Forlenza O , Frisoni GB , Galasko D , Galimberti D , Hampel H , Handberg A , Heneka MT , Herskovits AZ , Herukka SK , Holtzman DM , Humpel C , Hyman BT , Iqbal K , Jucker M , Kaeser SA , Kaiser E , Kapaki E , Kidd D , Klivenyi P , Knudsen CS , Kummer MP , Lui J , Llado A , Lewczuk P , Li QX , Martins R , Masters C , McAuliffe J , Mercken M , Moghekar A , Molinuevo JL , Montine TJ , Nowatzke W , O’Brien R , Otto M , Paraskevas GP , Parnetti L , Petersen RC , Prvulovic D , de Reus HP , Rissman RA , Scarpini E , Stefani A , Soininen H , Schroder J , Shaw LM , Skinningsrud A , Skrogstad B , Spreer A , Talib L , Teunissen C , Trojanowski JQ , Tumani H , Umek RM , Van Broeck B , Vanderstichele H , Vecsei L , Verbeek MM , Windisch M , Zhang J , Zetterberg H , Blennow K ((2011) ) The Alzheimer’s Association external quality control program for cerebrospinal fluid biomarkers. Alzheimers Dement 7: , 386–395 e386. |
[27] | Eckerstrom C , Olsson E , Borga M , Ekholm S , Ribbelin S , Rolstad S , Starck G , Edman A , Wallin A , Malmgren H ((2008) ) Small baseline volume of left hippocampus is associated with subsequent conversion of MCI into dementia: The Goteborg MCI study. J Neurol Sci 272: , 48–59. |
[28] | Nordlund A , Rolstad S , Hellstrom P , Sjogren M , Hansen S , Wallin A ((2005) ) The Goteborg MCI study: Mild cognitive impairment is a heterogeneous condition. J Neurol Neurosurg Psychiatry 76: , 1485–1490. |
[29] | Bos I , Verhey FR , Ramakers I , Jacobs HIL , Soininen H , Freund-Levi Y , Hampel H , Tsolaki M , Wallin AK , van Buchem MA , Oleksik A , Verbeek MM , Olde Rikkert M , van der Flier WM , Scheltens P , Aalten P , Visser PJ , Vos SJB ((2017) ) Cerebrovascular and amyloid pathology in predementia stages: The relationship with neurodegeneration and cognitive decline. Alzheimers Res Ther 9: , 101. |
[30] | Blennow K , Hampel H ((2003) ) CSF markers for incipient Alzheimer’s disease. Lancet Neurol 2: , 605–613. |
[31] | van Leijsen EMC , Kuiperij HB , Kersten I , Bergkamp MI , van Uden IWM , Vanderstichele H , Stoops E , Claassen J , van Dijk EJ , de Leeuw FE , Verbeek MM ((2018) ) Plasma Abeta (amyloid-beta) levels and severity and progression of small vessel disease. Stroke 49: , 884–890. |
[32] | van Westen D , Lindqvist D , Blennow K , Minthon L , Nagga K , Stomrud E , Zetterberg H , Hansson O ((2016) ) Cerebral white matter lesions – associations with Abeta isoforms and amyloid PET. Sci Rep 6: , 20709. |
[33] | Bjerke M , Jonsson M , Nordlund A , Eckerstrom C , Blennow K , Zetterberg H , Pantoni L , Inzitari D , Schmidt R , Wallin A ((2014) ) Cerebrovascular biomarker profile is related to white matter disease and ventricular dilation in a LADIS substudy. Dement Geriatr Cogn Dis Extra 4: , 385–394. |
[34] | Wallin A , Kapaki E , Boban M , Engelborghs S , Hermann DM , Huisa B , Jonsson M , Kramberger MG , Lossi L , Malojcic B , Mehrabian S , Merighi A , Mukaetova-Ladinska EB , Paraskevas GP , Popescu BO , Ravid R , Traykov L , Tsivgoulis G , Weinstein G , Korczyn A , Bjerke M , Rosenberg G ((2017) ) Biochemical markers in vascular cognitive impairment associated with subcortical small vessel disease – A consensus report. BMC Neurol 17: , 102. |
[35] | Eckerstrom C , Olsson E , Klasson N , Bjerke M , Gothlin M , Jonsson M , Rolstad S , Malmgren H , Wallin A , Edman A ((2011) ) High white matter lesion load is associated with hippocampal atrophy in mild cognitive impairment. Dement Geriatr Cogn Disord 31: , 132–138. |
[36] | Fiford CM , Manning EN , Bartlett JW , Cash DM , Malone IB , Ridgway GR , Lehmann M , Leung KK , Sudre CH , Ourselin S , Biessels GJ , Carmichael OT , Fox NC , Cardoso MJ , Barnes J , Alzheimer’s Disease Neuroimaging Initiative ((2017) ) White matter hyperintensities are associated with disproportionate progressive hippocampal atrophy. Hippocampus 27: , 249–262. |
[37] | Hannestad J , Taylor WD , McQuoid DR , Payne ME , Krishnan KR , Steffens DC , Macfall JR ((2006) ) White matter lesion volumes and caudate volumes in late-life depression. Int J Geriatr Psychiatry 21: , 1193–1198. |
[38] | Mueller SG , Mack WJ , Mungas D , Kramer JH , Cardenas-Nicolson V , Lavretsky H , Greene M , Schuff N , Chui HC , Weiner MW ((2010) ) Influences of lobar gray matter and white matter lesion load on cognition and mood. Psychiatry Res 181: , 90–96. |
[39] | Herbert V , Brookes RL , Markus HS , Morris RG ((2014) ) Verbal fluency in cerebral small vessel disease and Alzheimer’s disease. J Int Neuropsychol Soc 20: , 413–421. |
[40] | Teng E , Leone-Friedman J , Lee GJ , Woo S , Apostolova LG , Harrell S , Ringman JM , Lu PH ((2013) ) Similar verbal fluency patterns in amnestic mild cognitive impairment and Alzheimer’s disease. Arch Clin Neuropsychol 28: , 400–410. |
[41] | Dong Y , Gan DZ , Tay SZ , Koay WI , Collinson SL , Hilal S , Venketasubramanian N , Chen C ((2013) ) Patterns of neuropsychological impairment in Alzheimer’s disease and mixed dementia. J Neurol Sci 333: , 5–8. |
[42] | Claus JJ , Staekenborg SS , Roorda JJ , Stevens M , Herderschee D , van Maarschalkerweerd W , Schuurmans L , Tielkes CE , Koster P , Bavinck C , Scheltens P ((2016) ) Low prevalence of mixed dementia in a cohort of 2,000 elderly patients in a memory clinic setting. J Alzheimers Dis 50: , 797–806. |
[43] | The LSG , Poggesi A , Pantoni L , Inzitari D , Fazekas F , Ferro J , O’Brien J , Hennerici M , Scheltens P , Erkinjuntti T , Visser M , Langhorne P , Chabriat H , Waldemar G , Wallin A , Wahlund A ((2011) ) 2001–2011: A decade of the LADIS (Leukoaraiosis And DISability) study: What have we learned about white matter changes and small-vessel disease? Cerebrovasc Dis 32: , 577–588. |
[44] | Claus JJ , Coenen M , Staekenborg SS , Schuur J , Tielkes CEM , Koster P , Scheltens P ((2018) ) Cerebral white matter lesions have low impact on cognitive function in a large elderly memory clinic population. J Alzheimers Dis 63: , 1129–1139. |
[45] | van Norden AG , van Uden IW , de Laat KF , van Dijk EJ , de Leeuw FE ((2012) ) Cognitive function in small vessel disease: The additional value of diffusion tensor imaging to conventional magnetic resonance imaging: The RUN DMC study. J Alzheimers Dis 32: , 667–676. |
[46] | Jack CR Jr. , Knopman DS , Jagust WJ , Shaw LM , Aisen PS , Weiner MW , Petersen RC , Trojanowski JQ ((2010) ) Hypothetical model of dynamic biomarkers of the Alzheimer’s pathological cascade. Lancet Neurol 9: , 119–128. |
[47] | Zetterberg H , Pedersen M , Lind K , Svensson M , Rolstad S , Eckerstrom C , Syversen S , Mattsson UB , Ysander C , Mattsson N , Nordlund A , Vanderstichele H , Vanmechelen E , Jonsson M , Edman A , Blennow K , Wallin A ((2007) ) Intra-individual stability of CSF biomarkers for Alzheimer’s disease over two years. J Alzheimers Dis 12: , 255–260. |

