
Spatially Distributed Amyloid-β Reduces Glucose Metabolism in Mild Cognitive Impairment
Abstract
Background:
Several positron emission tomography (PET) studies have explored the relationship between amyloid-β (Aβ), glucose metabolism, and the APOE ɛ4 genotype. It has been reported that APOE ɛ4, and not aggregated Aβ, contributes to glucose hypometabolism in pre-clinical stages of Alzheimer’s disease (AD) pathology.
Objective:
We hypothesize that typical measurements of Aβ taken either from composite regions-of-interest with relatively high burden actually cover significant patterns of the relationship with glucose metabolism. In contrast, spatially weighted measures of Aβ are more related to glucose metabolism in cognitively normal (CN) aging and mild cognitive impairment (MCI).
Methods:
We have generated a score of amyloid burden based on a joint singular value decomposition (SVD) of the cross-correlation structure between glucose metabolism, as measured by [18F]2-fluoro-2-deoxyglucose (FDG) PET, and Aβ, as measured by [18F]florbetapir PET, from the Alzheimer’s Disease Neuroimaging Initiative study. This SVD-based score reveals cortical regions where a reduced glucose metabolism is maximally correlated with distributed patterns of Aβ.
Results:
From an older population of CN and MCI subjects, we found that the SVD-based Aβ score was significantly correlated with glucose metabolism in several cortical regions. Additionally, the corresponding Aβ network has hubs that contribute to distributed glucose hypometabolism, which, in turn, are not necessarily foci of Aβ deposition.
Conclusions:
Our approach uncovered hidden patterns of the glucose metabolism-Aβ relationship. We showed that the SVD-based Aβ score produces a stronger relationship with decreasing glucose metabolism than either APOE ɛ4 genotype or global measures of Aβ burden.
INTRODUCTION
Regional glucose hypometabolism and the accumulation of fibrillar amyloid-β (Aβ) plaques are considered to be prominent features of mild cognitive impairment (MCI) and Alzheimer’s disease (AD) [1–4]. The “amyloid cascade hypothesis”[5–7] points to Aβ deposition as the key triggering event that induces reduced glucose metabolism, brain atrophy, cognitive impairment, and dementia. As such, investigators have extensively tested the amyloid cascade hypothesis to gain a better understanding of the relationship between Aβ deposition and AD-associated pathophysiological changes, such as glucose hypometabolism.
In an early study, Mega et al. [8] found an inverse relationship between [18F]2-fluro-2-deoxyglucose (FDG) positron emission tomography (PET) signal and biochemical measures of soluble and insoluble Aβ in prefrontal and parieto-occipital cortical regions, thereby providing a basis for further investigations into the association between regional metabolic deficits and Aβ burden. While Drzezga et al. [9] found the relationship between Aβ deposition and glucose metabolism to be the same in normal aging and AD, more recent studies [10–12] suggest that fibrillar Aβ load and cerebral glucose metabolism follow temporally-divergent evolution paths across AD progression [13], starting from the early, preclinical stages of the disease. Some investigations [10, 14] have found subtle hypometabolism in AD-signature regions for young, cognitively normal (CN) subjects who are apolipoprotein E ɛ4 (APOE ɛ4) carriers, but with no evidence of Aβ accumulation. Similarly, Jack et al. [10] showed that a high percentage of cognitively normal, elderly subjects had strong evidence of FDG PET hypometabolism before any signs of Aβ deposition. These studies have generally interpreted AD progression as a scenario where the APOE ɛ4 status alone can induce hypometabolism, but Aβ deposition alone can also induce similar hypometabolism, especially in AD-signature cortical regions [14]. More generally, Kadir et al. [15] found an increase in fibrillar Aβ load in MCI patients followed by stabilization at the AD stage, while regional cerebral glucose metabolism declined in MCI patients and worsened with subsequent cognitive decline.
It has been also reported that APOE ɛ4, and not aggregated fibrillar Aβ, contributes to glucose hypometabolism in CN [16] and MCI [17] subjects. Similarly, Knopman et al. [18] reported that the effect of APOE ɛ4 on glucose metabolism was not completely driven by the effect of Aβ deposition in CN. This work suggested that a set of AD-signature regions in AD progression might simply have unique susceptibility to both aging and APOE ɛ4-related effects. In contrast, Yi et al. [19] found that, for CN subjects carrying the APOE ɛ4 genotype, hypometabolism in AD-signature regions is primarily mediated by global cortical Aβ deposition. More general results suggest that, independently of the APOE ɛ4 genotype, Aβ accumulation and hypometabolism are more likely to occur simultaneously through the spectrum of brain Aβ levels in a dose-dependent manner [20, 21].
A potential limitation of these previous studies has been the representation of Aβ by a single global index, computed either from the whole cortex or from a pre-specified target region-of-interest (ROI) with relatively high Aβ burden. As such, the global-to-distributed view of the relationship Aβ-glucose metabolism has dominated the field. In order to overcome this limitation, some studies have focused on different spatial aspects of such a relationship, namely, the regional-to-regional view [20, 22, 23] (i.e., spatially concurrent measures of Aβ and metabolism) and the distributed-to-distributed view [24]. La Joie et al. [23] provided early evidence for regional variations in the relationship between Aβ load and hypometabolism, while Lowe et al. [20] showed strong associations between regional hypometabolism and regional Pittsburgh compound B (PiB) PET in CN subjects, particularly in typical AD-signature regions. However, for a combined cohort of CN and MCI subjects, regional Aβ accumulation showed little to no impact on concurrent regional glucose metabolism [22]. Similarly, using parallel independent component analysis (ICA) of FDG PET and PiB PET, Aβ showed only remote effects on brain metabolism in probable AD [24].
Given the amount of reported contradictory results, we focus on revealing distributed-to-distributed and local-to-distributed views of the Aβ-glucose metabolism relationship in CN and MCI subjects. Despite the fact that MCI is broadly considered a prodromal stage of AD, not all patients with MCI progress to AD, and even those individuals who convert show different rates of reduction in glucose metabolism and Aβ accumulation. Similarly, aging CN subjects may show incipient signatures of pathological AD, particularly those carrying the APOE ɛ4 genotype. As such, it is extremely important to investigate the glucose metabolism-amyloid accumulation relationship at the earliest as possible stage of cognitive deterioration, namely aging CN and MCI. For such purpose, we employ a singular value decomposition (SVD) [25], which is a data-driven technique that generalizes both principal components analysis (PCA) [26] and partial least squares (PLS) [27] to the case of two different image modalities. Essentially, SVD seeks to express the cross-correlation structure by a small number of pairs of “principal components”, each associated with random weights or loadings that vary over subjects [25].
In the current work, we hypothesize that the traditional choice of global Aβ measurements, either the whole cortex or pre-defined anatomical target ROIs with high Aβ uptake, limits our ability to uncover significant effects of Aβ burden on glucose metabolism. We also hypothesize that distributed-to-distributed and local-to-distributed patterns of the Aβ burden-glucose metabolism relationship are likely to appear in aging populations with varying degrees of cognitive impairment.
MATERIALS AND METHODS
Subjects and image acquisition
Data used in the preparation of this article were obtained from the Alzheimer’s Disease Neuroimaging Initiative (ADNI) database (http://adni.loni.usc.edu). The ADNI was launched in 2003 as a public-private partnership, led by Principal Investigator Michael W. Weiner, MD. The primary goal of ADNI has been to test whether serial magnetic resonance imaging (MRI), PET, other biological markers, and clinical and neuropsychological assessment can be combined to measure the progression of MCI and early AD.
The sample for this study consisted of 607 subjects from the ADNI study who had available [18F]florbetapir PET, [18F]FDG PET, 3D T1-weighted anatomical MRI, and APOE genotyping. CN subjects had Mini-Mental State Exam (MMSE) scores between 24 and 30 inclusively, a Clinical Dementia Rating (CDR) of 0, and did not have depression, MCI, or dementia. Early MCI (EMCI) subjects had MMSE scores between 24 and 30 inclusively, CDR of 0.5, a reported subjective memory concern, an absence of dementia, an objective memory loss measured by education-adjusted scores on delayed recall of one paragraph from Wechsler Memory Scale Logical Memory (WMSLM) II, essentially preserved activities of daily living, and no impairment in other cognitive domains. Late MCI (LMCI) subjects had the same inclusion criteria, except for objective memory loss measured by education adjusted-scores on delayed recall of one paragraph from (WMSLM) II. The sample demographics are shown in Table 1.
Table 1
Summary of subject characteristics
| All | CN | EMCI | LMCISample Size | 607 | 223 | 201 | 183 | |
| Age | 73.85±7.37 | 75.61±6.25 | 71.52±7.49 | 74.24±7.84 | ||||
| Gender (F/M) | 284/323 | 120/103 | 89/112 | 75/108 | ||||
| APOE ɛ4 (Carrier/Non-Carrier) | 237/370 | 51/172 | 86/115 | 100/83 | ||||
| Visual Read Aβ (+/ –) | 184/423 | 28/194 | 58/143 | 98/86 | ||||
| MMSE | 28.09±2.38 | 28.95±1.30 | 28.45±1.53 | 26.67±3.32 | ||||
| ADAS-Cog | 13.86±8.31 | 9.46±4.43 | 12.84±5.59 | 20.34±10.11 | ||||
| Sample Size CSF | 381 | 148 | 119 | 114 | ||||
| CSF-Aβ1-42 (pg/mL) | 183.13±54.36 | 201.13±52.84 | 182.31±52.30 | 160.61±50.13 | ||||
| CSF-tau (pg/mL) | 82.42±48.27 | 67.88±32.53 | 80.09±44.90 | 104.52±60.32 | ||||
| CSF-ptau (pg/mL) | 40.08±23.21 | 36.79±19.78 | 36.43±20.61 | 48.21±27.65 |
A detailed description of the ADNI MRI and PET image acquisition protocols can be found at http://adni.loni.usc.edu/methods. ADNI studies are conducted in accordance with the Good Clinical Practice guidelines, the Declaration of Helsinki, and U.S. 21 CFR Part 50 (Protection of Human Subjects), and Part 56 (Institutional Review Boards), where informed written consent was obtained from all participants at each site.
The 607 [18F]florbetapir PET scans were visually assessed by three independent experts that successfully completed the training program described in Amyvid Prescribing Information (https://pi.lilly.com/us/amyvid-uspi.pdf). The purpose of this visual assessment was to classify subjects into positive (Aβ+) and negative (Aβ-) amyloid subjects. Each of the three independent experts provided a single assessment of each [18F]florbetapir PET scan and the final classification was based on the most prevalent assessment among the trained experts.
Image processing
MRI and PET images were processed using the PIANO™ software package (Biospective Inc., Montreal, Canada). T1-weighted MRI volumes underwent image non-uniformity correction using the N3 algorithm [28], brain masking, linear spatial normalization utilizing a 9-parameter affine transformation, and nonlinear spatial normalization to map individual images from native coordinate space to Montreal Neurological Institute (MNI) reference space using a customized, anatomical MRI template derived from ADNI subjects. The resulting image volumes were segmented into gray matter (GM), white matter (WM), and cerebrospinal fluid (CSF) using an artificial neural network classifier [29] and partial volume estimation [30].
The [18F]florbetapir and [18F]FDG PET images underwent several pre-processing steps, including frame-to-frame linear motion correction, smoothing with scanner-specific blurring kernels to achieve 8 mm FWHM [31], and averaging of dynamic frames into a static image. The resulting smoothed PET volumes were linearly registered to the subject’s T1-weighted MRI and, subsequently, spatially normalized to reference space using the linear and nonlinear transformations derived from the anatomical MRI registration. The GM density map for each subject was transformed to the same final spatial resolution (i.e., re-sampled to the same voxel size) as the FDG PET data in order to account for confounding effects of atrophy in the group level statistical model. Standardized uptake value ratio (SUVR) maps of the images were generated from [18F]florbetapir PET using the full cerebellum as reference region. Similarly, SUVR maps for [18F]FDG PET were generated using the pons as a reference region.
Statistical analysis
The methodology introduced here is composed of three main analyses:
1) Singular value decomposition (SVD) of the multi-modality cross-correlation matrix and computation of individual SVD-based amyloid scores
2) Voxelwise general linear model (GLM) for statistical assessment of the effect of SVD-based Aβ scores on FDG PET SUVR
3) Voxelwise GLM for the statistical assessment of the effect of seed-based amyloid on FDG PET SUVR
The eigenimages and individual SVD-based scores resulting from step 1) above will then be used on the subsequent steps. Indeed, while the individual Aβ scores can be straightforwardly regressed against the FDG PET maps, the corresponding Aβ eigenimages also provide useful information about regions highly contributing to a local-to-distributed relationship between Aβ burden and glucose metabolism. Hence, steps 2) and 3) assess the statistical significance of the main effect of Aβ SVD-based and local (seed)-based scores on metabolism, respectively. The remainder of this section contains detailed explanations about each of these three steps.
Cross-correlation and SVD Analysis
In this section, we present a brief summary of the SVD procedure [25]. Let X and Y be two sets of N PET images (e.g., florbetapir and FDG SUVR images), where the rows are the image values and the N columns are the number of subjects. The number of subjects must be identical for the two image modalities, while the number of voxels may differ. We also assume that the columns of X and Y are centered by subtracting their mean value over subjects and normalized by dividing by their root sum of squares, respectively. The cross-correlation voxels×voxels matrix between X and Y is defined as
Since the size of the cross-correlation matrix C is usually much larger than its rank (i.e., many more voxels than subjects), the statistical inference over this matrix, or even its storage, becomes impractical. As such, dimensionality reduction techniques based on matrix decompositions are required. The SVD of the cross-correlation matrix C is given by
Additionally, the dot product between a matched pair of eigenimages resembles the so-called homologous correlation (i.e., correlation between corresponding voxels), which is simply the diagonal of the voxel x voxel matrix C. Note that such homologous correlation would produce a local-to-local (at the voxel level) distributed view of the correlation between amyloid and FDG SUVR images.
A straightforward computational way of finding analytical expressions for the matrices U, V, and W, as well as for the corresponding subject scores or eigenvectors, has been reported by Worsley et al. [25]. In particular, SVD-based Aβ scores (SUVRSVD) are easily obtained by mapping the florbetapir data matrix X onto the space of the orthogonal eigenimages U (i.e., U’X). By definition, the SUVRSVD scores are (distributed) weighted averages of the whole cortex Aβ burden that maximally correlate with specific metabolic spatial network. Since the eigenvalues in W come in an ordered fashion, the pair of components corresponding to the first columns of U and V provide the maximum distributed-to-distributed cross-correlation pattern between Aβ burden and metabolism. In the following description, SUVRSVD will refer to the first (i.e., corresponding to the maximum eigenvalue in W) amyloid score (i.e., first row of U’X).
Note that the computation of the individual scores described above depends on the eigenimages that have been, in turn, derived from the whole sample. In order to overcome any possible circularity effect, we have employed a leave-one-out cross-validation technique to produce the individual SVD-based scores. Thus, leaving each sample out one-at-a-time, the SVD and corresponding eigenimages are produced from the rest of the sample (as previously described). Then, the individual scores SUVRSVD for the left-out sample is computed by mapping it onto the space of the orthogonal eigenimages corresponding to the rest of the sample.
Assessment of global and local amyloid scores
A voxelwise analysis-of-covariance (ANCOVA) model that included FDG SUVR as dependent, predicting variable (YFDG); age, gender, and cognitive measurements (MMSE and ADAS-Cog) as global confounding covariates; GM density as a voxelwise confounding covariate (grouped as XCov); and Aβ burden (Amyloid), APOE ɛ4 status, and Amyloid x APOE ɛ4 status interaction as predictors-of-interest was assessed:
(1)
Note that the GM density was also included as a covariate in order to minimize the potential confounding effect of inter-subject differences in brain atrophy [32]. Post-hoc, two-tailed Student’s t-tests were performed to assess the main effects-of-interest and interaction terms.
Three different Aβ burden predictors were evaluated with this model. The first and second cases correspond to the SVD-based score (SUVRSVD) and the average of Aβ burden within a composite ROI (SUVRCMP), respectively. Here, the ROI is composed of typical anatomical brain regions with high Aβ load in AD, and includes the frontal, temporal, and parietal cortices, as well as the precuneus. A third variant includes local Aβ measurements (SUVRseed) taken from 10 mm seeds centered on areas highly contributing (e.g., local maxima) to the first SVD-based amyloid eigenimage. Our intention here is to reveal local-to-distributed patterns on the relationship between (local at the seed level) Aβ and (distributed) glucose metabolism.
The voxelwise statistical analysis was performed using the SurfStat toolbox (http://www.math.mcgill.ca/keith/surfstat), where statistical maps were projected onto the cortical surface for visualization purposes only. The t-statistic maps corresponding to each effect-of-interest were thresholded using the False Discovery Rate (FDR) procedure (α=0.05) to control for multiple comparisons [33].
RESULTS
Cross-correlation Analysis
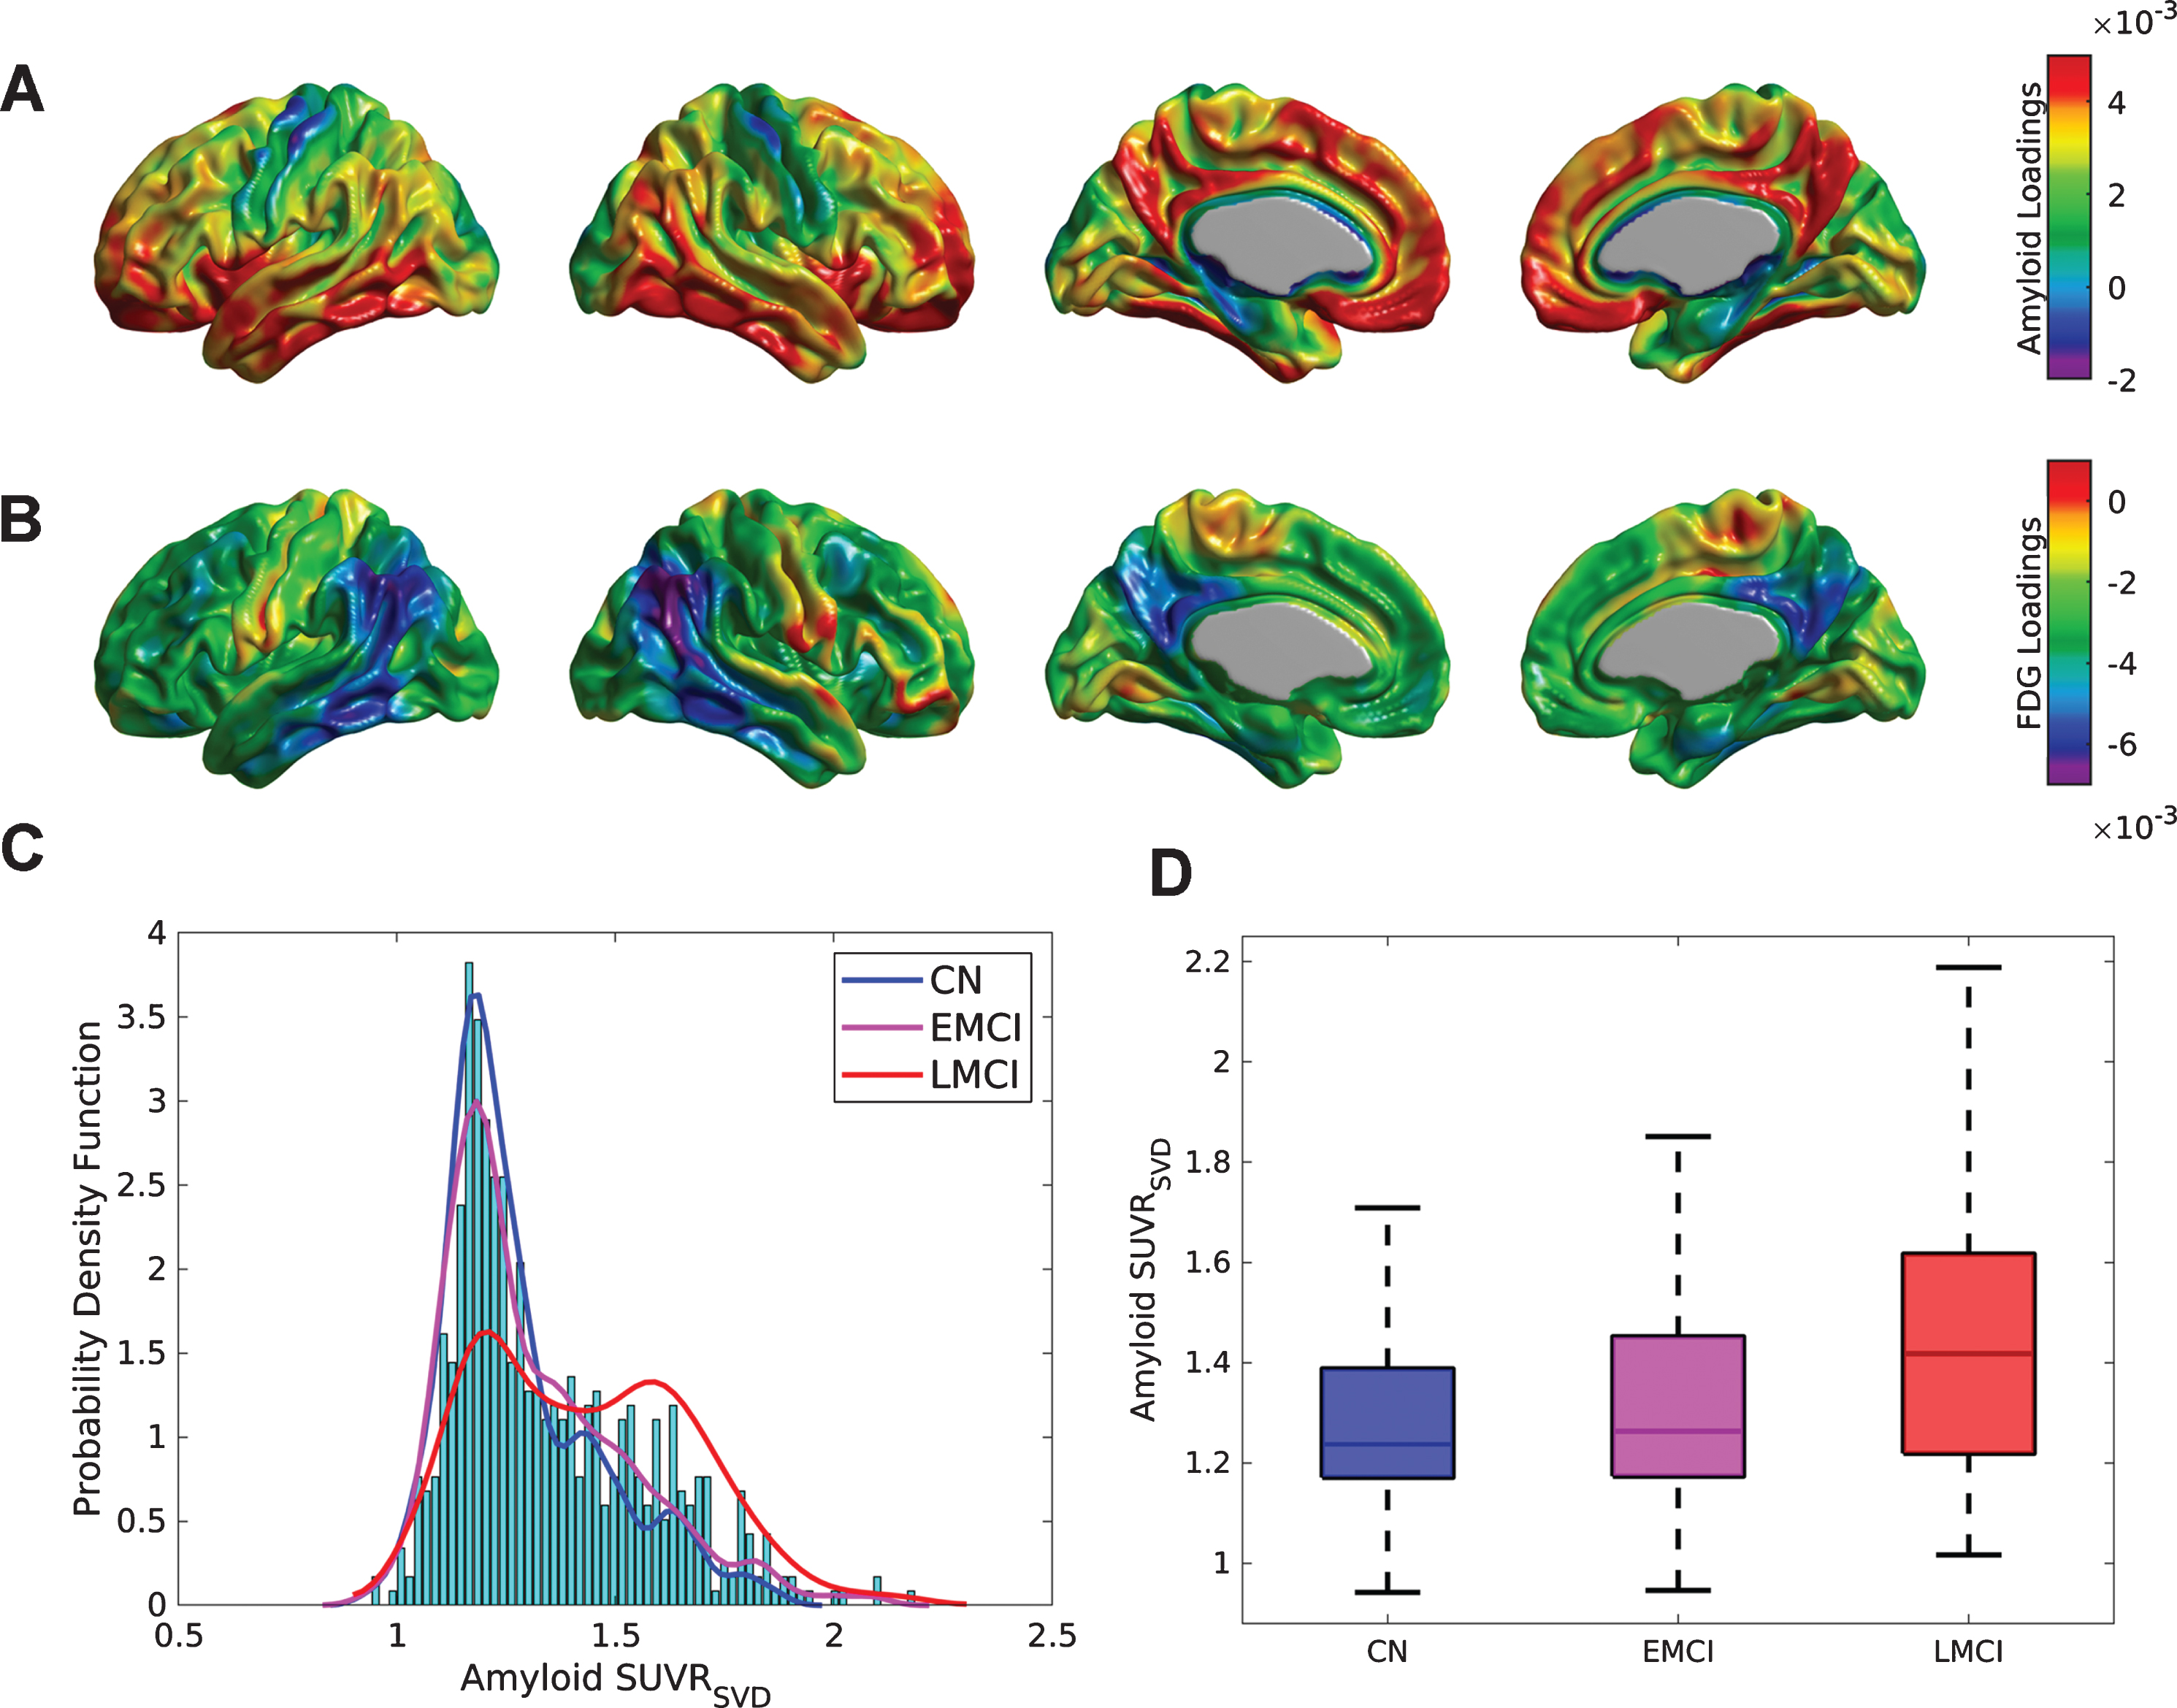
The first (Fig. 1A, B), second, and third SVD components accounted for 27.84%, 3.41%, and 2.93% of the total co-variability between the florbetapir and FDG PET images, respectively. The strongest positive weights in the first Aβ eigenimage (Fig. 1A) correspond to the medial prefrontal and posterior cingulate cortices, precuneus, lateral inferior temporal gyrus, and fusiform gyrus, which are regions maximally related to the reduction of glucose metabolism in the angular and inferior temporal gyri (Fig. 1B). Figure 1 C shows the distribution (over subjects) of the first SVD-based Aβ score (SUVRSVD), as well as an estimation of the probability distribution functions for the CN, EMCI, and LMCI subpopulations. While the CN and EMCI show unimodal distributions of SVD-based scores with maximum peak around SUVR = 1.2, the LMCI presents a clear bi-modal distribution with peaks around SUVR = 1.2 and SUVR = 1.6, respectively. Figure 1D shows box-plots corresponding to the individual SUVRSVD Aβ scores for the three different clinical classification groups. The mean SUVRSVD Aβ scores were SUVR = 1.29±0.18, 1.33±0.21, and 1.44±0.24 for the CN, EMCI, and LMCI groups, respectively. Indeed, these values were statistically significant different across the clinical classification (F = 26.86, p < 0.001), as well as between APOE ɛ4 carriers (SUVR = 1.45±0.22) and APOE ɛ4 non-carriers (SUVR = 1.28±0.19) (t = 10.09, p < 0.001). Statistically significant correlations were found between the SUVRSVD Aβ scores and MMSE (r = –0.33, p < 0.001), ADAS-Cog (r = 0.37, p < 0.001), CSF Aβ1-42(r = –0.67, p < 0.001), CSF tau (r = 0.45, p < 0.001), and CSF p-tau (r = 0.48, p < 0.001).
Fig.1
SVD analysis for the cross-correlation between Aβ and metabolism across the whole sample of florbetapir and FDG PET images. Cortical surface projections for the pair of spatial loadings of (A) Aβ and (B) glucose metabolism corresponding to the first principal component, which accounted for 27.84% of the total co-variability. The strongest positive weights in (A) are regions maximally related to the reduction of glucose metabolism observed in (B), namely, in the angular and inferior temporal gyri. C) Histograms and empirical density distribution of the SVD-based Aβ scores for each clinical sub-population. The CN and EMCI scores show unimodal distributions with maximum peaks around SUVR = 1.2. The LCMI scores show a bi-modal distribution with two peaks around SUVR = 1.2 and SUVR = 1.6. D) Box-plots of the Aβ subject loadings for each cognitive group. The mean SUVRSVD amyloid increases with the cognitive decline (F = 30.84, p < 0.001).
SVD-based Aβ scores analysis
The main effects of APOE ɛ4 status and SVD-based Aβ scores on FDG SUVR were assessed by statistical inference over the coefficients bApo and bAmy in Model (1), respectively.
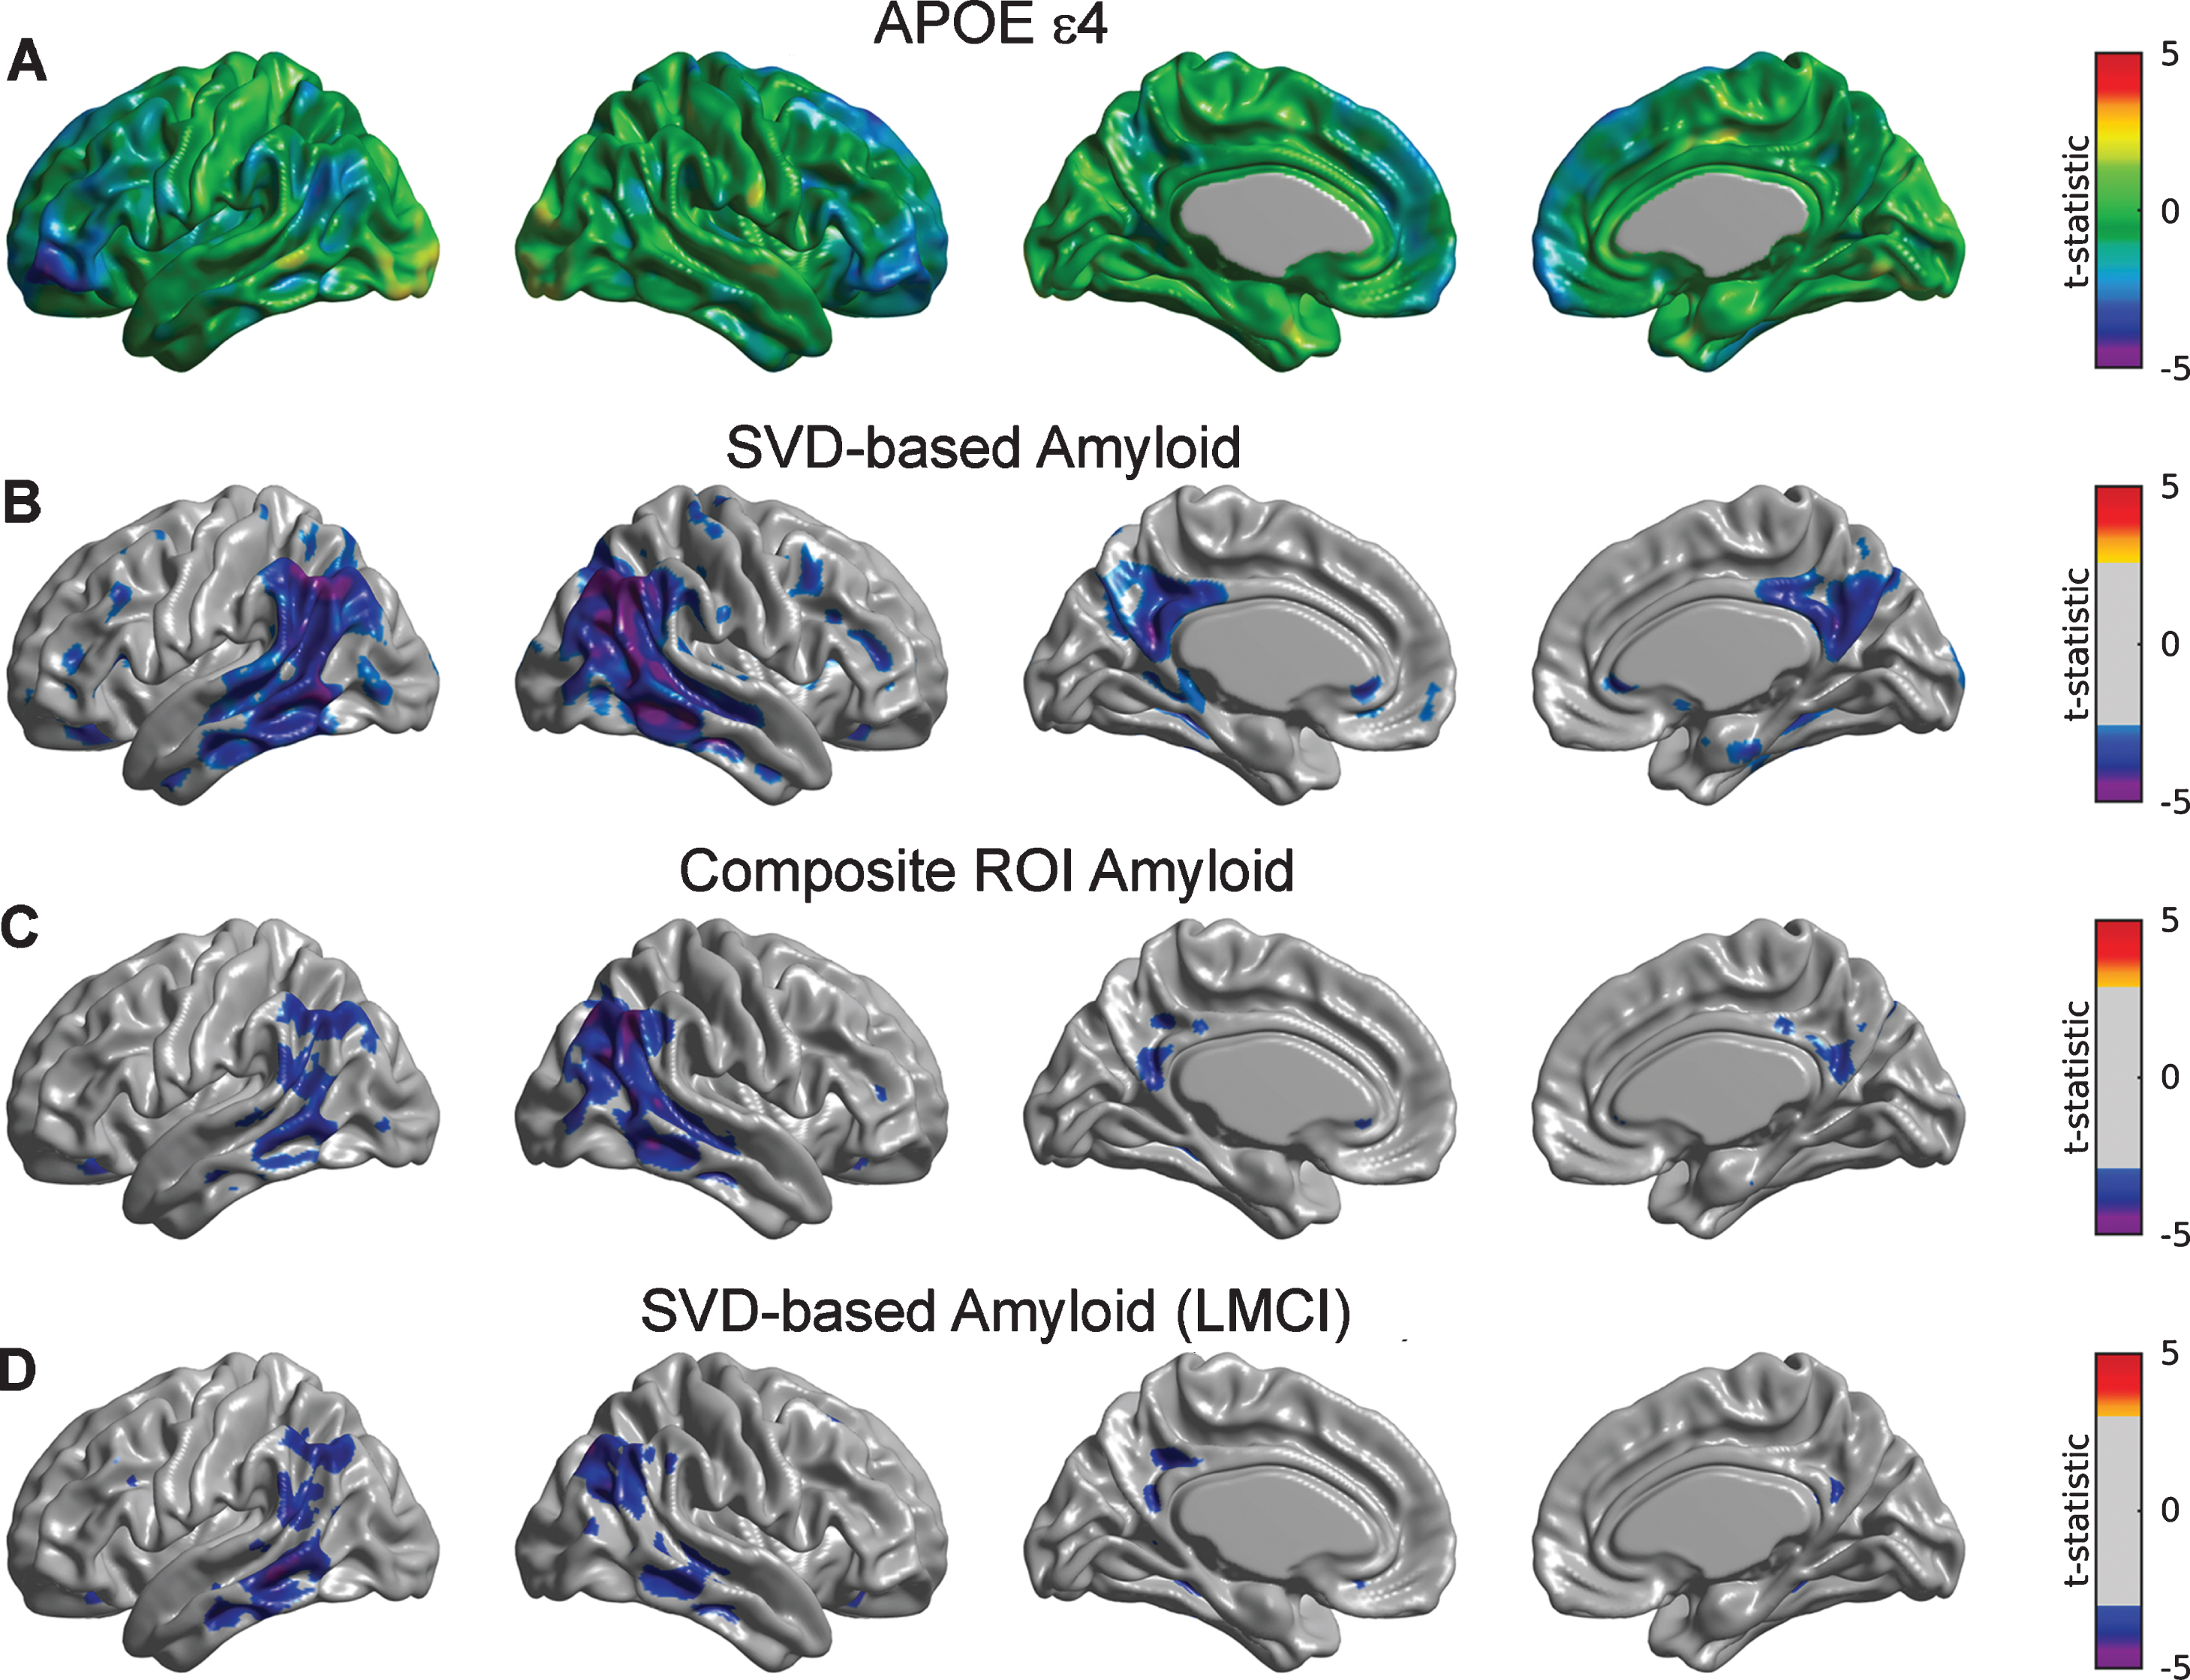
Although showing an overall trend of relationship with glucose metabolism, the main effect of APOE ɛ4 after controlling for SVD-based Aβ only appeared to be statistically significant in small regions corresponding to inferior frontal gyrus (Fig. 2A). Statistically significant Aβ-related decreases in metabolism were observed in a number of regions, including the bilateral right angular gyrus, inferior temporal gyrus, and precuneus (Fig. 2B). Note a more limited set of significant regions when using the composite ROI average of Aβ burden (Fig. 2C).
Fig.2
Statistical assessment of APOE ɛ4 and two different Aβ predictors on glucose metabolism. A) Cortical surface projections of t-statistic maps for the main effect of APOE ɛ4. FDR-based thresholding showed no significant regions. FDR-thresholded statistically significant regions for the main effect of SVD-based Aβ scores (B) and composite ROI amyloid burden (C) as predictors of cortical metabolism. The effect of composite ROI Aβ burden on metabolism is less spatially extended compared to the SVD-based Aβ score, particularly in the bilateral right angular gyrus, inferior temporal gyrus, and precuneus. D) Regions surviving FDR thresholding for the main effect of SVD-based Aβ scores corresponding to the LMCI cohort. Significant regions appear to be weaker and less spatially extended as compared to the whole sample.
We subsequently re-evaluated the corresponding SVD-based Aβ scores for each of the subpopulations of CN, EMCI, and LMCI subjects. Supplementary Figure 1 shows the first SVD Aβ (A, C, E) and FDG (B, D, F) components, which accounted for 15.21%, 25.17%, and 28.55% of the total co-variability, respectively. It is interesting to note that, while the topographical distribution of the first FDG eigenimage appeared to be similar across the three subpopulations, the Aβ eigenimage seems to be shifted from inferior parietal regions in CN subjects to inferior temporal regions in the LCMI cohort. For the CN group, the strongest positive weights in the first Aβ eigenimage (Supplementary Figure 1A) correspond to the posterior cingulate cortex, precuneus, lateral inferior temporal gyrus, and right angular gyrus, while the strongest negative FDG weights appear in the right angular gyrus (Supplementary Figure 1B). The Aβ eigenimage corresponding to the EMCI group does not appear to be strong in the right angular gyrus (Supplementary Figure 1 C), but it maintains strong concurrent negative FDG weights (Supplementary Figure 1D). However, the spatial patterns of the SVD components in the LMCI group are similar to those corresponding to the whole sample (Supplementary Figure 1E, F). There was no significant effect of SVD-based scores or APOE ɛ4 on metabolism for the individual sub-populations corresponding to CN and EMCI subjects (figures not shown here). In contrast, we observed (weak) statistically significant relationships between SVD-based Aβ and glucose metabolism in the angular gyrus and middle temporal gyri in the LMCI cohort (Fig. 2D).
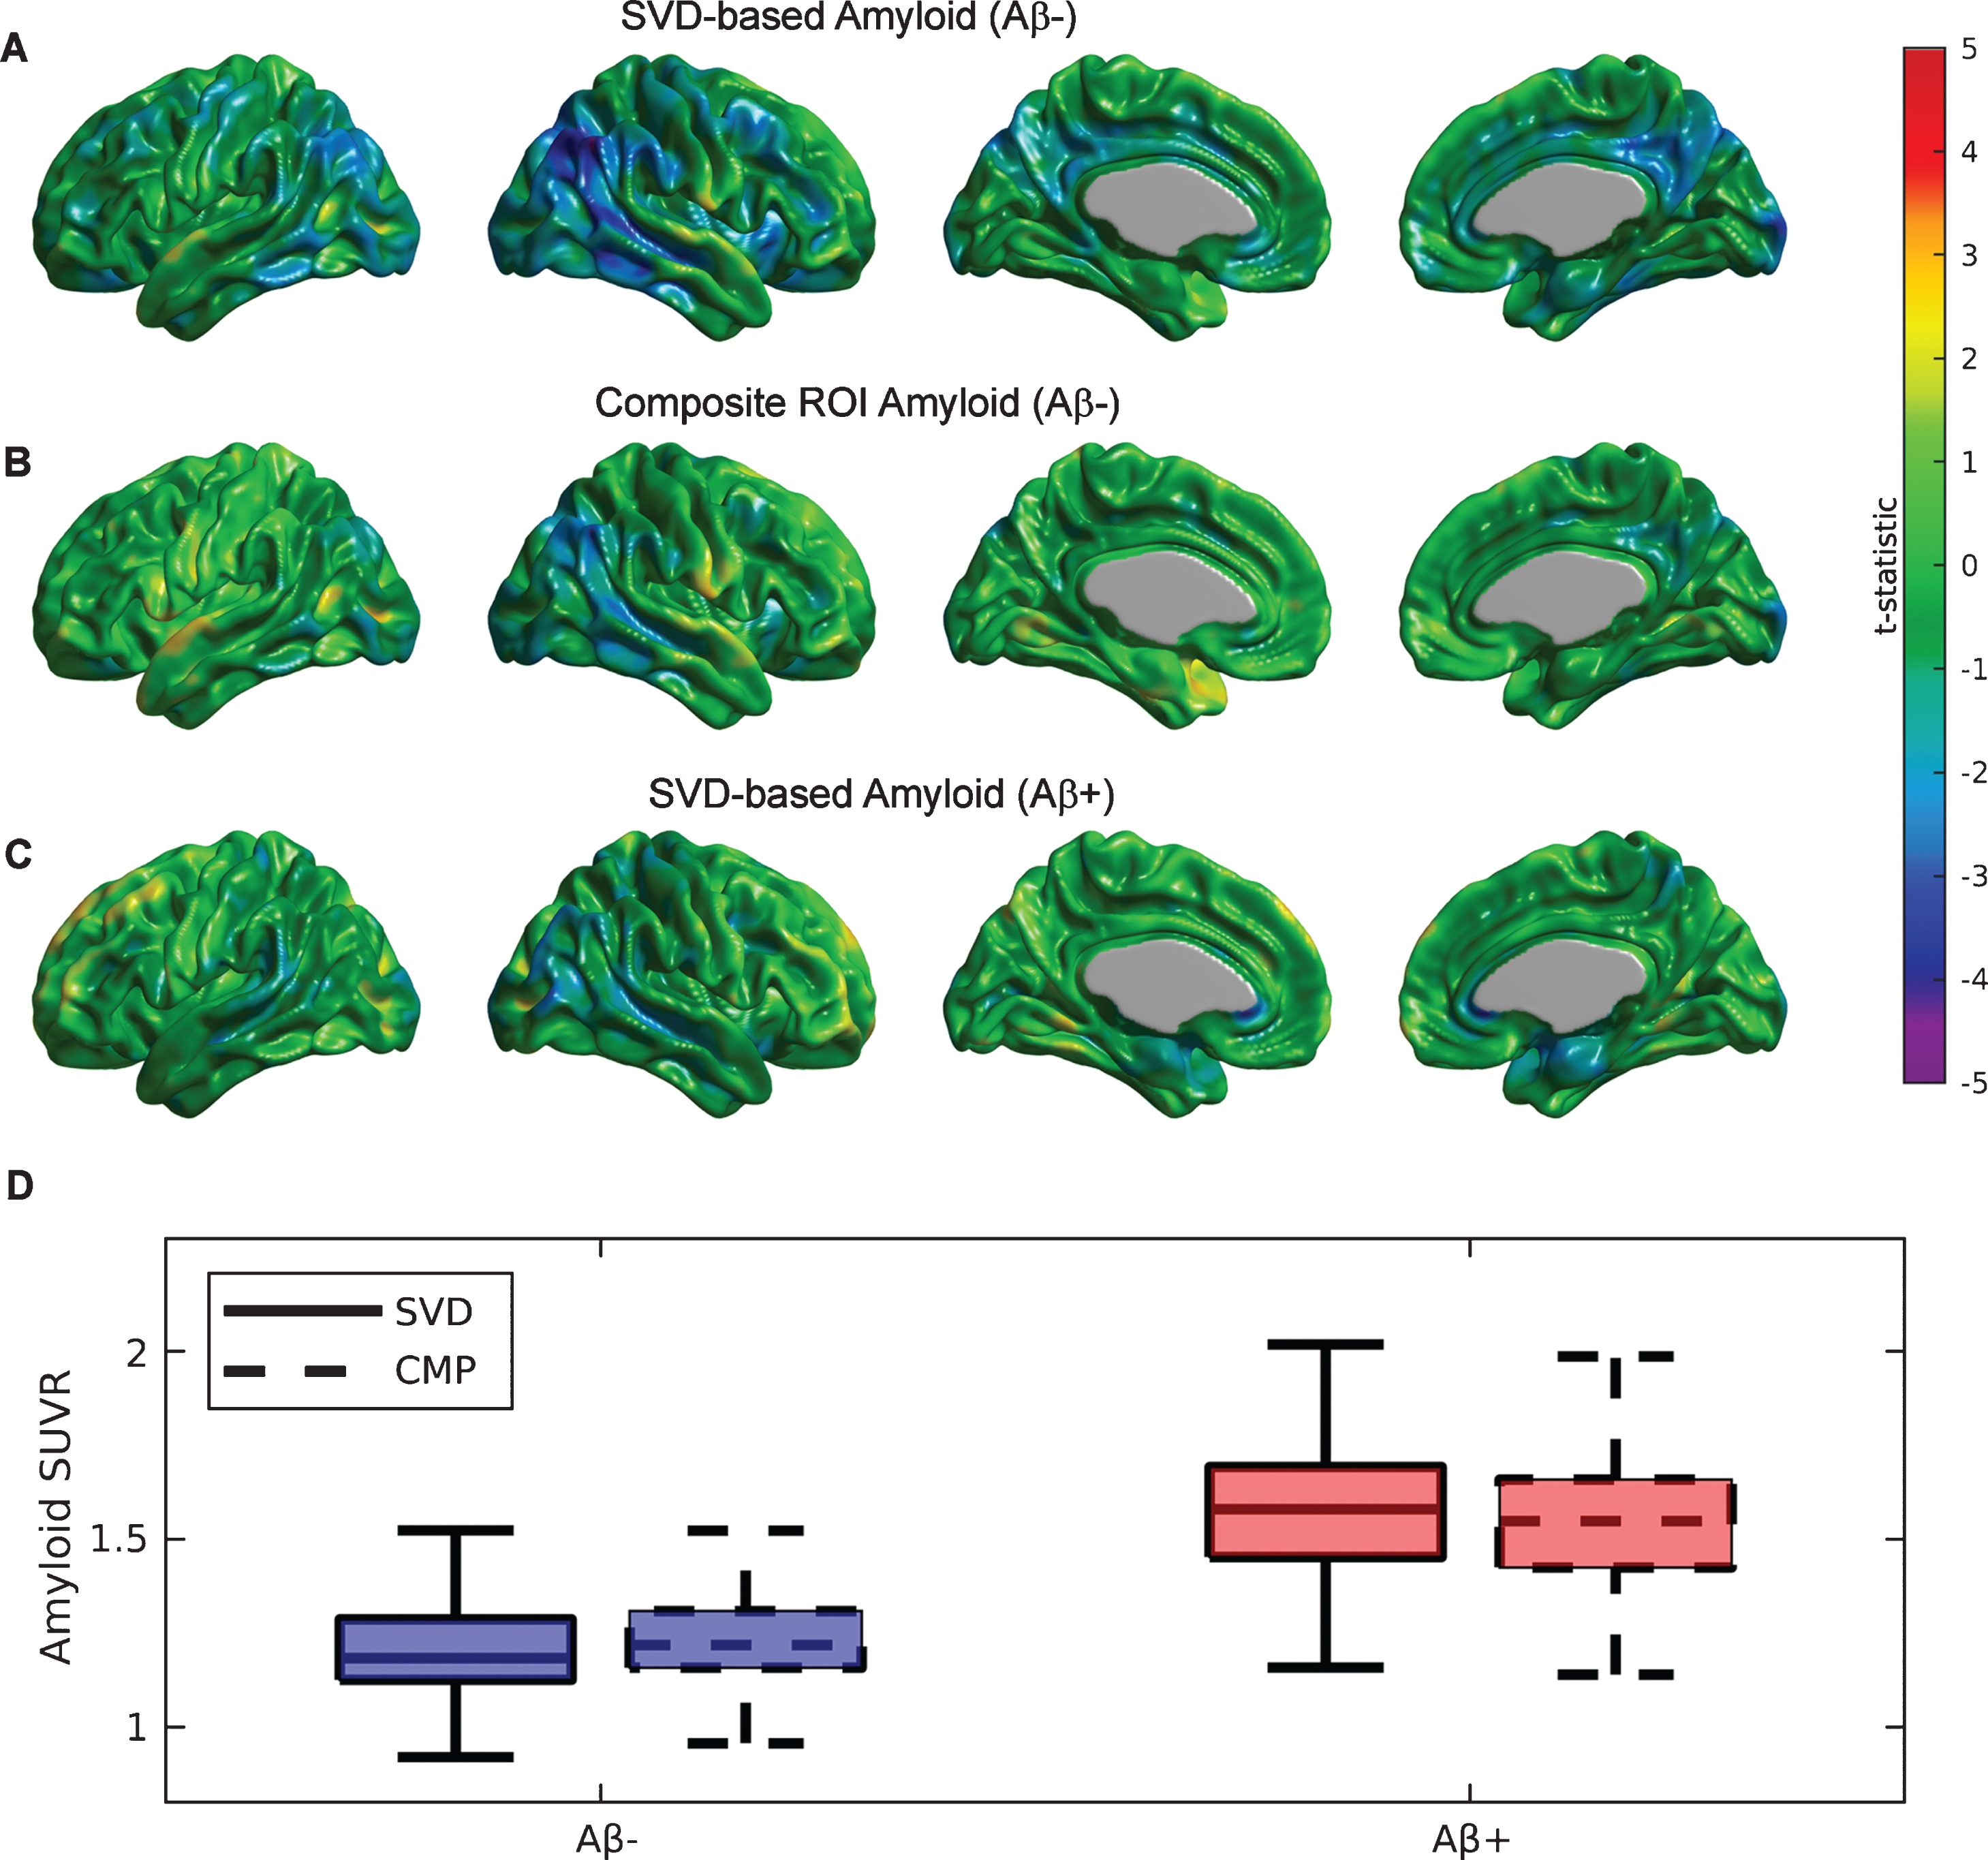
Similar to the previous SVD analysis on each particular cognitive cohort, we also assessed the value of the SVD-based Aβ scores on the two groups of subjects labelled as Aβ+ and Aβ- based on visual reads. Supplementary Figure 2 shows the first SVD amyloid (A, C) and FDG (B, D) components for the Aβ- and Aβ+ groups, which accounted for 12.19% and 10.85% of the total co-variability, respectively. While the strongest negative FDG weights appear in the right angular gyrus, posterior cingulate, and precuneus areas for the Aβ- cohort (Supplementary Figure 2B), no clear indication of a focal relationship with distributed Aβ appear in the group of Aβ+ subjects (Supplementary Figure 2D). The topographical distribution of the first Aβ eigenimage in the Aβ- subjects (Supplementary Figure 2A) appears to be strong in the posterior cingulate cortex, precuneus, lateral inferior temporal gyrus, insula, medial prefrontal cortex, and right angular gyrus. In contrast, the Aβ+ group shows a more homogenous and globally distributed pattern of Aβ related to glucose metabolism (Supplementary Figure 2 C), particularly in the frontal cortex. Figure 3A shows the t-test parametric maps of the relationship between glucose metabolism and SVD-based Aβ scores corresponding to the Aβ- cohort. Some areas of statistically significant correlations are observed in the right angular gyrus and the posterior cingulate cortex. As a comparison, note a weaker relationship for the case of the composite Aβ ROI (Fig. 3B), despite both Aβ measurements producing scores of similar magnitudes (see Fig. 3D). As evidenced by Figure 3D, the boxplots of the SVD-based and composite ROI metrics show similar mean values in both cohort of subjects. In contrast, between-cohort comparisons show much higher (t = 24.05, p < 0.001) SVD-based score values for the case of Aβ+ (1.58±0.19) as compared to the Aβ- subjects (1.22±0.16). Note, however, that the SVD-based amyloid scores do not produce a strong relationship with glucose metabolism in the cohort of Aβ+ subjects (Fig. 3 C).
Fig.3
Statistical assessment of different Aβ predictors on glucose metabolism for the cohort of Aβ- and Aβ+ subjects. A) Strong areas of relationship between SVD-based Aβ scores and glucose metabolism are observed in the bilateral angular gyri and the posterior cingulate cortex for the Aβ- subjects. B) A much weaker association is observed for the composite ROI Aβ score. C) A weak association between SVD-based scores and metabolism is also observed for Aβ+ subjects. D) Boxplots for the SVD-based Aβ scores and composite ROI amyloid show similar mean values in both cohorts of subjects.
Seed-based amyloid analysis
Several seed regions were identified as local maxima in the first Aβ eigenimage: medial prefrontal cortex (with Talairach coordinates [-6 50 -16] and [6 50 -16]), precuneus ([-6 -62 38] and [6 -62 38]), fusiform gyri ([-28 -44 -18] and [28 -44 -18]), pars opercularis ([-52 14 6], and [52 14 6]), and lateral inferior temporal gyri ([-56 -42 -12] and [56 -42 -12]). Based on local minima of the first FDG eigenimage, two additional seeds were also placed in the left ([-42 -50 36]) and right angular gyri ([42 -50 36]).
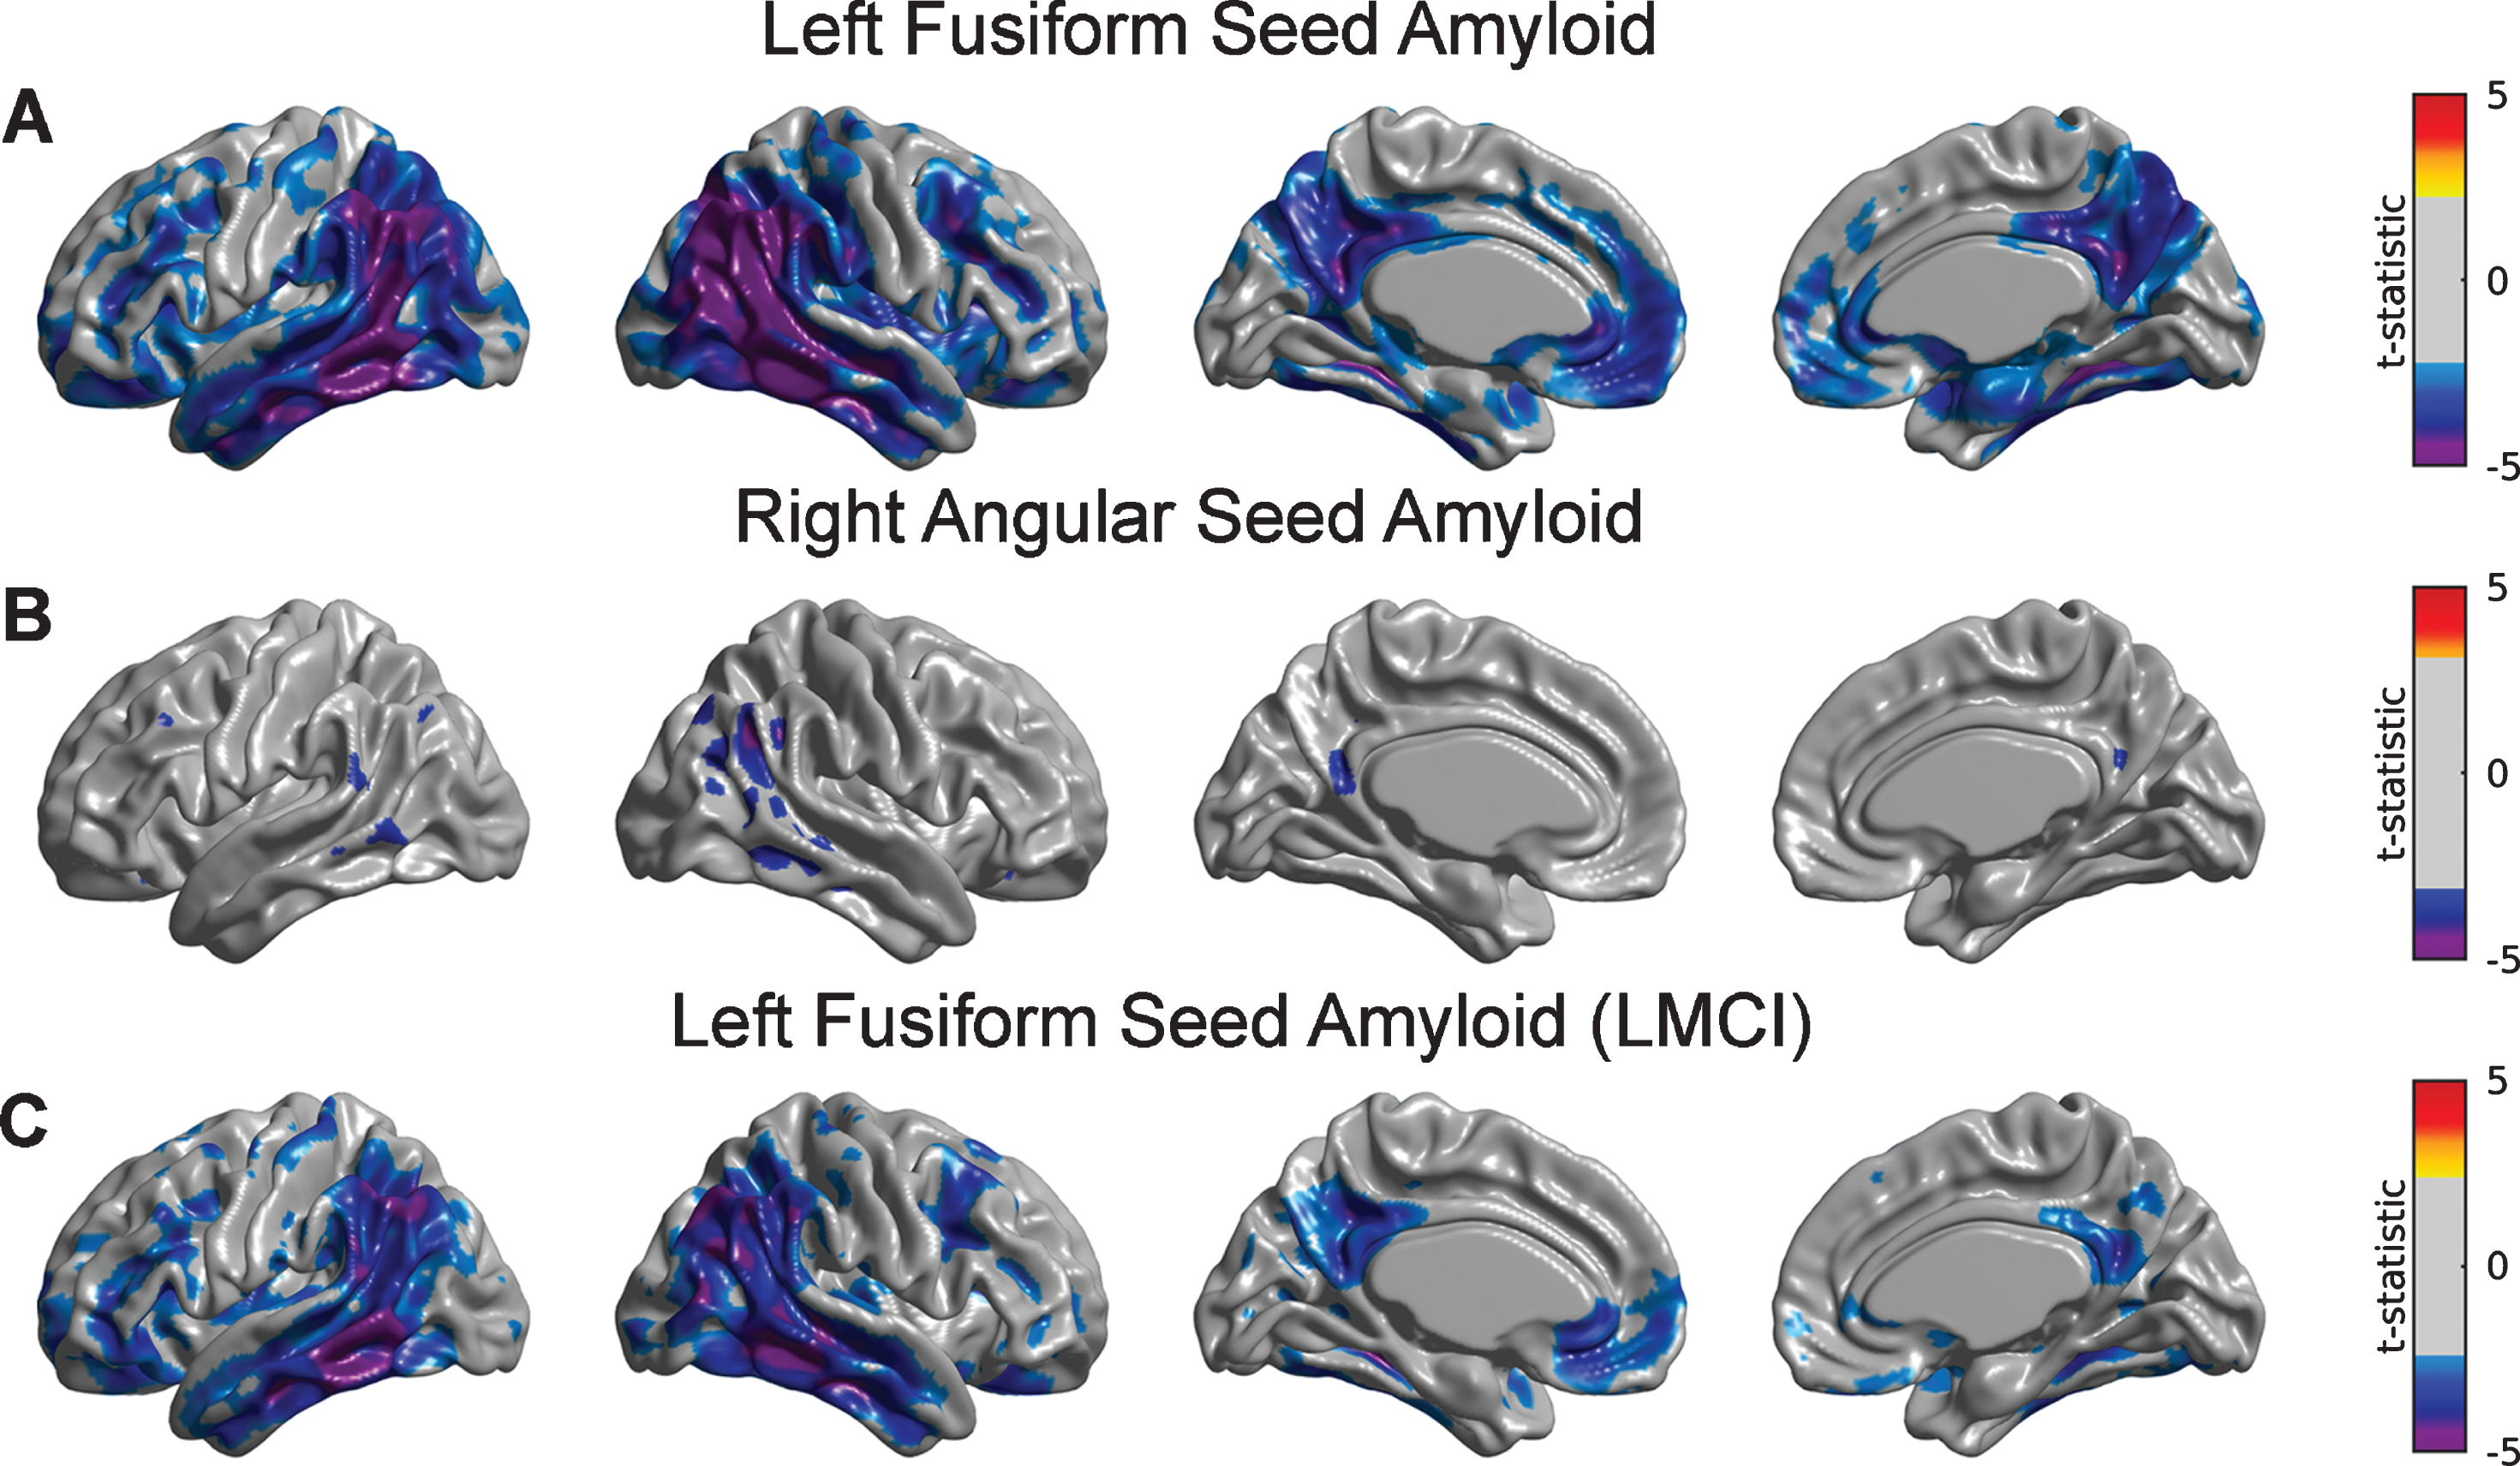
A detailed seed-based analysis is presented for two seed regions: (a) the right angular gyrus (RANG), a region that showed significant hypometabolism related to the SVD-based Aβ load; and (b) the left fusiform gyrus (LFUSI), a region highly contributing (i.e., local maxima) to the spatial pattern of the first SVD-based spatial amyloid loadings. Figure 4A and 4B show the spatial distribution of the Aβ pattern of spread or “amyloid network” corresponding to each of these two seeds, respectively. As expected, relatively strong correlation values were obtained around the seed location. However, the seed-based amyloid network relative to the RANG seed (Fig. 4B) appears to be stronger and has a larger spatial extent compared to the one corresponding to the LFUSI seed (Fig. 4A). In fact, the network relative to the RANG seed follows a spatial pattern similar (although weaker in magnitude) to the one resulting from the composite ROI amyloid “seed” (Fig. 4 C). Pearson’s correlation between local Aβ and local glucose metabolism (i.e., at the same seed location) in the LFUSI and RANG were r = –0.1613 (p < 0.001) and r = –0.2562 (p < 0.001), respectively. Figure 4D shows box-plots corresponding to the individual LFUSI and RANG SUVRseed amyloid measurements for the three different clinical classification groups. Note that, for each of the three clinical cohorts, the LFUSI seed region shows relatively lower Aβ burden than the RANG seed region. However, these local measures of amyloid showed distinct local-to-distributed patterns of cross-correlation with glucose metabolism (Fig. 5A, B). The pattern observed with LFUSI Aβ (Fig. 5A) showed negative statistically significant correlations with glucose metabolism in the inferior temporal-parietal cortex, posterior cingulate cortex, and precuneus, which resembles the significant regions obtained with the SVD-based amyloid burden (i.e., Fig. 2B). In contrast, as observed in Figure 5B, the Aβ burden in the RANG was negatively related to glucose metabolism in a small cluster within the RANG itself (i.e., local-to-local relationship). Remarkably, the strengths of these distinct seed-based correlation patterns seem to go in opposite direction as compared the corresponding Aβ networks (Fig. 4A, B). While the Aβ network for the LFUSI seed appears to be weaker in magnitude and spatial extent than that corresponding to the RANG seed, the seed-based correlations with glucose metabolism follow a reverse relationship. In contrast, the local-to-distributed correlation patterns of the LFUSI seed with glucose metabolism seem to be stronger and more spatially extended than those relative to the RANG seed. Figure 5 C shows the local-to-distributed patterns of relationships with glucose metabolism corresponding to the LFUSI seed in the LMCI cohort. Here, we observed statistically significant local effects of LFUSI Aβ, particularly in the angular gyrus and lateral middle and inferior temporal gyri. There was no statistically significant local-to-distributed effect of LFUSI amyloid on metabolism for the individual sub-populations corresponding to CN and EMCI subjects (figures not shown here). The local-to-local LFUSI seed correlations for the CN, EMCI, and LMCI cohorts were r = –0.0525 (p = 0.435), r = –0.1301 (p = 0.065), and r = –0.1884 (p = 0.011), respectively. For the case of the RANG seed, no statistically significant regions survived multiple comparisons (FDR-based thresholding) in any of the three subpopulations. The local-to-local RANG seed correlations for the CN, EMCI, and LMCI groups were r = –0.1322 (p = 0.0486), r = –0.2157 (p = 0.002), and r = –0.2757 (p < 0.001), respectively.
Fig.4
The Aβ seed-based network corresponding to (A) left fusiform gyrus (LFUSI) seed, (B) right angular gyrus (RANG) seed, and (C) composite ROI Aβ burden. High correlation values are observed around the seed locations represented by black arrows. The Aβ network relative to the LFUSI seed is weaker and less spatially extended than that of the RANG seed. D) Box-plots of the seed-based Aβ measurements for each cognitive group. For each of the three clinical cohorts, the LFUSI seed region shows lower amyloid values than the RANG seed region.
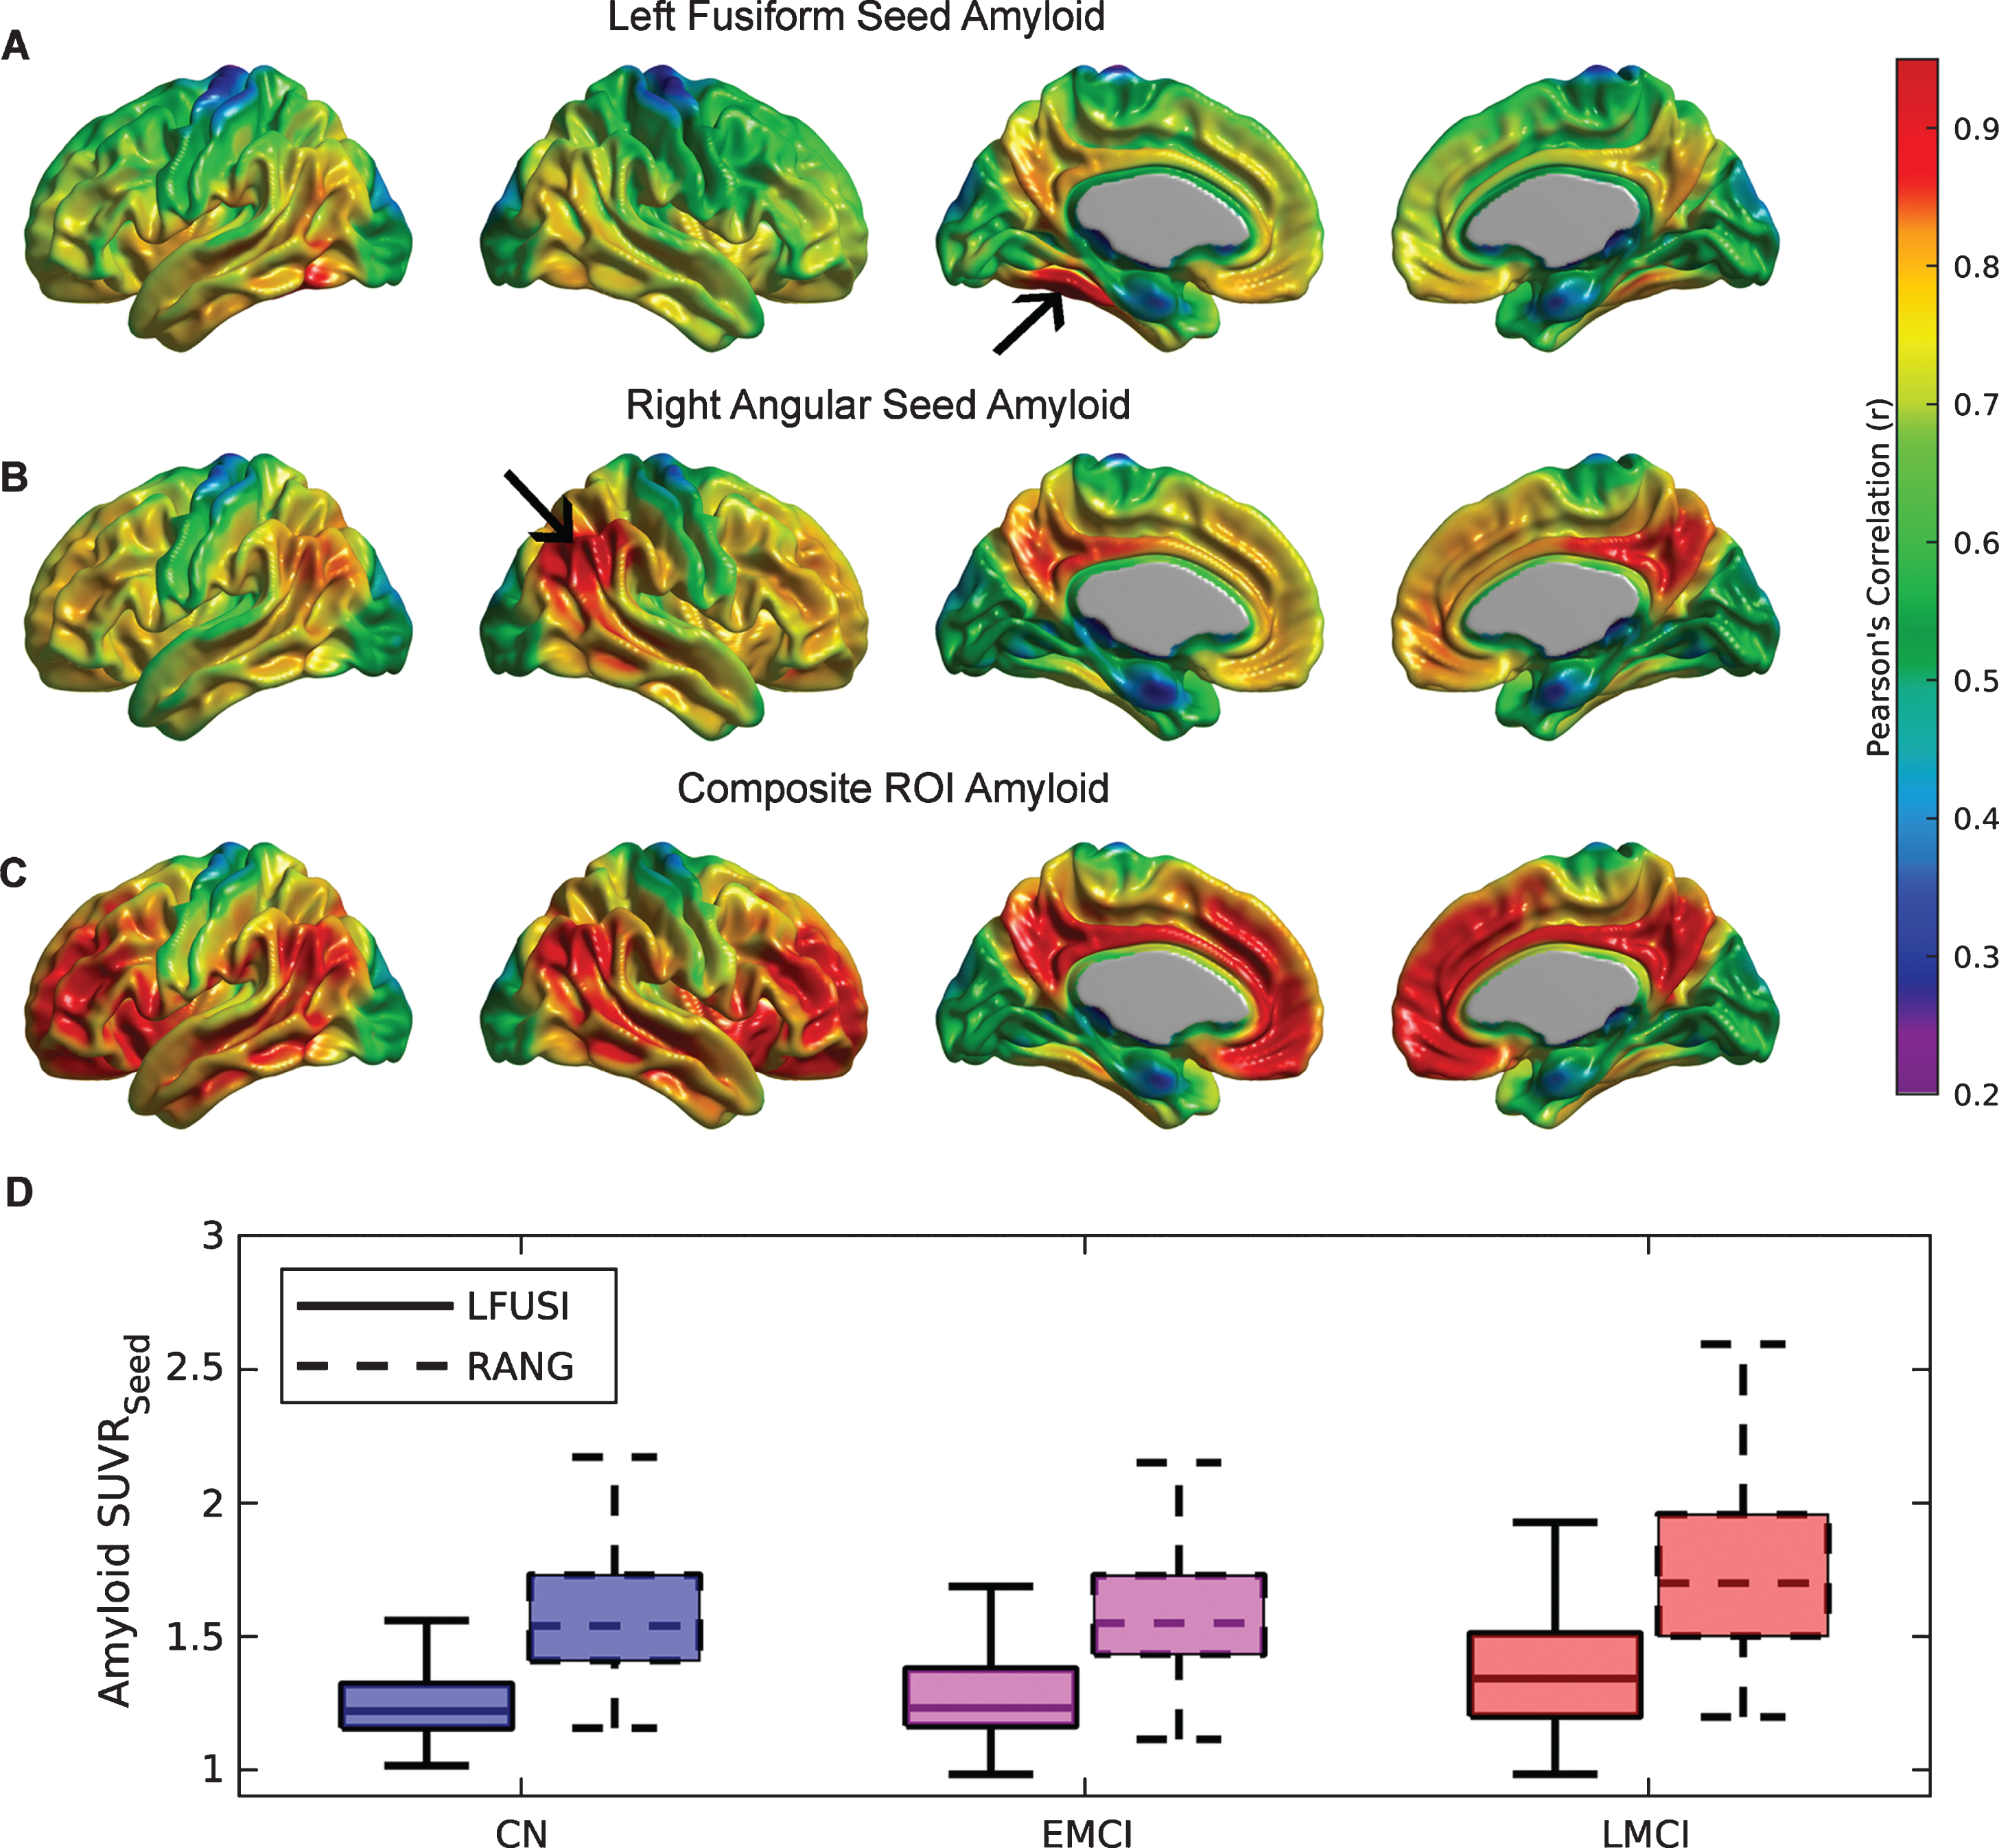
Fig.5
Statistical assessment of seed-based Aβ predictors on glucose metabolism. Cortical surface projections of FDR-thresholded statistically significant regions for the main effect of (A) LFUSI amyloid seed and (B) RANG amyloid seed on metabolism. The Aβ LFUSI seed predicts a significant reduction of glucose metabolism mainly in the inferior temporo-parietal cortex, posterior cingulate cortex, and precuneus. The Aβ RANG seed only predicts a spatially concurrent significant reduction of metabolism in the right angular gyrus itself. C) Effect of LFUSI amyloid seed in metabolism corresponding to the LMCI cohort. Significant regions essentially match those for the case of the whole sample.
DISCUSSION
In this manuscript, we have proposed a joint SVD cross-correlation and seed-based correlation analysis that allowed us to handle multi-modality interactions in a more integrative manner. We applied these techniques to a set of florbetapir and FDG PET images from a cohort of CN and MCI ADNI subjects. Our analysis highlighted a set of spatially distributed regions covering not only typical areas of high Aβ burden, but also specific areas of relative low burden (e.g., fusiform gyrus) that are related to the reduction of glucose metabolism. We then derived an SVD-based score that does not only differentiate between Aβ- and Aβ+ subjects, but also accounts for a significant relationship with glucose metabolism on those subjects showing relatively lower values of Aβ burden. Additionally, our seed-based correlation analysis showed that focal regions with relatively low Aβ burden (e.g., fusiform gyrus) may exhibit a much stronger association to distributed patterns of decreasing metabolism than other regions with higher amyloid load (e.g., angular gyrus).
It has been a common practice to express Aβ burden by a global index that represent the Aβ accumulation in regions with relatively high burden. Such practice may originate in early studies that showed strong topographical overlap between the distribution of Aβ burden and FDG hypometabolism, particularly in lateral parieto-temporal, posterior cingulate, and precuneus regions [34, 35], and more generally, within the so-called intrinsic connectivity networks (e.g., default model network) [36, 37]. Despite some more recent studies [38] having shown a mismatch between regional metabolic alterations and toxic Aβ presence, the use of a composite ROI for describing Aβ burden is still dominant in the field. In fact, studies of potential therapeutic agents designed to reduce Aβ have employed composite ROI scores as an outcome measure [39, 40]. Hence, despite the usefulness of composite ROI scores for assessment of Aβ burden progression and the development of anti-amyloid therapies, its validity for revealing interactions with other brain biomarkers (e.g., glucose metabolism, brain atrophy, brain functional connectivity) remains questionable.
In concordance with other studies [24, 38, 41], our results from the seed-based correlation analysis suggest that distributed patterns of neurodegeneration may also be related to focal AD-related pathologies in remote, “connected” brain regions with relatively low Aβ burden. Nevertheless, the actual meaning of the term “connected” in this context still needs to be fully understood. It is still not clear whether distributed patterns of reduced metabolism were mediated by either functional connectivity or by the spread of Aβ pathology following the underlying structural connectivity. Even though, and in correspondence with other studies [42], our findings point to the necessity of incorporating a more complex network perspective into the accepted temporal models [7, 43] of the amyloid cascade hypothesis [5, 6].
The relationship between Aβ accumulation, hypometabolism, and functional connectivity has been explored in several studies [9, 36, 44]. In one study [9], the authors identified a significant disruption of MRI-derived functional whole-brain connectivity in densely connected cortical regions (i.e., hubs) for amyloid-positive MCI subjects. Further, they found that increased Aβ burden was correlated with reduced whole-brain connectivity and glucose metabolism, particularly in the posterior cingulate cortex/precuneus hub region. As explained by Buckner and colleagues [36], since cortical hubs are regions of high intrinsic activity and metabolism associated with information processing, they could explain the pattern of regional vulnerability in AD. Correspondingly, our joint SVD analysis revealed a specific pattern of distributed regions (first amyloid eigenimage in Fig. 1) where Aβ burden was maximally related to a decrease in glucose metabolism. Remarkably, the areas most strongly contributing (e.g., fusiform gyri, pars opecularis, medial frontal regions, inferior temporal gyri) to that specific Aβ pattern have been all highlighted as metabolic connectivity hubs in our previous study [17]. The concept of metabolic connectivity [45] evaluates across-subjects correlations of glucose metabolism between different brain regions, which have been proven [45] to be consistent with anatomical network architecture. Therefore, the identification of metabolic connectivity hubs as the main components of the first amyloid eigenimage lends further support to the vulnerability of hub regions to Aβ accumulation and functional/metabolic disconnection.
The different spatial patterns observed in the first eigenimage corresponding to the SVD analysis across the different cognitive subpopulations (Supplementary Figure 1) are in agreement with previous studies suggesting that global fibrillar Aβ load and cerebral glucose metabolism follow spatio-temporally-divergent [10, 13, 15, 21] evolution paths across AD progression. Indeed, our analysis showed that the bilateral angular gyri are common (across the three subpopulations) regions of strong reduced metabolism as revealed by the first FDG eigenimage, while they only have strong contribution to the Aβ eigenimage in the CN group. This finding suggests that the angular gyrus is a region demonstrating a local-to-local relationship between Aβ accumulation and metabolism at preclinical and early stages of AD, while at more advanced clinical stages that relationship seems to follow a more local-to-distributed pattern with minor involvement of the inferior parietal areas. In contrast, the fusiform gyrus maintained a strong contribution to the first amyloid eigenimage across the three cognitive populations, although they appeared to be significantly related to decreasing metabolism only for the LMCI cohort.
In agreement with our previous findings [21], our present results also suggest that the statistically significant association between Aβ deposition and glucose metabolism can only be detected across a heterogeneous population of subjects representing the continuous spectrum of the AD pathology, rather than in discrete segments of the AD progression trajectories represented by homogeneous subpopulations (e.g., CN, EMCI). As shown in Figure 2, statistically significant relationship between SVD-based Aβ and metabolism could be detected only in the LMCI subpopulation, perhaps due to the heterogeneity of the Aβ scores distribution across subjects (as shown in Fig. 1D). In any case, those changes in glucose metabolism related to distributed Aβ suggest that putative anti-amyloid therapies should target individuals who are on the path to high amyloid burden like the LMCI subpopulation shown here, rather than using more homogeneous cohorts with more stable accumulation.
We also found a weak relationship between metabolism and APOE ɛ4 genotype after accounting for distributed SVD-based scores of Aβ. Our results are in agreement with those of other studies [19, 20], who reported that, in a cognitively normal, aging population, most of the APOE-related differences in hypometabolism are mediated by Aβ burden. That is, APOE ɛ4 genotype alone can be related to the reduction of glucose metabolism, particularly in AD-signature regions. However, when interacting with Aβ deposition, most of the reduction in metabolism is attributable to effect of Aβ. As pointed out by other studies [46, 47], such results should not be interpreted as APOE ɛ4 genotype and Aβ burden providing redundant information, but as having an additive impact on the reduction of glucose metabolism.
The main limitation of the current study relates to the computation of SVD-based amyloid scores. By definition, the SVD computation is a group-level technique that requires a relatively large (N > 30) sample size for producing reliable and stable eigenimages. Since we have validated our results by using a leave-one-out cross-validation technique to produce the individual SVD-based scores, one would need to produce the Aβ eigenimages from an a priori training dataset of PET images for general clinical applications. The individual SVD-based amyloid scores can be easily computed from that given “library” of eigenimages. The sample size does not seem to be a limitation here provided the availability of large datasets, such as the ADNI study. Relative to the composition of the training dataset, our results suggest that in order to detect significant relationship with metabolism, it should be composed of subjects with an expected heterogeneous amount of Aβ burden (e.g., LMCI population) ranging from low Aβ load typical of CN individuals to more clear high levels of Aβ burden that are typically observed at later stages of the AD. Since we have also showed that the effect of APOE ɛ4 seems to be mostly driven by the Aβ burden, we consider that no particular distribution of APOE ɛ4 genotype should be taken into account during the composition of the training dataset.
Conclusions
We have uncovered associations between glucose metabolism, Aβ burden, and APOE ɛ4 status in a sample of CN and MCI subjects. Our analysis revealed that the classical approach of choosing a single index of global Aβ burden is sub-optimal from the perspective of discovering more complex, multivariate relationships with glucose metabolism. By exploring the large-scale, cross-correlation between Aβ and FDG PET images with the SVD approach, our analysis revealed key findings, including: 1) glucose metabolism is not only reduced in concurrent regions showing high Aβ load, and 2) not only spatially distributed, but also focal accumulation of Aβ, can be related to metabolic dysfunction in remote regions. To our knowledge, this study is the first to relate glucose metabolism and Aβ burden from a network perspective that accounts for distributed-to-distributed and local-to-distributed patterns of cross-correlation. Future work will expand the current multivariate analysis to identify either distributed or local patterns of Aβ maximally-related (e.g., modulated) to metabolic connectivity.
ACKNOWLEDGMENTS
Data collection and sharing for this project was funded by the Alzheimer’s Disease Neuroimaging Initiative (ADNI) (National Institutes of Health Grant U01 AG024904) and DOD ADNI (Department of Defense award number W81XWH-12-2-0012). ADNI is funded by the National Institute on Aging, the National Institute of Biomedical Imaging and Bioengineering, and through generous contributions from the following: AbbVie, Alzheimer’s Association; Alzheimer’s Drug Discovery Foundation; Araclon Biotech; BioClinica, Inc.; Biogen; Bristol-Myers Squibb Company; CereSpir, Inc.; Cogstate; Eisai Inc.; Elan Pharmaceuticals, Inc.; Eli Lilly and Company; EuroImmun; F. Hoffmann-La Roche Ltd and its affiliated company Genentech, Inc.; Fujirebio; GE Healthcare; IXICO Ltd.; Janssen Alzheimer Immunotherapy Research & Development, LLC.; Johnson & Johnson Pharmaceutical Research & Development LLC.; Lumosity; Lundbeck; Merck & Co., Inc.; Meso Scale Diagnostics, LLC.; NeuroRx Research; Neurotrack Technologies; Novartis Pharmaceuticals Corporation; Pfizer Inc.; Piramal Imaging; Servier; Takeda Pharmaceutical Company; and Transition Therapeutics. The Canadian Institutes of Health Research is providing funds to support ADNI clinical sites in Canada. Private sector contributions are facilitated by the Foundation for the National Institutes of Health (www.fnih.org). The grantee organization is the Northern California Institute for Research and Education, and the study is coordinated by the Alzheimer’s Therapeutic Research Institute at the University of Southern California. ADNI data are disseminated by the Laboratory for Neuro Imaging at the University of Southern California.
Authors’ disclosures available online (https://www.j-alz.com/manuscript-disclosures/19-0560r2).
SUPPLEMENTARY MATERIAL
[1] The supplementary material is available in the electronic version of this article: https://dx.doi.org/10.3233/JAD-190560.
REFERENCES
[1] | Minoshima S , Giordani B , Berent S , Frey KA , Foster NL , Kuhl DE ((1997) ) Metabolic reduction in the posterior cingulate cortex in very early Alzheimer’s disease. Ann Neurol 42: , 85–94. |
[2] | Silverman DH , Small GW , Chang CY , Lu CS , Kung De Aburto MA , Chen W , Czernin J , Rapoport SI , Pietrini P , Alexander GE , Schapiro MB , Jagust WJ , Hoffman JM , Welsh-Bohmer KA , Alavi A , Clark CM , Salmon E , de Leon MJ , Mielke R , Cummings JL , Kowell AP , Gambhir SS , Hoh CK , Phelps ME ((2001) ) Positron emission tomography in evaluation of dementia: Regional brain metabolism and long-term outcome. JAMA 286: , 2120–2127. |
[3] | Klunk WE , Engler H , Nordberg A , Wang Y , Blomqvist G , Holt DP , Bergström M , Savitcheva I , Huang GF , Estrada S , Ausén B , Debnath ML , Barletta J , Price JC , Sandell J , Lopresti BJ , Wall A , Koivisto P , Antoni G , Mathis CA , Långström B ((2004) ) Imaging brain amyloid in Alzheimer’s disease with Pittsburgh Compound-B. Ann Neurol 55: , 306–319. |
[4] | Mosconi L ((2005) ) Brain glucose metabolism in the early and specific diagnosis of Alzheimer’s disease. FDG-PET studies in MCI and AD. Eur J Nucl Med Mol Imaging 32: , 486–510. |
[5] | Hardy JA , Higgins GA ((1992) ) Alzheimer’s disease: The amyloid cascade hypothesis. Science 256: , 184–185. |
[6] | Hardy JA , Selkoe DJ ((2002) ) The amyloid hypothesis of Alzheimer’s disease: Progress and problems on the road to therapeutics. Science 297: , 353–356. |
[7] | Jack CR , Knopman DS , Jagust WJ , Shaw LM , Aisen PS , Weiner MW , Petersen RC , Trojanowski JQ ((2010) ) Hypothetical model of dynamic biomarkers of the Alzheimer’s pathological cascade. Lancet Neurol 9: , 119–128. |
[8] | Mega M , Chu T , Mazziotta J , Trivedi K , Thompson P , Shah A , Cole G , Frautschy S , Toga A ((1999) ) Mapping biochemistry to metabolism: FDG-PET and amyloid burden in Alzheimer’s disease. Neuroreport 10: , 2911–2917. |
[9] | Drzezga A , Becker JA , Van Dijk KRA , Sreenivasan A , Talukdar T , Sullivan C , Schultz AP , Sepulcre J , Putcha D , Greve D , Johnson KA , Sperling RA ((2011) ) Neuronal dysfunction and disconnection of cortical hubs in non-demented subjects with elevated amyloid burden. Brain 134: , 1635–1646. |
[10] | Jack CR , Wiste HJ , Weigand SD , Knopman DS , Lowe V , Vemuri P , Mielke MM , Jones DT , Senjem ML , Gunter JL , Gregg BE , Pankratz VS , Petersen RC ((2013) ) Amyloid-first and neurodegeneration-first profiles characterize incident amyloid PET positivity. Neurology 81: , 1732–1740. |
[11] | Lehmann M , Ghosh PM , Madison C , Laforce R , Corbetta-Rastelli C , Weiner MW , Greicius MD , Seeley WW , Gorno-Tempini ML , Rosen HJ , Miller BL , Jagust WJ , Rabinovici GD ((2013) ) Diverging patterns of amyloid deposition and hypometabolism in clinical variants of probable Alzheimer’s disease. Brain 136: , 844–858. |
[12] | Jack CR , Holtzman DM ((2013) ) Biomarker modeling of Alzheimer’s disease. Neuron 80: , 1347–1358. |
[13] | Perani D ((2014) ) FDG-PET and amyloid-PET imaging: The diverging paths. Curr Opin Neurol 27: , 405–413. |
[14] | Reiman EM , Chen K , Alexander GE , Caselli RJ , Bandy D , Osborne D , Saunders AM , Hardy J ((2004) ) Functional brain abnormalities in young adults at genetic risk for late-onset Alzheimer’s dementia. Proc Natl Acad Sci U S A 101: , 284–289. |
[15] | Kadir A , Almkvist O , Forsberg A , Wall A , Engler H , Langstrom B , Nordberg A ((2012) ) Dynamic changes in PET amyloid and FDG imaging at different stages of Alzheimer’s disease. Neurobiol Aging 33: , 198.e1–198.e14. |
[16] | Jagust WJ , Landau SM ((2012) ) Apolipoprotein E, not fibrillar beta-amyloid, reduces cerebral glucose metabolism in normal aging. J Neurosci 32: , 18227–18233. |
[17] | Carbonell F , Charil A , Zijdenbos AP , Evans AC , Bedell BJ ((2014) ) β-Amyloid is associated with aberrant metabolic connectivity in subjects with mild cognitive impairment. J Cereb Blood Flow Metab 34: , 1169–1179. |
[18] | Knopman DS , Jack CR , Wiste HJ , Weigand SD , Vemuri P , Lowe VJ , Kantarci K , Gunter JL , Senjem ML , Mielke MM , Roberts RO , Boeve BF , Petersen RC ((2013) ) Brain injury biomarkers are not dependent on beta-amyloid in normal elderly. Ann Neurol 73: , 472–480. |
[19] | Yi D , Lee DY , Sohn BK , Choe YM , Seo EH , Byun MS , Woo JI ((2014) ) Beta-amyloid associated differential effects of APOE ɛ4 on brain metabolism in cognitively normal elderly. Am J Geriatr Psychiatry 22: , 961–970. |
[20] | Lowe VJ , Weigand SD , Senjem ML , Vemuri P , Jordan L , Kantarci K , Boeve B , Jack CR , Knopman D , Petersen RC ((2014) ) Association of hypometabolism and amyloid levels in aging, normal subjects. Neurology 82: , 1–9. |
[21] | Carbonell F , Zijdenbos AP , McLaren DG , Iturria-Medina Y , Bedell BJ ((2016) ) Modulation of glucose metabolism and metabolic connectivity by beta-amyloid. J Cereb Blood Flow Metab 36: , 2058–2071. |
[22] | Altmann A , Ng B , Landau SM , Jagust WJ , Greicius MD ((2015) ) Regional brain hypometabolism is unrelated to regional amyloid plaque burden. Brain 138: , 1–13. |
[23] | La Joie R , Perrotin A , Barré L , Hommet C , Mezenge F , Ibazizene M , Camus V , Abbas A , Landeau B , Guilloteau D , de La Sayette V , Eustache F , Desgranges B , Chételat G ((2012) ) Region-specific hierarchy between atrophy, hypometabolism, and β-amyloid (Aβ) load in Alzheimer’s disease dementia. J Neurosci 32: , 16265–16273. |
[24] | Laforce R , Tosun D , Ghosh P , Lehmann M , Madison CM , Weiner MW , Miller BL , Jagust WJ , Rabinovici GD ((2014) ) Parallel ICA of FDG-PET and PiB-PET in three conditions with underlying Alzheimer’s pathology. Neuroimage Clin 4: , 508–516. |
[25] | Worsley KJ , Chen J-I , Lerch J , Evans AC ((2005) ) Comparing functional connectivity via thresholding correlations and singular value decomposition. Philos Trans R Soc Lond B Biol Sci 360: , 913–920. |
[26] | Friston KJ , Frith CD , Liddle PF , Frackowiak RSJ ((1993) ) Functional connectivity – the principal-component analysis of large (PET) data sets. J Cereb Blood Flow Metab 13: , 5–14. |
[27] | McIntosh AR , Lobaugh NJ ((2004) ) Partial least squares analysis of neuroimaging data: Applications and advances. Neuroimage 23: (Suppl 1), S250–S263. |
[28] | Sled JG , Zijdenbos AP , Evans AC ((1998) ) A nonparametric method for automatic correction of intensity nonuniformity in MRI data. IEEE Trans Med Imaging 17: , 87–97. |
[29] | Zijdenbos AP , Forghani R , Evans AC ((2002) ) Automatic “pipeline” analysis of 3-D MRI data for clinical trials: Application to multiple sclerosis. IEEE Trans Med Imaging 21: , 1280–1291. |
[30] | Tohka J , Zijdenbos AP , Evans AC ((2004) ) Fast and robust parameter estimation for statistical partial volume models in brain MRI. Neuroimage 23: , 84–97. |
[31] | Joshi A , Koeppe RA , Fessler JA ((2009) ) Reducing between scanner differences in multi-center PET studies. Neuroimage 46: , 154–159. |
[32] | Oakes TR , Fox AS , Johnstone T , Chung MK , Kalin N , Davidson RJ ((2007) ) Integrating VBM into the General Linear Model with voxelwise anatomical covariates. Neuroimage 34: , 500–508. |
[33] | Genovese CR , Lazar NA , Nichols T ((2002) ) Thresholding of statistical maps in functional neuroimaging using the false discovery rate. Neuroimage 15: , 870–878. |
[34] | Devanand DP , Mikhno A , Pelton GH , Cuasay K , Pradhaban G , Dileep Kumar JS , Upton N , Lai R , Gunn RN , Libri V , Liu X , van Heertum R , Mann JJ , Parsey R V ((2010) ) Pittsburgh compound B (11C-PIB) and fluorodeoxyglucose (18 F-FDG) PET in patients with Alzheimer disease, mild cognitive impairment, and healthy controls. J Geriatr Psychiatry Neurol 23: , 185–198. |
[35] | Förster S , Grimmer T , Miederer I , Henriksen G , Yousefi BH , Graner P , Wester HJ , Förstl H , Kurz A , Dickerson BC , Bartenstein P , Drzezga A ((2012) ) Regional expansion of hypometabolism in Alzheimer’s disease follows amyloid deposition with temporal delay. Biol Psychiatry 71: , 792–797. |
[36] | Buckner RL , Sepulcre J , Talukdar T , Krienen FM , Liu H , Hedden T , Andrews-Hanna JR , Sperling RA , Johnson KA ((2009) ) Cortical hubs revealed by intrinsic functional connectivity: Mapping, assessment of stability, and relation to Alzheimer’s disease. J Neurosci 29: , 1860–1873. |
[37] | Buckner R ((2005) ) Molecular, structural, and functional characterization of Alzheimer’s disease: Evidence for a relationship between default activity, amyloid, and memory. J Neurosci 25: , 7709–7717. |
[38] | Klupp E , Förster S , Grimmer T , Tahmasian M , Yakushev I , Sorg C , Yousefi BH , Drzezga A ((2014) ) In Alzheimer’s disease, hypometabolism in low-amyloid brain regions may be a functional consequence of pathologies in connected brain regions. Brain Connect 4: , 371–383. |
[39] | Doody RS , Thomas RG , Farlow M , Iwatsubo T , Vellas B , Joffe S , Kieburtz K , Raman R , Sun X , Aisen PS , Siemers E , Liu-Seifert H , Mohs R ((2014) ) Phase 3 trials of solanezumab for mild-to-moderate Alzheimer’s disease. N Engl J Med 370: , 311–321. |
[40] | Sevigny J , Chiao P , Bussière T , Weinreb PH , Williams L , Maier M , Dunstan R , Salloway S , Chen T , Ling Y , O’Gorman J , Qian F , Arastu M , Li M , Chollate S , Brennan MS , Quintero-Monzon O , Scannevin RH , Arnold HM , Engber T , Rhodes K , Ferrero J , Hang Y , Mikulskis A , Grimm J , Hock C , Nitsch RM , Sandrock A ((2016) ) The antibody aducanumab reduces Aβ plaques in Alzheimer’s disease. Nature 537: , 50–56. |
[41] | Bourgeat P , Chételat G , Villemagne VL , Fripp J , Raniga P , Pike K , Acosta O , Szoeke C , Ourselin S , Ames D , Ellis KA , Martins RN , Masters CL , Rowe CC , Salvado O , Group AR ((2010) ) Beta-amyloid burden in the temporal neocortex is related to hippocampal atrophy in elderly subjects without dementia. Neurology 74: , 121–127. |
[42] | Jones DT , Knopman DS , Gunter JL , Graff-Radford J , Vemuri P , Boeve BF , Petersen RC , Weiner MW , Jack CR ((2016) ) Cascading network failure across the Alzheimer’s disease spectrum. Brain 139: , 547–562. |
[43] | Jack CR , Knopman DS , Jagust WJ , Petersen RC , Weiner MW , Aisen PS , Shaw LM , Vemuri P , Wiste HJ , Weigand SD , Lesnick TG , Pankratz VS , Donohue MC , Trojanowski JQ ((2013) ) Tracking pathophysiological processes in Alzheimer’s disease: An updated hypothetical model of dynamic biomarkers. Lancet Neurol 12: , 207–216. |
[44] | Sheline YI , Raichle ME , Snyder AZ , Morris JC , Head D , Wang S , Mintun MA ((2010) ) Amyloid plaques disrupt resting state default mode network connectivity in cognitively normal elderly. Biol Psychiatry 67: , 584–587. |
[45] | Horwitz B , Grady CL , Schlageter NL , Duara R , Rapoport SI ((1987) ) Intercorrelations of regional cerebral glucose metabolic rates in Alzheimer’s disease. Brain Res 407: , 294–306. |
[46] | Mormino EC , Betensky RA , Hedden T , Schultz AP , Ward A , Huijbers W , Rentz DM , Johnson KA , Sperling RA ((2014) ) Amyloid and APOE ɛ4 interact to influence short-term decline in preclinical Alzheimer disease. Neurology 82: , 1760–1767. |
[47] | Knopman DS , Jack CR , Wiste HJ , Lundt ES , Weigand SD , Vemuri P , Lowe VJ , Kantarci K , Gunter JL , Senjem ML , Mielke MM , Roberts RO , Boeve BF , Petersen RC ((2014) ) 18F-fluorodeoxyglucose positron emission tomography, aging, and apolipoprotein E genotype in cognitively normal persons. Neurobiol Aging 35: , 2096–2106. |


