
Global Metabolic Shifts in Age and Alzheimer’s Disease Mouse Brains Pivot at NAD+/NADH Redox Sites
Abstract
Age and Alzheimer’s disease (AD) share some common features such as cognitive impairments, memory loss, metabolic disturbances, bioenergetic deficits, and inflammation. Yet little is known on how systematic shifts in metabolic networks depend on age and AD. In this work, we investigated the global metabolomic alterations in non-transgenic (NTg) and triple-transgenic (3xTg-AD) mouse brain hippocampus as a function of age by using untargeted Ultrahigh Performance Liquid Chromatography-tandem Mass Spectroscopy (UPLC-MS/MS). We observed common metabolic patterns with aging in both NTg and 3xTg-AD brains involved in energy-generating pathways, fatty acids oxidation, glutamate, and sphingolipid metabolism. We found age-related downregulation of metabolites from reactions in glycolysis that consumed ATP and in the TCA cycle, especially at NAD+/NADH-dependent redox sites, where age- and AD-associated limitations in the free NADH may alter reactions. Conversely, metabolites increased in glycolytic reactions in which ATP is produced. With age, inputs to the TCA cycle were increased including fatty acid β-oxidation and glutamine. Overall age- and AD-related changes were > 2-fold when comparing the declines of upstream metabolites of NAD+/NADH-dependent reactions to the increases of downstream metabolites (p = 10-5, n = 8 redox reactions). Inflammatory metabolites such as ceramides and sphingosine-1-phosphate also increased with age. Age-related decreases in glutamate, GABA, and sphingolipid were seen which worsened with AD genetic load in 3xTg-AD brains, possibly contributing to synaptic, learning- and memory-related deficits. The data support the novel hypothesis that age- and AD-associated metabolic shifts respond to NAD(P)+/NAD(P)H redox-dependent reactions, which may contribute to decreased energetic capacity.
INTRODUCTION
Alzheimer’s disease (AD) is a neurodegenerative disease characterized by extracellular amyloid-β (Aβ) plaque accumulation, intracellular neurofibrillary tangles, metabolic disturbances [1], oxidative stress [2], inflammation [3], autophagic [4] and bioenergetic deficits [5, 6]. Despite abundant associations, based on clinical trials, it is unclear which of these are primal. AD affected an estimated 5.7 million in America in 2016 and is projected to grow to 13.8 million by 2050 [7]. Age is the greatest risk factor for neurodegenerative AD. Aging and AD share some common features including neurodegeneration [8], metabolic deficits [9– 11], bioenergetic deficits [12], and inflammation [13]. According to the epigenetic oxidative redox shift theory of aging, age- and AD-associated sedentary lifestyle promote oxidative shifts upstream of reactive oxygen species (ROS) to initiate a vicious cycle of oxidized membrane receptors, signaling molecules, transcription factors, and epigenetic transcriptional regulators, which further impose a metabolic shift away from the mitochondrial energy supply [14].
“Omics” technologies including genome [15], epigenome [16], transcriptome [17], proteome [18, 19], and metabolome [20] studies of mice and human have examined age- and AD-associated changes in gene and protein expression [21, 22]. Metabolome studies integrate the effects of expression of the genome, epigenome, transcriptome, proteome, and post-translational modulation of activity by the exposome to provide a downstream snap shot of regulatory signaling networks [23]. An age-associated sedentary low-energy state is implicated in AD morbidity and is coincident with observations of metabolic shifts and decline in glucose uptake with age [11, 24– 26]. AD-associated metabolic perturbation was reported in tryptophan, tyrosine, methionine, purine in cerebrospinal fluid (CSF) of AD patients (n = 40) [27], ceramides and sphingomyelins in plasma of 26 AD patients [28] relative to age-matched controls. Significant metabolic disturbances in transgenic APP/PS1 AD mouse model include essential amino acids, branched-chain amino acids, neurotransmitter serotonin, phospholipid, and acylcarnitine [29]. Additionally, changes in energy metabolism result in metabolic shifts in different regions of aging mouse brains [30, 31]. We specifically studied metabolic shifts in hippocampal regions of different ages which are implicated in impaired episodic memory, short- and long-term memory, spatial memory, and navigation. Gene expression in 129/C57BL/6 mouse brains revealed that from 6 to 9 months, almost two-thirds of the genes relative to energy and amyloid metabolism were downregulated, whereas in the age-matched male brains, only 5% genes were altered [32]. In our work, we extended the studies to global metabolism gender-differences across the age-span in the hippocampus. Further, since aging increases the risk for AD incidence, whether the normal age and AD share some common shifts or signatures in metabolic profiles and patterns in brains and if so, which pathways are most affected are poorly understood. Moreover, correlations of metabolic shifts in old age of hippocampal brains relative to the AD model brains at the sites of redox bioenergetics were examined to strengthen the redox hypothesis of aging.
Interest in metabolic alterations in AD is anchored by reduced glucose uptake in AD patients. A study of 20 patients with early-onset dementia of Alzheimer type (DAT) revealed a 50% reduced metabolic rate of glucose uptake in the brain and significant elevation of lactate compared to non-demented subjects [33]. At the end of glycolysis (stage II), pyruvate is either oxidized to acetyl-CoA for entry into the TCA cycle or reduced to lactate, dependent on the redox status of nicotinamide adenine dinucleotide oxidized/reduced forms (NAD+/NADH). Since this redox state becomes more oxidized and the NADH pool declines with age and in AD transgenic mice [34, 35], we further explored how these age- and AD-related oxidative shifts in NADH affected metabolic networks, especially NAD+/NADH-dependent substrates in glycolysis and NADH production in the TCA cycle. Lactate serves as an alternative energy supply for neurons during hypoglycemia [36] and it also functions as a neuroprotective metabolite [37] via transcriptional activation of brain-derived neurotrophic factor expression [38]. In addition to lactate, Ding et al. [24] demonstrated the utilization of ketone bodies as an alternative energy supply during early glucose insufficiency in mouse brain. Yao et al. [39] proposed that during an energetic crisis, a compensatory metabolic shift from glycolysis to ketogenic/fatty acid oxidation caused white matter degradation. Here, we compared the age-related shifts of metabolomic profiles in both NTg and triple-transgenic (3xTg-AD) mouse brain hippocampus of both sexes by using ultrahigh performance liquid chromatography-tandem mass spectroscopy (UPLC-MS/MS). We observed major age and AD-associated shifts of metabolic patterns linked to energy production and NADPH antioxidant intermediates in the pentose phosphate pathway (PPP), fatty acid metabolism, glutamine and sphingolipid metabolism. The prospect of correlating age- and AD- related shifts in metabolic profiles with impaired brain energy and antioxidant defense offers a novel way to study the mechanism of AD, diagnose early stages of AD among aged population with possible prognostic implications.
MATERIALS AND METHODS
Mouse model
We used LaFerla’s triple transgenic mouse model of AD (3xTg-AD) with human transgenes AβPP (SWE), PS1 (M146V), and Tau (P301L) driven by the Thy1.2 promoter to mimic the neuropathological features of AD [40]. Non-transgenic (NTg) C57BL/6 mice (Charles River, San Diego) were used as controls. In each genotype and each gender, five young (1– 3 month), five middle (8– 14 month), and five old (18– 23 month) ages of mice were used. All mice underwent genotyping before use in experiments. All experiments involving animals were approved by the Institutional Animal Care and Use Committee (AUP-17-65) and performed according to NIH guidelines and regulations.
Hippocampal tissue collection
Mice were anesthetized by isoflurane vapor with subsequent collection of whole brains. Hippocampi and overlaying entorhinal cortex were isolated, followed by immediate flash freezing in liquid nitrogen for 1 min (n = 5 mice /age/genotype/gender). All samples were stored at – 80°C until shipping to Metabolon (Durham, NC, USA) on dry ice for metabolomics analysis. Samples were randomized and coded for blinding in the repeated ages and genotypes.
Sample preparation
Samples were prepared using the automated MicroLab STAR system from Hamilton Company. Several recovery standards were added before tissue extraction for quality control (QC). Proteins in the samples were precipitated with methanol under vigorous shaking for 2 min (Glen Mills GenoGrinder 2000) followed by centrifugation. The resulting extract was divided into five aliquots: two for analysis by two separate reverse-phase (RP)/UPLC-MS/MS methods with positive ion mode electrospray (ESI), one with negative ion mode ESI, one for analysis by HILIC/UPLC-MS/MS with negative ion mode ESI, and one sample was stored for backup. Samples were placed briefly on a TurboVap (Zymark) to remove the organic solvent. Sample extracts were stored overnight under nitrogen before preparation for analysis.
Quality control (QC)
Several types of controls were analyzed in concert with the experimental samples: 1) pooled matrix sample generated by taking a small volume of each experimental sample, serving as a technical replicate; 2) extracted water sample as process blanks; 3) a cocktail of QC standards that were carefully chosen not to interfere with the measurement of endogenous compounds were spiked into each analyzed sample to monitor instrumental performance and aided chromatographic alignment. Instrument variability was determined by calculating the median relative standard deviation (RSD) for the standards that were added to each sample before injection into the mass spec machine. Overall process variability was determined by calculating the median RSD for all endogenous metabolites present in 100% of the pooled matrix samples. The median RSD of instrument variability and total process variability was 4% and 11% respectively. Experimental samples were randomized across the platform run with QC samples spaced evenly among the injections.
Ultrahigh performance liquid chromatography-tandem mass spectroscopy (UPLC-MS/MS)
All methods utilized a Waters ACQUITY ultra-performance liquid chromatography (UPLC) and a Thermo Scientific Q-Exactive high resolution/accurate mass spectrometer interfaced with a heated electrospray ionization (HESI-II) source and Orbitrap mass analyzer operated at 35,000 mass resolution. The sample extract was dried followed by reconstitution in solvents compatible to each of the four methods. Each reconstitution solvent contained a series of standards at fixed concentrations to ensure injection and chromatographic consistency. For hydrophilic compounds analyzed using acidic positive ion condition, the extract was gradient eluted from a C18 column (Water UPLC BEH C18-2.1×100 mm, 1.7μm) using water and methanol, containing 0.05% perfluoropentanoic acid (PFPA) and 0.1% formic acid (FA). For hydrophobic compounds analyzed using acidic positive ion conditions, the extract was gradient eluted from the same C18 column using methanol, acetonitrile, water, 0.05% PFPA and 0.01% FA. Another aliquot was analyzed using a basic negative ion optimized condition and a separate dedicated C18 column. The basic extracts were gradient eluted form the column using methanol and water, with 6.5 mM ammonium bicarbonate at pH 8. The fourth aliquot was analyzed via negative ionization following elution from a HILIC column (Waters UPLC BEH Amide 2.1×150 mm, 1.7μm) with a gradient of water and acetonitrile with 10 mM ammonium formate, pH 10.8. The scan range covered 70– 1000 m/z.
Compound identification, quantification
Compounds were identified by comparison to library entries of purified standards or recurrent unknown entities. Biochemical identifications are based on three criteria: retention index within a narrow RI window of the proposed identification, accurate mass match to the library ± 10 ppm, and the MS/MS forward and reverse score between the experimental data and authentic standards.
Metabolite quantification and data normalization
Peaks were quantified using area-under-the-curve. Each compound was corrected in run-day blocks by registering the median to equal one (1.00) and normalizing each data point proportionately across all age, sex and genotype groups. This allowed determination of relative changes with age, sex, and genotype as scaled relative intensities for each metabolite.
Statistical analysis
Following log transformation and imputation of missing values, if any, with the minimum observed value for each compound, ANOVA contrasts were used to identify biochemicals that differed significantly between experimental groups. Two-way and three-way ANOVAs were used to identify biochemicals of significant interaction and main effects for experimental parameters of genotype, age and gender. A hierarchical clustering method was applied to the fatty acids with calculation of Euclidian distances and clustering by complete-linkage method in R statistical software.
RESULTS
Overview of global metabolic shifts in aging and AD mouse brains
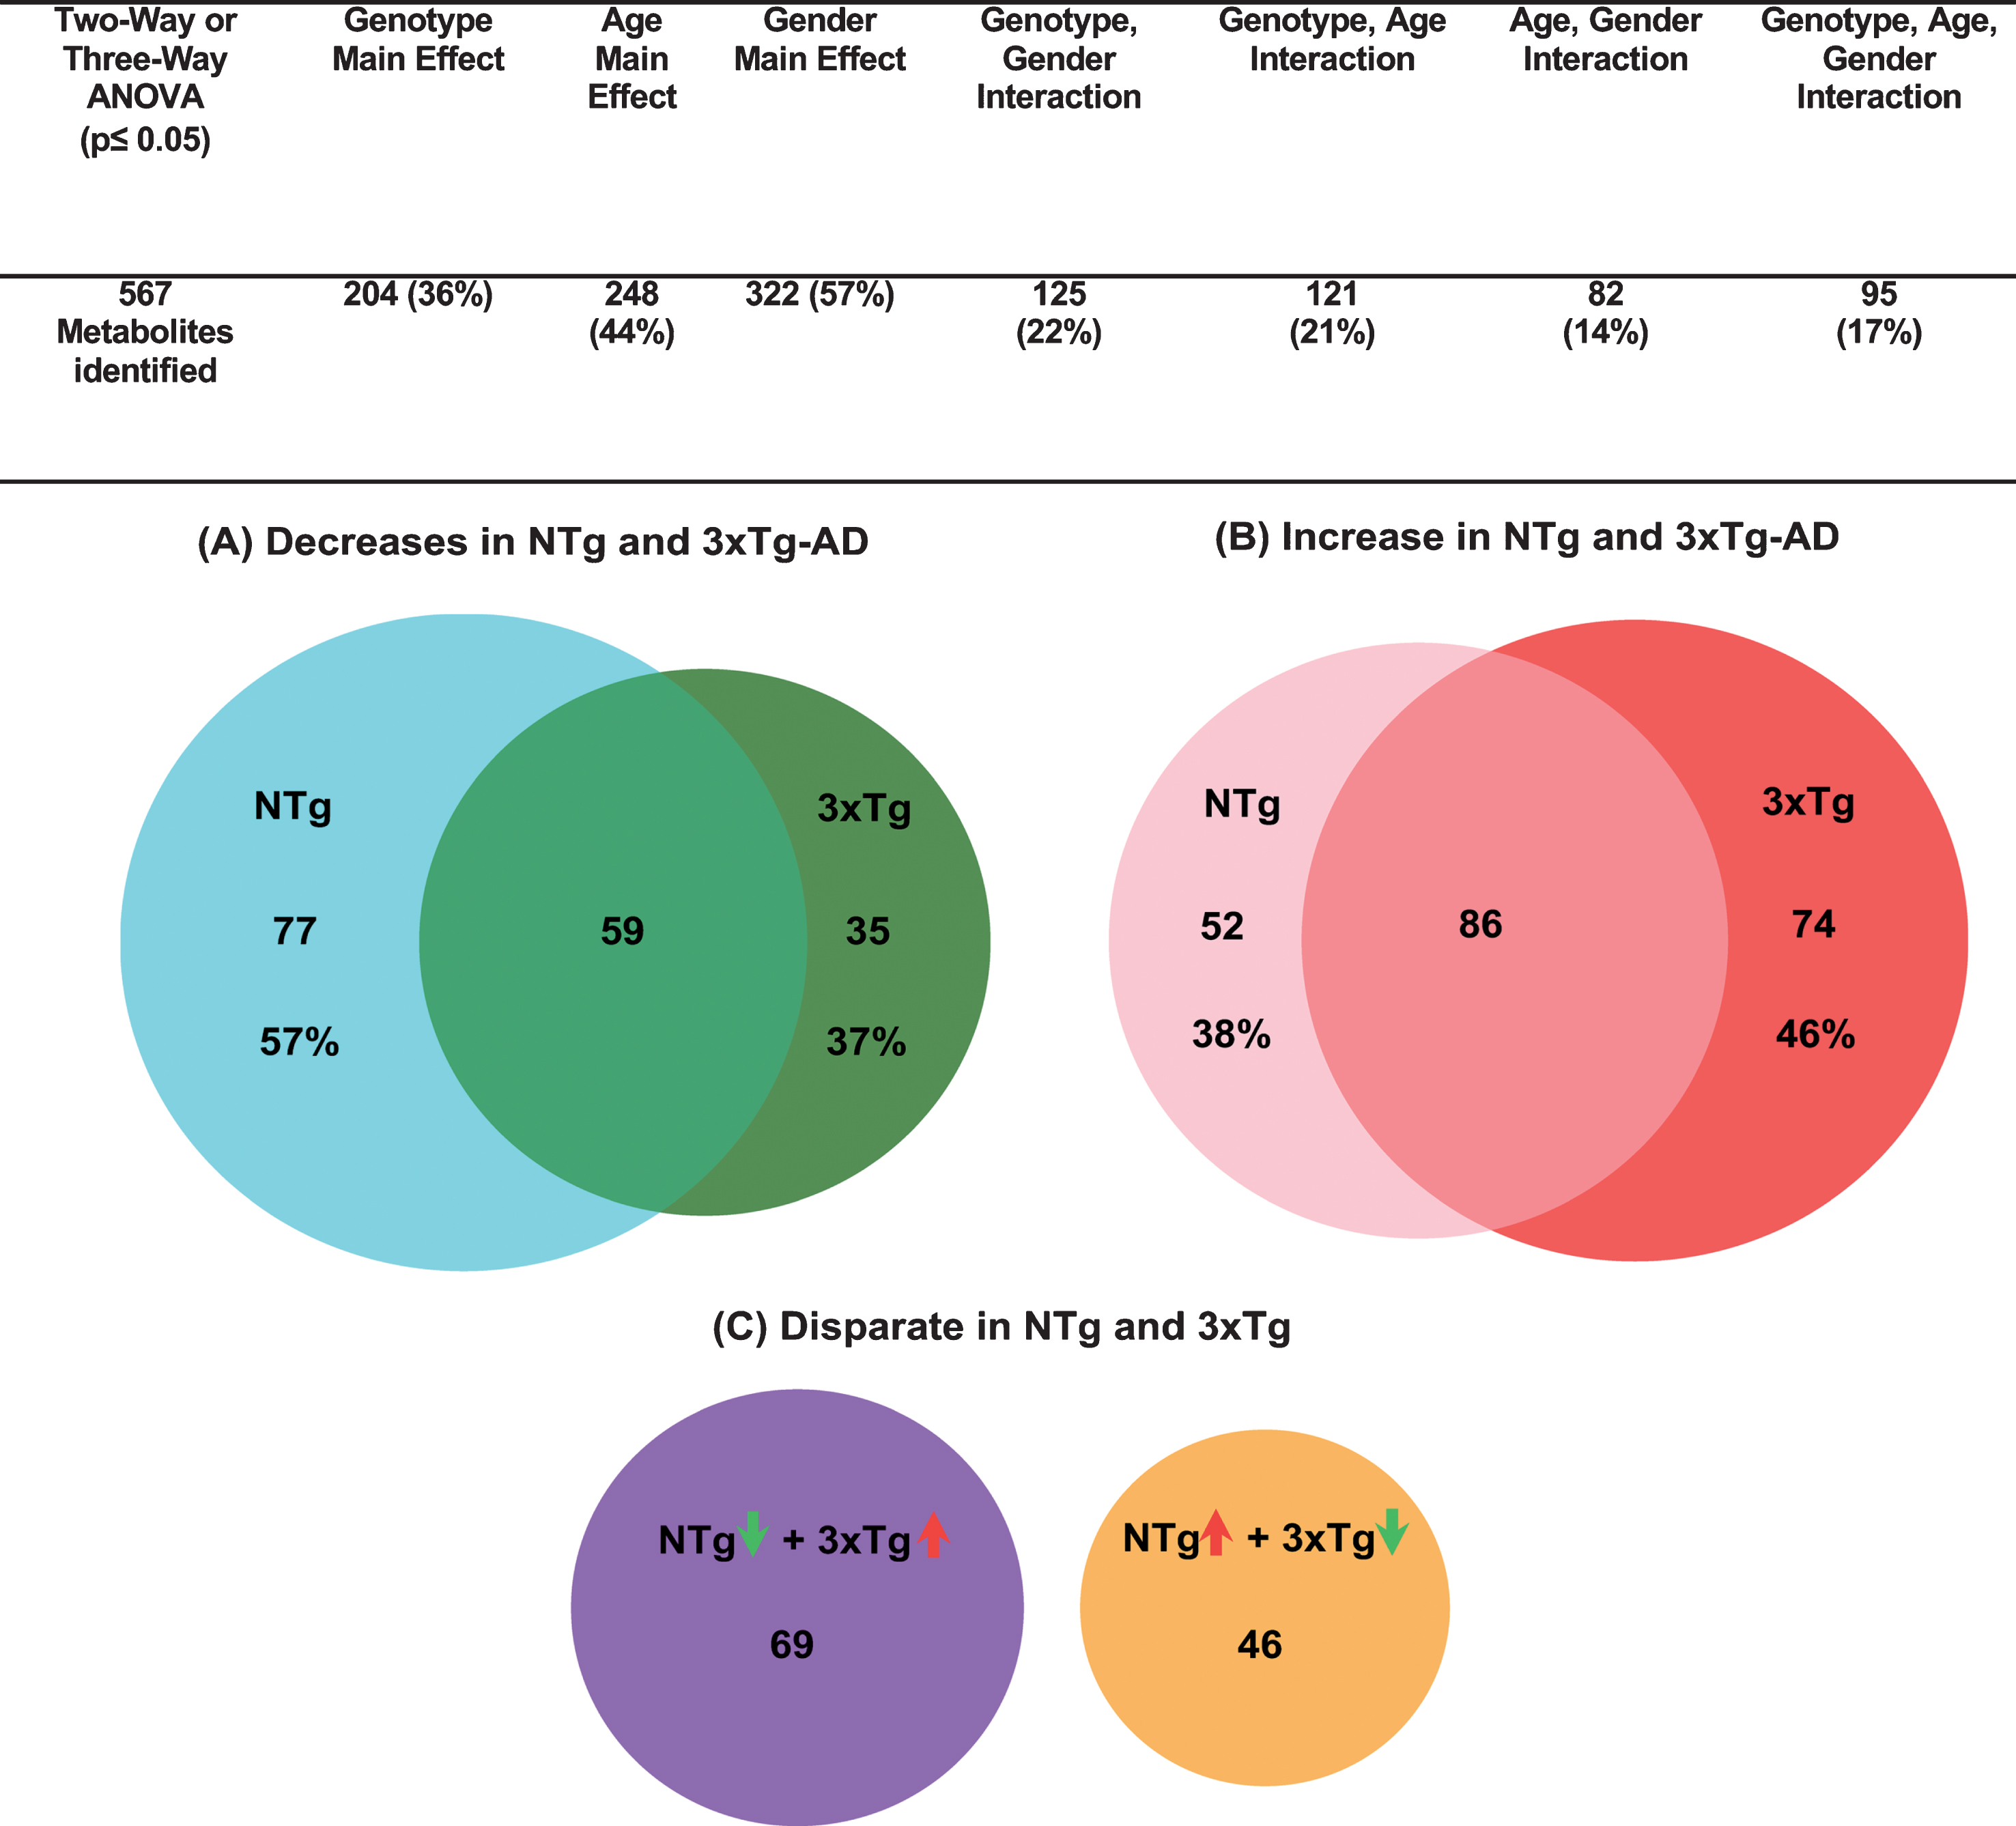
We determined the age and AD-associated shifts in brain metabolomics by unbiased untargeted UPLC/MS/MS. By methanol extraction of freshly isolated mouse hippocampus with overlying cortex (hereafter hippocampus) from NTg and 3xTg-AD mice of young, middle and old ages, we were able to detect and identify 567 metabolites including amino acids, peptides, carbohydrates, energic intermediates and lipids from a wide range of pathways (Supplementary Table 1). Significance of changes in metabolites by age, genotype and gender effects by ANOVA as well as fold change are listed in Supplementary Table 2). Figure 1 summarizes those metabolites altered by genotype and age or additionally by gender. Notably, a large 44% of the detected metabolites were affected by age and 57% by gender. Additionally, 36% differed by genotype. 21% of the metabolites showed an interaction of genotype and age. To explore how much age contributes to the metabolic shifts in AD, we grouped metabolites into three categories: both genotypes decreased with age, increased or were discordant as presented in Venn diagrams (female and male combined) (Fig. 1). Each circle area is proportional to the total number of metabolites. The overlapped area in Fig. 1A indicates proportions of downregulated metabolites in both old age and AD, accounting for 43% of the NTg and 63% of the 3xTg-AD metabolites. Similarly, Fig. 1B shows the common upregulated metabolites in both normal old age and 3xTg-AD mouse brains, constituting 62% and 54%, respectively. This high level of coordinate responses in either downregulation or upregulation (50– 60%) suggests age and AD share common patterns of metabolic shifts. Additionally, this may indicate old age metabolism increases the risk for AD incidence. Discordant metabolites shifted in opposite directions with age in NTg and 3xTg-AD samples were just 20% of the total (p < 0.05, genders combined, Fig. 1C). Among these disparate metabolites, 60% of the metabolites decreased in NTg but increased in 3xTg-AD samples with age (purple circle, Fig. 1C). 40% of the metabolites were enhanced in NTg old age but lowered in 3xTg-AD samples (orange circle, Fig. 1C). These disparate metabolites distinguished normal aging from AD, and therefore indicates specific metabolic features involved in the AD genotype.
Fig.1
Majority of metabolites that change with age (old relative to young) coordinately respond in both NTg and 3xTg-AD mouse brains (female and male combined). Three-way ANOVA for genotype, age, and gender identify 121 metabolites affected commonly by both genotype and age, accounting for 59% of genotype effects and 49% of age main effects. Numbers of biochemicals exhibiting main effects (p≤0.05) and significant interactions. A) metabolites that decreased significantly in both NTg and 3xTg-AD (p < 0.05). The cyan circle area represents the number of decreases in old NTg mouse brains (136 metabolites in total), similar to the dark green circle for 3xTg-AD mouse brains (94 total). The overlap area represents the common metabolites that decreased with aging in both NTg and 3xTg-AD. B) significantly increased metabolites similarly age-related in NTg (p < 0.05; pink circle, 138 in total) and 3xTg-AD (red circle, 160 metabolites total) with a large overlap area. C) Number of NTg metabolites with significant opposite change with age of in 3xTg-AD mouse brains (p < 0.05; purple circle NTg decreased; yellow circle NTg increased). Circle areas and overlaps are proportional to the number of metabolites.
Age-related metabolic shift in glycolytic and pentose phosphate pathway metabolites
To compare low human utilization of glucose to mouse brain utilization, we examined the glycolytic pathway with age and AD-genotype in mouse hippocampus and extended the specificity into steps of the glycolytic pathway and PPP (Fig. 2). As the glycolysis pathway and the PPP initially consume all the glucose from glucose-6-phosphate, we determined whether age and AD were associated with greater consumption of metabolites in these pathways. We observed that metabolites involved in stage I of glycolysis related to ATP consumption, decreased significantly with age of both genotypes including glucose, glucose 6-phosphate, fructose 6-phosphate, and dihydroxyacetone phosphate (DHAP). The largest decreases were found in glucose 6-phosphate and fructose-6 phosphate, which declined 51-52% in NTg and 27– 38% in 3xTg-AD female with similar decreases in male. Given that glucose only declined 8– 12% in female brains and less than 9% in male of both genotypes, this may indicate an age-related increase in consumption by energy producing steps of glycolysis and/or diversion into the PPP. The absence of significant age-related changes in fructose-1,6-bisphosphate levels with significant declines in the upstream substrates glucose 6P and fructose 6P and downstream DHAP, could indicate an increased age-related rate in phosphofructosekinase 1 (PFK-1) as an important regulatory point of glycolysis [41].
Fig.2
In glycolysis and the pentose phosphate pathway (PPP), hippocampal metabolites declined with age in reactions in which ATP was consumed (green circles with green arrows) and metabolites increased in reactions involved in ATP generation (red circle with red arrows). Intensities of identified metabolites from mass spectrometry in each hippocampal sample were normalized (n = 5 mouse brain samples/age/genotype/gender). Mean intensity with standard errors in female (left) and male (right) for 3 ages of young, middle and old age. Two-way ANOVA was used to calculate statistical significance for each metabolite (p < 0.05 indicates significant age effect). Ns indicates detection but not significantly affected by age; ND, no detectable.
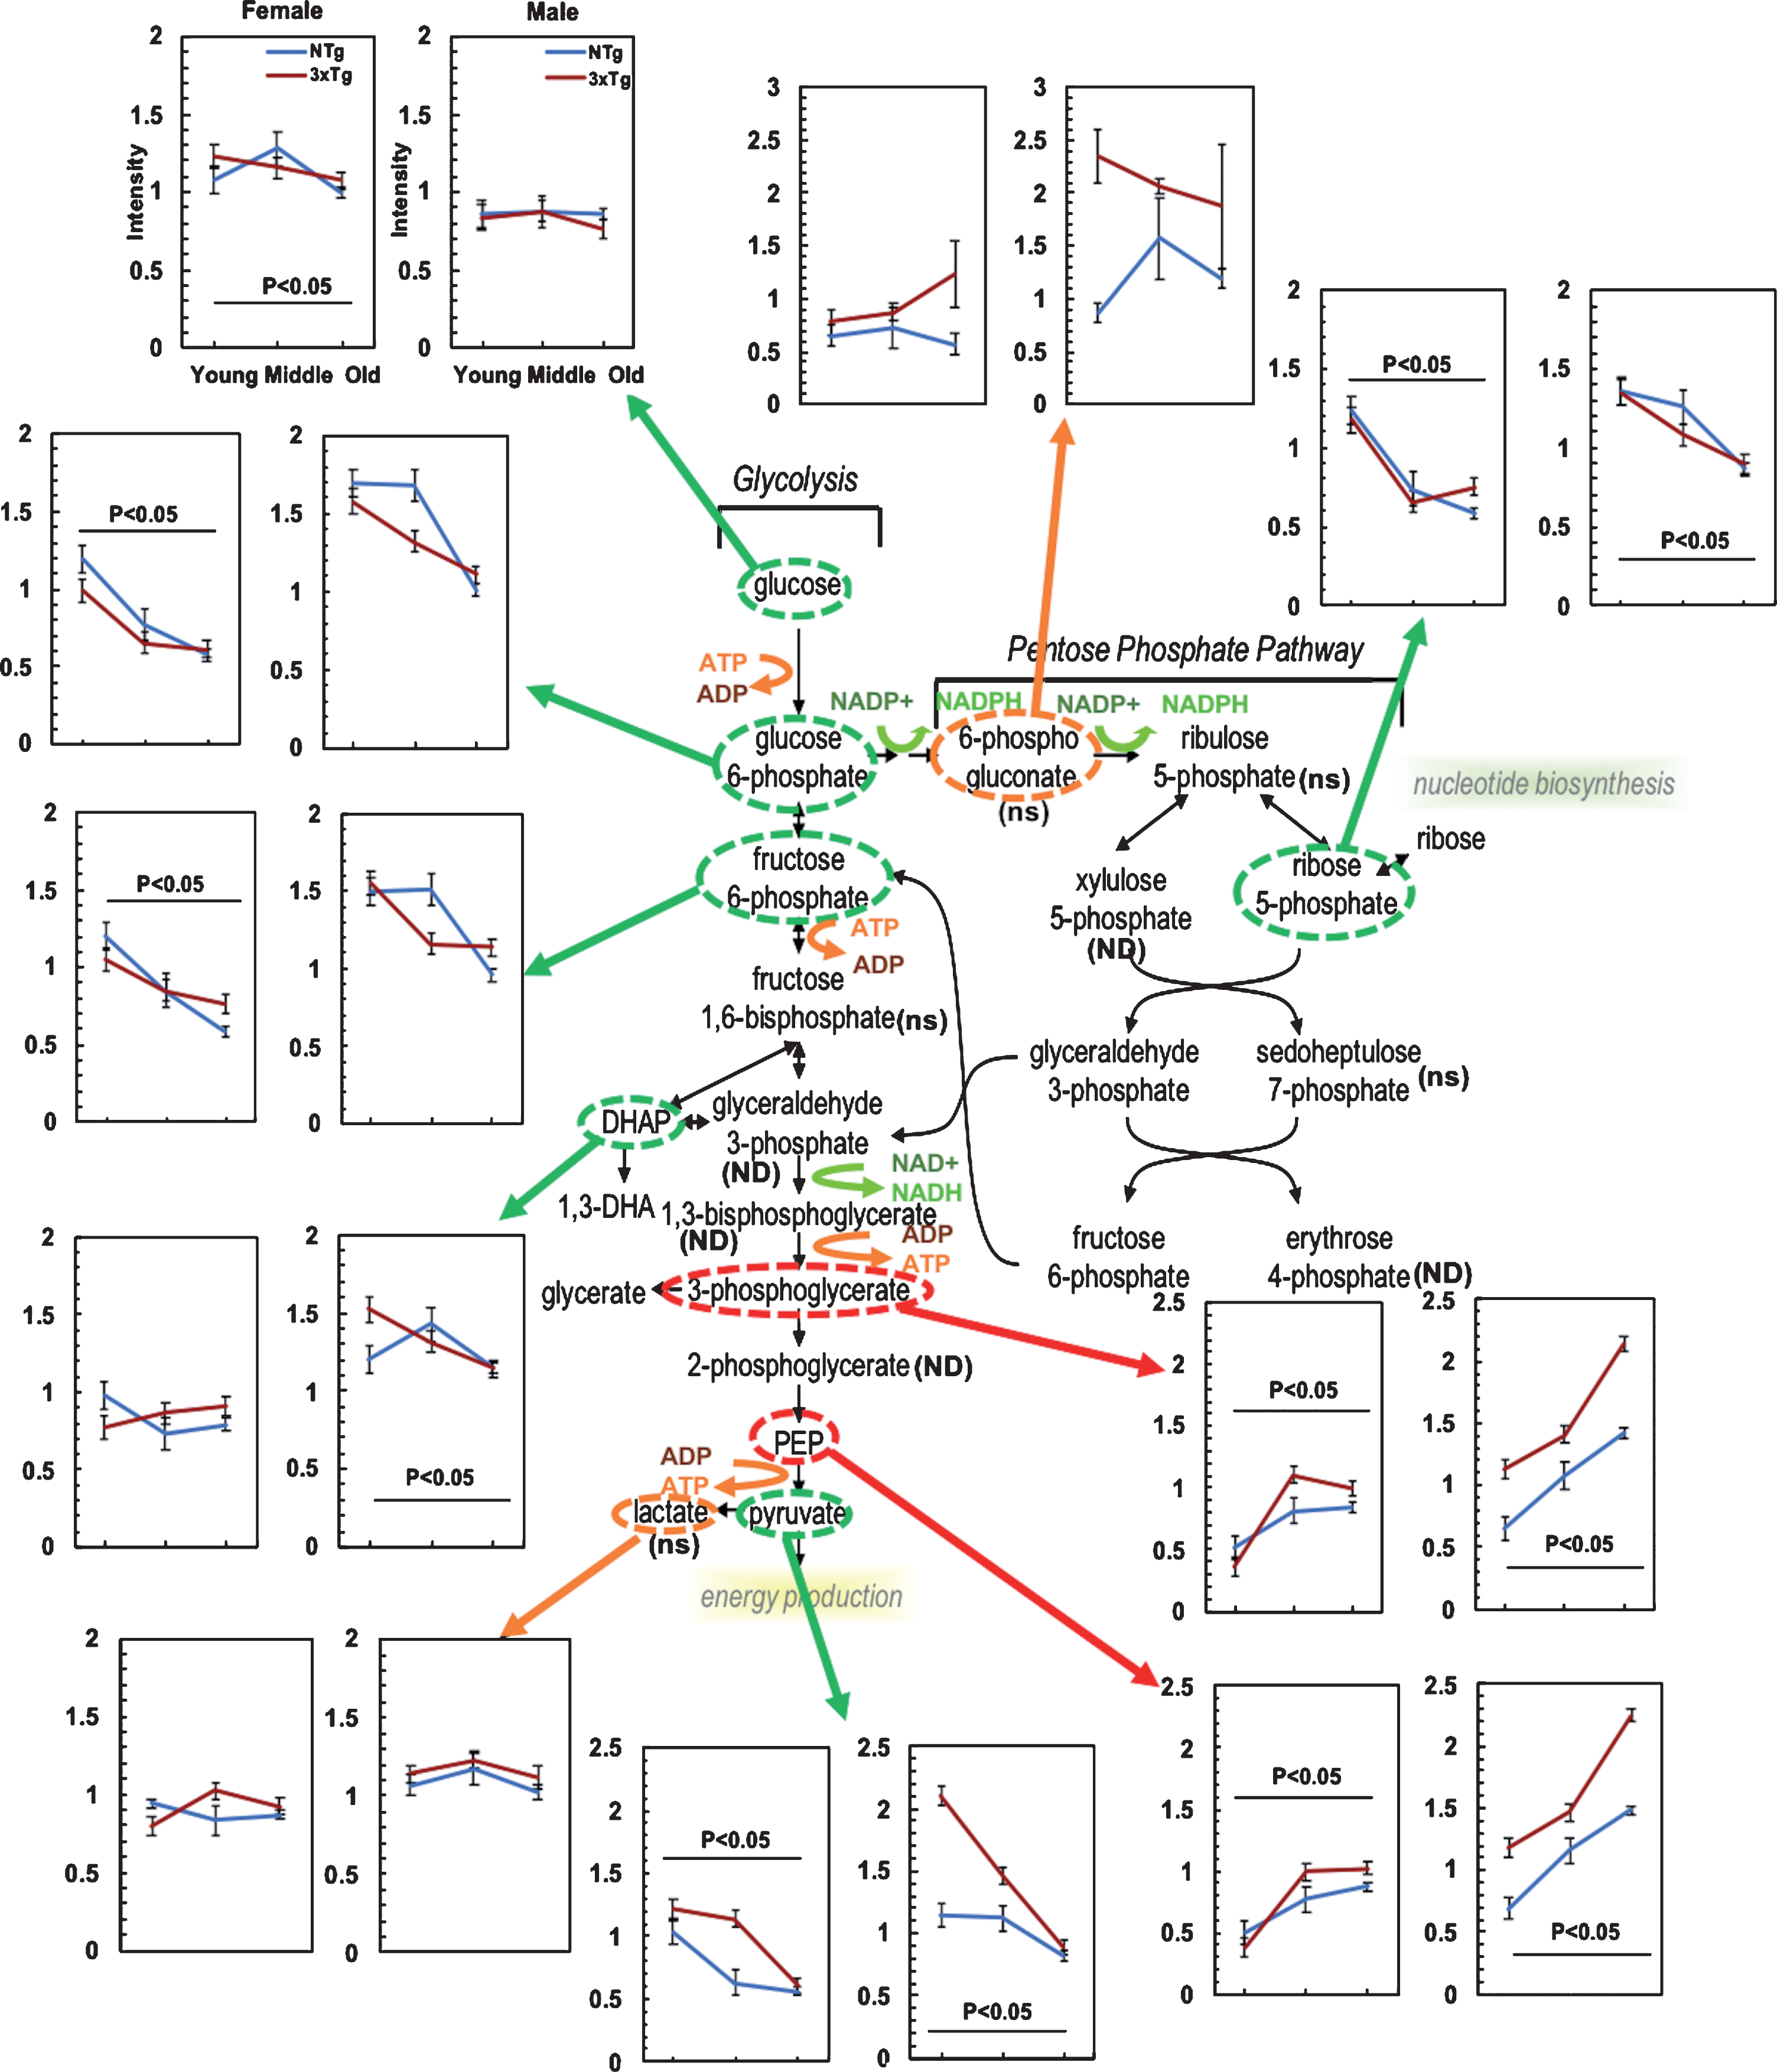
Following stage 1 of glycolysis, oxidation by NAD+, transitions into stage II in which metabolites were elevated with age (Fig. 2). 3-phosphoglycerate and phosphoenolpyruvate (PEP) were elevated 63– 75% in NTg and 170– 180% 3xTg-AD hippocampus in females with age, while these metabolites in males rose 114– 119% in NTg and 90– 91% in 3xTg-AD. This indicates that the input exceeds the consumption with age in stage II of glycolysis. By genotype, these metabolites were 34– 50% higher from 3xTg-AD hippocampi than NTg.
The other possible pathway that could account for the age-related decrease in stage I of glycolysis would be diversion into the PPP (Fig. 2). At the first committed step in the PPP, we detected higher levels of 6-phosphogluconate in the 3xTg-AD than the age-matched NTg samples (combined genders, p < 0.05), although not significantly changed with age. However, the downstream metabolite ribose 5-phosphate in the PPP was 36– 52% lower from young to old age of both genotypes and genders (Fig. 2). Age-related increased metabolic inputs in PPP from glycolysis with reduced levels in the downstream metabolite of ribose 5-phosphate suggests an age-related higher consumption of intermediates in PPP to support NADPH generation for antioxidant defense or impairments in PPP with age. Ribulose 5-phosphate and sedoheptulose 7-phosphate in the PPP were not significantly changed with age. The PPP partially fluxes back into glycolysis at the points of glyceraldehyde 3-phosphate and fructose 6-phosphate (also decreased with age). Among the intermediates of ATP-consumed steps in glycolysis, only fructose 1,6-bisphosphate was found to be not significantly changed with age in either NTg and 3xTg-AD samples. In PPP, 6-phosphogluconate levels were 1.6 to 2-fold higher in 3xTg-AD old samples compared to age-matched NTg for both genders, indicating higher demand of NADPH in 3xTg-AD hippocampal brains. The downstream intermediate ribose 5-phosphate showed remarkably age-dependent declines in both genotypes. These decrements in metabolites in the PPP pathway with age suggest a comparatively higher metabolism of glucose in the PPP for more NADPH production and antioxidant defense with AD genetic load.
At the end of stage II of glycolysis, PEP is metabolized to pyruvate. Pyruvate is at a critical intersection to either branch to produce lactate or enter into the TCA cycle after conversion into acetyl-CoA. Our results showed age-related 30– 45% decreases in pyruvate of both genders for NTg and 50– 58% decreases in 3xTg-AD samples (Fig. 2). This remarkable switch from an age-related increase in the PEP precursor to an age-related drop in pyruvate suggests an increased consumption of pyruvate with age, a re-direction in metabolic fluxes either into lactate or acetyl-CoA. A ratio of lactate to pyruvate (lactate/pyruvate) increased with age in female (Two-way ANOVA for age and genotype F(2,29) = 14, p < 0.001) and male (Two-way ANOVA F(2,29) = 12, p < 0.001). Compared to the young age, the lactate/pyruvate ratio in old-age brains increased 34– 52% in NTg and 131– 134% in 3xTg-AD samples of both genders. With age, the 30– 50% drop in pyruvate of both genotypes and genders was not propagated to lactate levels (<10% shifts with age), suggesting a balance between production and utilization of lactate or removal from the brain into the blood. The decreased levels of pyruvate suggest more output to branches of lactate or the TCA cycle. The lactate/pyruvate ratio can be regulated by the NAD/NADH ratio [42]. Metabolic flux experiments are needed for a definitive conclusion of an age-related decline in ATP production from glycolysis.
Age-related increased inputs to the TCA cycle with decreased cycle metabolites
Increased fatty acids and β-oxidation
To further explore if the age-related metabolic transition to lower pyruvate results in a lower metabolic state of the TCA cycle with age, we studied the age-related shifts in metabolite levels of the TCA cycle (Fig. 3). We first consider the inputs to the TCA cycle from fatty acids, glutamine and branched chain amino acids, followed by metabolites in the cycle. Pyruvate enters the TCA cycle after conversion into acetyl-CoA. Fatty acid β-oxidation, also produces acetyl-CoA (pink highlight in Fig. 3). With age, acetyl-CoA levels increased 2 to 2.5-fold in both genotypes and genders. With AD genetic load, acetyl-CoA was 23% in females and 121% higher in male 3xTg-AD old samples. This suggests an increased production or a decreased consumption of acetyl-CoA in the TCA cycle with age that was further exacerbated with AD genetic load, indicating higher demand for energy. Upstream of acetyl-CoA, 1.1– 2.9-fold increased accumulation of fatty acids with age is shown for two fatty acid-carnitine conjugates, butyryl-carnitine and propionylcarnitine.
Fig.3
Age-related declines in the substrates of the TCA cycle from increased inputs at acetyl-CoA, succinyl carnitine, and fatty acid metabolism. ns indicates detection but not significantly affected by age; ND, not detectable.
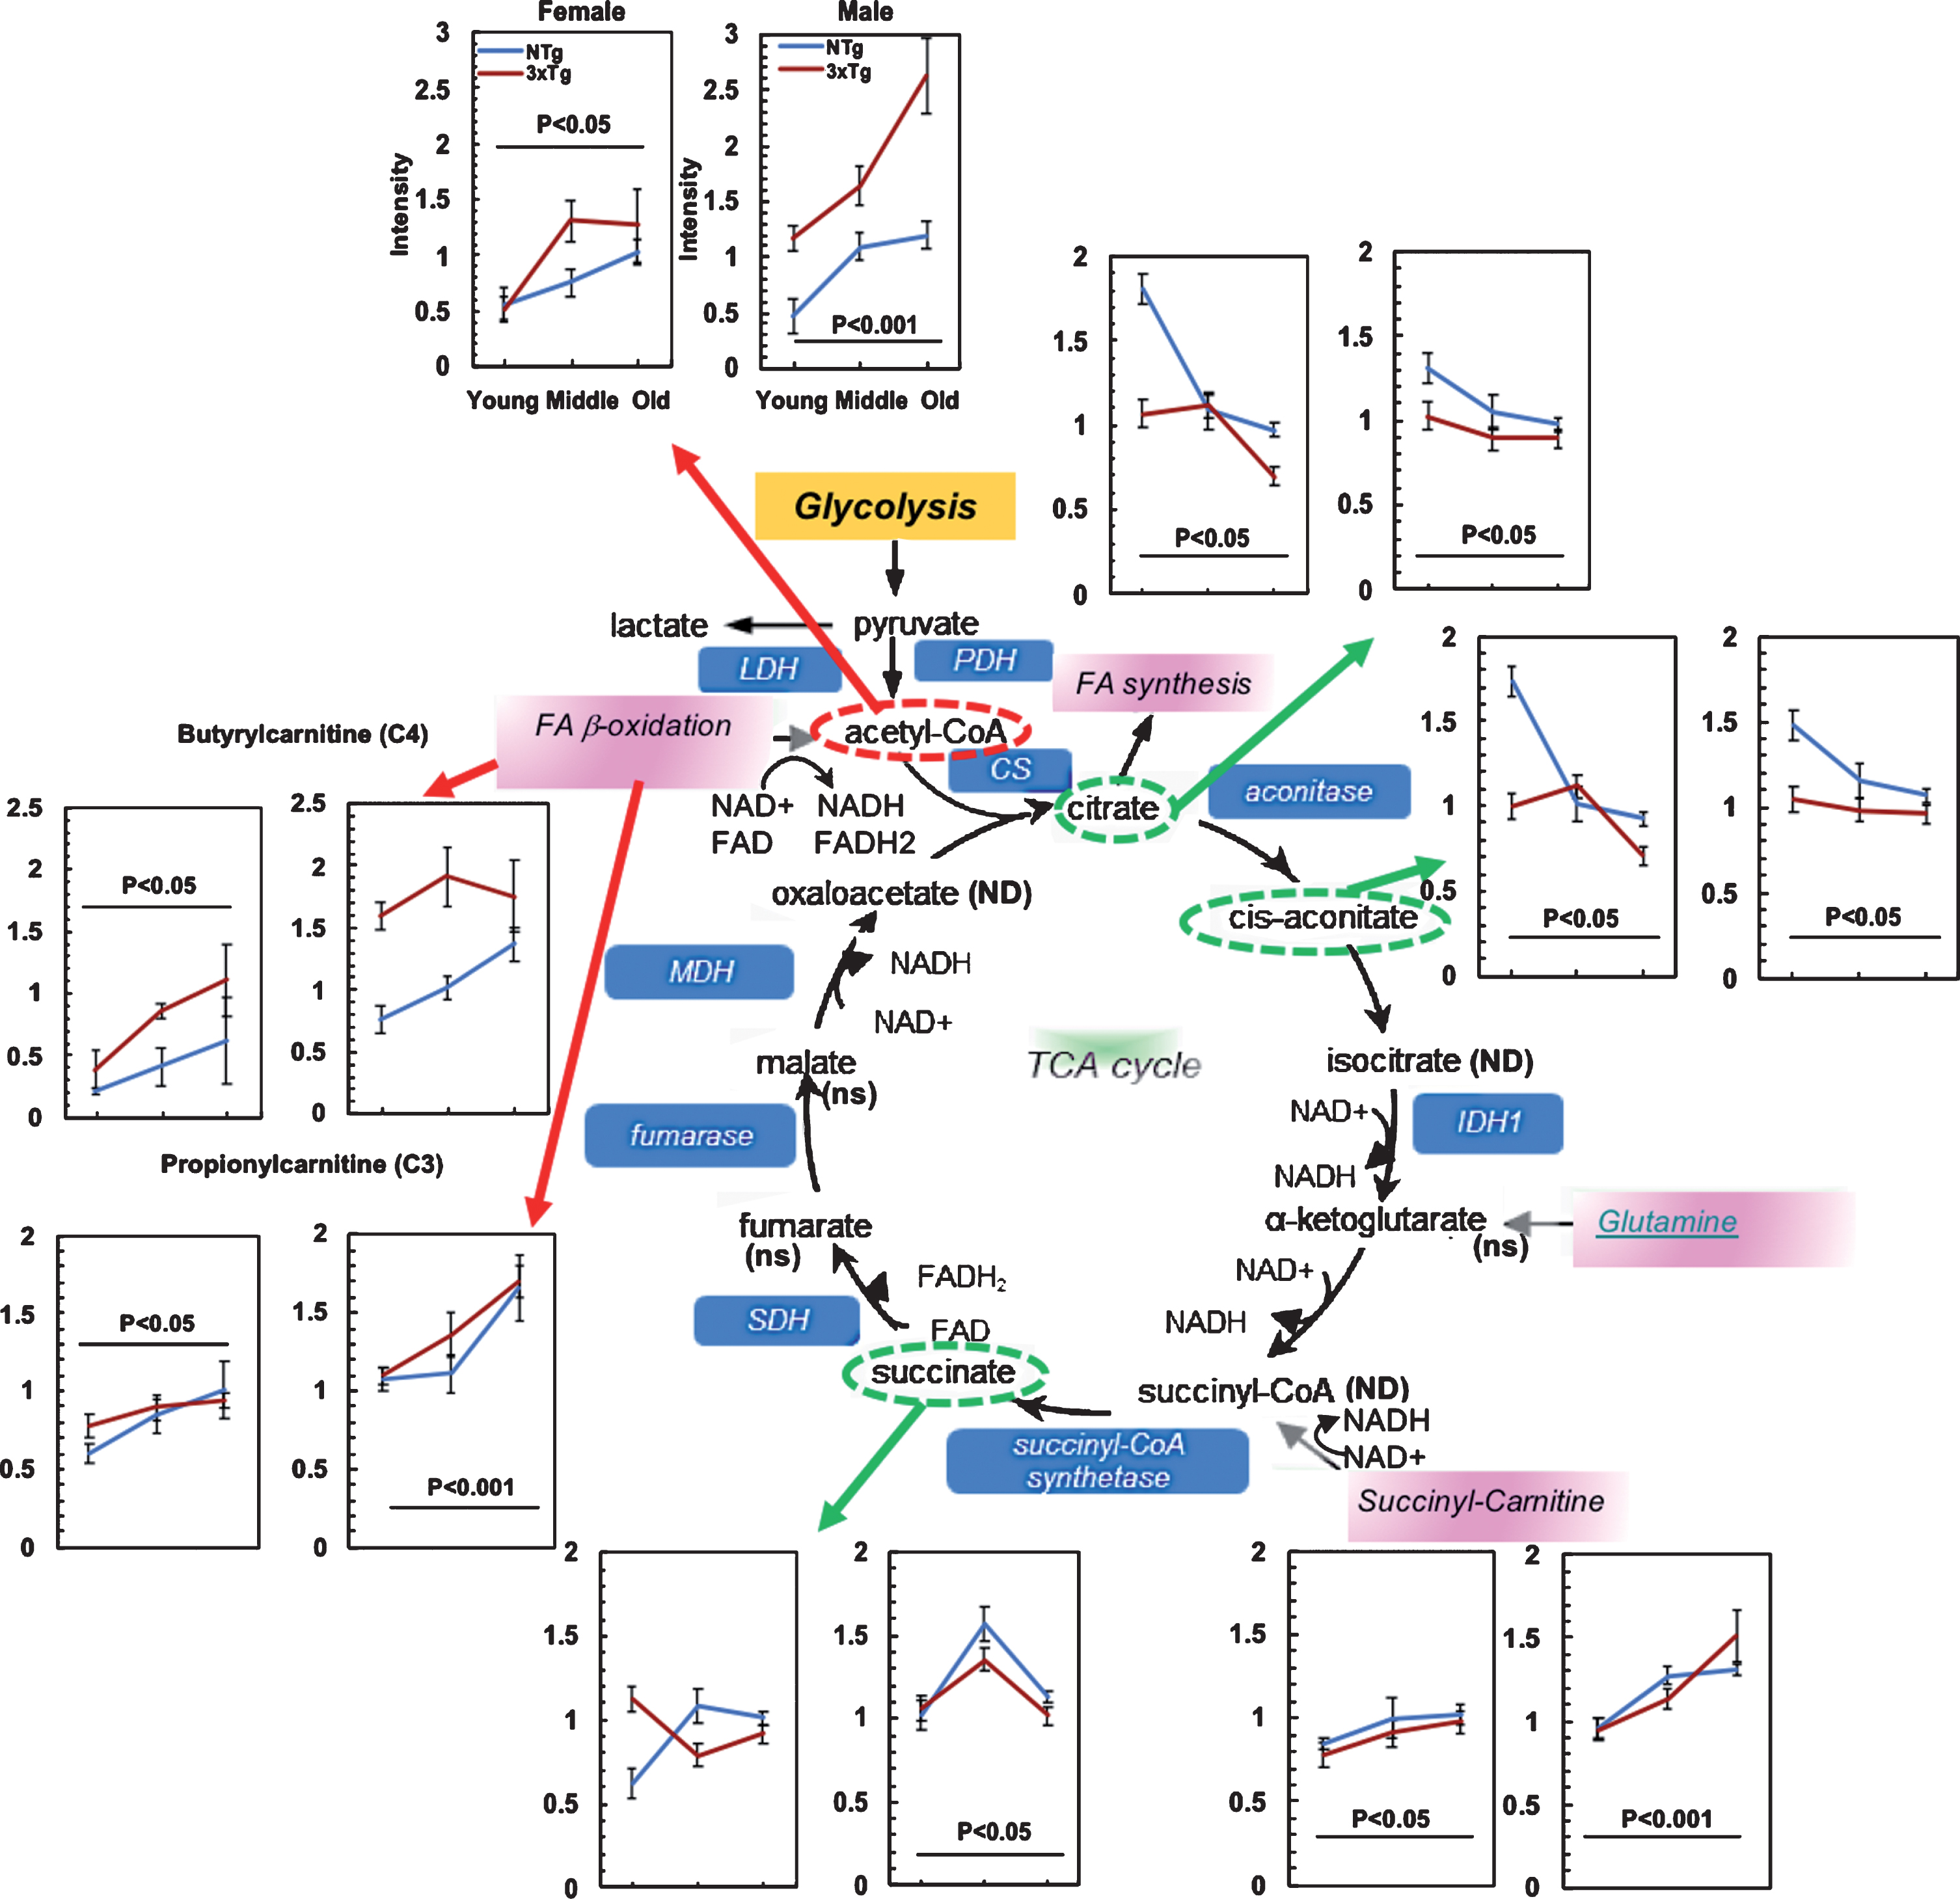
Fig.4
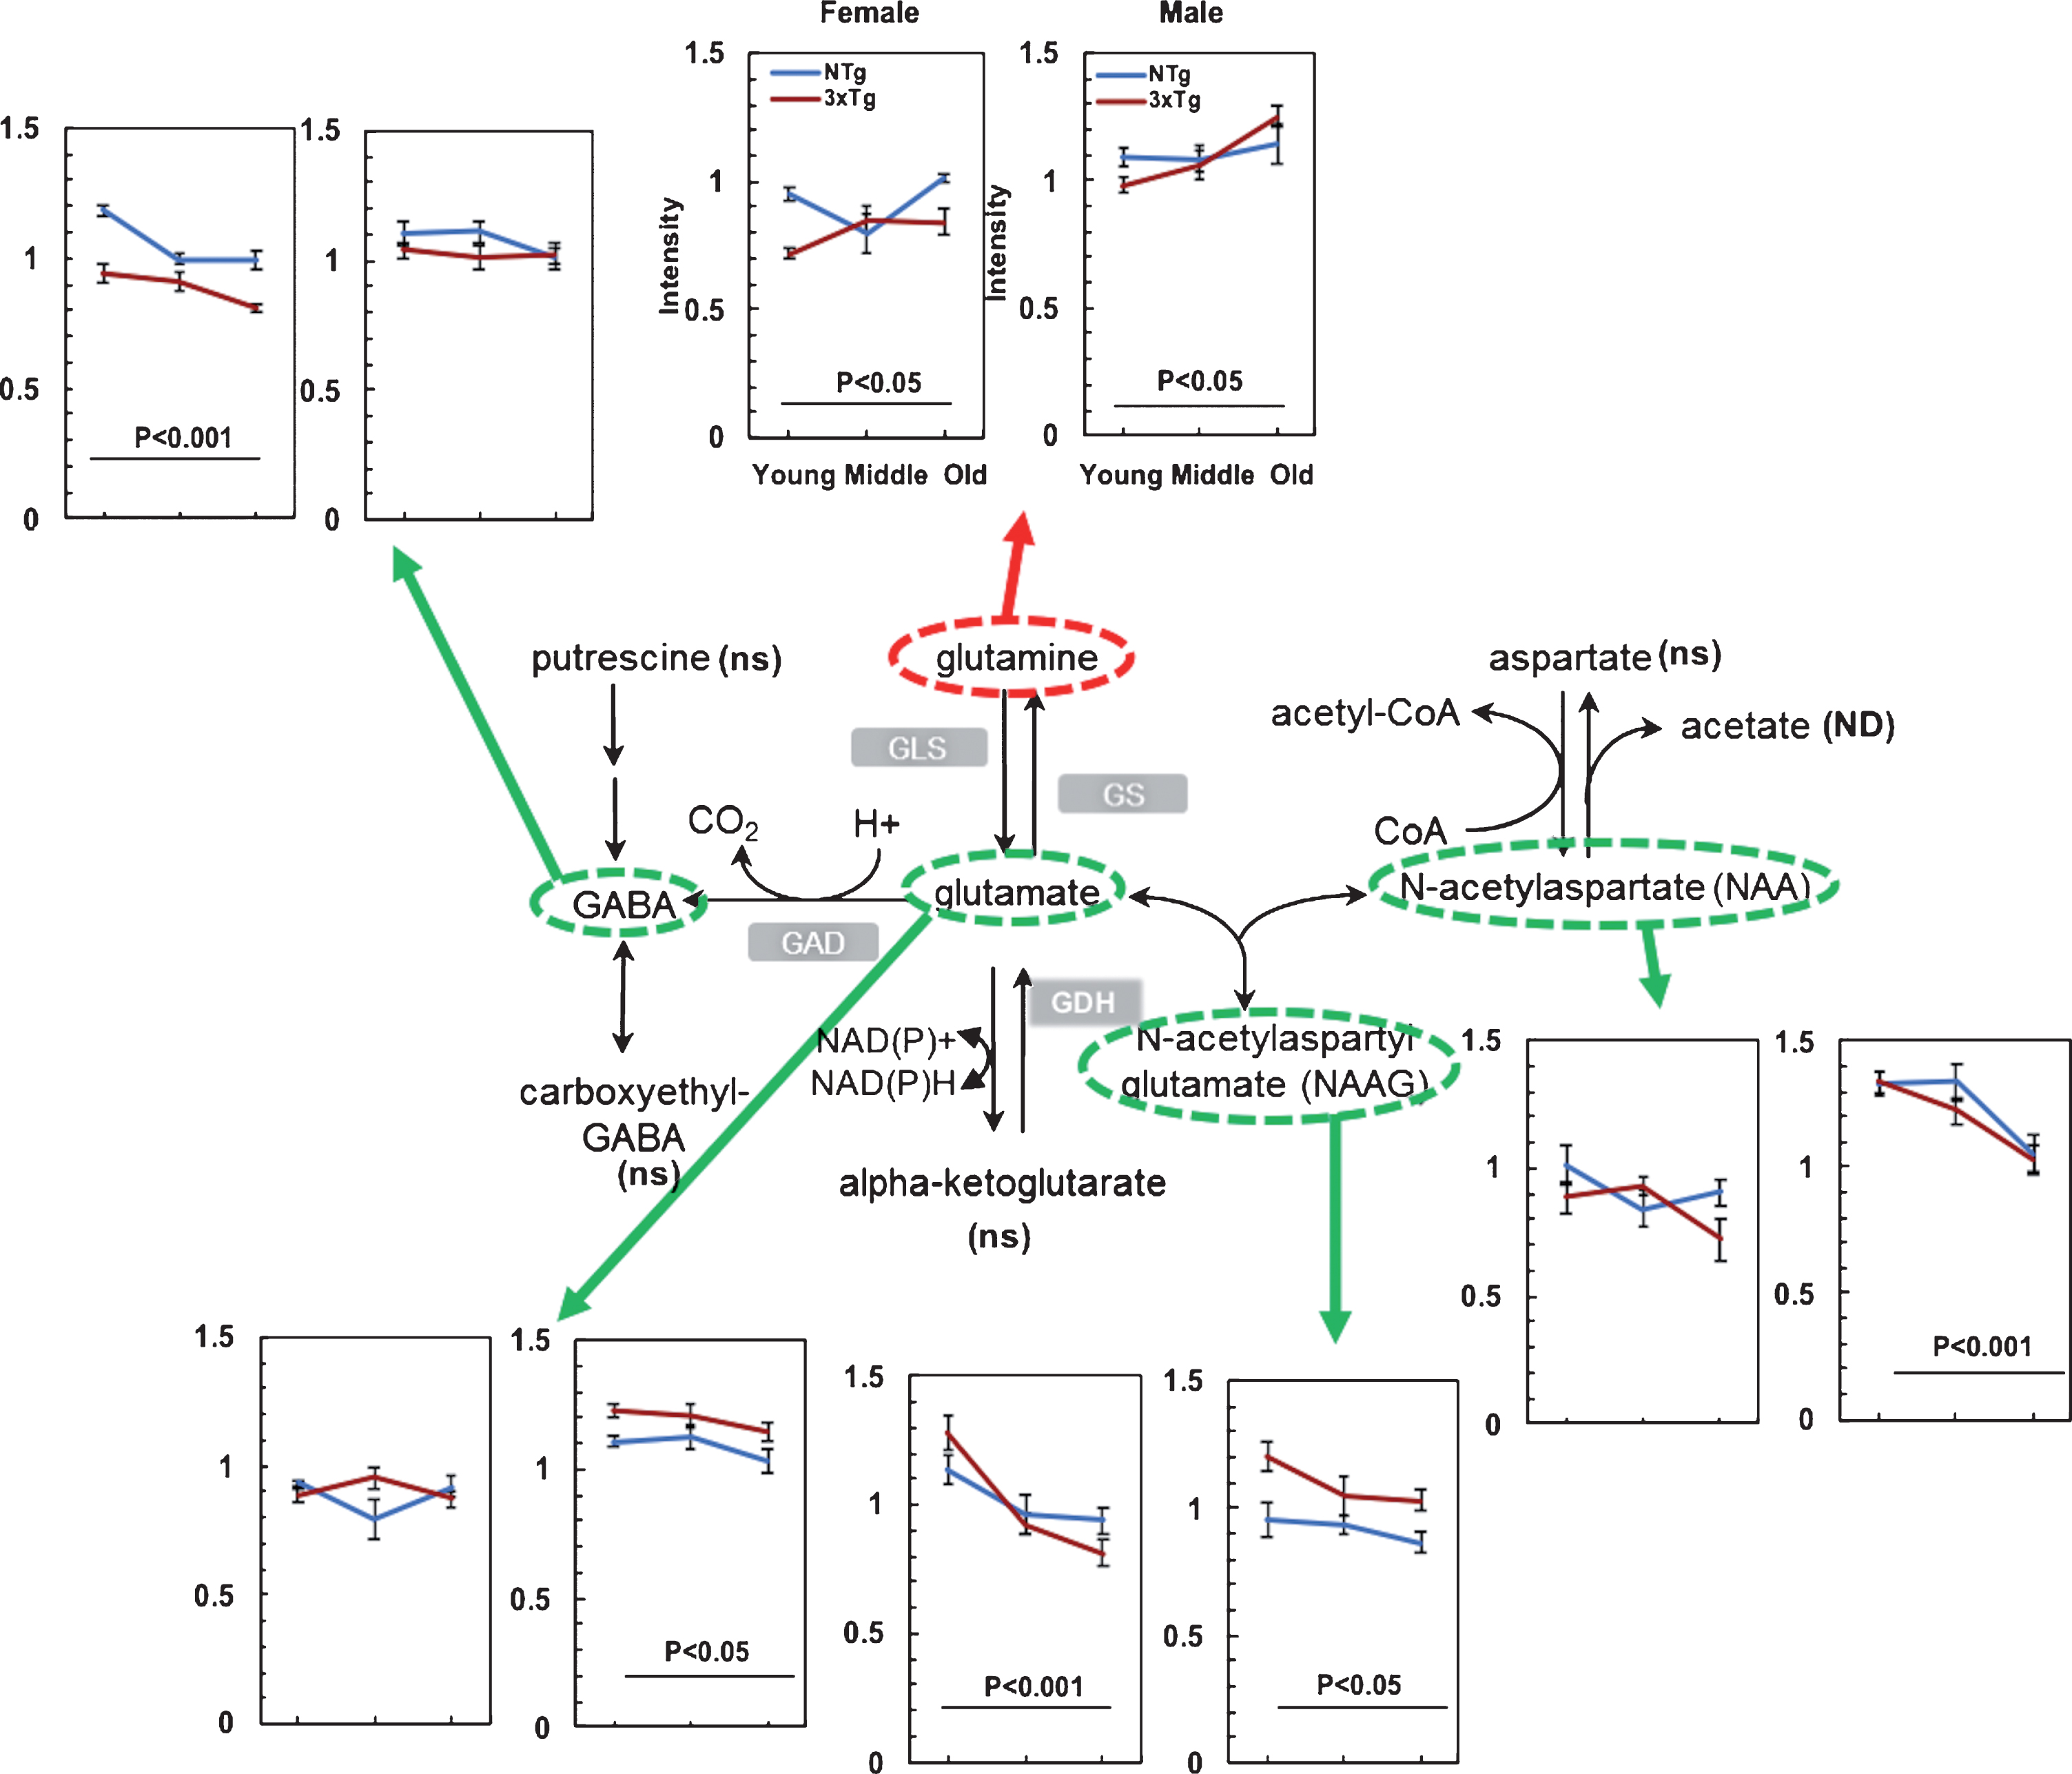
Age-related decreased glutamate metabolism from increased glutamine in both NTg and 3xTg-AD mice. Age drove decreases in the levels of glutamate, NAA and NAAG, which suggests a lower input to α-ketoglutarate in the TCA cycle or greater consumption. ns indicates detection but not significantly affected by age; ND, no detectable. GLS: Glutaminase, GS: Glutamine synthetase, GAD: Glutamate decarboxylase, GDH: Glutamate dehydrogenase
Elevated glutamine
Other increased input to the TCA cycle occurs from glutamine and branched chain amino acids (BCAA). Glutamine feeds into the TCA cycle at the level of α-ketoglutarate (Fig. 3) and serves as an important source of intermediary metabolites [43]. With aging, glutamine levels rose 7 to 27% for both genotypes and genders (Fig. 4). Yet another metabolite branch to α-ketoglutarate, 2-hydroxyglutarate levels increased 1.5 to 6.5-fold in 3xTg-AD compared to NTg samples in both genders (p < 0.001). However, α-ketoglutarate levels changed little with aging. The age- and AD-associated accumulation in glutamine and 2-hydroxyglutarate levels without significant change in α-ketoglutarate levels indicates a possible age- and AD-related blockage at the site of α-ketoglutarate for metabolic input to the TCA cycle.
Branched chain amino acids increased in females
BCAAs include leucine, isoleucine, and valine. Since BCAA are converted into acetyl or succinyl-CoA in the TCA cycle for NADH and for eventual ATP generation, we examined their changes with age, genotype, and gender. Leucine, isoleucine, and valine were1.2– 1.3-fold higher in female samples than male (p < 0.05). Changes with age or genotype were not detected.
Decreased metabolites in TCA cycle
In the TCA cycle itself, metabolites decreased considerably with age, including citrate, cis-aconitate in both genders and succinate in males (green circles and green arrows in Fig. 3). In females, citrate and cis-aconitate dropped 46– 47% in NTg and 30– 35% in 3xTg-AD with age. In males, age drove decreases of citrate and cis-aconitate by 26– 28% in NTg and 8– 13% in 3xTg-AD. Succinate declined from middle to old age by 25– 28% in males of both genotypes, but not in females. TCA cycle metabolites of the 3xTg-AD brains were generally lower than the age-matched NTg mouse brains. Other metabolites in the TCA cycle including α-ketoglutarate, fumarate, and malate were detected with little age-related changes. Isocitrate, succinyl-CoA, and oxaloacetate were not detected. In summary, the combination of age-related increased inputs to the TCA cycle together with decreased TCA cycle metabolites suggests age-related limitations in utilization of the inputs by the TCA cycle and consequent decreased output of NADH with age and AD.
Age- and AD-associated redox pivot at glutamate-α-ketoglutarate in glutamine metabolism
In the glutamate-glutamine cycle, astrocytic release of glutamine is transported into neurons to synthesize neurotransmitters glutamate or GABA and maintain glutamine/ glutamate pools [44] and redox balance. Glutamate dehydrogenase (GDH) catalyzes the interconversion of glutamate to α-ketoglutarate modulated by a redox sensitive site depending on NAD+/NADH levels [45]. Depletion of glutamate-glutamine and gamma-aminobutyric acid (GABA) were reported recently in normal aged human brains and cognitively impaired patients by magnetic resonance spectroscopy (MRS) [46]. These metabolites feed into α-ketoglutarate which functions as a critical NAD+/NADH-dependent substrate in the TCA cycle. We determined metabolic shifts in glutamate with aging as an important upstream substrate via GDH. Glutamine increased 7– 27% with age in both genotypes and genders (Fig. 4). Glutamate levels declined 7% with age in males of both genotypes, but female levels were unchanged (Fig. 4). GABA as a major inhibitory transmitter in the brain declined 14– 16% with age in females of both NTg and 3xTg-AD samples. N-acetylaspartyl glutamate (NAAG) decreased 9– 36% in both genders and N-acetylaspartate (NAA) declined 10– 23% with age in males of both genotypes (Fig. 4). Given that the brain levels of NAA correlate with cognitive function [47], the lower levels of NAAG and NAA may contribute to cognitive impairments in age and AD. Aspartate was detected with less significant shifts with age of both genotypes in female (p = 0.12) and male (p = 0.25) (figure not shown). Our results are in accordance with decreased glutamate neurotransmission in AD patients [48]. Taken together, these shifts in glutamate metabolism with age may impair neuronal transmission.
Increased fatty acid metabolites with age
During energetic shortage with lower glucose intake or lower ATP generation via glycolysis and the TCA cycle, fatty acids undergo β-oxidation with production of acetyl-CoA and NADH to power energy production and maintain redox balance [49]. Carnitine is conjugated to fatty acids for transport into mitochondria. Figure 3 shows that metabolites of butyrylcarnitine (C4) and propionylcarnitine (C3) in the short chain fatty acid pathway increased with age 1.2– 2.9-fold in female and 1.1– 1.8-fold in male as their dehydrogenase consumes NAD+ to provide acetyl-CoA and NADH inputs. Compared to NTg, in old age, the AD genetic load increased levels of butyrylcarnitine (C4) 77% in female and 28% in male. Other metabolites of carnitine metabolism including carnitine and acetylcarnitine (C2) showed 1.5 to 2.5-fold elevations with aging in both NTg and 3xTg-AD samples (not shown, p < 0.05). To globally view fatty acid metabolites, their direction and magnitude were clustered to demonstrate a wide range of age-related increases with both genotypes and genders (Fig. 5). Each metabolite with a significant age-associated (gender and genotype) shift by two-way ANOVA is shown. After calculation of Euclidean distances and clustering distances, the heatmap pattern showed a strong age effect for upregulation of fatty acid metabolism (x-axis). After clustering of the levels of fatty acids, we observed a strong age effect that drove 2-fold elevations of fatty acids (Fig. 5). Further, AD genetic load drove 21– 22% more elevations of fatty acid metabolism in old 3xTg-AD samples compared to those of NTg for both female (p < 10-23) and male (p < 10-17) samples. The age and AD upregulation in fatty acid metabolism drove 1.8 to 2.6-fold elevations of acetyl-CoA in old versus young neurons as a final product of fatty acid β-oxidation for entry into the TCA cycle (Fig. 3). The global upregulation in fatty acid metabolism with age suggests an age-related demand for more energetically dense substrates than carbohydrates to generate maximum NADH from 3-hydroxyacyl-CoA dehydrogenase or impairment the TCA cycle to use the resulting CoA with aging [50]. Furthermore, the greater upregulation in fatty acid metabolism in 3xTg-AD old brains compared to old NTg suggests a greater demand for energy in the aged 3xTg-AD brains. Elevation of numerous fatty acids with age and AD together with their carnitine conjugates could supply energy by their β-oxidation.
Age- and AD-related lower expression in sphingolipid metabolism in mouse brains
Sphingolipids play numerous functions in cells, from structural components (sphingomyelins) to signaling (ceramides, sphingosine-1-phosphate). Sphingomyelins are important constituents of lipid rafts, which are particularly enriched in the central nervous system [51]. With age, sphinganine decreased 31– 42% (Fig. 6) and sphingomyelin declined 14– 29% with age of both genotypes and genders. Ceramides serve signaling functions, including apoptosis and inflammation, which have been associated with pathogenesis of AD [52]. In sphingolipid metabolism, the downstream intermediates including ceramide, sphingosine and sphingosine-1-phosphate were increased 27– 143% with age in 3xTg-AD male brains (Fig. 6). The increased ceramides are consistent with higher inflammation with age, especially in the male AD genotype.
Fig.5
Elevated fatty acid metabolites cluster by age and genotype in both females and males. Scaled intensity of each metabolite in each sample was clustered in rows and columns. Differences in levels were clustered predominantly by age. Genotype effects were remarkably distinguished starting from middle age. Gender was less affected. Green indicates a lower scaled intensity and red indicates a higher scaled intensity. tri, 3xTg-AD; non-tri, NTg; Y, young; M, middle-age; O, old, un-numbered; 1, 2, 3, 4 = sample number from different mice.
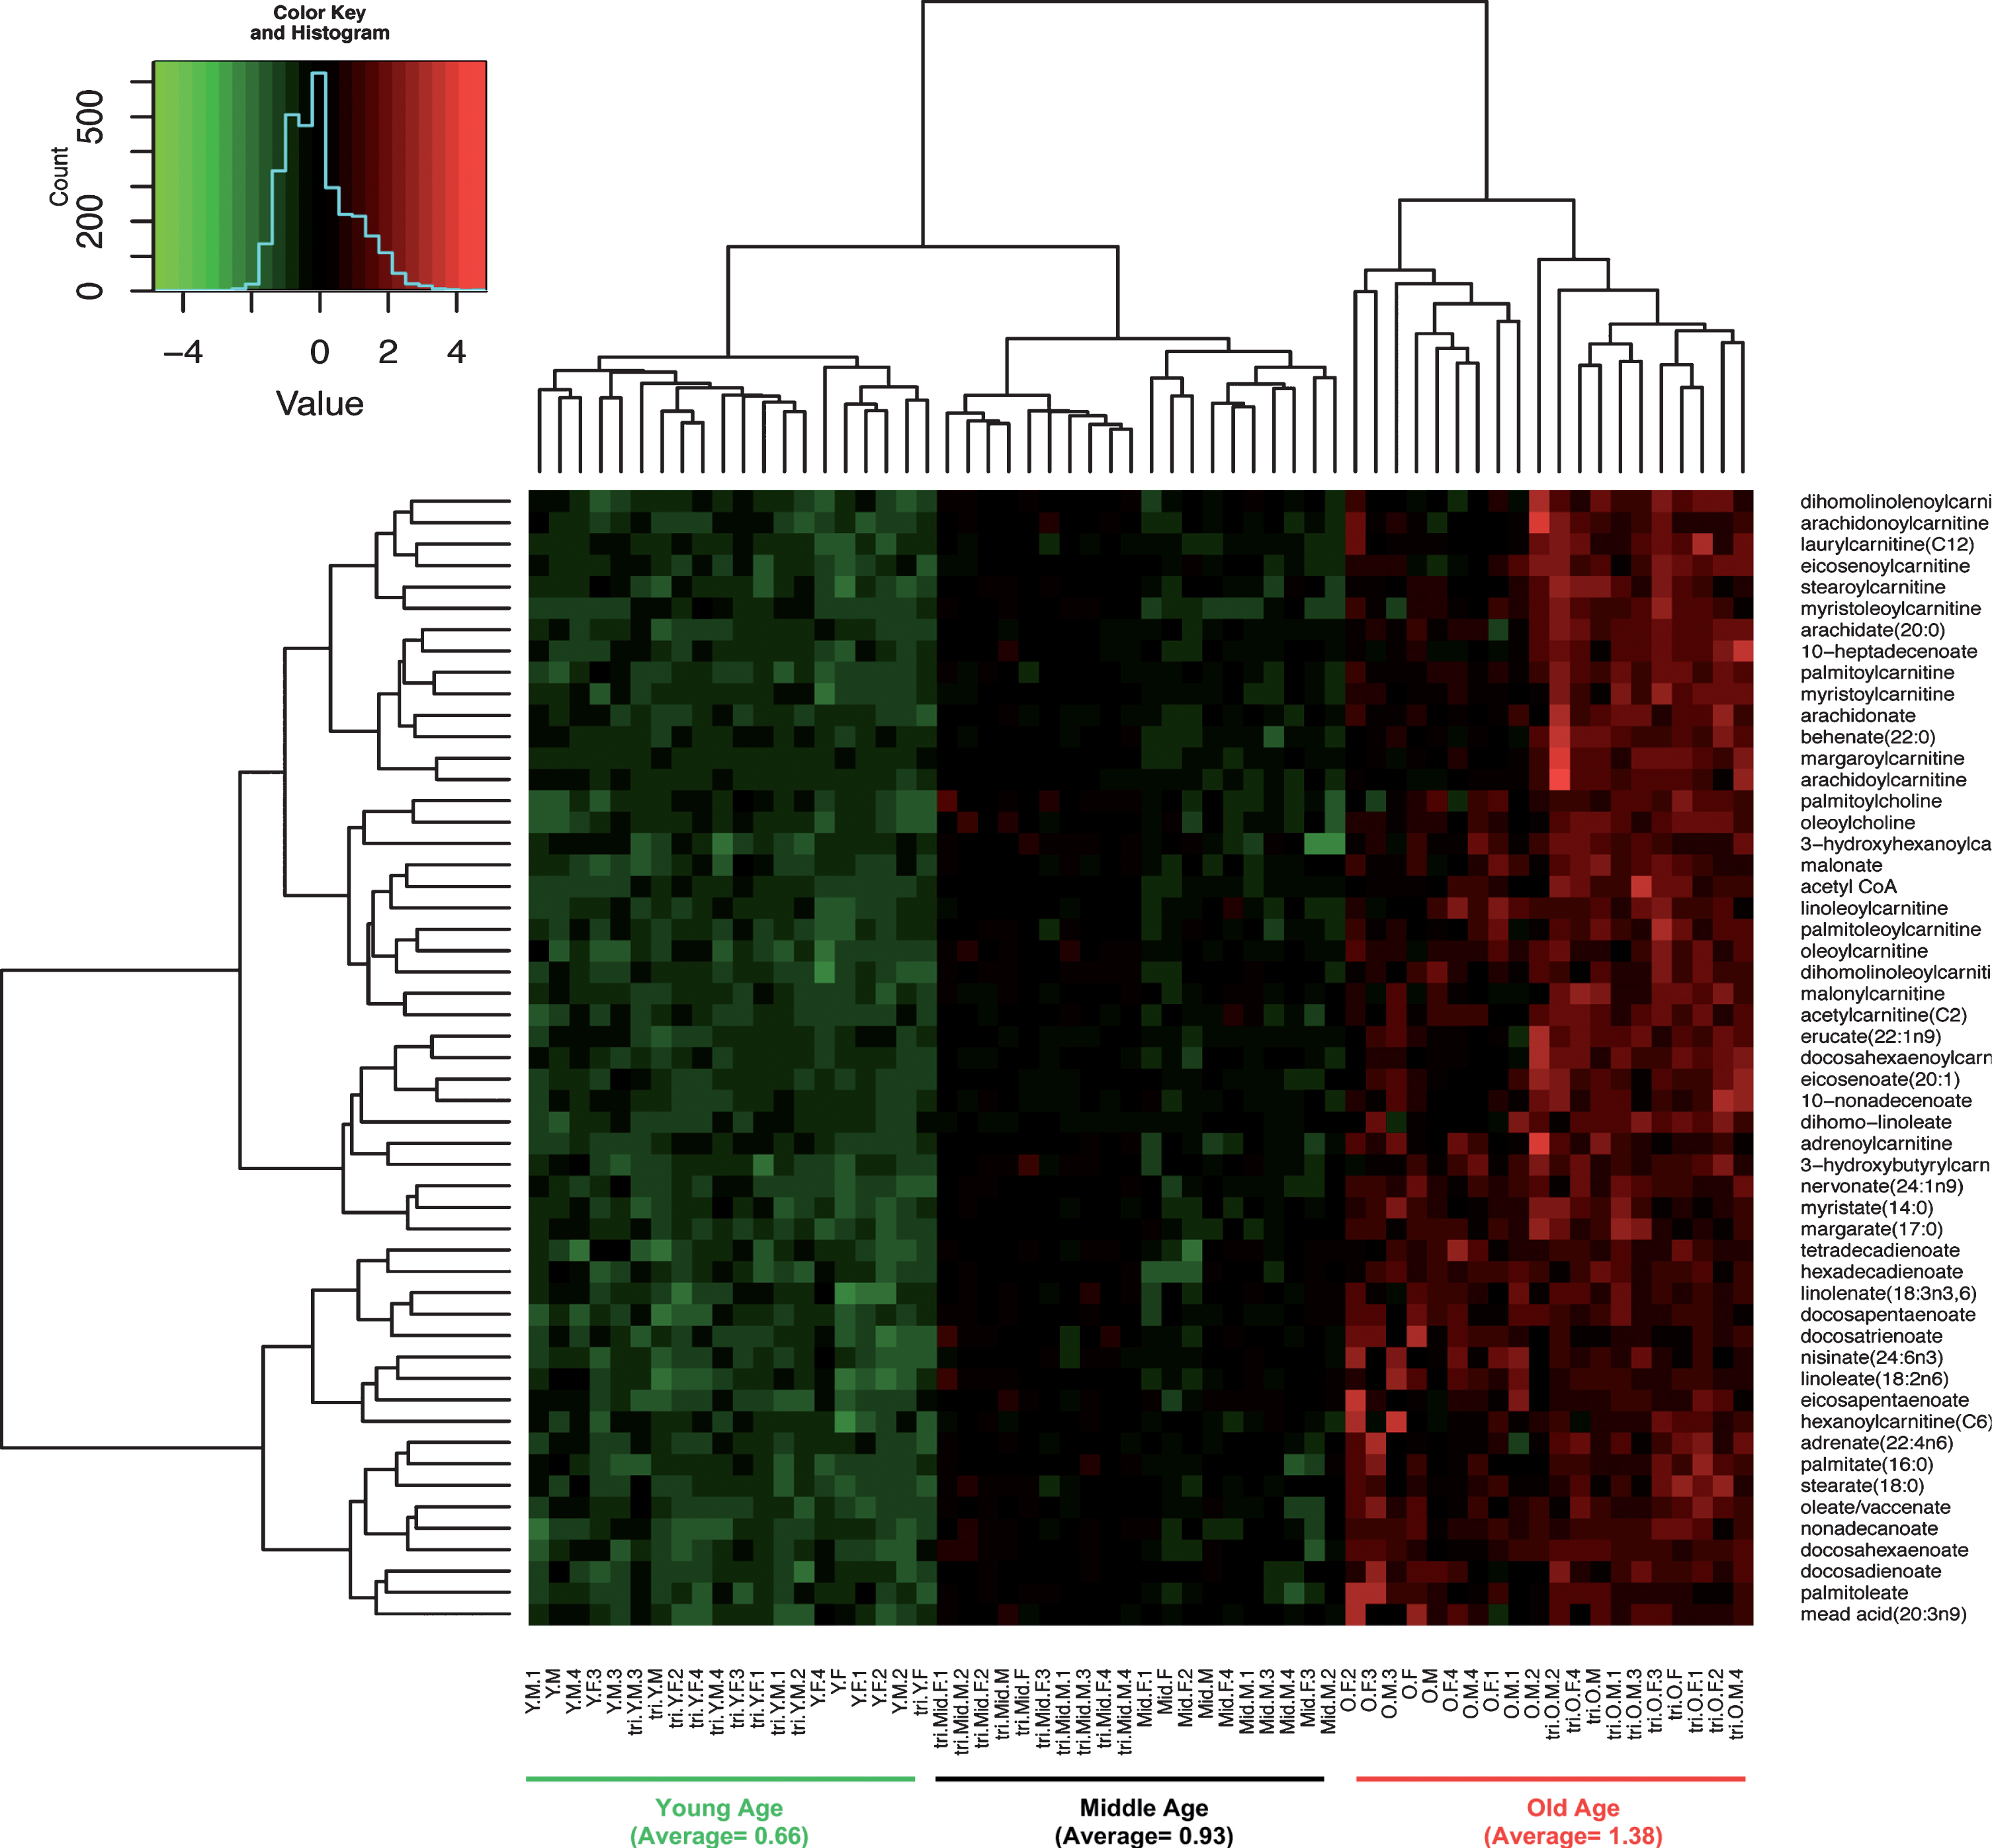
Fig.6
Age-related changes in sphingolipid metabolism of both NTg and 3xTg-AD suggest increased inflammation. Age drove significant declines in sphinganine and sphingomyelin (green ovals and arrows), but elevated the downstream metabolites of sphingolipid metabolism, including ceramide, sphingosine and sphingosine-1P in both NTg and 3xTg-AD female and male samples (red ovals and arrows). ns indicates detection but not significantly affected by age; ND, no detectable.
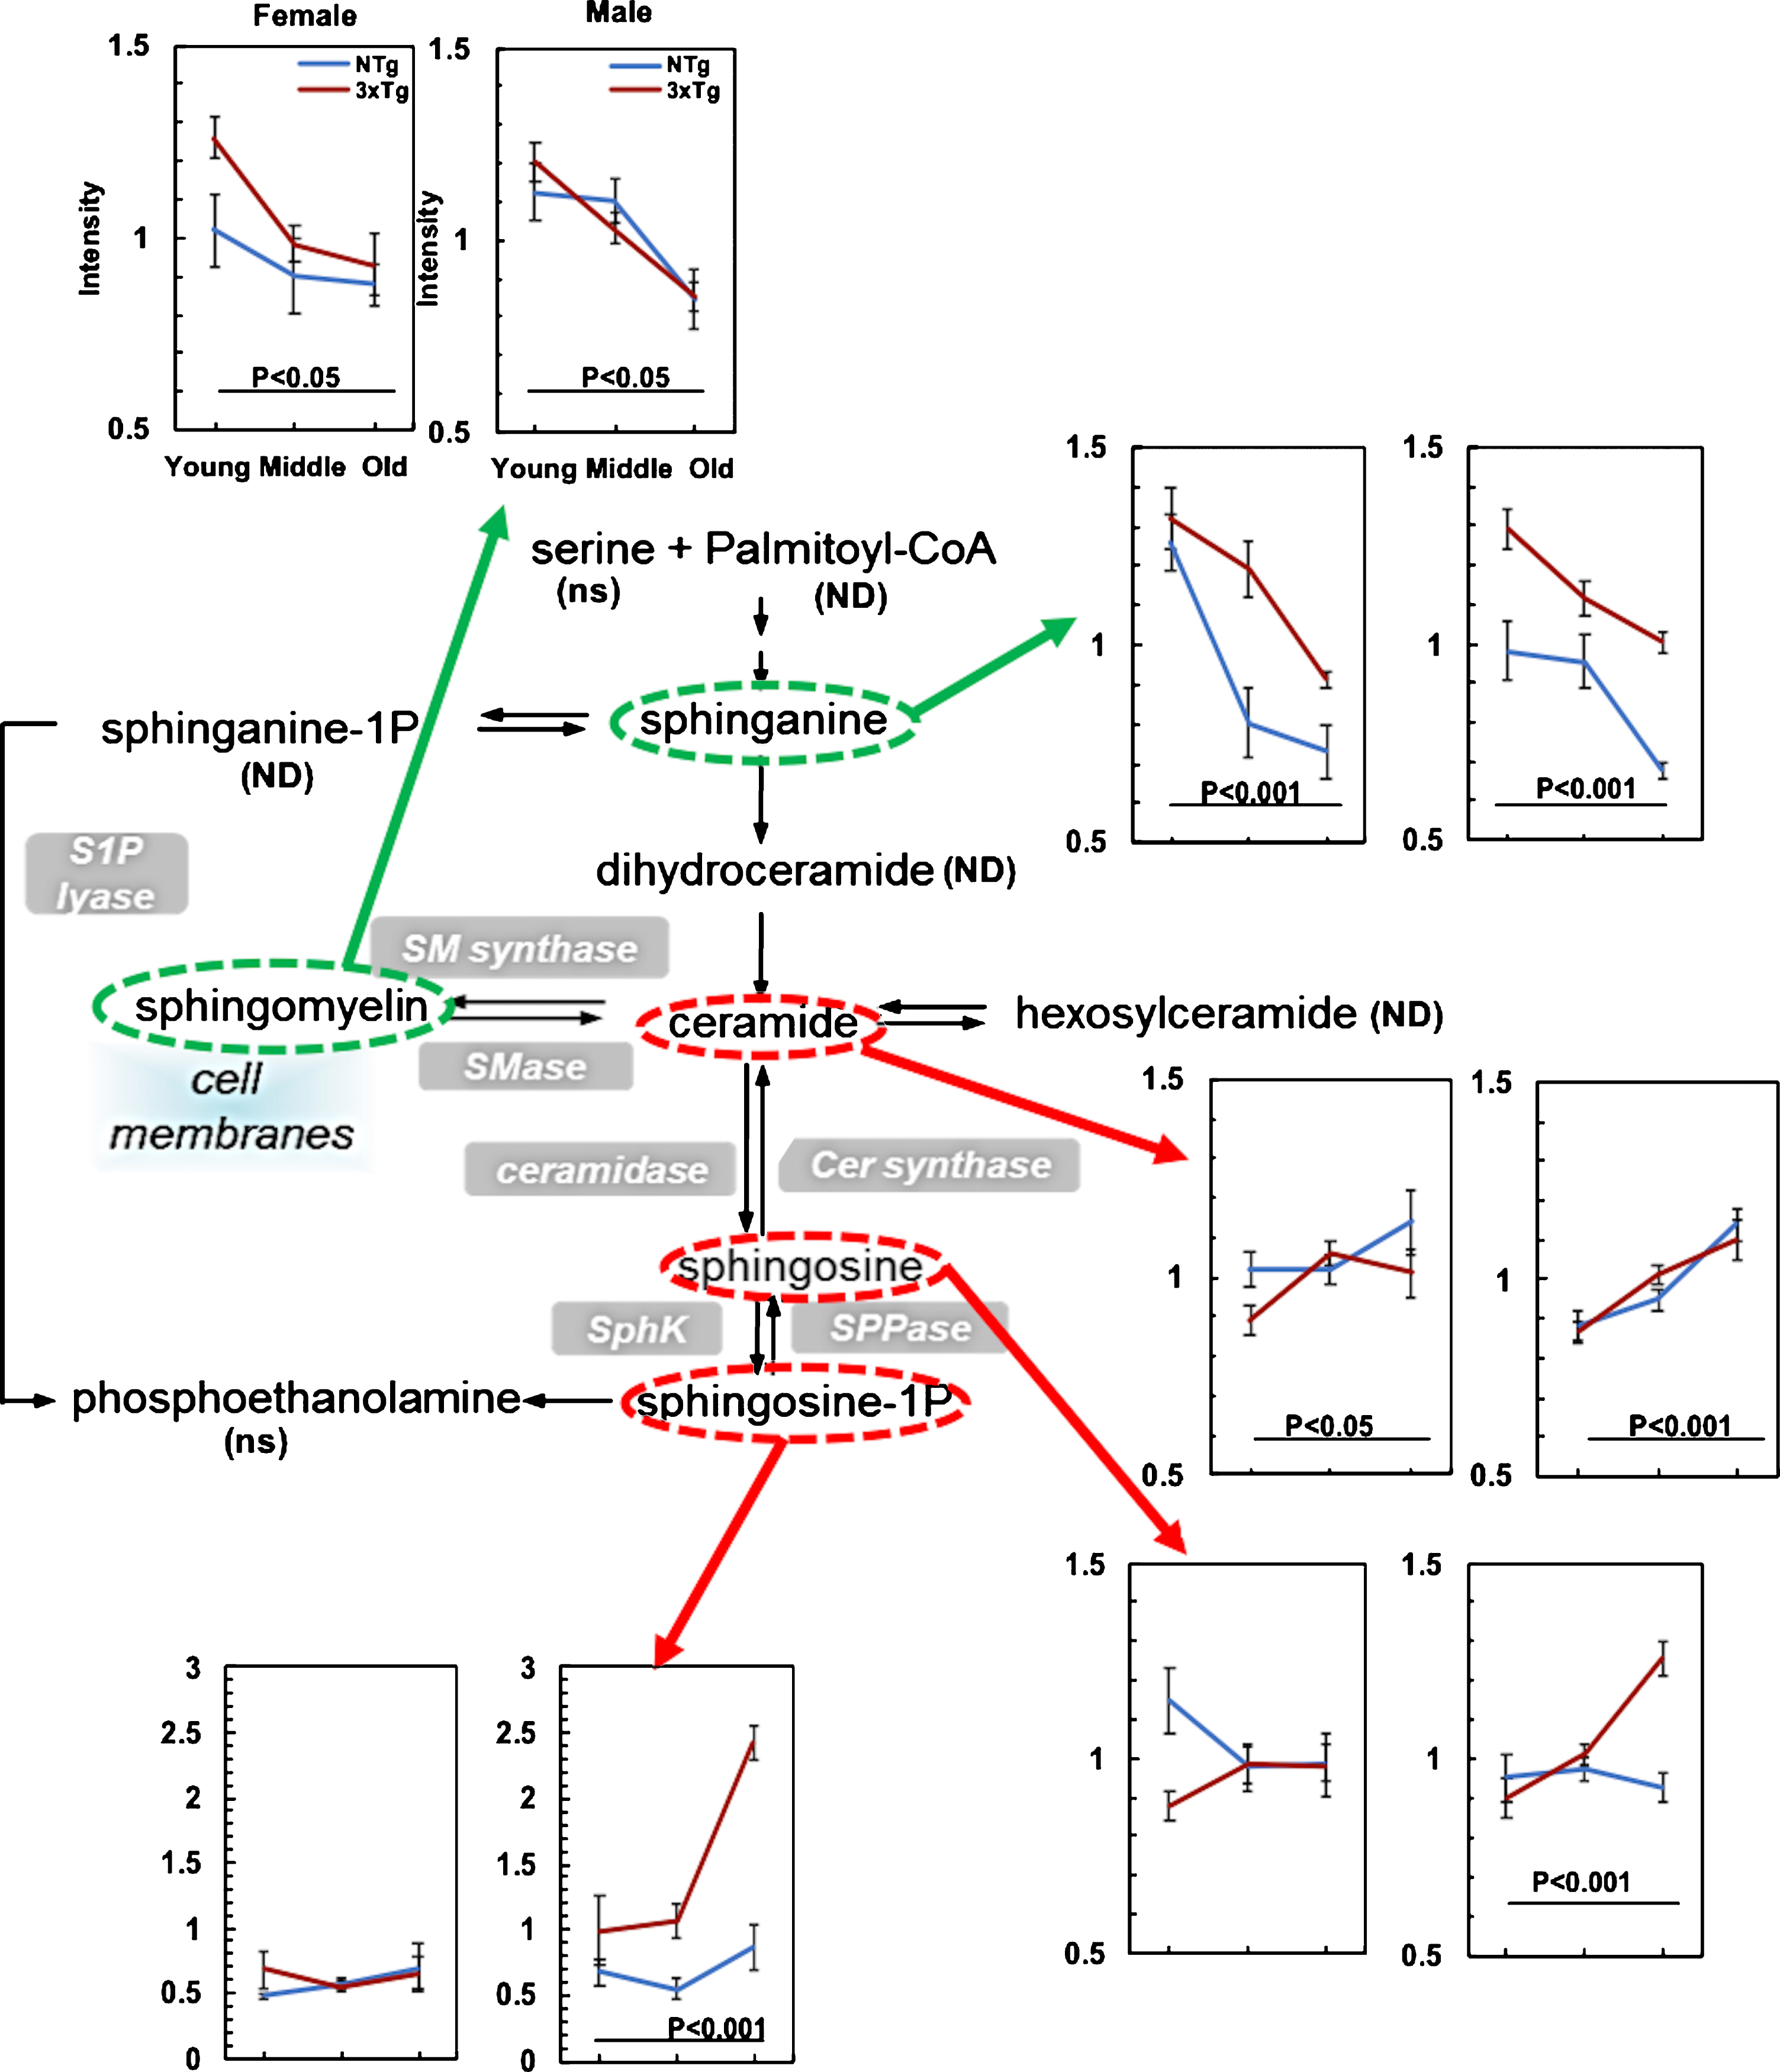
Table 1
Age-related metabolic shifts in upstream and downstream of redox dehydrogenases (fold change with age)
| Upstream Substrate | NTg | 3xTg-AD | Downstream Product | NTg | 3xTg-AD | |||||||||
| F | M | Avg. | F | M | Avg. | F | M | Avg. | F | M | Avg. | |||
| Glycolysis | ||||||||||||||
| GAPDH | G6P | – 2 | – 1.7 | – 1.6 | – 1.4 | 3PG | 1.6 | 2 | 2.8 | 1.9 | ||||
| F6P | – 2 | – 1.6 | – 1.4 | – 1.4 | PEP | 1.7 | 2 | 2.7 | 1.9 | |||||
| DHAP | – 1.2 | – 1.1 | 1.2 | – 1.3 | *c | |||||||||
| LDH | Pyruvate | – 1.8 | – 1.4 | – 2 | – 2.4 | lactate | – 1.08 | *b | 1.15 | *b | ||||
| Avg.(F + M) | – 1.60 | – 1.29 | Avg.(F + M) | 1.24 | 2.09 | |||||||||
| S.E. | 0.13 | 0.41 | S.E. | 0.66 | 0.34 | |||||||||
| N= | 8 | 8 | N= | 5 | 5 | |||||||||
| TCA cycle | ||||||||||||||
| PDH | Pyruvate | – 1.8 | – 1.4 | – 2 | – 2.4 | Acetyl-CoA | 1.8 | 2.6 | 2.5 | 2.3 | ||||
| IDH | Cis-aconitate | – 1.9 | – 1.4 | – 1.4 | – 1.1 | a-KG | 1.17 | – 1.1 | – 1.08 | – 1.2 | ||||
| GDH | Glutamate | *b | – 1.1 | *b | – 1.1 | *c | ||||||||
| KGDHC | a-KG | 1.17 | – 1.1 | – 1.08 | – 1.2 | ND | ||||||||
| SDH | Succinate | – 1.1 | – 1.4 | *a | – 1.2 | – 1.3 | *a | Fumarate | *b | 1.4 | – 1.2 | – 1.3 | ||
| MDH | Malate | *b | – 1.1 | *b | – 1.1 | ND | ||||||||
| Avg.(F + M) | – 1.11 | – 1.39 | Avg.(F + M) | 1.17 | 0.0033 | |||||||||
| S.E. | 0.28 | 0.15 | S.E. | 0.69 | 0.83 | |||||||||
| N= | 10 | 10 | N= | 5 | 6 | |||||||||
| Total Effect | ||||||||||||||
| Avg.(F + M) | – 1.33 | – 1.34 | Avg.(F + M) | 1.21 | 0.95 | |||||||||
| S.E. | 0.17 | 0.19 | S.E. | 0.42 | 0.56 | |||||||||
| N= | 18 | 18 | N= | 10 | 11 | |||||||||
| T-test | (Up versus Down) | |||||||||||||
| NTg | 3xTg | |||||||||||||
| p value | 3E-07 | 4E-05 | ||||||||||||
Fold change (FC) with age = larger values / smaller values in young versus old measurements. *a, middle-age versus old; *b, missing value ratio was 1.0, which could not be assigned a negative or positive direction; *c, metabolites already listed. “+” indicates metabolite levels increased with age; “– ” indicates metabolite level decreased with age. GAPDH, glyceraldehyde 3-phosphatedehydrogenase; LDH, lactate dehydrogenase; PDH, pyruvate dehydrogenase; IDH, isocitrate dehydrogenase; GDH, glutamate dehydrogenase; KGDHC, alpha-ketoglutarate-dehydrogenase complex; SDH, succinate dehydrogenase; F, female; M, male.
Age-related metabolic shifts sensed at NAD+/NADH redox reactions
Since we found age- and AD-related depletion in the NAD pool size and free NADH levels in mitochondria of hippocampal neurons from NTg and 3xTg-AD mouse brains [35] and an increased ratio of NAD+/NADH indicating an oxidative shift in these mice [34], we specifically examined metabolite levels upstream and downstream of dehydrogenases that sense the NAD+/NADH redox sites. Table 1 dichotomizes fold-changes with age in upstream substrates of 9 dehydrogenases compared to their downstream metabolites. Interestingly, in energy-producing metabolic pathways, including glycolysis and the TCA cycle, age drove decreased levels of the upstream substrates of dehydrogenases while downstream substrates increased in both of NTg (T-test upstream versus downstream substrates, p = 3×10⁻⁷, n = 8 reactions, 18 upstream metabolites versus 10 downstream metabolites) and 3xTg-AD (T-test, p = 4×10⁻⁵). Glycolytic substrates were markedly depleted upstream of GAPDH, while GAPDH downstream products were enriched 2.7– 2.8-fold, especially in female 3xTg-AD. Small decrease in lactate in NTg product may indicate utilization by neurons as described; small increase in 3xTg-AD may indicate failure to do so because of susceptibility to acidosis [53]. In the TCA cycle, αKG was actually decreased, but only 1.1– 1.2-fold in 3xTg-AD. Overall, for NTg, age drove a 2.5-fold metabolic shift in the upstream versus downstream substrates of dehydrogenases and a slightly lower with 2.3-fold metabolic shift in 3xTg-AD samples (Table 1). These overall age-associated effects on decreased upstream substrate levels with increased downstream substrate levels suggests an age-related rise in NAD+-dependent dehydrogenase rates to make NADH with a decreased ability to process the products leading to accumulated levels of downstream metabolites. Other energy-redox components were detected but showed less significant changes with age, including coenzyme A (CoA), flavin adenine dinucleotide (FAD), flavin mononucleotide (FMN), and NAD (p≥0.05). Further redox-controlled enzymatic measurements in aging and 3xTg-AD mouse brains will need to be completed for validation. In BCAA metabolism catalyzed by branched-chain α-ketoacid dehydrogenase complex (BCKDH complex), the last step is to re-oxidize FADH2 to FAD while reducing NAD+ to NADH. BCKDH converts BCAAs into acyl-CoA derivatives, which are converted into acetyl-CoA or succinyl-CoA. Overall, we found age-related 2-fold increases in acetyl-CoA for input into the TCA cycle in hippocampal neurons from both NTg and 3xTg-AD genotypes.
Based on our observations, we considered whether age- and AD-associated oxidized in NAD+/NADH redox potentials, triggered the metabolic shifts sensed at the NAD+/NADH redox sites in the enzymatic reactions and drove the direction for more NADH and ATP generation as a compensatory effect in response to the energetic deficits for NADH and ATP replenishment. However, age- and AD-related oxidized shifts impaired mitochondrial functions and lower the activities in TCA cycle and ETC-OXPHOS resulting in declines NADH production from the TCA cycle and further leading to an energetic shortage state with insufficient ATP levels. Supported by our results, we observed dramatically upregulated metabolic branches feeding into the TCA cycle including fatty acid oxidation, BCAA metabolism, and glutaminolysis. In contrast, the metabolite levels in the TCA cycle decreased with aging and AD. This suggests that either enzymatic rates were lower with age in the TCA cycle or the ETC-OXPHOS was impaired in mitochondria during aging and AD.
DISCUSSION
In this work, we determined the age-, AD-, and gender-associated global metabolomic shifts of mouse hippocampal tissue by using untargeted (unbiased) UPLC-MS/MS. We observed specific metabolic features and patterns in age and AD mouse brains including glycolysis, TCA cycle, glutamate metabolism, fatty acid metabolism, and sphingolipid metabolism, suggesting shifts in metabolic pathways. Moreover, many of the metabolic shifts were common to both age and AD-genotype. Of note, our results showed age-related deficiencies in energy-generating pathways in glycolysis and the TCA cycle. In the glycolysis-PPP pathways, we observed declines in the first half of glycolysis involved in ATP consumption and downstream intermediates in PPP. Metabolites in the second half of glycolysis associated with ATP production were upregulated in old age of both NTg and 3xTg-AD. As the detected metabolic profiles in different ages, genotypes and genders were steady-state snap shots, the metabolite levels reflect net effects of upstream enzymatic production and downstream enzymatic consumption. We propose that these metabolic shifts serve not only to maximize ATP production to meet increased age and AD-related demand, but also serve to maintain redox balance and maximize NADH production for maximum generation of ATP from oxidative phosphorylation [14]. Interestingly, this energetic shift occurs at the 9 NAD-dependent dehydrogenase steps in glycolysis, the TCA cycle and inputs to the TCA cycle that we feature in Table 1. We noticed remarkable declines in substrates with increases in products for both genotypes. This indicates that with age, dehydrogenases in old age neurons operate to consume substrates at faster rates than that of younger ages leading to age-related accumulations of downstream products. This scenario is consistent with greater energy demands with age. However, since the NAD pool (NAD+NADH+NADP+NADPH) declines with age systemically [54] and in our mouse brains [34], NADH available for oxidative phosphorylation would also decline. We found that the free NADH available in mitochondria declines with age by 43% in the same NTg mouse hippocampal regions and 50% with age in the 3xTg-AD [35]. Together, these results suggest a critical NAD+/NADH role in regulation of metabolism as a redox sensor in aging and AD. The age- and AD-related depletion on NAD and NADH pool sizes may limit the activities of dehydrogenases, metabolic shifts and ATP production. Besides, the age- and AD-related energy deficits, we observed enhanced input to the PPP pathway with lower downstream intermediates with age. This suggests a response to oxidative stress in age and AD brains that causes a rise in PPP with more NADPH production for antioxidant defense. Perturbations in glutamate and sphingolipid metabolisms suggested age- and AD-related impairments at synapses and in myelinated axons involved with memory.
Glycolysis and the TCA cycle
Compared to non-demented controls, positron emission tomography with 2-deoxy-2-[fluorine-18]-D-glucose (18F-FDG PET) in AD patients exhibit a metabolic pattern of bilateral temporo-parietal hypometabolism [55] and reduced blood flow [56]. We observed greater age- and AD-associated declines of glucose levels in hippocampal regions in females. Altered glucose levels were the net effects of a failure to increase glucose uptake under stress [57] and consumption in the downstream metabolic pathways including the glycolysis-PPP pathway. Further, we found aging dramatically upregulated intermediates in glycolytic steps of ATP production including 3-phosphoglycerate and phosphoenol pyruvate. Moreover, AD genetic load drove increases two-fold higher than the age-matched NTg male samples. Downstream of the NAD+-dependent GAPDH, pyruvate levels decreased as much as 2-fold, especially in the 3xTg-AD samples. Administration of pyruvate prevented the development of age-related cognitive impairments in 3xTg-AD mouse brains without reducing AD pathologies of amyloid and tau [58]. Pyruvate as the end metabolite in glycolysis is transported into mitochondria via the mitochondrial pyruvate carrier. Inhibition of mitochondrial pyruvate carrier was reported to diminish the neurodegeneration in Parkinson’s disease by augmentation of autophagy [59, 60]. The TCA cycle plays a central role in glucose metabolism with multiple points of influx at different intermediate sites, such as fatty acid β-oxidation via acetyl-CoA, BCCA catabolism via succinyl-CoA, and glutamine-glutamate metabolism via α-ketoglutarate, aspartate, and phenylalanine. In AD patients, mitochondrial abnormalities are associated with decreases of enzymatic activity in the first half of the TCA cycle, including pyruvate dehydrogenase, isocitrate dehydrogenase, and α-ketoglutarate dehydrogenase (KGDHC) [1], but an age-related basis for these changes has not been determined and their fluxes in vivo depend on substrate and product concentrations. When the thiamine-dependent KGDHC was deprived of thiamine in an AD mouse model, mitochondrial KGDHC activity decreased 43% and promoted early formation of plaques and tangles [61]. Activity of cytochrome c oxidase decreased by 50% with age from 3 to 12 months in 3xTg-AD female mouse brain and PDH activity declined by 55% [62]. PDH activity in brain mitochondria was also found to be decreased by 25% and 45% in mitochondria from 14- and 24-month-old rat brains [63]. In our results, we observed up to 2-fold declines in pyruvate levels with age, worse in the AD-genotype, followed by 2-fold increases of acetyl-CoA with higher levels in the 3xTg-AD. Nearly 60% of nuclear genes encoding subunits of mitochondrial electron transport chain showed significantly lower expression in hippocampal CA1 of human AD cases brains [64]. Together, these results suggest that during aging and AD, the lower activity of the TCA cycle may indicate a metabolic-energy blockage to power ATP generation in the ETC-OXPHOS pathways.
Inputs to the TCA cycle
Among those metabolites that provide influx into the TCA cycle, fatty acids for β-oxidation and glutamine were upregulated with age and AD, possibly indicating a cellular need for maximizing generation of energy. The downregulated intermediates with age and AD in the TCA cycle together with accumulated inputs to TCA cycle suggest a lower capacity for load-driven demand for NADH to make ATP via the TCA cycle-OXPHOS pathways. A neuron energy crisis with reduced ATP synthesis can cascade into ionic pump dysfunction [65], signal transduction breakdown [66], neurotransmitter failure [67], increased cleavage of the amyloid-β protein precursor [68], microtubule damage [69], tau hyperphosphorylation [70], which all promote neurodegeneration and region-specific neuroglial death [71]. Together with the observation of “mitochondria-on-a-string” due to mitochondrial fission in 5 transgenic AD mouse models and brain tissue of AD patients [72] and decreased free NADH levels with age and AD in 3xTg-AD brains [35], these results are consistent with the hypothesis that age-related mitochondrial metabolic deficits pivoting at NAD+/NADH redox sensitive sites contribute to the systematic complexity of brain aging and AD.
FA oxidation
Redox steps in fatty acid β-oxidation first involve oxidation by FAD in acyl-CoA dehydrogenase followed by an oxidation by NAD+ in 3-hydroxyacyl-CoA dehydrogenase inside mitochondria [73]. An age-related oxidized NAD+/NADH redox state promote FA oxidation by converting NAD+ to NADH and FAD into FADH2. We observed a 2-fold elevation in FA oxidation with aging in NTg and 3xTg-AD mouse brains, suggesting that fatty acid β-oxidation may be driven by an oxidized redox state with aging. In each cycle of oxidation, two carbons are cleaved from a fatty acid to release acetyl-CoA. During the last step of each FA oxidation cycle, thiolase cleaves between the C2 and C3 of 3-ketoacyl-CoA to release two carbons as acetyl-CoA. The generated acetyl-CoA enters the TCA cycle for more NADH production to power OXPHOS and the generation of ATP. Interestingly, the thiolase that catalyzes two acetyl-CoA molecules to form acetoacetyl-CoA in Clostridium has a regulatory redox-switch [74]. The increased acetyl-CoA with age indicates excess production that does not enter into the TCA cycle stoichiometrically and is not used as much with age by Sirtuins or other acetylations. As the redox potential of NAD+/NADH is oxidized with aging and AD, this could drive the direction of FA oxidation reactions for more acetyl-CoA production. The age- and AD- related increased fatty acid β-oxidation and elevated production of acetyl-CoA could be a metabolic response to lessen energetic shortages. Adiponectin secreted by adipocytes plays an important role in stimulating glucose utilization and fatty acid oxidation via activation of 5’-AMP-activated protein kinase, suggesting a novel intervention to regulate glucose and fatty acid metabolism [75]. Efforts to elevate acetyl-CoA by overexpression of AT-1 in mice results in a progeria phenotype [76], suggesting that raising acetyl-CoA is limited or outright pathologic. Moreover, disturbances of fatty acid metabolism and increased in polyunsaturated fatty acids in age and AD brains is associated with upregulation of inflammatory signaling in neurodegenerative diseases [77]. Increased polyunsaturated fatty acids provide prostaglandins, leukotrienes, and thromboxanes, which increase inflammatory signaling [78], further promoting neurodegenerative processes. An mRNA microarray study on 759 innate immune genes, from human brains with AD and normal cognitive controls, revealed widespread upregulation of genes associated with inflammation in human aging correlated to cognitive declines [79]. Another study found elevated blood levels of fatty acids in MCI prognostic for conversion to AD [80].
Branched chain amino acids
Although we did not find age-related hippocampal changes in isoleucine, leucine, or valine, their oxidation by NAD+ in the BCKDH complex produces NADH, to maintain redox balance and feed OXPHOS. Increased BCAA metabolites in human plasma such as isoleucine are positively correlated with AD [81]. BCAAs are elevated with age in serum of human AD and 3xTg-AD mice [82]. The important question is whether this is protective or pathologic. In the 3xTg-AD mouse fed with a BCAA-supplemented high-fat diet for 2 months, tau and amyloid pathologies worsened leading to an increase in the mortality of two-thirds of the mice from 6 to 16 months [83]. This intervention suggests that BCAA and fatty acids are not limiting to energy production and that excess levels are pathologic, but systemic stress could also be important, independent of brain metabolism. Conversely, a low BCAA diet was found to improve recognition memory in 18-month-old 3xTg-AD mice [83]. Taken together, the BCAA metabolites levels in plasma may serve as a biomarker for an AD metabolic switch and pathology.
Lactate
Our results showed remarkable increases in the ratio of lactate/pyruvate levels as a function of age in both NTg and 3xTg-AD mouse brains. Notably, declines in pyruvate with small changes in lactate levels with aging and AD, indicate a balance of rates between production of lactate by LDH and the rates of either utilization or removal into blood. Alternative energy supplies were found to be upregulated in age and AD brains, such as lactate [84] and ketone bodies (KB) [24]. Lactate increased 1.5-fold in AD patient serum compared to the healthy control subjects [85]. CSF lactate levels in AD patients increased 20% compared to age-matched controls [86]. Lactate increased two-fold with age in mtDNA mutator mice with a metabolic shift from pyruvate to more lactate production [87]. Lactate is a preferred energy substrate to maintain redox balance and neuronal activity especially during glucose deprivation [84]. Memory in rats was dependent on neuronal import of lactate from astrocytes via the monocarboxylate transporter [88]. Astrocyte-neuron lactate transport is critical for long-term memory formation [89]. In aging wild-type mouse brains, improved memory performance correlated with elevated expression of glycolytic enzymes. Yet this age-related increase in glycolytic enzyme expression with elevated lactate levels in APP/PS1 mice were associated with poorer memory performance [90]. Again, whether the age- and AD-correlated alterations in lactate levels play a rescue role to release the energetic deficits or in turn to exacerbate the AD pathologies needs to be further investigated. Our failure to detect significant changes in lactate in the hippocampus with age suggests though lactate may be an alternative energy source during age-related energetic shortage, it did not accumulate in old age NTg or 3xTg-AD hippocampus, likely by increased activity of LDH to maintain redox balance [14].
Ketone bodies as another alternative energetic source
In our results, we observed an age-related 40– 55% decline in the levels of 3-hydroxybutyrate in the 3xTg-AD samples of both genders (p < 0.05), indicating a possible higher utilization of KB as an energetic source in aging and AD brains. KB are another alternative energy substrate, which derive from the incomplete oxidation of fatty acids in the liver. Three KB including acetone, acetoacetate, and β-hydroxybutyrate are interconvertible and metabolized to succinyl-CoA feeding into the TCA cycle with generation of NADH for energy production during energetic demand [91, 92]. As administration of KB can bypass the AD-related blockage in PDH and insulin resistance and provide needed NADH for redox balance, mild ketosis provides a potential therapy for AD [93]. Diet supplementation with pyruvate (5 mM) and β-hydroxybutyrate (4 mM) for 5 weeks showed diminished neuronal hyper-excitability in 3xTg-AD mice [94, 95]. Compared to normal levels of KB less than 0.1 mM in blood and pathological ketoacidosis of 15– 25 mM, nutritional ketosis from a low-carbohydrate- high-fat diet raised blood KB to 7-8 mM and reduced total Aβ loads in a mouse model of AD [96, 97]. Importantly, nutritional ketosis increases NAD+/NADH redox states in young healthy human brains [98]. Even though ketones cannot completely replace glucose for energy source, mild experimental ketonemia in rats improves brain glucose uptake [99, 100], probably by improved redox balance. In another AD mouse model, a ketogenic diet reduced total Aβ40 and Aβ42 pathologic load [101]. The expression of monocarboxylate transporters for transporting lactate and KB increased in female brains at 12 months in NTg but earlier at 3-month in 3xTg-AD, indicating the activation of the ketogenic pathway [24]. Our data of an age-dependent decline in 3-hydroxybutyrate levels in 3xTg-AD hippocampus adds to the above findings to suggest that a therapeutic ketogenic diet may supply extra NADH reductive energy and maximize generation of energy. However, further studies are needed to uncover the mechanism of potential beneficial effect of dietary KB considering the contradictory roles of ketosis on anorexigenic and orexigenic signals [97].
Glutamate
In our NTg and 3xTg-AD mouse model, glutamate, GABA, NAAG, and NAA markedly declined with age, suggesting decreased availability of synaptic neurotransmitters. NMDA receptors rely on glutamate to induce hippocampal long-term potentiation of synapses for learning and memory [102, 103]. As glutamine functions as a cellular energy source, the age-related elevations in glutamine suggest increased energetic demand in aged brains. In Fig. 4, age-related declines in glutamate with increased glutamine may be due to more consumption of glutamate. Decreased levels of glutamate [104], NAAG, and NAA are associated with disorders of learning and memory [105] and pathogenesis of AD [106]. Glutamatergic neurotransmission in hippocampus is severely disrupted in AD [107, 108]. The decline in neurotransmitters with age could be a response to decreased energy available to maintain ionic homeostasis associated with neurotransmission and feedback to reduce excitotoxicity.
Sphingolipids
Our results of age- and AD-related patterns of upregulation of ceramide and sphingosine-1-phosphate suggest increased inflammation with age and AD. Sphingolipid metabolism is deregulated in AD brains with a pattern of elevated acid sphingomyelinase and acid ceramidase expression [109]. Elevated ceramides and sphingosine-1-phosphate as signaling molecules correlate with inflammation [110]. Since the oxidized redox potentials of Cys/CySS in human plasma were positively corelated with interleukin-1β levels [111], our results of an oxidative shift with age in neurons (Dong, Digman, Brewer, unpublished data) could promote inflammation. Additionally, sphingolipids mediate synaptic plasticity [112], and disturbances in sphingolipid content correlated with impairment in memory and learning [113]. Studies of 30 human plasma samples from each group of AD, MCI, and normal control subjects revealed remarkable declines in sphingomyelin, especially in females [114].
Conclusions
According to the epigenetic oxidative redox shift aging theory [14], we hypothesized that an age-associated sedentary behavior triggers oxidative shifts and mitochondrial impairments, which cause downstream cascades. To offset the age-related energetic deficits, redox-sensitive epigenetic modification enforces metabolic shifts in aging brains. Here, we found evidence for a metabolic pivot at redox-dependent bioenergetic enzymes that generate NADH. Age- and AD-associated oxidized NAD+/NADH redox states (increased ratio) [34, 35, 115, 116] could signal metabolic re-direction for more NADH generation by epigenetics, redox-sensitive transcription factors [117, 118], redox sensing cysteines in the enzyme [119], nitration of KGDHC [120], acylation of KGDHC [121], or NAD+/NADH substrate limitations [122]. However, lower levels of metabolites in the TCA cycle suggests a limitation or blockage at the TCA cycle, depriving the ETC-OXPHOS of NADH for ATP generation [1]. The NAD+/NADH redox couple is likely to function as a sensor for dehydrogenases at the pivot of upstream and downstream metabolites in pathways including glycolysis, the TCA cycle, fatty acid oxidation and BCAA metabolism. The age- and AD-related oxidative shifts with drops of NAD pool size are sensed by NADH redox sites in the metabolic pathways and serve as a switch to affect the rate or direction of metabolic flux. Taken together with the age- and AD-associated energetic shortage, metabolic upregulation in fatty acid metabolism likely generates NADH as an alternative to carbohydrate oxidation to maintain redox balance and maximize energetic capacity.
ACKNOWLEDGMENTS
We appreciate the help of Justyna Maria Sosna for mouse genotyping in Prof. Charles Glabe‘s laboratory and Robert Herrera for sample collection. This work was supported by the UC Irvine Foundation and a grant from the NIH RF1 AG058218.
Authors’ disclosures available online (https://www.j-alz.com/manuscript-disclosures/19-0408r1).
SUPPLEMENTARY MATERIAL
[1] The supplementary material is available in the electronic version of this article: http://dx.doi.org/10.3233/JAD-190408.
REFERENCES
[1] | Bubber P , Haroutunian V , Fisch G , Blass JP , Gibson GE ((2005) ) Mitochondrial abnormalities in Alzheimer brain: Mechanistic implications. Ann Neurol 57: , 695–703. |
[2] | Zhu X , Su B , Wang X , Smith MA , Perry G ((2007) ) Causes of oxidative stress in Alzheimer disease. Cell Mol Life Sci 64: , 2202–2210. |
[3] | Wang X , Zhu M , Hjorth E , Cortes-Toro V , Eyjolfsdottir H , Graff C , Nennesmo I , Palmblad J , Eriksdotter M , Sambamurti K , Fitzgerald JM , Serhan CN , Granholm AC , Schultzberg M ((2015) ) Resolution of inflammation is altered in Alzheimer’s disease. Alzheimers Dement 11: , 40–50.e1-2. |
[4] | Reddy PH , Yin X , Manczak M , Kumar S , Pradeepkiran JA , Vijayan M , Reddy AP ((2018) ) Mutant APP and amyloid beta-induced defective autophagy, mitophagy, mitochondrial structural and functional changes and synaptic damage in hippocampal neurons from Alzheimer’s disease. Hum Mol Genet 27: , 2502–2516. |
[5] | Perez Ortiz JM , Swerdlow RH ((2019) ) Mitochondrial dysfunction in Alzheimer’s disease: Role in pathogenesis and novel therapeutic opportunities. Br J Pharmacol, doi: 10.1111/bph.14585. |
[6] | Wu L , Zhang X , Zhao L ((2018) ) Human ApoE isoforms differentially modulate brain glucose and ketone body metabolism: Implications for Alzheimer’s disease risk reduction and early intervention. J Neurosci 38: , 6665–6681. |
[7] | Alzheimer’s Association ((2016) ) 2016 Alzheimer’s disease facts and figures. Alzheimers Dement 12: , 459–509. |
[8] | Wirth M , Villeneuve S , Haase CM , Madison CM , Oh H , Landau SM , Rabinovici GD , Jagust WJ ((2013) ) Associations between Alzheimer disease biomarkers, neurodegeneration, and cognition in cognitively normal older people. JAMA Neurol 70: , 1512–1519. |
[9] | Cutler RG , Kelly J , Storie K , Pedersen WA , Tammara A , Hatanpaa K , Troncoso JC , Mattson MP ((2004) ) Involvement of oxidative stress-induced abnormalities in ceramide and cholesterol metabolism in brain aging and Alzheimer’s disease. Proc Natl Acad Sci U S A 101: , 2070–2075. |
[10] | Muller WE , Eckert A , Kurz C , Eckert GP , Leuner K ((2010) ) Mitochondrial dysfunction: Common final pathway in brain aging and Alzheimer’s disease–therapeutic aspects. Mol Neurobiol 41: , 159–171. |
[11] | Mattson MP , Arumugam TV ((2018) ) Hallmarks of brain aging: Adaptive and pathological modification by metabolic states. Cell Metab 27: , 1176–1199. |
[12] | Du J , Ma M , Zhao Q , Fang L , Chang J , Wang Y , Fei R , Song X ((2013) ) Mitochondrial bioenergetic deficits in the hippocampi of rats with chronic ischemia-induced vascular dementia. Neuroscience 231: , 345–352. |
[13] | Yin F , Sancheti H , Patil I , Cadenas E ((2016) ) Energy metabolism and inflammation in brain aging and Alzheimer’s disease. Free Radic Biol Med 100: , 108–122. |
[14] | Brewer GJ ((2010) ) Epigenetic oxidative redox shift (EORS) theory of aging unifies the free radical and insulin signaling theories. Exp Gerontol 45: , 173–179. |
[15] | Seshadri S , Fitzpatrick AL , Ikram MA , DeStefano AL , Gudnason V , Boada M , Bis JC , Smith AV , Carassquillo MM , Lambert JC , Harold D , Schrijvers EM , Ramirez-Lorca R , Debette S , Longstreth WT Jr. , Janssens AC , Pankratz VS , Dartigues JF , Hollingworth P , Aspelund T , Hernandez I , Beiser A , Kuller LH , Koudstaal PJ , Dickson DW , Tzourio C , Abraham R , Antunez C , Du Y , Rotter JI , Aulchenko YS , Harris TB , Petersen RC , Berr C , Owen MJ , Lopez-Arrieta J , Varadarajan BN , Becker JT , Rivadeneira F , Nalls MA , Graff-Radford NR , Campion D , Auerbach S , Rice K , Hofman A , Jonsson PV , Schmidt H , Lathrop M , Mosley TH , Au R , Psaty BM , Uitterlinden AG , Farrer LA , Lumley T , Ruiz A , Williams J , Amouyel P , Younkin SG , Wolf PA , Launer LJ , Lopez OL , van Duijn CM , Breteler MM , Consortium C , Consortium G , Consortium E ((2010) ) Genome-wide analysis of genetic loci associated with Alzheimer disease. JAMA 303: , 1832–1840. |
[16] | Gjoneska E , Pfenning AR , Mathys H , Quon G , Kundaje A , Tsai LH , Kellis M ((2015) ) Conserved epigenomic signals in mice and humans reveal immune basis of Alzheimer’s disease. Nature 518: , 365–369. |
[17] | Miller JA , Horvath S , Geschwind DH ((2010) ) Divergence of human and mouse brain transcriptome highlights Alzheimer disease pathways. Proc Natl Acad Sci U S A 107: , 12698–12703. |
[18] | Manavalan A , Mishra M , Feng L , Sze SK , Akatsu H , Heese K ((2013) ) Brain site-specific proteome changes in aging-related dementia. Exp Mol Med 45: , e39. |
[19] | Kiddle SJ , Sattlecker M , Proitsi P , Simmons A , Westman E , Bazenet C , Nelson SK , Williams S , Hodges A , Johnston C , Soininen H , Kloszewska I , Mecocci P , Tsolaki M , Vellas B , Newhouse S , Lovestone S , Dobson RJ ((2014) ) Candidate blood proteome markers of Alzheimer’s disease onset and progression: A systematic review and replication study. J Alzheimers Dis 38: , 515–531. |
[20] | Trushina E , Dutta T , Persson XM , Mielke MM , Petersen RC ((2013) ) Identification of altered metabolic pathways in plasma and CSF in mild cognitive impairment and Alzheimer’s disease using metabolomics. PLoS One 8: , e63644. |
[21] | Zierer J , Menni C , Kastenmuller G , Spector TD ((2015) ) Integration of ‘omics’ data in aging research: From biomarkers to systems biology. Aging Cell 14: , 933–944. |
[22] | de Magalhaes JP , Curado J , Church GM ((2009) ) Meta-analysis of age-related gene expression profiles identifies common signatures of aging. Bioinformatics 25: , 875–881. |
[23] | Gomase VS , Changbhale SS , Patil SA , Kale KV ((2008) ) Metabolomics. Curr Drug Metab 9: , 89–98. |
[24] | Ding F , Yao J , Rettberg JR , Chen S , Brinton RD ((2013) ) Early decline in glucose transport and metabolism precedes shift to ketogenic system in female aging and Alzheimer’s mouse brain: Imlication for bioenergetic intervention, PLoS One 8: , e79977. |
[25] | Gage FH , Kelly PA , Bjorklund A ((1984) ) Regional changes in brain glucose metabolism reflect cognitive impairments in aged rats. J Neurosci 4: , 2856–2865. |
[26] | Gumbiner B , Thorburn AW , Ditzler TM , Bulacan F , Henry RR ((1992) ) Role of impaired intracellular glucose metabolism in the insulin resistance of aging. Metabolism 41: , 1115–1121. |
[27] | Kaddurah-Daouk R , Zhu H , Sharma S , Bogdanov M , Rozen SG , Matson W , Oki NO , Motsinger-Reif AA , Churchill E , Lei Z , Appleby D , Kling MA , Trojanowski JQ , Doraiswamy PM , Arnold SE , Pharmacometabolomics Research Network ((2013) ) Alterations in metabolic pathways and networks in Alzheimer’s disease. Transl Psychiatry 3: , e244. |
[28] | Han X , Rozen S , Boyle SH , Hellegers C , Cheng H , Burke JR , Welsh-Bohmer KA , Doraiswamy PM , Kaddurah-Daouk R ((2011) ) Metabolomics in early Alzheimer’s disease: Identification of altered plasma sphingolipidome using shotgun lipidomics. PLoS One 6: , e21643. |
[29] | Pan X , Nasaruddin MB , Elliott CT , McGuinness B , Passmore AP , Kehoe PG , Holscher C , McClean PL , Graham SF , Green BD ((2016) ) Alzheimer’s disease-like pathology has transient effects on the brain and blood metabolome. Neurobiol Aging 38: , 151–163. |
[30] | Ivanisevic J , Epstein AA , Kurczy ME , Benton PH , Uritboonthai W , Fox HS , Boska MD , Gendelman HE , Siuzdak G ((2014) ) Brain region mapping using global metabolomics. Chem Biol 21: , 1575–1584. |
[31] | Ivanisevic J , Stauch KL , Petrascheck M , Benton HP , Epstein AA , Fang M , Gorantla S , Tran M , Hoang L , Kurczy ME , Boska MD , Gendelman HE , Fox HS , Siuzdak G ((2016) ) Metabolic drift in the aging brain. Aging (Albany NY) 8: , 1000–1020. |
[32] | Zhao L , Mao Z , Woody SK , Brinton RD ((2016) ) Sex differences in metabolic aging of the brain: Insights into female suscetibility to Alzheimer’s disease. Neurobiol Aging 42: , 69–79. |
[33] | Hoyer S ((1998) ) Risk factors for Alzheimer’s disease during aging. Impacts of glucose/energy metabolism. J Neural Transm Suppl 54: , 187–194. |
[34] | Ghosh D , LeVault KR , Barnett AJ , Brewer GJ ((2012) ) A reversible early oxidized redox state that precedes macromolecular ROS damage in aging nontransgenic and 3xTg-AD mouse neurons. J Neurosci 32: , 5821–5832. |
[35] | Dong Y , Digman MA , Brewer GJ ((2019) ) Age- and AD-related redox state of NADH in subcellular compartments by fluorescence lifetime imaging microscopy. Geroscience 41: , 51–67. |
[36] | Aubert A , Costalat R , Magistretti PJ , Pellerin L ((2005) ) Brain lactate kinetics: Modeling evidence for neuronal lte uptake upon activation. Proc Natl Acad Sci U S A 102: , 16448–16453. |
[37] | Newington JT , Harris RA , Cumming RC ((2013) ) Reevaluating metabolism in Alzheimer’s disease from the perspective of the astrocyte-neuron lactate shuttle model. J Neurodegener Dis 2013: , 234572. |
[38] | Coco M , Caggia S , Musumeci G , Perciavalle V , Graziano AC , Pannuzzo G , Cardile V ((2013) ) Sodium L-lactate differently affects brain-derived neurothrophic factor, inducible nitric oxide synthase, and heat shock protein 70 kDa production in human astrocytes and SH-SY5Y cultures. J Neurosci Res 91: , 313–320. |
[39] | Yao J , Rettberg JR , Klosinski LP , Cadenas E , Brinton RD ((2011) ) Shift in brain metabolism in late onset Alzheimer’s disease: Implications for biomarkers and therapeutic interventions. Mol Aspects Med 32: , 247–257. |
[40] | Oddo S , Caccamo A , Shepherd JD , Murphy MP , Golde TE , Kayed R , Metherate R , Mattson MP , Akbari Y , LaFerla FM ((2003) ) Triple-transgenic model of Alzheimer’s disease with plaques and tangles: Intracellular Abeta and synaptic dysfunction. Neuron 39: , 409–421. |
[41] | Kasten TP , Mhaskar Y , Dunaway GA ((1993) ) Regulation of brain 6-phosphofructo-1-kinase: Effects of aging, fructose-2,6-bisphosphate, and regional subunit distribution. Mol Cell Biochem 120: , 61–68. |
[42] | Tilton WM , Seaman C , Carriero D , Piomelli S ((1991) ) Regulation of glycolysis in the erythrocyte: Role of the lactate/pyruvate and NAD/NADH ratios. J Lab Clin Med 118: , 146–152. |
[43] | Waagepetersen HS , Sonnewald U , Larsson OM , Schousboe A ((1999) ) Synthesis of vesicular GABA from glutamine involves TCA cycle metabolism in neocortical neurons. J Neurosci Res 57: , 342–349. |
[44] | Kam K , Nicoll R ((2007) ) Excitatory synaptic transmission persists independently of the glutamate-glutamine cycle. J Neurosci 27: , 9192–9200. |
[45] | Ödman P , Wellborn WB , Bommarius AS ((2004) ) An enzymatic process to α- ketoglutarate from l-glutamate: The coupled system l-glutamate dehydrogenase/NADH oxidase. Tetrahedron Asymmetry 15: , 2933–2937. |
[46] | Huang D , Liu D , Yin J , Qian T , Shrestha S , Ni H ((2017) ) Glutamate-glutamine and GABA in brain of normal aged and patients with cognitive impairment. Eur Radiol 27: , 2698–2705. |
[47] | Meyerhoff DJ , MacKay S , Bachman L , Poole N , Dillon WP , Weiner MW , Fein G ((1993) ) Reduced brain N-acetylaspartate suggests neuronal loss in cognitively impaired human immunodeficiency virus-seropositive individuals: in vivo 1H magnetic resonance spectroscopic imaging. Neurology 43: , 509–515. |
[48] | Lin AP , Shic F , Enriquez C , Ross BD ((2003) ) Reduced glutamate neurotransmission in patients with Alzheimer’s disease – an in vivo (13)C magnetic resonance spectroscopy study. MAGMA 16: , 29–42. |
[49] | Houten SM , Wanders RJ ((2010) ) A general introduction to the biochemistry of mitochondrial fatty acid beta-oxidation. J Inherit Metab Dis 33: , 469–477. |
[50] | Lehninger AL , Greville GD ((1953) ) The enzymic oxidation of alpha- and 2-beta-hydroxybutyrate. Biochim Biophys Acta 12: , 188–202. |
[51] | Okada T , Kajimoto T , Jahangeer S , Nakamura S ((2009) ) Sphingosine kinase/sphingosine 1-phosphate signalling in central nervous system. Cell Signal 21: , 7–13. |
[52] | Ferreira ST , Clarke JR , Bomfim TR , De Felice FG ((2014) ) Inflammation, defective insulin signaling, and neuronal dysfunction in Alzheimer’s disease. Alzheimers Dement 10: , S76–83. |
[53] | Brewer GJ ((1997) ) Effects of acidosis on the distribution of processing of the beta-amyloid precursor protein in cultured hippocampal neurons. Mol Chem Neuropathol 31: , 171–186. |
[54] | Imai S , Guarente L ((2014) ) NAD+ and sirtuins in aging and disease. Trends Cell Biol 24: , 464–471. |
[55] | Hoffman JM , Welsh-Bohmer KA , Hanson M , Crain B , Hulette C , Earl N , Coleman RE ((2000) ) FDG PET imaging in patients with pathologically verified dementia. J Nucl Med 41: , 1920–1928. |
[56] | Maki PM , Resnick SM ((2000) ) Longitudinal effects of estrogen replacement therapy on PET cerebral blood flow and cognition. Neurobiol Aging 21: , 373–383. |
[57] | Patel JR , Brewer GJ ((2003) ) Age-related changes in neuronal glucose uptake in response to glutamate and beta-amyloid. J Neurosci Res 72: , 527–536. |
[58] | Isopi E , Granzotto A , Corona C , Bomba M , Ciavardelli D , Curcio M , Canzoniero LM , Navarra R , Lattanzio R , Piantelli M , Sensi SL ((2015) ) Pyruvate prevents the development of age-dependent cognitive deficits in a mouse model of Alzheimer’s disease without reducing amyloid and tau pathology. Neurobiol Dis 81: , 214–224. |
[59] | Ghosh A , Tyson T , George S , Hildebrandt EN , Steiner JA , Madaj Z , Schulz E , Machiela E , McDonald WG , Escobar Galvis ML , Kordower JH , Van Raamsdonk JM , Colca JR , Brundin P ((2016) ) Mitochondrial pyruvate carrier regulates autophagy, inflammation, and neurodegeneration in experimental models of Parkinson’s disease. Sci Transl Med 8: , 368ra174. |
[60] | Quansah E , Peelaerts W , Langston JW , Simon DK , Colca J , Brundin P ((2018) ) Targeting energy metabolism via the mitochondrial pyruvate carrier as a novel approach to attenuate neurodegeneration. Mol Neurodegener 13: , 28. |
[61] | Karuppagounder SS , Xu H , Shi Q , Chen LH , Pedrini S , Pechman D , Baker H , Beal MF , Gandy SE , Gibson GE ((2009) ) Thiamine deficiency induces oxidative stress and exacerbates the plaque pathology in Alzheimer’s mouse model. Neurobiol Aging 30: , 1587–1600. |
[62] | Yao J , Irwin RW , Zhao L , Nilsen J , Hamilton RT , Brinton RD ((2009) ) Mitochondrial bioenergetic deficit precedes Alzheimer’s pathology in female mouse model of Alzheimer’s disease. Proc Natl Acad Sci U S A 106: , 14670–14675. |
[63] | Zhou Q , Lam PY , Han D , Cadenas E ((2009) ) Activation of c-Jun-N-terminal kinase and decline of mitochondrial pyruvate dehydrogenase activity during brain aging. FEBS Lett 583: , 1132–1140. |
[64] | Liang WS , Reiman EM , Valla J , Dunckley T , Beach TG , Grover A , Niedzielko TL , Schneider LE , Mastroeni D , Caselli R , Kukull W , Morris JC , Hulette CM , Schmechel D , Rogers J , Stephan DA ((2008) ) Alzheimer’s disease is associated with reduced expression of energy metabolism genes in posterior cingulate neurons. Proc Natl Acad Sci U S A 105: , 4441–4446. |
[65] | Carageorgiou H , Sideris AC , Messari I , Liakou CI , Tsakiris S ((2008) ) The effects of rivastigmine plus selegiline on brain acetylcholinesterase, (Na, K)-, Mg-ATPase activities, antioxidant status, and learning performance of aged rats. Neuropsychiatr Dis Treat 4: , 687–699. |
[66] | Saitoh T , Horsburgh K , Masliah E ((1993) ) Hyperactivation of signal transduction systems in Alzheimer’s disease. Ann N Y Acad Sci 695: , 34–41. |
[67] | Paula-Lima AC , Brito-Moreira J , Ferreira ST ((2013) ) Deregulation of excitatory neurotransmission underlying synapse failure in Alzheimer’s disease. J Neurochem 126: , 191–202. |
[68] | Gabuzda D , Busciglio J , Chen LB , Matsudaira P , Yankner BA ((1994) ) Inhibition of energy metabolism alters the processing of amyloid precursor protein and induces a potentially amyloidogenic derivative. J Biol Chem 269: , 13623–13628. |
[69] | Yanagisawa M , Planel E , Ishiguro K , Fujita SC ((1999) ) Starvation induces tau hyperphosphorylation in mouse brain: Imlications for Alzheimer’s disease. FEBS Lett 461: , 329–333. |
[70] | Hoyer S , Lannert H ((2007) ) Long-term abnormalities in brain glucose/energy metabolism after inhibition of the neuronal insulin receptor: Implication of tau-protein. J Neural Transm Suppl 195–202. |
[71] | de la Torre JC ((2008) ) Pathophysiology of neuronal energy crisis in Alzheimer’s disease. Neurodegener Dis 5: , 126–132. |
[72] | Zhang L , Trushin S , Christensen TA , Bachmeier BV , Gateno B , Schroeder A , Yao J , Itoh K , Sesaki H , Poon WW , Gylys KH , Patterson ER , Parisi JE , Diaz Brinton R , Salisbury JL , Trushina E ((2016) ) Altered brain energetics induces mitochondrial fission arrest in Alzheimer’s disease. Sci Rep 6: , 18725. |
[73] | Wakil SJ ((1956) ) Studies on the fatty acid oxidizing system of animal tissues. IX. Stereospecificity of unsaturated acyl CoA hydrase. Biochim Biophys Acta 19: , 497–504. |
[74] | Kim S , Jang YS , Ha SC , Ahn JW , Kim EJ , Lim JH , Cho C , Ryu YS , Lee SK , Lee SY , Kim KJ ((2015) ) Redox-switch regulatory mechanism of thiolase from Clostridium acetobutylicum. Nat Commun 6: , 8410. |
[75] | Yamauchi T , Kamon J , Minokoshi Y , Ito Y , Waki H , Uchida S , Yamashita S , Noda M , Kita S , Ueki K , Eto K , Akanuma Y , Froguel P , Foufelle F , Ferre P , Carling D , Kimura S , Nagai R , Kahn BB , Kadowaki T ((2002) ) Adiponectin stimulates glucose utilization and fatty-acid oxidation by activating AMP-activated protein kinase. Nat Med 8: , 1288–1295. |
[76] | Peng Y , Shapiro SL , Banduseela VC , Dieterich IA , Hewitt KJ , Bresnick EH , Kong G , Zhang J , Schueler KL , Keller MP , Attie AD , Hacker TA , Sullivan R , Kielar-Grevstad E , Arriola Apelo SI , Lamming DW , Anderson RM , Puglielli L ((2018) ) Increased transport of acetyl-CoA into the endoplasmic reticulum causes a progeria-like phenotype. Aging Cell 17: , e12820. |
[77] | DeLegge MH , Smoke A ((2008) ) Neurodegeneration and inflammation. Nutr Clin Pract 23: , 35–41. |
[78] | Calder PC ((2006) ) Polyunsaturated fatty acids and inflammation. Prostaglandins Leukot Essent Fatty Acids 75: , 197–202. |
[79] | Cribbs DH , Berchtold NC , Perreau V , Coleman PD , Rogers J , Tenner AJ , Cotman CW ((2012) ) Extensive innate immune gene activation accompanies brain aging, increasing vulnerability to cognitive decline and neurodegeneration: A microarray study. J Neuroinflammation 9: , 179. |
[80] | Mapstone M , Cheema AK , Fiandaca MS , Zhong X , Mhyre TR , MacArthur LH , Hall WJ , Fisher SG , Peterson DR , Haley JM , Nazar MD , Rich SA , Berlau DJ , Peltz CB , Tan MT , Kawas CH , Federoff HJ ((2014) ) Plasma phospholipids identify antecedent memory impairment in older adults. Nat Med 20: , 415–418. |
[81] | Larsson SC , Markus HS ((2017) ) Branched-chain amino acids and Alzheimer’s disease: A Mendelian randomization analysis. Sci Rep 7: , 13604. |
[82] | Li H , Ye D , Xie W , Hua F , Yang Y , Wu J , Gu A , Ren Y , Mao K ((2018) ) Defect of branched-chain amino acid metabolism promotes the development of Alzheimer’s disease by targeting the mTOR signaling. Biosci Rep 38: , BSR20180127. |
[83] | Tournissac M , Vandal M , Tremblay C , Bourassa P , Vancassel S , Emond V , Gangloff A , Calon F ((2018) ) Dietary intake of branched-chain amino acids in a mouse model of Alzheimer’s disease: Effects on survival, behavior, and neuropathology. Alzheimers Dement (N Y) 4: , 677–687. |
[84] | Magistretti PJ , Allaman I ((2018) ) Lactate in the brain: From metabolic end-roduct to signalling molecule. Nat Rev Neurosci 19: , 235–249. |
[85] | Gonzalez-Dominguez R , Garcia-Barrera T , Gomez-Ariza JL ((2015) ) Metabolite profiling for the identification of altered metabolic pathways in Alzheimer’s disease. J Pharm Biomed Anal 107: , 75–81. |
[86] | Liguori C , Chiaravalloti A , Sancesario G , Stefani A , Sancesario GM , Mercuri NB , Schillaci O , Pierantozzi M ((2016) ) Cerebrospinal fluid lactate levels and brain [18F]FDG PET hypometabolism within the default mode network in Alzheimer’s disease. Eur J Nucl Med Mol Imaging 43: , 2040–2049. |
[87] | Ross JM , Oberg J , Brene S , Coppotelli G , Terzioglu M , Pernold K , Goiny M , Sitnikov R , Kehr J , Trifunovic A , Larsson NG , Hoffer BJ , Olson L ((2010) ) High brain lactate is a hallmark of aging and caused by a shift in the lte dehydrogenase A/B ratio. Proc Natl Acad Sci U S A 107: , 20087–20092. |
[88] | Newman LA , Korol DL , Gold PE ((2011) ) Lactate produced by glycogenolysis in astrocytes regulates memory processing. PLoS One 6: , e28427. |
[89] | Suzuki A , Stern SA , Bozdagi O , Huntley GW , Walker RH , Magistretti PJ , Alberini CM ((2011) ) Astrocyte-neuron lactate transport is required for long-term memory formation. Cell 144: , 810–823. |
[90] | Harris RA , Tindale L , Lone A , Singh O , Macauley SL , Stanley M , Holtzman DM , Bartha R , Cumming RC ((2016) ) Aerobic glycolysis in the frontal cortex correlates with memory performance in wild-type mice but not the APP/PS1 mouse model of cerebral amyloidosis. J Neurosci 36: , 1871–1878. |
[91] | Sokoloff L ((1973) ) Metabolism of ketone bodies by the brain. Annu Rev Med 24: , 271–280. |
[92] | Wicks SE , Vandanmagsar B , Haynie KR , Fuller SE , Warfel JD , Stephens JM , Wang M , Han X , Zhang J , Noland RC , Mynatt RL ((2015) ) Impaired mitochondrial fat oxidation induces adaptive remodeling of muscle metabolism. Proc Natl Acad Sci U S A 112: , E3300–3309. |
[93] | Veech RL ((2004) ) The therapeutic implications of ketone bodies: The effects of ketone bodies in pathological conditions: Ketosis, ketogenic diet, redox states, insulin resistance, and mitochondrial metabolism. Prostaglandins Leukot Essent Fatty Acids 70: , 309–319. |
[94] | Zilberter M , Ivanov A , Ziyatdinova S , Mukhtarov M , Malkov A , Alpar A , Tortoriello G , Botting CH , Fulop L , Osypov AA , Pitkanen A , Tanila H , Harkany T , Zilberter Y ((2013) ) Dietary energy substrates reverse early neuronal hyperactivity in a mouse model of Alzheimer’s disease. J Neurochem 125: , 157–171. |
[95] | Hertz L , Chen Y , Waagepetersen HS ((2015) ) Effects of ketone bodies in Alzheimer’s disease in relation to neural hypometabolism, beta-amyloid toxicity, and astrocyte function. J Neurochem 134: , 7–20. |
[96] | Henderson ST ((2008) ) Ketone bodies as a therapeutic for Alzheimer’s disease. Neurotherapeutics 5: , 470–480. |
[97] | Paoli A , Bosco G , Camporesi EM , Mangar D ((2015) ) Ketosis, ketogenic diet and food intake control: A complex relationship. Front Psychol 6: , 27. |
[98] | Xin L , Ipek O , Beaumont M , Shevlyakova M , Christinat N , Masoodi M , Greenberg N , Gruetter R , Cuenoud B ((2018) ) Nutritional ketosis increases NAD(+)/NADH ratio in healthy human brain: An in vivo study by (31)-MRS. Front Nutr 5: , 62. |
[99] | Pifferi F , Tremblay S , Croteau E , Fortier M , Tremblay-Mercier J , Lecomte R , Cunnane SC ((2011) ) Mild experimental ketosis increases brain uptake of 11C-acetoacetate and 18F-fluorodeoxyglucose: A dual-tracer PET imaging study in rats. Nutr Neurosci 14: , 51–58. |
[100] | Cunnane S , Nugent S , Roy M , Courchesne-Loyer A , Croteau E , Tremblay S , Castellano A , Pifferi F , Bocti C , Paquet N , Begdouri H , Bentourkia M , Turcotte E , Allard M , Barberger-Gateau P , Fulop T , Rapoport SI ((2011) ) Brain fuel metabolism, aging, and Alzheimer’s disease. Nutrition 27: , 3–20. |
[101] | Van der Auwera I , Wera S , Van Leuven F , Henderson ST ((2005) ) A ketogenic diet reduces amyloid beta 40 and 42 in a mouse model of Alzheimer’s disease. Nutr Metab (Lond) 2: , 28. |
[102] | Collingridge G ((1987) ) Synaptic plasticity. The role of NMDA receptors in learning and memory. Nature 330: , 604–605. |
[103] | Butterfield DA , Pocernich CB ((2003) ) The glutamatergic system and Alzheimer’s disease: Therapeutic implications. CNS Drugs 17: , 641–652. |
[104] | Peng S , Zhang Y , Zhang J , Wang H , Ren B ((2011) ) Glutamate receptors and signal transduction in learning and memory. Mol Biol Rep 38: , 453–460. |
[105] | Kolodziejczyk K , Hamilton NB , Wade A , Karadottir R , Attwell D ((2009) ) The effect of N-acetyl-aspartyl-glutamate and N-acetyl-aspartate on white matter oligodendrocytes. Brain 132: , 1496–1508. |
[106] | McEntee WJ , Crook TH ((1993) ) Glutamate: Its role in learning, memory, and the aging brain. Psychopharmacology (Berl) 111: , 391–401. |
[107] | Greenamyre JT ((1986) ) The role of glutamate in neurotransmission and in neurologic disease. Arch Neurol 43: , 1058–1063. |
[108] | Palmer AM , Gershon S ((1990) ) Is the neuronal basis of Alzheimer’s disease cholinergic or glutamatergic? FASEB J 4: , 2745–2752. |
[109] | He X , Huang Y , Li B , Gong CX , Schuchman EH ((2010) ) Deregulation of sphingolipid metabolism in Alzheimer’s disease. Neurobiol Aging 31: , 398–408. |
[110] | Maceyka M , Spiegel S ((2014) ) Sphingolipid metabolites in inflammatory disease. Nature 510: , 58–67. |
[111] | Iyer SS , Accardi CJ , Ziegler TR , Blanco RA , Ritzenthaler JD , Rojas M , Roman J , Jones DP ((2009) ) Cysteine redox potential determines pro-inflammatory IL-1beta levels. PLoS One 4: , e5017. |
[112] | Sonnino S , Prinetti A ((2016) ) The role of sphingolipids in neuronal plasticity of the brain. J Neurochem 137: , 485–488. |
[113] | Mielke MM , Bandaru VV , McArthur JC , Chu M , Haughey NJ ((2010) ) Disturbance in cerebral spinal fluid sphingolipid content is associated with memory impairment in subjects infected with the human immunodeficiency virus. J Neurovirol 16: , 445–456. |
[114] | Armirotti A , Basit A , Realini N , Caltagirone C , Bossu P , Spalletta G , Piomelli D ((2014) ) Sample preparation and orthogonal chromatography for broad polarity range plasma metabolomics: Application to human subjects with neurodegenerative dementia. Anal Biochem 455: , 48–54. |
[115] | Jones DP ((2006) ) Redefining oxidative stress. Antioxid Redox Signal 8: , 1865–1879. |
[116] | Parihar MS , Kunz EA , Brewer GJ ((2008) ) Age-related decreases in NAD(P)H and glutathione cause redox declines before ATP loss during glutamate treatment of hippocampal neurons. J Neurosci Res 86: , 2339–2352. |
[117] | Yang Y , Quitschke WW , Vostrov AA , Brewer GJ ((1999) ) CTCF is essential for up-regulating expression from the amyloid precursor protein promoter during differentiation of primary hippocampal neurons. J Neurochem 73: , 2286–2298. |
[118] | Marina RJ , Sturgill D , Bailly MA , Thenoz M , Varma G , Prigge MF , Nanan KK , Shukla S , Haque N , Oberdoerffer S ((2016) ) TET-catalyzed oxidation of intragenic 5-methylcytosine regulates CTCF-dependent alternative splicing. EMBO J 35: , 335–355. |
[119] | Foster TC , Kyritsopoulos C , Kumar A ((2017) ) Central role for NMDA receptors in redox mediated impairment of synaptic function during aging and Alzheimer’s disease. Behav Brain Res 322: , 223–232. |
[120] | Shi Q , Xu H , Yu H , Zhang N , Ye Y , Estevez AG , Deng H , Gibson GE ((2011) ) Inactivation and reactivation of the mitochondrial alpha-ketoglutarate dehydrogenase complex. J Biol Chem 286: , 17640–17648. |
[121] | Carrico C , Meyer JG , He W , Gibson BW , Verdin E ((2018) ) The mitochondrial acylome emerges: Proteomics, regulation by sirtuins, and metabolic and disease implications. Cell Metab 27: , 497–512. |
[122] | Jones TT , Brewer GJ ((2010) ) Age-related deficiencies in complex I endogenous substrate availability and reserve capacity of complex IV in cortical neuron electron transport. Biochim Biophys Acta 1797: , 167–176. |


