
Exploring the Correlation between the Cognitive Benefits of Drug Combinations in a Clinical Database and the Efficacies of the Same Drug Combinations Predicted from a Computational Model
Abstract
Identification of drug combinations that could be effective in Alzheimer’s disease treatment is made difficult by the sheer number of possible combinations. This analysis identifies as potentially therapeutic those drug combinations that rank highest when their efficacy is determined jointly from two independent data sources. Estimates of the efficacy of the same drug combinations were derived from a clinical dataset on cognitively impaired elderly participants and from pre-clinical data, in the form of a computational model of neuroinflammation. Linear regression was used to show that the two sets of estimates were correlated, and to rule out confounds. The ten highest ranking, jointly determined drug combinations most frequently consisted of COX2 inhibitors and aspirin, along with various antihypertensive medications. Ten combinations of from five to nine drugs, and the three-drug combination of a COX2 inhibitor, aspirin, and a calcium-channel blocker, are discussed as candidates for consideration in future pre-clinical and clinical studies.
Introduction
Interest in polypharmacological approaches to the treatment of complex, multifactorial disorders is growing (e.g., [1]). Specific multi-target or multi-drug treatments for Alzheimer’s disease (AD) have already been suggested [2–6]. Combinations of approved, repurposed drugs could be more effective than single drugs in the treatment of AD, but determining which of the many possible combinations to use remains a challenge. The approach taken here is to combine clinical and pre-clinical data by correlating estimates of the epidemiological benefit of specific drug combinations, derived from a database containing clinical data on cognitively impaired elderly participants, with predictions on their efficacy derived from a computational model of the biological mechanisms underlying a key component of AD pathophysiology.
Access to the database was provided by the Rush Alzheimer’s Disease Center (RADC database; https://www.radc.rush.edu/). RADC data was generated through the Religious Orders Study and Rush Memory and Aging Project [7]. The computational model was created on the basis of experimental data (mainly from cell culture but also from animals in vivo) as published in the literature on microglia (MG model). Microglia mediate neuroinflammation, which is widely accepted as a key contributor to neurodegeneration and the resulting cognitive decline associated with AD [8–13]. Because estimates of drug combination benefit based on the RADC database (human clinical data) are completely unrelated to, and independent from, the predictions of drug combination efficacy derived from the MG model (experimental data from cell culture or animals), a positive correlation between RADC database benefit and MG model efficacy would indicate drug combinations of potential value in treating AD. The analysis presented here integrates clinical and pre-clinical data and identifies novel combinations of widely prescribed drugs that stand as promising candidates for further pre-clinical or clinical evaluation.
Methods
Model structure and parameterization
The microglia model (MG model) is essentially a computational model of a cell, which can also be thought of as a model of many cells having exactly the same structure and function. Inputs impinging on the cell activate its receptors, which activate cell-signaling pathways, which activate transcription factors, which alter the cell’s expression of the proteins that the cell secretes and which can activate the cell’s own receptors, thus closing many positive and negative feedback loops. In the microglia model specifically, the secreted proteins are cytokines and other immunological factors that mediate the brain’s immune response and can affect neurons and astrocytes but can also affect microglia themselves, via autocrine (one cell) or paracrine (many cells) feedback loops.
A highly simplified diagram of the microglia model is shown in Supplementary Figure 1. The full microglia model is composed of 146 elements (units) that represent many of the receptors, signaling molecules, transcription factors, immunological factors (mainly cytokines), and some cellular processes (e.g., phagocytosis) that together determine the response of microglia to various inputs. A full list of model elements and abbreviations is provided in Supplementary Table 1. The model receives 90 inputs that represent endogenous or exogenous receptor ligands and also drugs and other compounds that bind receptors or that target other molecular entities (e.g., enzymes or transcription factors). All of the drugs and other compounds included in the model are listed in Supplementary Table 2.
The structure of the model incorporates the known interconnections between its elements as described in the literature (for reviews, see [14, 15–19]). The MG model is an extension of previous models of microglia [20, 21], which had fewer elements (∼100). The MG model takes the form of a recurrent network of nonlinear units whose activations are bounded sigmoidally in the range [0, 1], to represent the bounds on the activations (or concentrations, expression levels, etc.) of biological entities. The parameters of the model are the strengths (or weights) of the connections between model elements, and they are optimized by training the model using a machine-learning algorithm, which is specifically a recurrent neural network learning algorithm [22, 23]. A description of the parameter optimization procedure is provided in Supplementary Text 1.
The microglia model is trained using input/desired-output patterns that are derived from the results of in vitro (mainly) and in vivo experiments on microglia as described in the literature. Owing to the wide variety of experimental conditions, and to the semi-quantitative nature of biological assays (e.g., ELISA), the inputs were assigned binary values (1 present; 0 absent), while the desired outputs were assigned integer values in the range [3, 7] where 3 is low, 7 is high, and 5 is baseline. A highly simplified input/desired-output table is shown in Supplementary Table 3. The full input/desired-output table has 179 entries. The previous microglia models not only had fewer elements (∼100), but also had far fewer input/desired-output training patterns (∼20). Due to the structure built into the previous models based on known connectivity, it was possible to tune a small number of parameters by hand to produce agreement between the model and the small number of training patterns. The recurrent network learning algorithm was needed to set current MG model parameters so that actual model output matched the desired output over the expanded set of training patterns. The connection weights are randomized prior to training using the recurrent network algorithm, and during training the input/desired-output patters are presented many times and in random order (Supplementary Text 1).
Though expanded relative to previous microglia models, the input/desired-output patterns used to train the MG model are nevertheless few relative to the very large numbers of patterns usually used to train neural networks via machine learning (Supplementary Text 1). However, most neural networks are largely unstructured in that each unit connects to many other units according to the same, broad connectivity pattern. In the MG model, available data were used both to train and to structure the model; each individual unit represented a distinct biological entity (mainly a protein or smaller molecule) and units were interconnected according to known biological pathways. The goal in network construction and parameter optimization was to use available pre-clinical data both to train and to structure the model so as to achieve the best possible representation of the function of microglia (Supplementary Text 2).
After training, the actual outputs of a trained network match the desired outputs with low error (Supplementary Figure 2). Thus, a trained network can reproduce the known behavior of microglia as represented in the input/desired-output table, and can be used to predict the responses of microglia to novel inputs (e.g., novel drug combinations). Due to the randomness inherent in initial connection weight randomization, and to the random order of input/desired-output pattern presentations, predictions on the responses to novel inputs are improved when the responses of several trained networks are averaged [24]. The MG model results reported here are based on the averaged outputs of a set of ten networks, each trained from a different initial weight randomization and according to a different random schedule of input/desired-output presentations. To verify that this averaging procedure eliminated the bias inherent in predictions based on single networks, the results based on the averaged outputs of the set of ten networks that are reported here were compared with results based on the averaged outputs of a second set of ten networks, each trained using random initial weights and random input/desired-output presentation schedules that were different from each other and from those of the first set. The results derived from both sets of ten networks were highly consistent.
Predicting drug combination efficacy using the model
Any input to the microglia model can be thought of as a pattern over the values assigned to the 90 model input elements. Likewise, any output from the microglia model can be thought of as a pattern over the responses of the 18 units that are designated as model outputs (Supplementary Figure 2). Two specific model output patterns are the neurotoxic and the neuroprotective patterns, which correspond to the responses of actual microglia that cause them to adopt, respectively, a highly pro-inflammatory or a highly anti-inflammatory response pattern.
Experimental results [25–27] and prior modeling [20, 21] suggest that the most potent pro-inflammatory stimulus, which may also represent actual conditions in the aging and AD brain [10, 28, 29], is a combination of amyloid-β (Aβ) and lipopolysaccharide (LPS), while the most potent anti-inflammatory stimulus is externally applied insulin-like growth factor-1 (IGF1). To assess the efficacy of any drug or drug combination in reducing the pro-inflammatory response, it is included in the input pattern along with the pro-inflammatory stimulus: Aβ and LPS. Additionally, the input pattern excludes factors known to be diminished in the aging and AD brain (e.g., acetylcholine, fractalkine), but includes an input representing necrotic factors that are more abundant in the aging and AD brain. The actual output to this input (with a drug combination, Aβ, LPS, and necrotic factors but without acetylcholine, fractalkine, etc.) is determined. The predicted efficacy of any drug or drug combination can then be defined as the amount by which it moves the response of the microglia model from the neurotoxic (highly pro-inflammatory) to the neuroprotective (highly anti-inflammatory) output pattern [21]. Specifically, the MG model efficacy of any drug combination is quantified as a ratio of normalized differences between the actual output response pattern and the neurotoxic and neuroprotective patterns, expressed as vectors. According to this ratio, MG model efficacy ranges from 0 (output pattern equals neurotoxic pattern) to 1 (output pattern equals neuroprotective pattern) (Supplementary Text 3 and Supplementary Figure 3). For reasons to be explained in the next subsection, a total of 196 drug combinations are included in the main analysis. The MG model efficacies of all 196 drug combinations included in the analysis range between 0.0682 and 0.5660, and the mean and variance are 0.3326 and 0.0151, respectively.
Assessing drug combination benefit from the database
The RADC dataset consists of up to 25 different assessments of the cognitive function of elderly participants, along with age (range 50 to 110 years), certain other demographic variables, a list of comorbidities, and self-reports of drug usage that were recorded on the initial visit and for some number of yearly follow-up visits thereafter [30, 31]. The 25 different cognitive function assessments, which had different measurement scales, were rescaled into the [0, 1] range and averaged to form a composite cognitive score for each visit (Supplementary Text 4). Rescaling into the range [0, 1] brought the individual cognitive scores, and their composites, into the same range as the MG model outputs.
The RADC dataset has nine comorbidity fields: hypertension, cancer (all types), diabetes, head injury, thyroid disease, congestive heart failure, claudication (peripheral vascular disease), heart disease (heart attack, myocardial infarction, etc.), and stroke. Each binary comorbidity field contains a 1 if the participant self-reported that comorbidity and contains a 0 otherwise. The self-report indicated past history on the initial visit and any persisting or new comorbidity on subsequent visits. A simple comorbidity score was calculated by summing all the comorbidity fields for each visit.
The RADC dataset included data from 3,326 participants whose drug usage was reported. In the RADC database the drugs participants reported taking were grouped into 100 drug categories, many of which were redundant or otherwise overlapping. Of those 100 drug categories, 20 were chosen because they were relatively non-overlapping, and because the effects on microglia of one or more of the drugs from that category had been determined. The 20 chosen drug categories, with names close to those used in the RADC database, are: acetaminophen, COX2 inhibitors, antimalarials, aspirin, glucocorticoids, opioids, antibiotics, ACE inhibitors, anti-adrenergics, beta blockers, calcium-channel blockers, angiotensin-receptor blockers, anti-arrhythmics, anti-diabetics, estrogen, spironolactone, proton-pump inhibitors, antimanics, antidepressants, and antihistamines. Any overlaps between these 20 drug categories were considered admissible because they would be expected to weaken rather than falsely strengthen any agreement between RADC database benefits and MG model efficacies, and because they were relatively minor overall.
The RADC database recorded the drugs in each category that the participant reported using on each visit in a binary fashion (1 if taken, 0 if not). To get a composite view of the drugs used by each participant, the drug usage over all visits were combined using a logical OR, so that a participant was designated as a user of a drug of a specific class if that participant had reported using a drug from that class on at least one visit. The simplifying assumption here is that the effect of any drug on cognitive function (or on neurodegeneration or neuroinflammation) is independent of the duration of use of that drug. This assumption is almost certainly false but was considered admissible because it would weaken rather than falsely strengthen any agreement between RADC database benefits and MG model efficacies.
When drug combination usage was combined in this way, using the logical OR over all visits, 2,167 of the possible 1,048,576 combinations of the 20 drug types were actually used by RADC participants. For simplicity of exposition, the term “drug combination” will subsume combinations of two or more drugs as well as single drugs. RADC participants were grouped according to drug combination, yielding 2,167 different drug combination groups containing at least one participant whose age and composite cognitive score were recorded on at least one visit.
The benefit of any drug or drug combination to RADC participants was assessed as the difference in cognitive function of participants who reported taking that drug or drug combination, and the cognitive function of participants who reported taking no drugs. The well-known decline of cognitive function with age [30, 31] for all of the participants in each drug combination group was summarized by pooling all of the composite cognitive score versus age (cog-score versus age) values for all participants in each drug combination group, and fitting them with a simple, three-parameter power function via nonlinear regression (Supplementary Text 4 and Supplementary Figure 4). Because at least three data points are needed to specify a three-parameter power function, any drug combination having fewer than three cog-score versus age values was removed, leaving 1,955 drug combination groups (including the no-drug group). As a further safeguard, only drug combination groups containing at least three participants were given further consideration, leaving a total of 196 drug combination groups in the main analysis.
The power function curve for each drug combination group was used to compute the expected cog-score at each age included in that specific drug combination group. Also, the power function curve for the no-drug group was used to the compute the expected cog-score in the no-drug case, but at the same ages as were included for a specific drug combination group. Then the expected cog-score in the no-drug case was subtracted from the expected cog-score for that specific drug combination at the same set of ages, and the differences were averaged to yield the RADC database benefit for that drug group. Note that many of the RADC database benefits are negative when computed this way, so the relative rather than the absolute values of the RADC database benefits are relevant to this analysis. For the 196 drug combinations that were included in the main analysis, RADC database benefits range from −0.4541 to 0.1173, and the mean and variance are −0.0260 and 0.0063, respectively.
All computations were performed using MATLABtrademark version R2017b, running on an Intel i5-7500T quad-core CPU at 2.7 GHz per core with 16 GB RAM.
Results
Correlating MG model efficacies and RADC database benefits
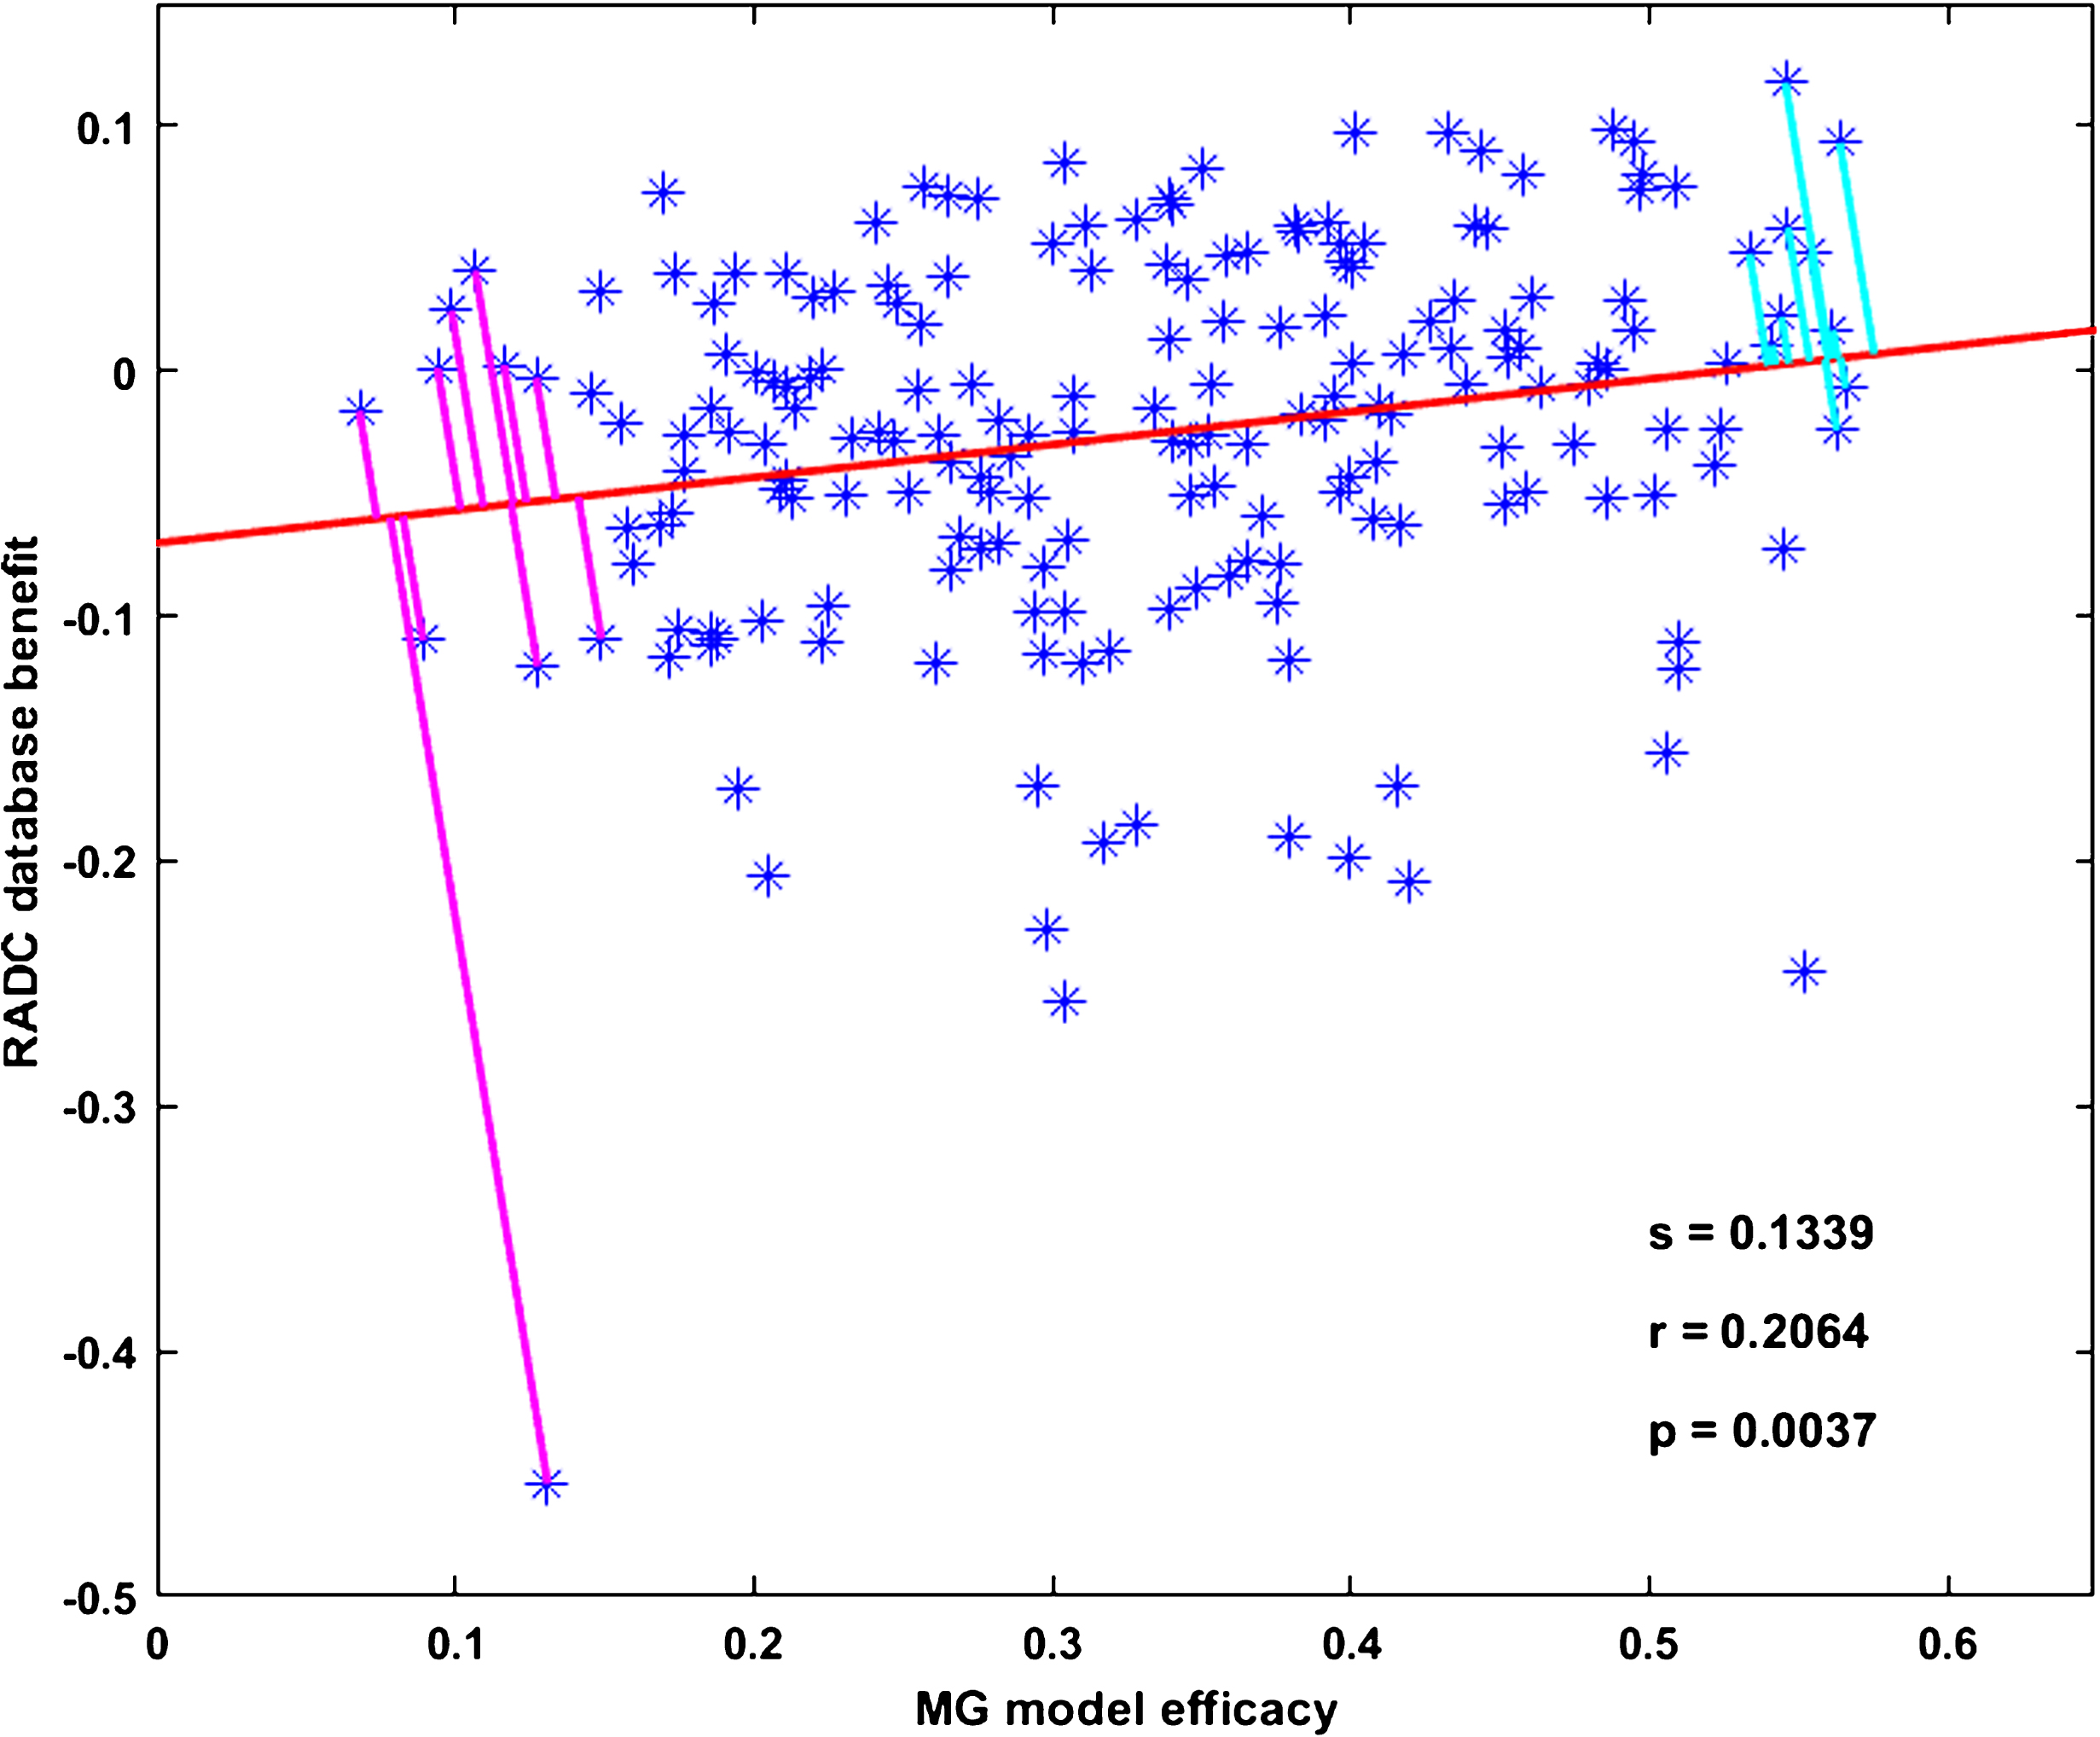
MG model efficacies and RADC database benefits are significantly correlated. Figure 1 shows the statistically significant correlation for all drug combinations taken by three or more RADC participants and having three or more cog-score versus age values, pooled over the participants in the corresponding drug combination group. Each data point (asterisk) in Fig. 1 corresponds to a unique drug combination, and is located in the plot according to its MG model efficacy and its RADC database benefit. The slope of the regression line (s) is 0.1339, the degree of linearity (or correlation coefficient, r) is 0.2064, and the probability that the correlation occurred by random chance (p) is 0.0037. The set of 196 data points on which this correlation is based will henceforth be called the “correlation set”.
Fig.1
MG model efficacies and RADC database benefits are significantly correlated. Each point represents one of the 196 drug combinations that was included in the main analysis. The regression line fit to the data points has slope s = 0.1339, correlation coefficient r = 0.2064, and p-value p = 0.0037. The perpendicular line segments drawn from the points to the regression line are the projections of the points onto the regression line. The projections show the Ten Best (upper right) and the Ten Worst (lower left) drug combinations, as determined jointly by the MG model and the RADC database according to the distance along the regression line from the y-intercept to the intersection of the projections with the regression line. Note that the lengths of the projections themselves are probably meaningless.
As explained above, several assumptions are implied in making a comparison between MG model efficacy and RADC model benefit, but most of them would be expected to degrade the correlation. The salient exception would be a spurious correlation related to the fact that, due to experimental bias, most of the drugs included in the MG model are those that have anti-inflammatory effects on microglia, which are considered positive results in the literature. The bias against reporting negative results means that data on drugs that have a pro-inflammatory effect on microglia are relatively very few.
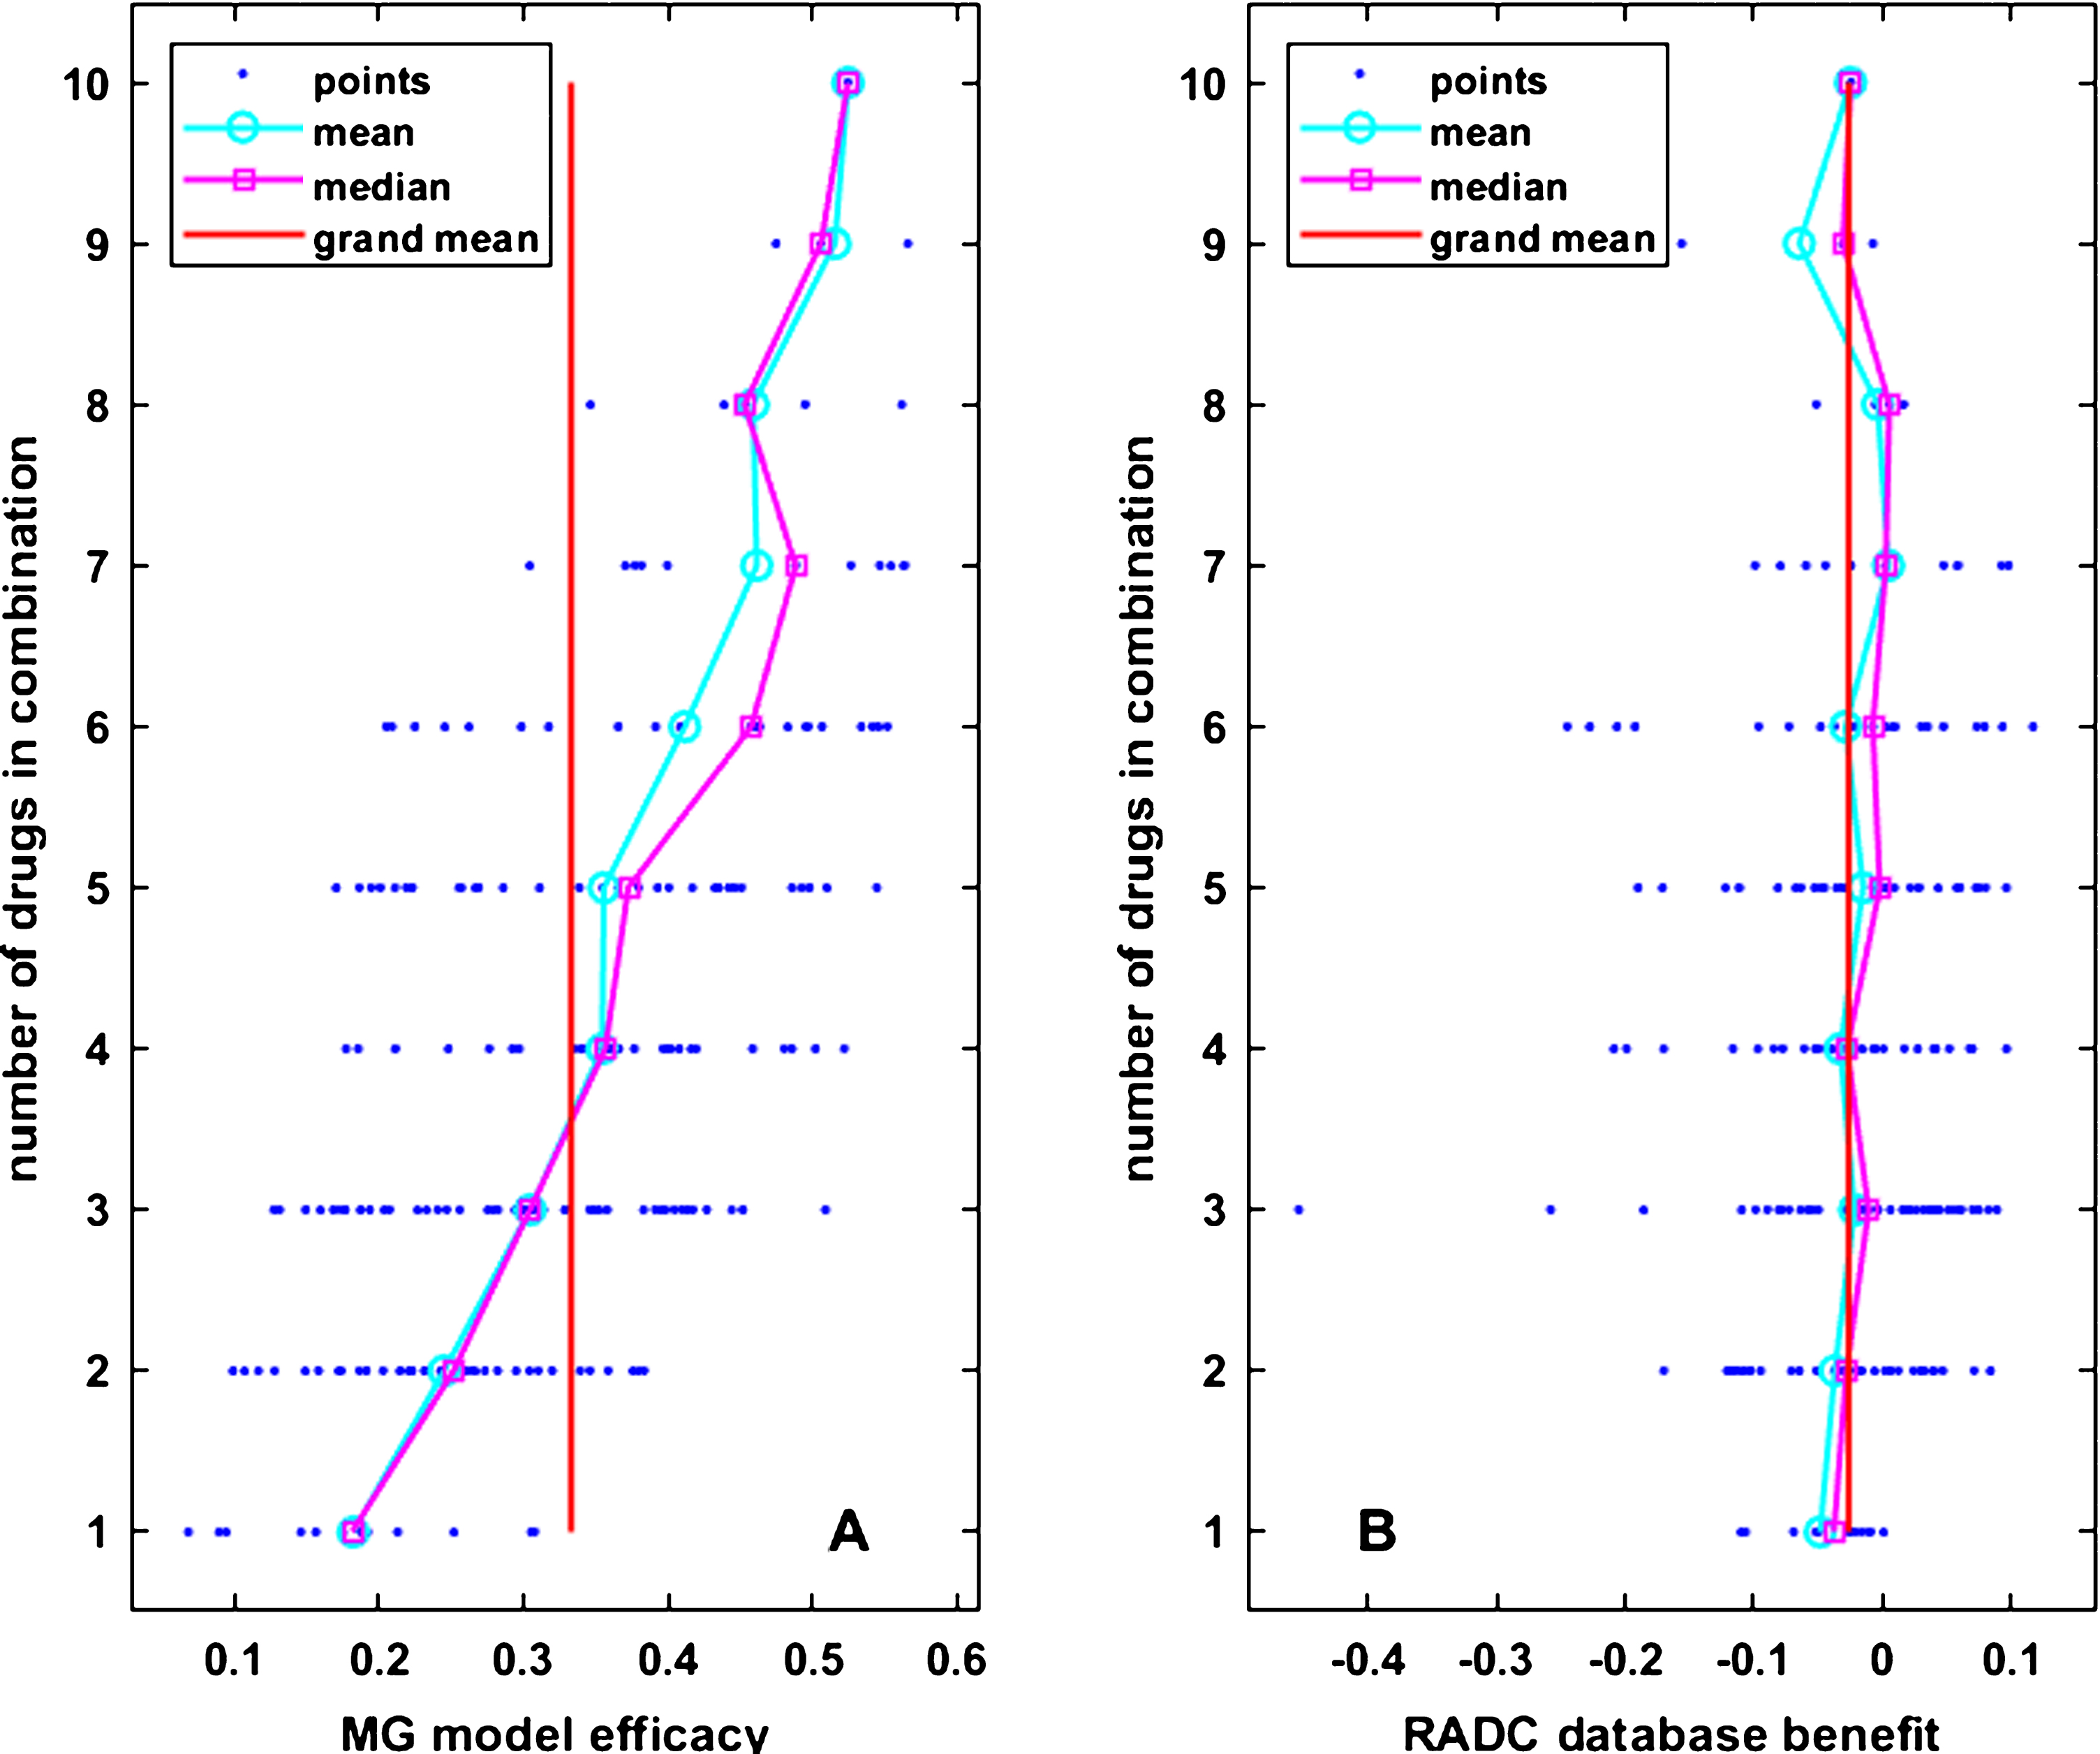
As noted above, only 2,167 of the possible 1,048,576 combinations of drugs in the 20 categories included in the analysis were actually taken by RADC participants, and of those only 196 combinations were taken by at least three participants and included at least three cog-score versus age data points. A computational screen using the MG model over all combinations of the drugs in common between the model and the RADC dataset (up to 22 drugs in a combination and over 4 x10⁶ combinations) shows that the model may indeed capture potential antagonisms between drugs, such that the anti-inflammatory effect of single drugs may actually be reduced in some combinations (Supplementary Figure 5). However, over the more limited range of the 196 drug combinations in the correlation set, which has a maximal number of drugs per combination of ten, the efficacies of drug combinations in the MG model tend to rise as the number of drugs in the combination rises. This is shown in Fig. 2A. A spurious correlation between MG model efficacies and RADC database benefits could result if RADC benefit also tended to rise as the number of drugs in the combination rises. However, the RADC benefits of the drug combinations in the correlation set stay constant as the number of drugs in the combination rises. This is shown in Fig. 2B.
Fig.2
MG model efficacy and RADC database benefit vary widely for drug combinations that are composed of the same number of drugs. In both panels, each small dot represents 1 of the 196 drug combinations that was included in the main analysis. The dots are arranged in horizontal rows according to the number of drugs in the combination. Circles and squares are the mean and median over drug combinations composed of the same number of drugs, and the vertical line is the grand mean over all drug combinations. Mean MG model efficacy rises (A) but mean RADC database benefit stays constant (B) as the number of drugs in the drug combinations rises.
The lack of correlation between clinically observed (RADC) benefit and number of drugs in the combinations included in the correlation set reflects a lack of correlation between clinically observed cognitive function and number of drugs over the whole RADC dataset. The results of some regression analyses of the whole RADC dataset are shown in Fig. 3. They are based on the 8,675 entries in the RADC dataset for which complete information on age, cognition, comorbidities, and drugs taken is available. Data were pooled over database participant visits because participants often reported different comorbidities and different drugs on different visits. There was a strong and highly statistically significant correlation (s = 2.0454, r = 0.3697, p = 0.0000) between the number of drugs taken by a participant and their combined comorbidity score, as shown in Fig. 3A. This should be expected for the RADC dataset because it is a sample of a North American population that generally has good access to medical care and to prescription drugs. The correlation between the number of drugs taken by a participant and their age was also highly significant but was weak (s = 0.0843, r = 0.0868, p = 0.0000), as shown in Fig. 3B.
Fig.3
RADC participants took more drugs as they aged and developed comorbidity, but their cognitive scores were not strongly dependent on comorbidity or number of drugs taken. Each dot in each plot represents data for one of the 8,675 participant visits in the RADC dataset for which complete information on age, cognition, comorbidities, and drugs taken is available. Note that combined comorbidity and number of drugs are integer valued and many dots overlay each other. The number of drugs taken by RADC participants overall increases with comorbidity (A) or with age (B), but composite cognitive score is only very weakly correlated with comorbidity (C), and there is no correlation between composite cognitive score and the number of drugs taken by a RADC participant (D).
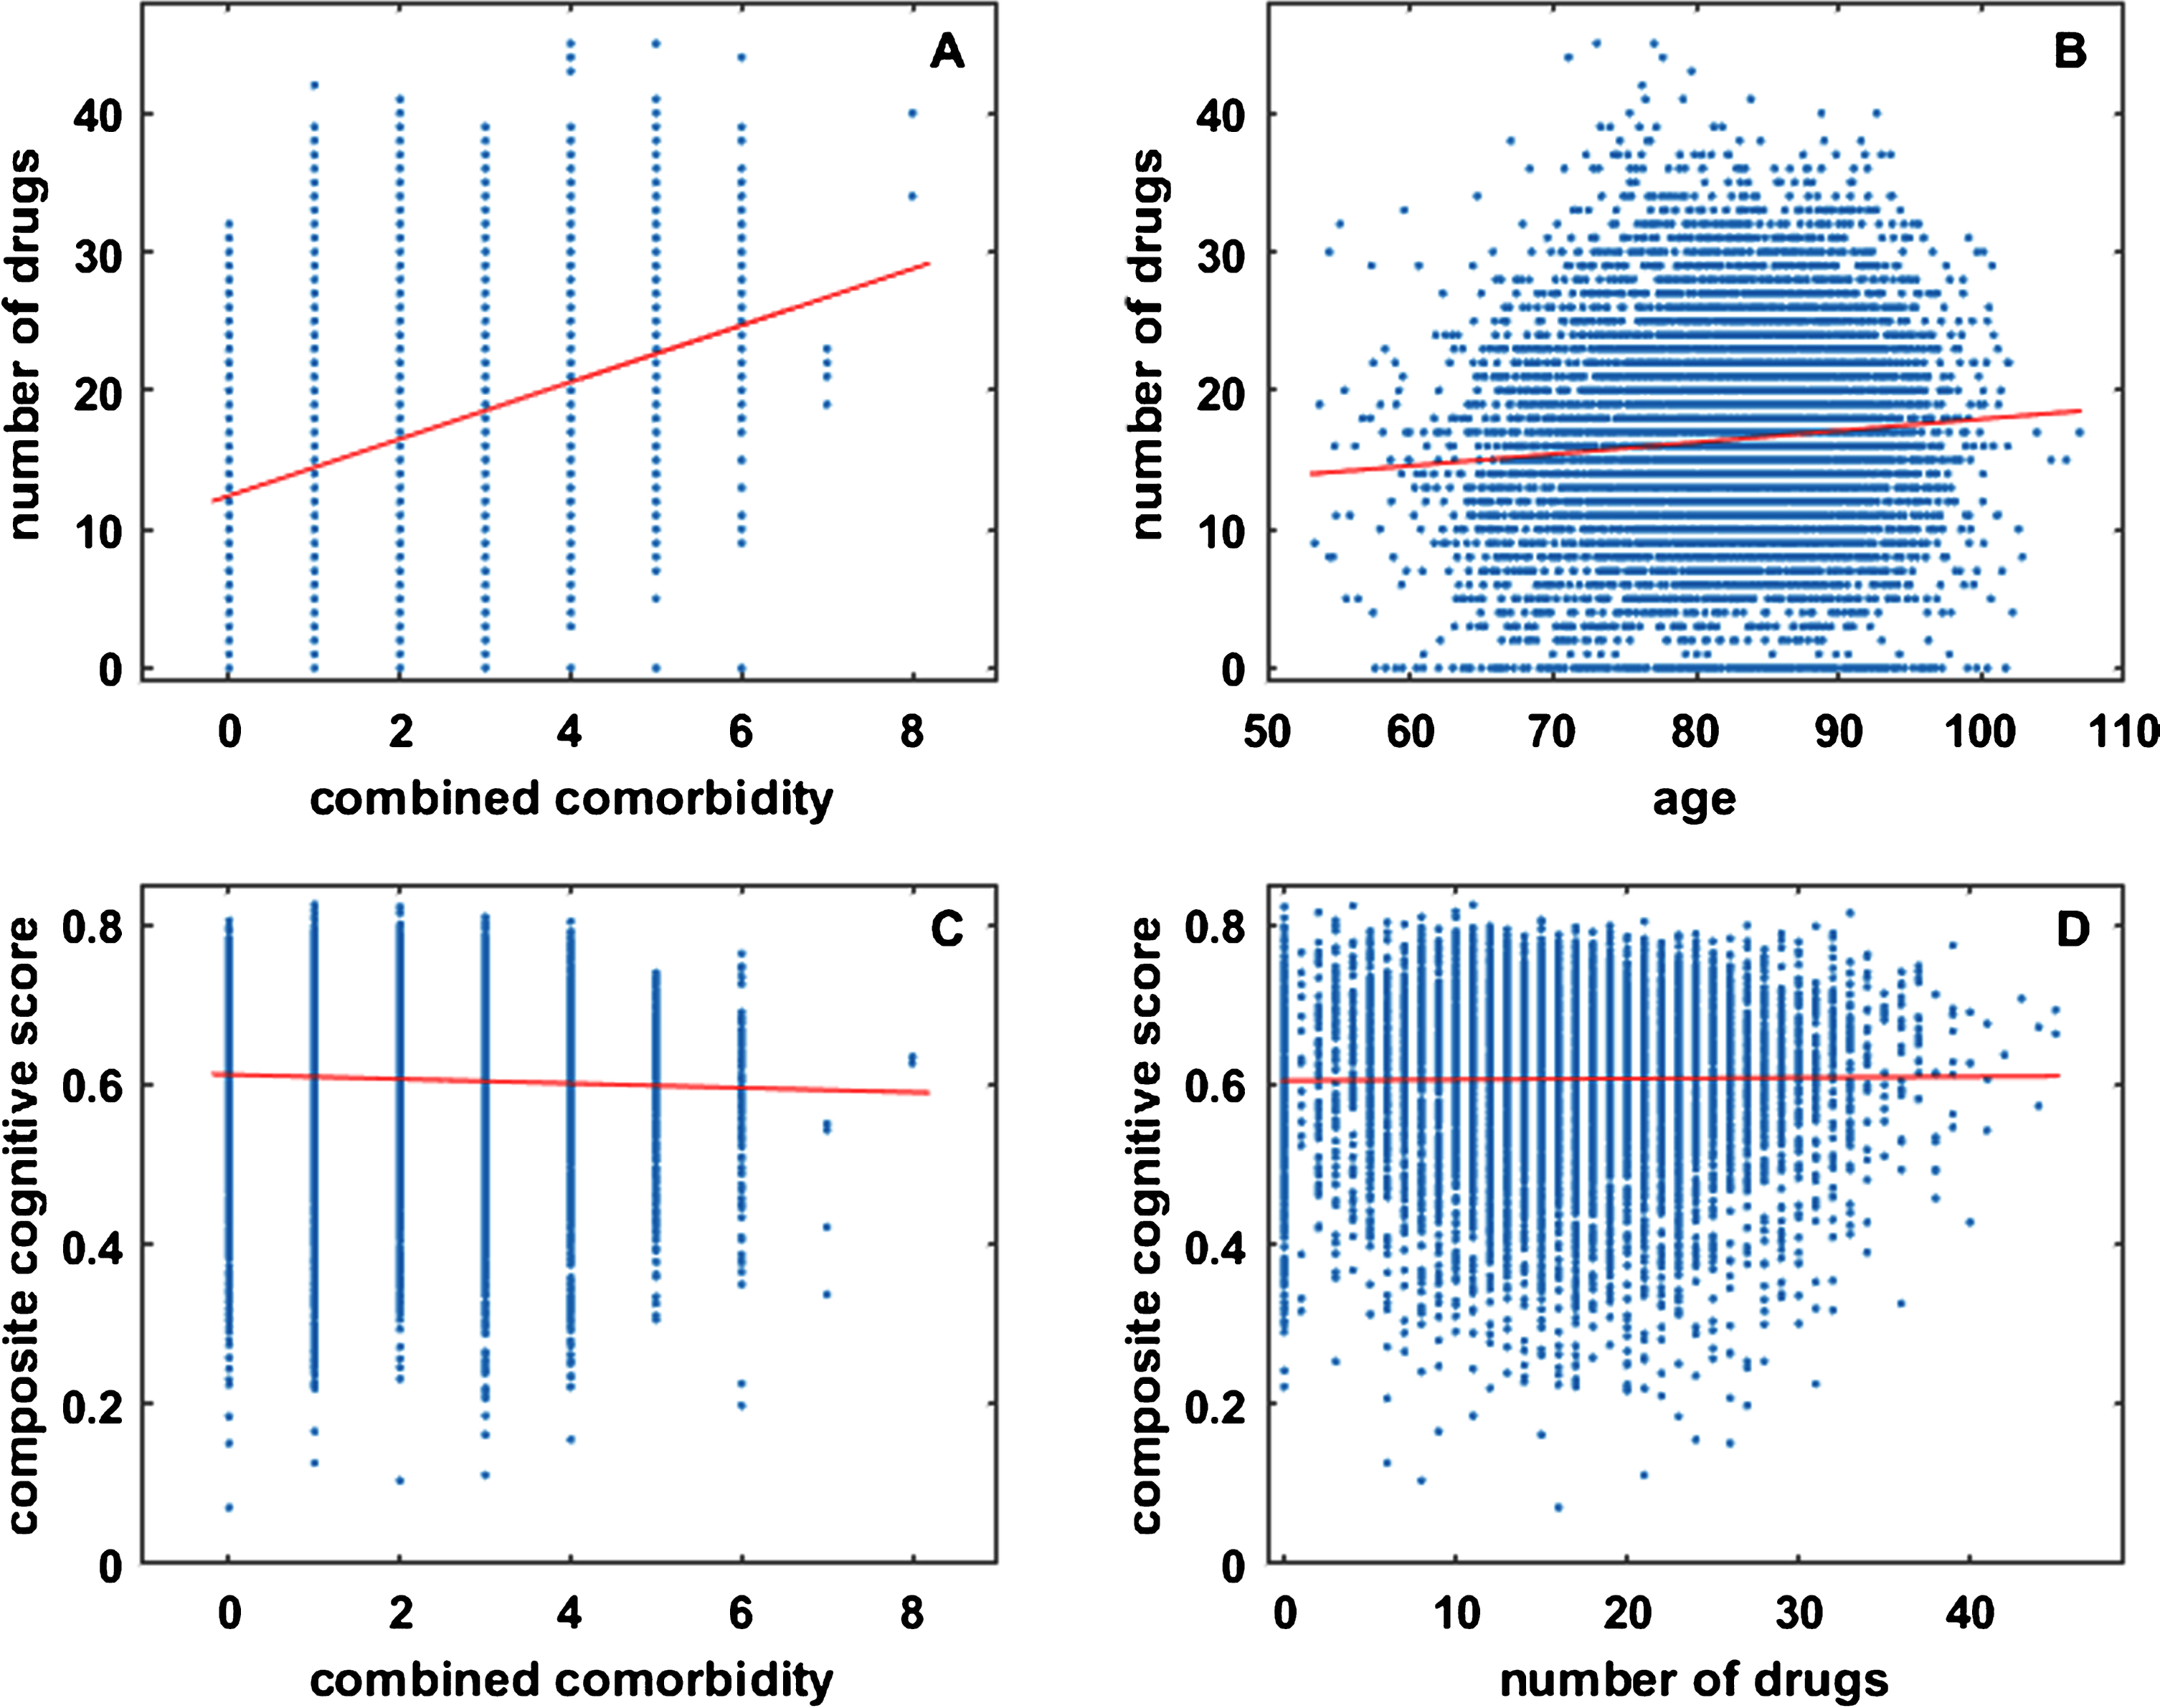
Analysis of the whole RADC dataset suggests that cognitive performance degrades with comorbidity, as shown in Fig. 3C. Although the correlation is statistically significant it is very weak (s=−0.0028, r=−0.0363, p = 0.0007; see also below). Of central concern here is any relationship between cognition and the number of drugs taken, but regression analysis clearly indicates (s = 0.0001, r = 0.0091, p = 0.3957) that there is no such relationship for the RADC dataset, as shown in Fig. 3D. The very weak relationship between cognition and comorbidity, and the lack of relationship between cognition and the number of drugs taken, justifies the pooling of RADC participants over comorbidities and over drugs taken outside of the 20 categories included in this analysis (see also Discussion).
The same lack of relationship between cognition (RADC) and the number of drugs taken is shown in Fig. 2B for the correlation set. From Fig. 2A and 2B it is also apparent that both RADC database benefit and MG model efficacy vary over a broad range for drug combinations composed of the same number of drugs. These graphical and regression analyses show that it is not simply the number of drugs in the combinations, but the specific drugs in the combinations, which determine their MG efficacy and RADC benefit.
Finding the Ten Best and Ten Worst drug combinations
Having established a statistically significant correlation between MG model efficacy and RADC database benefit, the regression line can be used to order the drug combinations according to efficacy using both measures together rather than either one alone. This joint efficacy ranking can be determined by finding the distances from the y-intercept of the projection of each drug combination data point onto the regression line. Then the Ten Best and Ten Worst drug combinations, determined jointly according to MG efficacy and RADC benefit, are those whose projections have the longest and shortest distances, respectively, along the regression line (Fig. 1). The drugs that compose the Ten Best and Ten Worst drug combinations are indicated in Table 1.
Table 1
The Ten Best and Ten Worst drug combinations as determined jointly from MG model efficacies and RADC database benefits. When determined jointly, the Ten Best drug combinations are composed of more drugs than the Ten Worst combinations. The presence of COX2 inhibitors, aspirin, and calcium-channel blockers saliently distinguishes the Ten Best drug combinations. The presence of opioids distinguishes the Ten Worst. The drug category names are close to those assigned in the RADC database, and are followed in parentheses by the drug (or drugs) that represent that category in the MG model
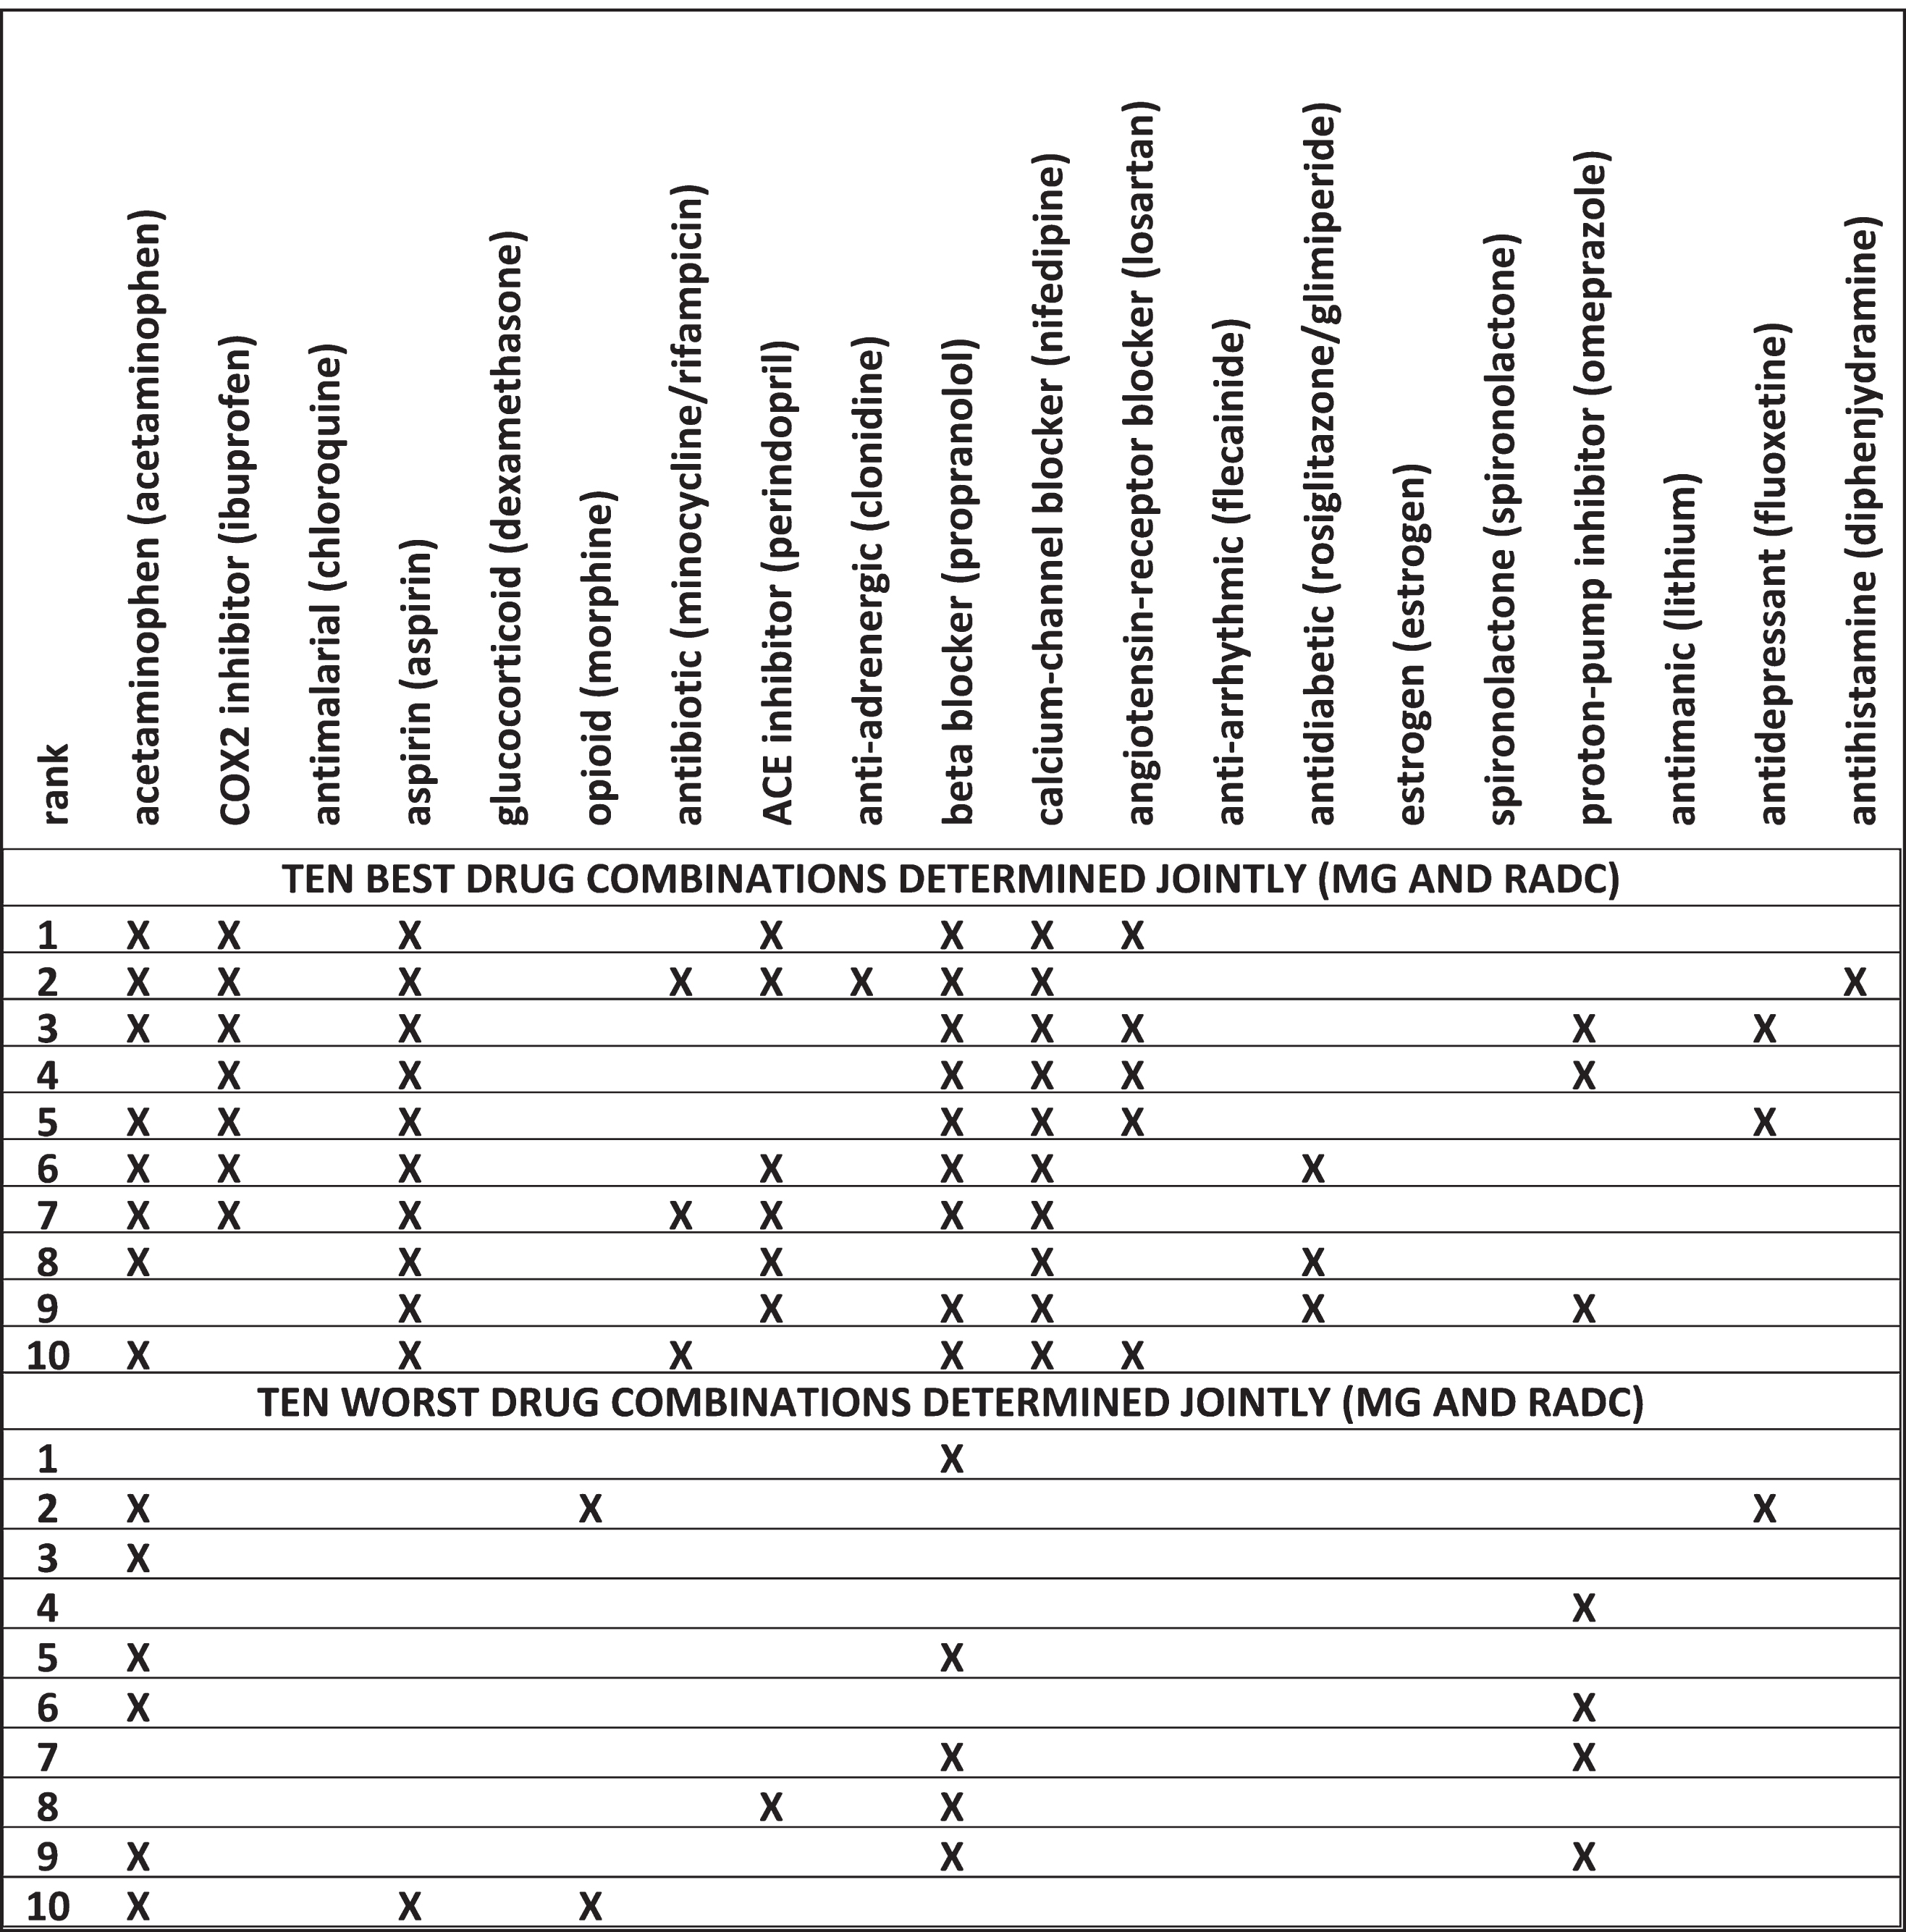 |
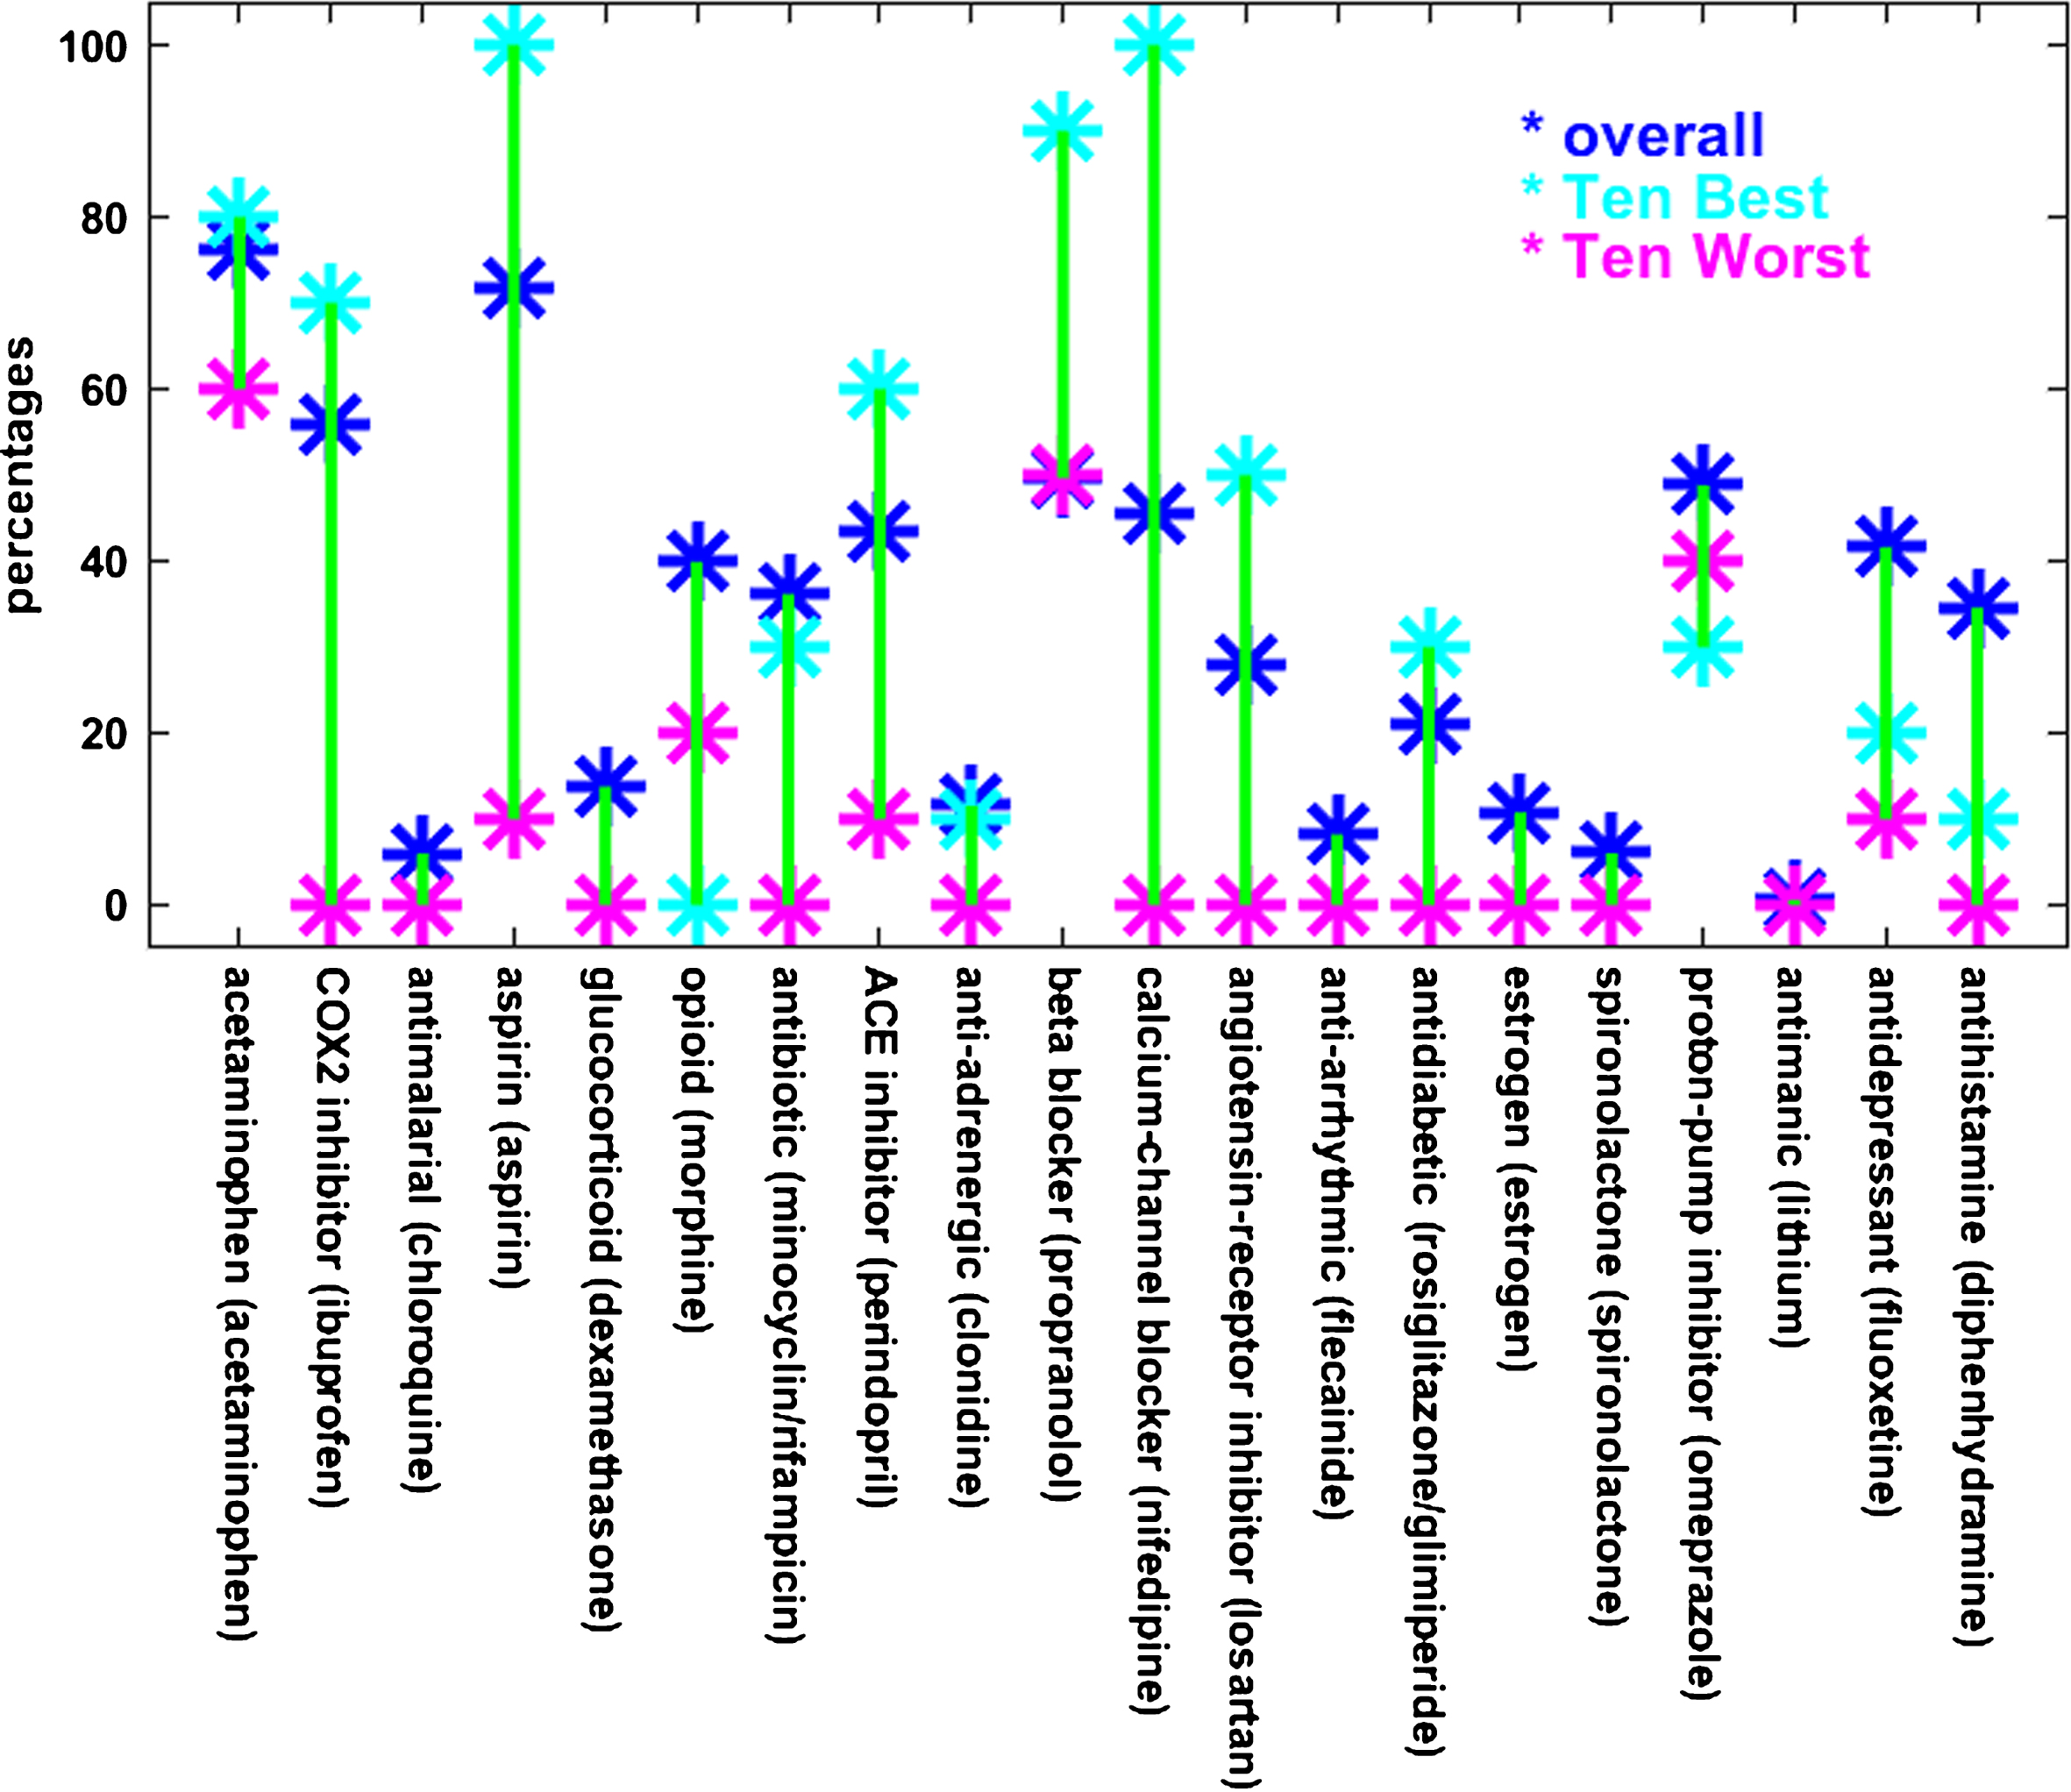
The number of drugs in the Ten Best combinations have a mean of seven and range from five to nine, while that for the Ten Worst have a mean of two and range from one to three. The combinations comprising the Ten Best (or the Ten Worst) are not entirely disparate but tend to have specific drugs in common. This suggests that some drugs may contribute more (or less) to combined effectiveness. To illustrate the tendency of certain drugs to appear in Best and Worst combinations, the percentages of the drugs in the Ten Best and Ten Worst drug combinations are shown relative to each other and to the overall drug percentages in Fig. 4. In Fig. 4 as in Table 1, COX2 inhibitors, aspirin, and calcium-channel blockers stand out because they are represented at higher percentages in the Ten Best than overall and much higher than in the Ten Worst. Opioids are represented at a lower percentage in the Ten Worst drug combinations than overall but are absent from the Ten Best combinations.
Fig.4
The percentages of drugs that appear in the Ten Best and Ten Worst combinations are different from their overall percentages. This is especially true for aspirin and calcium-channel blockers, which appear at much higher percentages than overall in the Ten Best combinations and at much lower percentages than overall in the Ten Worst combinations. A similar but less pronounced relationship is observed for COX2 inhibitors, ACE inhibitors, and angiotensin-receptor blockers. The reverse relationship holds for the opioids. The labels along the bottom are similar to the RADC drug category designations, followed by the name of the specific drug included in the MG model to represent that category. Note that the MG model included both minocycline and rifampicin for the antibiotic RADC category, and both rosiglitazone and glimepiride for the antidiabetic category, and the averaged outputs for each pair of drugs represented the response of the model for the corresponding category.
The regression analysis in Fig. 1 suggests that the Ten Best and Ten Worst drug combinations as determined jointly from MG model efficacy and RADC database benefit would be more similar to the ten best if determined from the MG model alone than they would be if determined from the RADC dataset alone. Indeed, if the ten best are determined from either the MG model or RADC dataset alone, then the Ten Best as determined jointly has eight of the ten best MG model efficacies but only two of the ten best RADC database benefits. Similarly, if the ten worst are determined from either the MG model or RADC database alone, then the Ten Worst as determined jointly has nine of the ten worst MG model efficacies but only one of the ten worst RADC database benefits.
The ten best and ten worst drug combinations as determined from the RADC database alone are indicated in Table 2. Some differences with the jointly determined combinations are apparent. Whereas the Ten Best drug combinations are composed of more drugs than the Ten Worst, when determined jointly from the MG model and RADC database (mean Best is seven, mean Worst is two), the ten best and ten worst have about the same number of drugs when determined from the RADC database alone (mean best and mean worst are both five). Also, whereas acetaminophen and antidepressants are more frequent in the Ten Best than in the Ten Worst jointly determined drug combinations, they are less frequent in the ten best than in the ten worst RADC-alone determined drug combinations, and the best/worst differences in antidepressants is especially dramatic for the RADC-alone determined combinations.
Table 2
The ten best and ten worst drug combinations determined from RADC database benefits only. The ten best and ten worst RADC-alone determined drug combinations are composed of similar numbers of drugs. Calcium-channel blockers occur more frequently in the ten best (5/10) than in the ten worst (1/10). Opioids are notably absent from the ten best but present in almost half of the ten worst, and antidepressants are absent from the ten best but frequent in the ten worst. The drug category names are close to those assigned in the RADC database, and are followed in parentheses by the drug (or drugs) that represent that category in the MG model
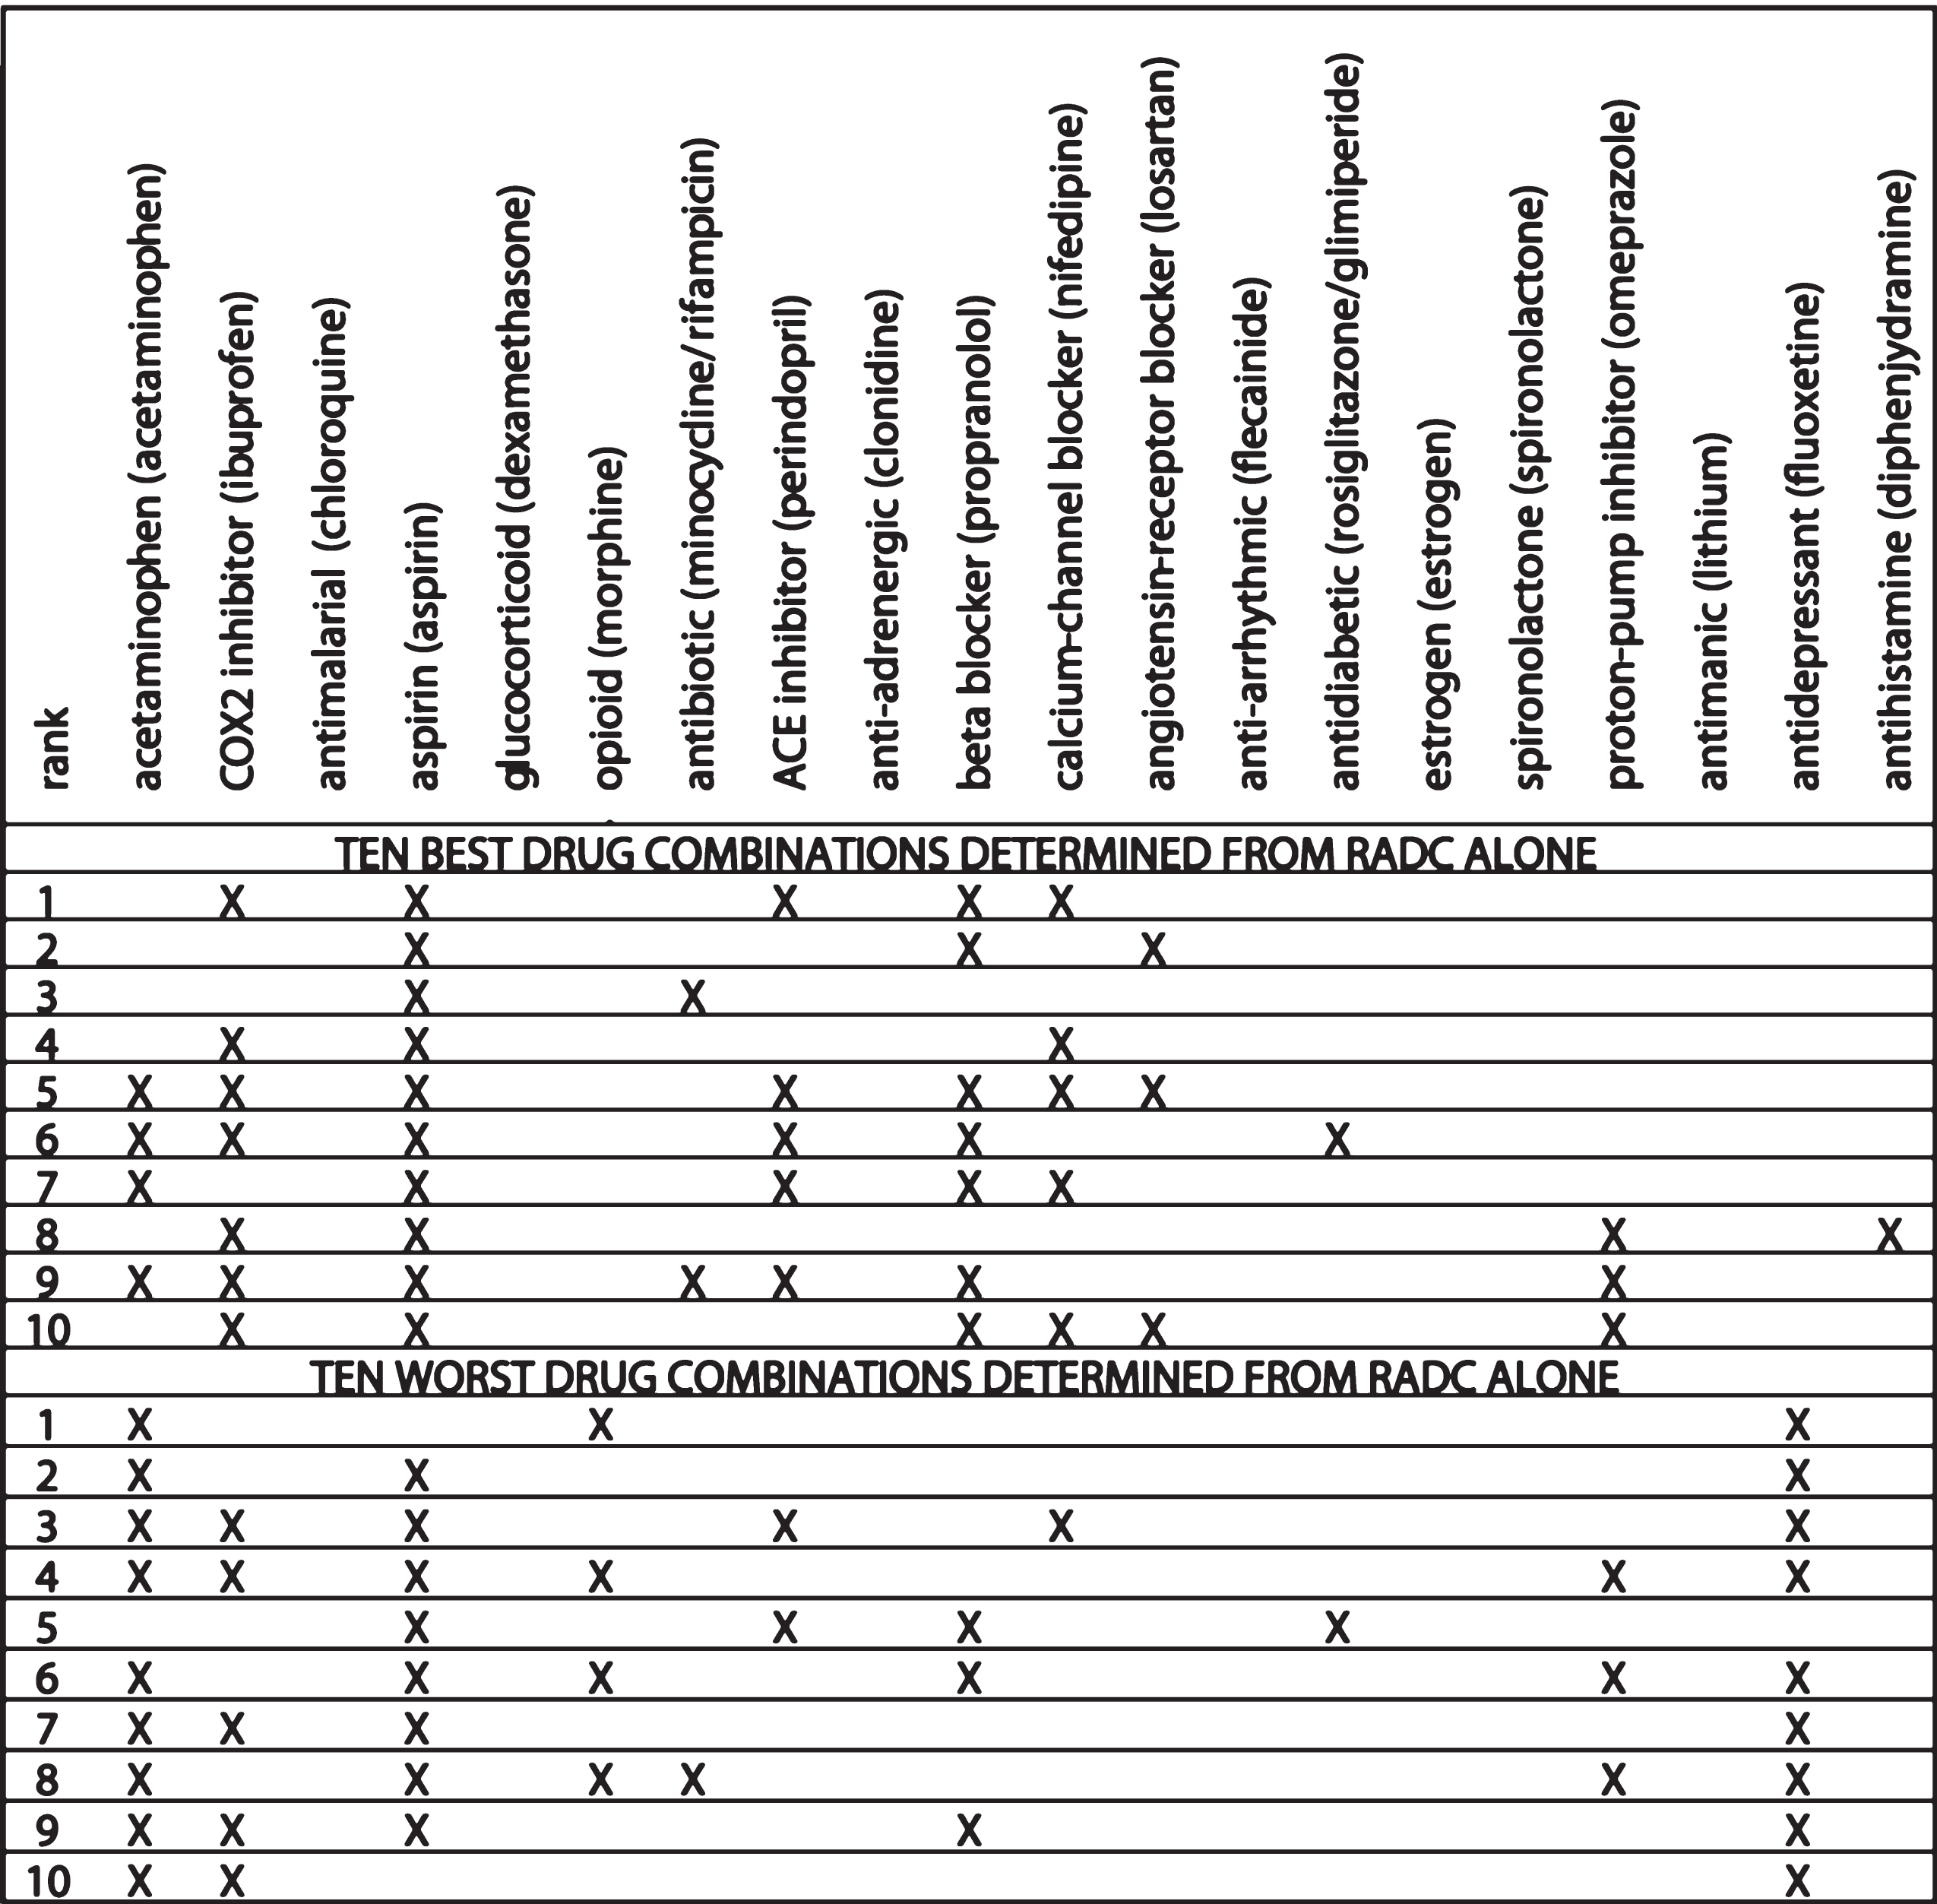 |
Many similarities between the MG and RADC jointly determined estimates and the RADC-alone determined estimates are also apparent. COX2 inhibitors, aspirin, antibiotics, ACE-inhibitors, beta blockers, calcium-channel blockers, angiotensin receptor inhibitors, and antihistamines, which are all present at higher frequencies in the Ten Best than in the Ten Worst jointly determined drug combinations, are also all present at higher frequencies in the ten best than in the ten worst RADC-alone determined drug combinations. The opioids, which are present at lower frequency in the Ten Best than in the Ten Worst jointly determined drug combinations, are also present at lower frequency in the ten best than in the ten worst RADC-alone determined drug combinations.
Ruling out hypertension and other possible confounds
The Ten Best jointly determined (MG and RADC) and the ten best RADC-alone determined drug combinations are similar in that they include ACE-inhibitors, beta blockers, calcium-channel blockers, and angiotensin receptor inhibitors. While some studies disagree [32, 33], most studies find that these antihypertensive drugs considered singly have been associated with a lower risk of AD, and in some cases lower risk was independent of hypertension [34–39]. These drugs are frequently taken in combination to treat hypertension, and the question arises as to the potential influence of hypertensive status on the efficacy of the various drug combinations determined in this analysis.
Hypertension, like overall comorbidity, degrades cognitive performance but the effect is small. As noted above, the negative correlation between cognitive performance and comorbidity in the larger RADC dataset is significant (p = 0.0007) but very weak (s=−0.0028, r=−0.0363). Similarly, a negative effect on cognitive performance of hypertension is also observed in the larger RADC dataset, and the difference between the mean cognitive scores of participants with hypertension (0.6036) and without hypertension (0.6109) is significant (p = 0.0011) but very small. In contrast, there are strong, positive correlations between comorbidity (s = 1.2821, r = 0.3611, p = 0.0000), or hypertension specifically (s = 2.1258, r = 0.4551, p = 0.0000), and the efficacy of the drug combinations in the correlation set as determined jointly from the MG model and the RADC database (Supplementary Figures 6 and Supplementary Table 6).
The strong, positive correlations between comorbidity or hypertension and drug combination efficacy might seem to imply that the groups of participants who take effective drug combinations have high cognitive scores because they also have high comorbidities or a high proportion of hypertensives, but these implications are false because, as we have seen, comorbidity and hypertension are both negatively related to cognitive performance in the RADC dataset. In any case, the effects of comorbidity or hypertension on cognitive performance are very weak or very small and can be ignored in the analysis. The strong, positive correlations between comorbidity or hypertension and drug combination efficacy imply instead that the participants who suffer comorbidities generally, or hypertension superficially, tend to be those who take combinations of the drugs examined in this analysis that are known to reduce the pro-inflammatory responses of microglia. Further analysis of the demographic variables available in the RADC dataset rule out other possible confounds (Supplementary Figure 6 and Supplementary Tables 6–8).
Focusing on specific drug combinations
Featuring prominently in the Ten Best jointly determined, and in the ten best RADC-alone determined drug combinations are four antihypertensive drug types: ACE inhibitors, beta blockers, calcium-channel blockers, and angiotensin-receptor blockers. Unfortunately, none of the 196 combinations included in the correlation set comprised only those four drug types, with or without COX2 inhibitors and/or aspirin. The three single drugs that stand out in the best combinations, whether determined jointly or by RADC alone, are the COX2 inhibitors, aspirin, and calcium-channel blockers, while the drugs that stand out in the worst combinations are the opioids and the antidepressants, and the question arises as to whether or not combinations of just those few drugs would be especially good or bad by themselves.
None of the three possible combinations of the opioids and the antidepressants (each alone and the one pair) is present in the correlation set. However, all seven possible combinations of the COX2 inhibitors, aspirin, and calcium-channel blockers (each alone, all three pairs, and the one triple) are present in it. Their projections (not shown) onto the regression line in Fig. 1 are distributed over the length of the line but none rise to the level of the Ten Best nor fall to the level of the Ten Worst.
The projections of each of the COX2 inhibitors, aspirin, and calcium-channel blockers by themselves (0.1436, 0.1870, and 0.2431) fall below those of each pair (0.2700, 0.3390, and 0.3606). The best of the seven possible combinations of the anti-inflammatory drugs, aspirin, and calcium-channel blockers is the triple composed of all three, and its projection (0.4521) is closest to those of the Ten Best (range 0.5353 to 0.5713). These findings imply that the triple of COX2 inhibitors, aspirin, and calcium-channel blockers would be better than those same drugs alone or in pairs as combination therapies for AD. They also imply that any of the Ten Best combinations, all of which include drugs in addition to COX2 inhibitors, aspirin, and calcium-channel blockers, would be better than the combination limited to the triple of COX2 inhibitors, aspirin, and calcium-channel blockers as combination therapies for AD.
Analysis of variance and multiple comparisons
The main challenge in the identification of potential multi-drug treatments for AD using clinical data alone is that the many participants in the dataset are nevertheless distributed over a great many drug combinations. The result is that the amounts of data associated with each individual drug combination is small, and this reduces statistical power. The problem is illustrated using the statistical analysis presented in Supplementary Figures 7-10 and Supplementary Tables 7-10.
Supplementary Figures 7 and 8 show that statistically significant ANOVA results are obtained when statistical power is increased by grouping the cognitive scores associated with several different drug combinations. The box and whisker plot in Supplementary Figure 7 characterizes the distributions of the composite cognitive scores for the ten best and ten worst RADC-alone determined drug combinations, each taken as a group. Supplementary Figure 7 also characterizes the distributions of composite cognitive scores for the group of combinations of antihypertensive medications along with COX2 inhibitors and aspirin, and those for all other drug combinations including the null (no-drug) combination. The means of the ten best, ten worst, and antihypertensive groups are all significantly different from the mean of the other group at the p = 0.01 level using the Bonferroni correction for multiple comparisons. Supplementary Figure 8 characterizes the distributions of the composite cognitive scores for the analogous jointly (MG and RADC) determined drug combinations, where similarly the means of the Ten Best, Ten Worst, and antihypertensive groups are all significantly different from the mean of the other group at the p = 0.01 level using the Bonferroni correction.
The problem of statistical power becomes evident when drug combinations are considered individually. Supplementary Figure 9 shows that the medians of the combined cognitive scores of the ten best and ten worst RADC-alone drug combinations taken individually are all, respectively, higher and lower than the median for the other group (including other combinations and the no-drug case), and this agreement corroborates the method used to assess RADC database benefit directly from combined cognitive scores (see Methods). However, using a multiple comparisons test with the Bonferroni correction shows that only two of the ten best are statistically significantly better than the other category (Supplementary Table 9).
Because composite cognitive score is more directly related to RADC-alone determined benefit than to jointly (MG and RADC) determined efficacy, the relationships between the medians of the combined cognitive scores of the Ten Best and Ten Worst jointly determined drug combinations, taken individually, and that for the other group is not as clean (Supplementary Figure 10). However, here again two of the Ten Best are statistically significantly better than the other category (Supplementary Table 10). A multi-way analysis of variance also confirms the presence of interactions that were identified, and ruled out, above.
Despite the relative lack of significance in this more traditional form of analysis, the differences in statistics such as medians and means (Supplementary Figures 7–10 and Supplementary Tables 7-10) supports the contention that certain drug combinations, particularly those including COX2 inhibitors, aspirin, and antihypertensive drugs in categories known as ACE inhibitors, beta blockers, calcium-channel blockers, and angiotensin-receptor blockers, may be more effective than single drugs in the treatment of AD.
Discussion
The goal of this analysis was to take estimates of the efficacy/benefit of specific drug combinations as determined completely independently, using the MG model and the RADC database, and reduce the uncertainty inherent in either by correlating them both together. The positive and highly statistically significant correlation makes it possible to rank-order drug combinations jointly, in terms both of the MG model and the RADC database. The highly significant correlation was achieved between two sets of estimates that were minimally processed. No attempt was made to adjust the data to account for the influences of any specific variables. Instead, potentially confounding variables were shown either to be uncorrelated with RADC benefit (e.g., number of drugs in the combinations), or to degrade rather than enhance the correlation (e.g., comorbidity or hypertension). The positive and highly significant correlation between RADC database benefit and MG model efficacy was observed in spite the many factors that should have prevented agreement between the two different estimates.
The main assumption in this analysis is that certain drug combinations as identified by the MG model can reduce neuroinflammation, which in turn can reduce neurodegeneration, which in turn can improve cognitive performance, and that the relative improvement in cognitive score should be detectable for those same drug combinations in the RADC dataset. The analysis of available data supports the main assumption, which is that the agreement between the MG model and the RADC database indicates that specific drug combinations are associated with relative cognitive benefit because they reduce neuroinflammation. The analysis does not rule out the possibility that certain drugs provide a relative benefit because they also ameliorate other aspects of AD-related pathology beside neuroinflammation, as has been suggested for certain calcium-channel blockers [40, 41] and COX2 inhibitors [42–45].
The analysis does not directly address the fact that certain drugs, whether or not included among the 20 drug classes in common between the RADC database and the MG model, altered cognitive function either as a direct, intended effect or as a side effect, or were being taken to treat a condition that can affect cognitive function. These effects could enhance or degrade the correlation. Two examples of drugs included in the 20 drug classes examined are relevant. The opioids are pro-inflammatory (Supplementary Table 2) and can also impair cognitive function, and it is possible that those effects synergized in enhancing the correlation. In contrast, the antidepressants (i.e., most selective serotonin reuptake inhibitors, SSRIs) are anti-inflammatory (Supplementary Table 2) but it is possible that their use, or the condition of depression that necessitates their use, could impair cognitive function, and it is probable that those contrary effects degraded the correlation. In this regard it is interesting to note that the antidepressants appear in two of the Ten Best and in one of the Ten Worst (RADC and MG; Table 1) combinations, but appear in none of the ten best and in fully nine of the ten worst combinations (RADC only; Table 2), despite SSRIs showing clear anti-inflammatory properties in microglia (Supplementary Table 2). No attempt was made to adjust the database data to account for the possible effects of drugs on cognitive function, or to account for any other factors that could have affected the correlation.
A highly significant positive correlation was observed even though RADC database benefit was based on cognitive function directly while MG model efficacy was based on reduction of inflammation, which would affect cognition indirectly. It seems likely that a computational model that represented more of the pathophysiology of AD, including the metabolisms of Aβ and hyperphosphorylated tau, the cerebrovascular system, and the functions of neurons and synapses, could represent the direct and off-target effects of more drugs and could provide a more comprehensive view on potentially effective drug combinations for the treatment of AD. There is no limit, in principle, to the size of the network models whose parameters can be set via machine learning, and very large models are routine (e.g., [46]). Existing network models of Aβ metabolism, and of the effects of Aβ on synaptic function [47–49] could be merged and expanded to encompass “the triad”, which is a unit of neurobiological organization composed of neuronal synapses and microglia, along with astroglia and their regulation of the extracellular milieu through contact with brain capillaries, that is thought to be the foci of the pathophysiological events surrounding neuroinflammation and neurodegeneration. The MG model presented here provides a framework and a starting-off point for the development of more comprehensive models.
Though limited in extent, the MG model could still account for the effects of 20 drug classes on neuroinflammation, and this was apparently enough to achieve a highly significant correlation with measures of cognitive function based on the RADC database. Analysis revealed that COX2 inhibitors, aspirin, antibiotics, ACE-inhibitors, beta blockers, calcium-channel blockers, angiotensin receptor inhibitors, and antihistamines were all present at higher frequencies in the Ten Best than in the Ten Worst jointly determined drug combinations, and were also all present at higher frequencies in the ten best than in the ten worst RADC-alone determined drug combinations. All of these drugs have known anti-inflammatory effects on microglia and, while some have overlapping sets of targets, all have distinct targets, suggesting that their effects may synergize because they affect different cellular pathways (Supplementary Table 2 and references therein).
The mean number of drugs in the Ten Best drug combinations is seven, with a range of five to nine, and the mean number of drugs, limited to the 20 categories examined here, that were taken by RADC participants is five, and range up to 16. Prescribing and taking a combination of from five to nine drugs for the treatment of a single disorder, in this case AD, would be unusual but taking between five and nine drugs overall would not be inconsistent with current clinical practice in North America. In any case, the analysis also suggests that taking a combination of three drugs, namely COX2 inhibitors, aspirin, and calcium-channel blockers, would be more beneficial than taking any of those drugs alone.
The fact that the same drug combinations were effective in the computational model and also conferred benefit in the clinical database strongly suggests that these drug combinations should be evaluated first in pre-clinical (i.e., cell-culture or animal) studies and then in clinical trials as potentially better treatments for AD and related dementias. High-throughput experiments on microglia, or on mixed neural/glial cultures, would be the most economical way to test the actual efficacy of the drug combinations identified in this analysis. For example, all combinations of a COX2 inhibitor, aspirin, and a calcium-channel blocker, with each drug at one of seven concentrations, could be tested in quadruplicate for statistical power on a single, 1,536 microtiter plate. More limited tests are feasible in AD-transgenic animals. All combinations of a COX2 inhibitor, aspirin, and a calcium-channel blocker, with each drug at one of three concentrations, could be tested in quadruplicate for statistical power on about 100 mice.
New clinical studies are also feasible. All of the Ten Best drug combinations include at least two of the following drugs: ACE inhibitors, beta blockers, calcium-channel blockers, and angiotensin-receptor blockers. These drugs are frequently taken in combination to treat hypertension, and many of the cognitively impaired elderly individuals likely to participate in new clinical studies are already taking two or more of them together, along with some of the other drugs included in the Ten Best list. Adding drugs such as COX2 inhibitors and aspirin to already established drug regimens, in order to complete or approximate some of the Ten Best combinations, is an option for future clinical trials.
ACKNOWLEDGMENTS
This work was supported by The Rotary Coins for Alzheimer’s Research Trust (CART) Fund, administered by the Rotarians of the Southeastern United States. Access to the clinical data was provided by the Rush Alzheimer’s Disease Center (RADC) of the Rush University Medical Center in Chicago, IL. The clinical data provided by RADC comes from the participants in the Religious Orders Study and Rush Memory and Aging Project (ROSMAP). ROSMAP is supported by National Institutes of Health grants P30AG10161, R01AG15819, and R01AG17917, and by the Illinois Department of Public Health. Helpful discussions, advice on statistical analysis, and comments on the manuscript prior to submission by Professors Sue Leurgans at Rush and Ruoqing Zhu at the University of Illinois are gratefully acknowledged.
Authors’ disclosures available online (https://www.j-alz.com/manuscript-disclosures/19-0144r1).
SUPPLEMENTARY MATERIAL
[1] The supplementary material is available in the electronic version of this article: http://dx.doi.org/10.3233/JAD-190144.
REFERENCES
[1] | Anastasio TJ ((2017) ) Editorial: Computational and experimental approaches in multi-target pharmacology. Front Pharmacol 8: , 443. |
[2] | Schmitt B , Bernhardt T , Moeller H-J , Heuser I , Frölich L ((2004) ) Combination therapy in Alzheimer’s disease. CNS Drugs 18: , 827–844. |
[3] | Bajda M , Guzior N , Ignasik M , Malawska B ((2011) ) Multi-target-directed ligands in Alzheimer’s disease treatment. Curr Med Chem 18: , 4949–4975. |
[4] | Haber M , Abdel Baki SG , Grin’kina NM , Irizarry R , Ershova A , Orsi S , Grill RJ , Dash P , Bergold PJ ((2013) ) Minocycline plus N-acetylcysteine synergize to modulate inflammation and prevent cognitive and memory deficits in a rat model of mild traumatic brain injury. Exp Neurol 249: , 169–177. |
[5] | Tsoi KK , Chan JY , Leung NW , Hirai HW , Wong SY , Kwok TC ((2016) ) Combination therapy showed limited superiority over monotherapy for Alzheimer disease: A meta-analysis of 14 randomized trials. J Am Med Dir Assoc 17: , 863 e861–868. |
[6] | Wenzel TJ , Klegeris A ((2018) ) Novel multi-target directed ligand-based strategies for reducing neuroinflammation in Alzheimer’s disease. Life Sci 207: , 314–322. |
[7] | Bennett DA , Buchman AS , Boyle PA , Barnes LL , Wilson RS , Schneider JA ((2018) ) Religious Orders Study and Rush Memory and Aging Project. J Alzheimers Dis 64: (s1), S161–S189. |
[8] | Cai Z , Hussain MD , Yan LJ ((2014) ) Microglia, neuroinflammation, and beta-amyloid protein in Alzheimer’s disease. Int J Neurosci 124: , 307–321. |
[9] | Regen F , Hellmann-Regen J , Costantini E , Reale M ((2017) ) Neuroinflammation and Alzheimer’s disease: Implications for microglial activation. Curr Alzheimer Res 14: , 1140–1148. |
[10] | Sochocka M , Zwolinska K , Leszek J ((2017) ) The infectious etiology of Alzheimer’s disease. Curr Neuropharmacol 15: , 996–1009. |
[11] | Balducci C , Forloni G ((2018) ) Novel targets in Alzheimer’s disease: A special focus on microglia. Pharmacol Res 130: , 402–413. |
[12] | Kokiko-Cochran ON , Godbout JP ((2018) ) The inflammatory continuum of traumatic brain injury and Alzheimer’s disease. Front Immunol 9: , 672. |
[13] | Labzin LI , Heneka MT , Latz E ((2018) ) Innate immunity and neurodegeneration. Annu Rev Med 69: , 437–449. |
[14] | Nakamura Y ((2002) ) Regulating factors for microglial activation. Biol Pharm Bull 25: , 945–953. |
[15] | Chhor V , Le Charpentier T , Lebon S , Ore MV , Celador IL , Josserand J , Degos V , Jacotot E , Hagberg H , Savman K , Mallard C , Gressens P , Fleiss B ((2013) ) Characterization of phenotype markers and neuronotoxic potential of polarised primary microglia in vitro. Brain Behav Immun 32: , 70–85. |
[16] | Jiang J , Dingledine R ((2013) ) Prostaglandin receptor EP2 in the crosshairs of anti-inflammation, anti-cancer, and neuroprotection. Trends Pharmacol Sci 34: , 413–423. |
[17] | Heneka MT , Carson MJ , El Khoury J , Landreth GE , Brosseron F , Feinstein DL , Jacobs AH , Wyss-Coray T , Vitorica J , Ransohoff RM , Herrup K , Frautschy SA , Finsen B , Brown GC , Verkhratsky A , Yamanaka K , Koistinaho J , Latz E , Halle A , Petzold GC , Town T , Morgan D , Shinohara ML , Perry VH , Holmes C , Bazan NG , Brooks DJ , Hunot S , Joseph B , Deigendesch N , Garaschuk O , Boddeke E , Dinarello CA , Breitner JC , Cole GM , Golenbock DT , Kummer MP ((2015) ) Neuroinflammation in Alzheimer’s disease. Lancet Neurol 14: , 388–405. |
[18] | Malm TM , Jay TR , Landreth GE ((2015) ) The evolving biology of microglia in Alzheimer’s disease. Neurotherapeutics 12: , 81–93. |
[19] | Kaminska B , Mota M , Pizzi M ((2016) ) Signal transduction and epigenetic mechanisms in the control of microglia activation during neuroinflammation. Biochim Biophys Acta 1862: , 339–351. |
[20] | Anastasio TJ ((2014) ) Temporal-logic analysis of microglial phenotypic conversion with exposure to amyloid-beta. Mol Biosyst 11: , 434–453. |
[21] | Anastasio TJ ((2015) ) Computational identification of potential multi-drug combinations for reduction of microglial inflammation in Alzheimer disease. Front Pharmacol 6: , 116. |
[22] | Pineda FJ ((1987) ) Generalization of back-propagation to recurrent neural networks. Phys Rev Lett 59: , 2229–2232. |
[23] | Pineda FJ ((1989) ) Recurrent backpropagation and the dynamical approach to adaptive neural computation. Neural Comput 1: , 161–172. |
[24] | Perrone MP , Cooper LN ((1995) ) When networks disagree: Ensemble methods for hybrid neural networks In How We Learn; How We Remember: Toward An Understanding Of Brain And Neural Systems: Selected Papers of Leon N Cooper.. World Scientific, pp. 342–358. |
[25] | Butovsky O , Talpalar AE , Ben-Yaakov K , Schwartz M ((2005) ) Activation of microglia by aggregated beta-amyloid or lipopolysaccharide impairs MHC-II expression and renders them cytotoxic whereas IFN-gamma and IL-4 render them protective. Mol Cell Neurosci 29: , 381–393. |
[26] | Piazza A , Lynch MA ((2009) ) Neuroinflammatory changes increase the impact of stressors on neuronal function. Biochem Soc Trans 37: , 303–307. |
[27] | Grinberg YY , Dibbern ME , Levasseur VA , Kraig RP ((2013) ) Insulin-like growth factor-1 abrogates microglial oxidative stress and TNF-alpha responses to spreading depression. J Neurochem 126: , 662–672. |
[28] | Miklossy J ((2008) ) Chronic inflammation and amyloidogenesis in Alzheimer’s disease – role of Spirochetes. J Alzheimers Dis 13: , 381–391. |
[29] | Bibi F , Yasir M , Sohrab SS , Azhar EI , Al-Qahtani MH , Abuzenadah AM , Kamal MA , Naseer MI ((2014) ) Link between chronic bacterial inflammation and Alzheimer disease. CNS Neurol Disord Drug Targets 13: , 1140–1147. |
[30] | Bennett DA , Wilson RS , Schneider JA , Evans DA , Beckett LA , Aggarwal NT , Barnes LL , Fox JH , Bach J ((2002) ) Natural history of mild cognitive impairment in older persons. Neurology 59: , 198–205. |
[31] | Bennett DA , Schneider JA , Arvanitakis Z , Kelly JF , Aggarwal NT , Shah RC , Wilson RS ((2006) ) Neuropathology of older persons without cognitive impairment from two community-based studies. Neurology 66: , 1837–1844. |
[32] | Guo Z , Fratiglioni L , Zhu L , Fastbom J , Winblad B , Viitanen M ((1999) ) Occurrence and progression of dementia in a community population aged 75 years and older: Relationship of antihypertensive medication use. Arch Neurol 56: , 991–996. |
[33] | Rohde D , Hickey A , Williams D , Bennett K ((2017) ) Cognitive impairment and cardiovascular medication use: Results from wave 1 of The Irish Longitudinal Study on Ageing. Cardiovasc Ther 35: , doi: 10.1111/1755-5922.12300 |
[34] | Forette F , Seux ML , Staessen JA , Thijs L , Babarskiene MR , Babeanu S , Bossini A , Fagard R , Gil-Extremera B , Laks T , Kobalava Z , Sarti C , Tuomilehto J , Vanhanen H , Webster J , Yodfat Y , Birkenhager WH , Systolic Hypertension in Europe Investigators ((2002) ) The prevention of dementia with antihypertensive treatment: New evidence from the Systolic Hypertension in Europe (Syst-Eur) study. Arch Intern Med 162: , 2046–2052. |
[35] | Hajjar I , Catoe H , Sixta S , Boland R , Johnson D , Hirth V , Wieland D , Eleazer P ((2005) ) Cross-sectional and longitudinal association between antihypertensive medications and cognitive impairment in an elderly population. J Gerontol A Biol Sci Med Sci 60: , 67–73. |
[36] | Khachaturian AS , Zandi PP , Lyketsos CG , Hayden KM , Skoog I , Norton MC , Tschanz JT , Mayer LS , Welsh-Bohmer KA , Breitner JC ((2006) ) Antihypertensive medication use and incident Alzheimer disease: The Cache County Study. Arch Neurol 63: , 686–692. |
[37] | Gelber RP , Ross GW , Petrovitch H , Masaki KH , Launer LJ , White LR ((2013) ) Antihypertensive medication use and risk of cognitive impairment: The Honolulu-Asia Aging Study. Neurology 81: , 888–895. |
[38] | Soto ME , van Kan GA , Nourhashemi F , Gillette-Guyonnet S , Cesari M , Cantet C , Rolland Y , Vellas B ((2013) ) Angiotensin-converting enzyme inhibitors and Alzheimer’s disease progression in older adults: Results from the Reseau sur la Maladie d’Alzheimer Francais cohort. J Am Geriatr Soc 61: , 1482–1488. |
[39] | Yasar S , Xia J , Yao W , Furberg CD , Xue QL , Mercado CI , Fitzpatrick AL , Fried LP , Kawas CH , Sink KM , Williamson JD , DeKosky ST , Carlson MC , Ginkgo Evaluation of Memory (GEM) Study Investigators ((2013) ) Antihypertensive drugs decrease risk of Alzheimer disease: Ginkgo Evaluation of Memory Study. Neurology 81: , 896–903. |
[40] | Anekonda TS , Quinn JF ((2011) ) Calcium channel blocking as a therapeutic strategy for Alzheimer’s disease: The case for isradipine. Biochim Biophys Acta 1812: , 1584–1590. |
[41] | Nimmrich V , Eckert A ((2013) ) Calcium channel blockers and dementia. Br J Pharmacol 169: , 1203–1210. |
[42] | Czirr E , Weggen S ((2006) ) Gamma-secretase modulation with Abeta42-lowering nonsteroidal anti-inflammatory drugs and derived compounds. Neurodegener Dis 3: , 298–304. |
[43] | Imbimbo BP ((2008) ) Therapeutic potential of gamma-secretase inhibitors and modulators. Curr Top Med Chem 8: , 54–61. |
[44] | Imbimbo BP , Giardina GA ((2011) ) gamma-secretase inhibitors and modulators for the treatment of Alzheimer’s disease: Disappointments and hopes. Curr Top Med Chem 11: , 1555–1570. |
[45] | Ettcheto M , Sanchez-Lopez E , Pons L , Busquets O , Olloquequi J , Beas-Zarate C , Pallas M , Garcia ML , Auladell C , Folch J , Camins A ((2017) ) Dexibuprofen prevents neurodegeneration and cognitive decline in APPswe/PS1dE9 through multiple signaling pathways. Redox Biol 13: , 345–352. |
[46] | LeCun Y , Bengio Y , Hinton G ((2015) ) Deep learning. Nature 521: , 436–444. |
[47] | Anastasio TJ ((2011) ) Data-driven modeling of Alzheimer disease pathogenesis. J Theor Biol 290: , 60–72. |
[48] | Anastasio TJ ((2013) ) Exploring the contribution of estrogen to amyloid-Beta regulation: A novel multifactorial computational modeling approach. Front Pharmacol 4: , 16. |
[49] | Anastasio TJ ((2014) ) Computational identification of potential multitarget treatments for ameliorating the adverse effects of amyloid-β on synaptic plasticity. Front Pharmacol 5: , 85–103. |
[50] | Cerbai F , Lana D , Nosi D , Petkova-Kirova P , Zecchi S , Brothers HM , Wenk GL , Giovannini MG ((2012) ) The neuron-astrocyte-microglia triad in normal brain ageing and in a model of neuroinflammation in the rat hippocampus. PloS One 7: , e45250. |


