
The MemTrax Test Compared to the Montreal Cognitive Assessment Estimation of Mild Cognitive Impairment
Abstract
Cognitive impairment is a leading cause of dysfunction in the elderly. When mild cognitive impairment (MCI) occurs in elderly, it is frequently a prodromal condition to dementia. The Montreal Cognitive Assessment (MoCA) is a commonly used tool to screen for MCI. However, this test requires a face-to-face administration and is composed of an assortment of questions whose responses are added together by the rater to provide a score whose precise meaning has been controversial. This study was designed to evaluate the performance of a computerized memory test (MemTrax), which is an adaptation of a continuous recognition task, with respect to the MoCA. Two outcome measures are generated from the MemTrax test: MemTraxspeed and MemTraxcorrect. Subjects were administered the MoCA and the MemTrax test. Based on the results of the MoCA, subjects were divided in two groups of cognitive status: normal cognition (n = 45) and MCI (n = 37). Mean MemTrax scores were significantly lower in the MCI than in the normal cognition group. All MemTrax outcome variables were positively associated with the MoCA. Two methods, computing the average MTX score and linear regression were used to estimate the cutoff values of the MemTrax test to detect MCI. These methods showed that for the outcome MemTraxspeed a score below the range of 0.87 – 91 s-1 is an indication of MCI, and for the outcome MemTraxcorrect a score below the range of 85 – 90% is an indication for MCI.
INTRODUCTION
The worldwide population, led by Europe, North America, and Northern Asia, is aging, causing a rapid increase in the proportion of elderly persons. With increasing age, there is a well-established progressive, exponential increase of the development of cognitive impairment, dementia, and Alzheimer’s disease (AD) [1], which is leading to a huge increase in the number of people with these conditions [2–4]. Early detection and identification of cognitive disorders can improve patient care, decrease health care costs, and could help in delaying the onset of more severe symptoms, thus potentially helping to ease the rapidly developing burden of dementia and AD. Therefore, better tools are needed to monitor cognitive function in the elderly [5–7].
To perform clinical assessments of cognitive and behavioral functions of the elderly, clinicians and researchers have developed hundreds of screening and brief assessment tools [8, 9], and several tests have come into common use [5, 10]. One of the most frequently used tools for clinical assessment of mild cognitive impairment (MCI) in academic settings is the Montreal Cognitive Assessment (MoCA) [11].
The MoCA assesses seven cognitive functions: executive, naming, attention, language, abstraction, memory/delayed recall, and orientation. The domains memory/delayed recall and orientation of the MoCA were previously identified as the most sensitive items to early Alzheimer-type cognitive impairments [12], which led to the concept that memory encoding was the fundamental factor attacked by the AD neuropathological process [13, 14]. Therefore, in a clinical tool for the assessment of the cognitive impairments associated with AD, memory is the central cognitive factor to consider, while other impairments, including aphasia, apraxia, agnosia, and executive dysfunction, though commonly disrupted by AD, may be related to the dysfunction of neuroplastic memory processing mechanisms in the supporting neocortical regions.
Although the MoCA is widely used for assessing MCI, administration of the MoCA is done face-to-face, which is time-consuming and requires a clinical encounter and consequently requires a considerable cost for each administration. In the course of an assessment, the time required to administer a test increases the accuracy of the assessment [15], so future developments must take this relationship into account to develop more efficient tests [8].
A critical issue in this area is the requirement for cognitive assessment over time [16, 17]. Assessment of changes over time are important for detecting and determining the progression of impairment [18], the efficacy of treatment, and the evaluation of therapeutic research interventions. Most such tools available are not suitable nor designed for high levels of precision and cannot be easily administered on a frequent basis. The solution to improve cognitive assessment has been suggested to be computerization [19, 20], but most such efforts have provided little more than computerization of commonly used neuropsychological tests [21, 22], and have not been developed to specifically address the critical issues of cognitive assessment required to understand early dementia and its progression [6, 23]. Therefore, new cognitive assessment tools should be computerized and based on an unlimited source of comparable tests, which are not limited by language or culture, that provide levels of accuracy, precision, and reliability which can be progressively improved. In addition, such tests must be fun and engaging, so that repeated testing will be considered a positive rather than onerous experience. On-line testing, in particular, offers the potential to meet this need, while providing rapid collection and analysis of data, and providing immediate feedback to participating individuals, clinicians, and researchers.
The present study was designed to assess the utility of an on-line adaptation of a continuous recognition task (CRT) paradigm [24], for assessing cognitive function in a population of community-dwelling individuals who had not been identified as having dementia. The CRT paradigm is widely used in academic studies of memory mechanisms [25]. The CRT approach was first implemented as an audience demonstration tool that provided data on individuals who were interested in memory problems [26]. Subsequently, this test was implemented on-line by a French company (HAPPYneuron, Inc.); by a US-based company, MemTrax, LLC (http://www.memtrax.com); by the Brain Health Registry (http://www.brainhealthregistry.org) (a URL developed by Dr. Michael Weiner, UCSF, and his team to support recruitment for studies of cognitive impairment) [27]; and by a Chinese company (http://www.memtrax.com.cn; SJN Biomed, LTD). This test, as of June 2018, has obtained data from over 200,000 users, and it is in trials in several countries.
In the present study, the MemTrax (MTX), a CRT-based test, was administered in conjunction with the MoCA in an independently-living elderly population in the northern Netherlands. The object of this study was to determine the relationship between performance on this implementation of the CRT and the MoCA. The question was whether the MTX would be useful for estimating cognitive functions assessed by the MoCA, which could indicate potential clinical applicability.
MATERIALS AND METHODS
Study population
Between October 2015 and May 2016, a cross-sectional study was performed among community-dwelling elderly in the northern Netherlands. Subjects (≥75y) were recruited through distribution of flyers and during group meetings organized for elderly people. Potential subjects were visited at home to screen for the inclusion and exclusion criteria before they were enrolled in this study. Subjects who suffered from (self-reported) dementia or who had severely impaired vision or hearing that would influence the administration of the cognitive tests were not allowed to participate in this study. In addition, subjects needed to be able to speak and comprehend the Dutch langue and not be illiterate. The study has been performed according to the Helsinki declaration of 1975 and all participants signed an informed consent form after receiving a detailed explanation of the study.
Study procedure
After enrollment in the study, a general questionnaire was administered, which included questions about demographic factors, such as age and years of education (starting at primary school), medical history, and alcohol consumption. Following completion of the questionnaire, the MoCA and MTX tests were administered in random order.
MemTrax
As a courtesy of MemTrax, LLC (Redwood City, CA, USA), free full versions of the MTX test were provided. In this test, a series of 50 images is shown for up to three seconds each. When an exact repeated image appeared (25/50), the subjects were instructed to react to the repeated image as quickly as possible by pressing the spacebar (which was indicated by a red colored tape). When the subject responded to an image, the next image was shown immediately. After finishing the test, the program shows the percentage of correct responses (MTXcorrect) and the average reaction time in seconds for repeated images, which reflects the time needed to press the spacebar when recognizing a repeated image. To match the dimensions of these two measures, the reaction time was converted into the reaction speed (MTXspeed) by dividing 1 by the reaction time (i.e., 1/MTXreaction time). The test history of all individual MTX scores and their validity was automatically saved online in the test account. The validity of all performed tests was checked, requiring 5 or fewer false positive responses, 10 or more correct recognitions, and average recognition time between 0.4 and 2 seconds, and only valid tests were included in the analysis.
Before the actual MTX test was administered, the test was explained in detail and a practice test was provided to the subjects. This included not only the test itself, but also the instruction and count-down pages to let the participant get accustomed to the layout of the site and the initial actions needed, before the start of the test. To avoid repetition of images during the actual test, images not included in the MTX database were used for the practice test.
Montreal cognitive assessment tool
Permission was obtained from the MoCA Institute & Clinique (Quebec, Canada) to use the MoCA for this research. The Dutch MoCA is available in three versions, which were randomly administered to the subjects. The MoCA score is the sum of performance on each separate cognitive domain assessed and has a maximum score of 30 points [11]. As per the official recommendation, an additional point was added if the participant had ≤12 years of education (if <30 points). The official test instructions were used as a guideline during the administration of the tests. The tests were administered by three trained researchers and administration of one test took about 10 to 15 min.
Data analysis
Based on the results of the MoCA, which was corrected for education, the subjects were divided in two groups of cognitive status: normal cognition (NC) versus mild cognitive impairment (MCI). The MoCA score of 23 was used as a cutoff for MCI (scores of 22 and below were considered MCI), as it was shown that this score showed overall ‘the best diagnostic accuracy across a range of parameters” compared to the initially recommended score of 26 or the values of 24 or 25 [28]. For all analyses, the corrected MoCA score was used as this score is used in clinical settings.
The MTX test gives two outcomes, namely MTXreaction time, which was converted to MTXspeed by 1/MTXreaction time, and MTXcorrect.
Statistical analyses were carried out using R (version 1.0.143, Rstudio Team, 2016). Normality was checked for all variables by the Shapiro-Wilk test. Variables of the whole study population, and of the NC and MCI groups, were reported as the mean ± standard deviation (SD), median and interquartile range (IQR) or as number and percentage. Independent sample T-tests and Wilcoxon Sum Rank tests for continuous variables and Chi-squared tests for categorical variables were performed to compare the characteristics of the NC and MCI group. The non-parametric Kruskal-Wallis test was used to determine if the three versions of the MoCA and the three administrators affected the MoCA results. In addition, an independent T-test or Wilcoxon Sum Rank test was performed to determine if the order of administration of the MoCA and MTX influenced the test results (e.g., MoCA score, MTXcorrect, and MTXspeed). This was performed by determining if the mean scores were different for the subjects who received first the MoCA and then the MTX or who received first the MTX and then the MoCA.
Pearson correlation tests were calculated to assess the relation between MTX and MoCA and between both MTX test results, e.g., MTXspeed and MTXcorrect. A previously executed sample size calculation showed that for an one-tailed Pearson correlation test (power = 80 % , α = 0.05), with the assumption of a medium effect size (r = 0.3), a minimal sample size of n = 67 was needed [29]. Polyserial correlation tests were calculated to assess the relation between the MTX test results and the separate MoCA domains using the psych package in R [30, 31].
The equivalent MoCA score for given MTX scores was calculated by computing the average MTX score for each possible MoCA score and linear regression was performed to estimate the equations relating these measures. In addition, to determine the cutoff values of the MTX test for MCI measured by MoCA, and the corresponding sensitivity and specificity values, a Receiver Operator Characteristic (ROC) analysis was performed using the pROC package in R [32]. Non-parametric stratified bootstrapping (n = 2000) was used to compare the area under the curves (AUCs) and the corresponding confidence intervals. The optimal cutoff score was calculated with the Youden method, which maximizes the true positives while minimizing false positives [33, 34].
For all statistical analyses, a two-sided p-value of <0.05 was considered as threshold for statistical significance, except for the analysis to assess the relation between MTX and MoCA (i.e., correlation analysis and simple linear regression) for which a one-sided p-value of <0.05 was considered as significant.
RESULTS
Subjects
In total, 101 subjects were included in this study. Data of 19 persons were excluded from analysis, as the MTX test results from 12 subjects were not saved by the program, 6 subjects had invalid MTX test results, and one subject had a MoCA score of 8 points, indicating severe cognitive impairment, which was an exclusion criterion. Therefore, data from 82 subjects were included in the analysis. No significant differences in the MoCA test results were found between the different versions of the MoCA and between the administrators. In addition, the order of test administration had no significant effect on any of the test scores (MoCA, MTXspeed, MTXcorrect). Based on the MoCA test results, subjects were placed in the NC or MCI group (e.g., MoCA ≥ 23 or MoCA <23, respectively). The subject characteristics for the total study population, and the NC and MCI groups are presented in Table 1. No significant differences were present between groups, except median MoCA scores (25 (IQR: 23 – 26) versus 21 (IQR: 19 – 22) points, Z = -7.7, p <0.001).
Table 1
Subject characteristics
| Total study population (n = 82) | NC (n = 45) | MCI (n = 37) | p | |
| Age (y) | 83.5 ± 5.2 | 82.6 ± 4.9 | 84.7 ± 5.4 | 0.074 |
| Female, No. (%) | 55 (67) | 27 (60) | 28 (76) | 0.133 |
| Education (y) | 10.0 (8.0 – 13.0) | 11.0 (8.0 – 14.0) | 10.0 (8.0 – 12.0) | 0.216 |
| Alcohol intake (# glasses/week) | 0 (0 – 4) | 0 (0 – 3) | 0 (0 – 5) | 0.900 |
| MoCA score (# points) | 23 (21 – 25) | 25 (23 – 26) | 21 (19 – 22) | n.a. |
Values are expressed as mean ± sd, median (IQR) or as number with percentage.
Cognitive status measured by MTX
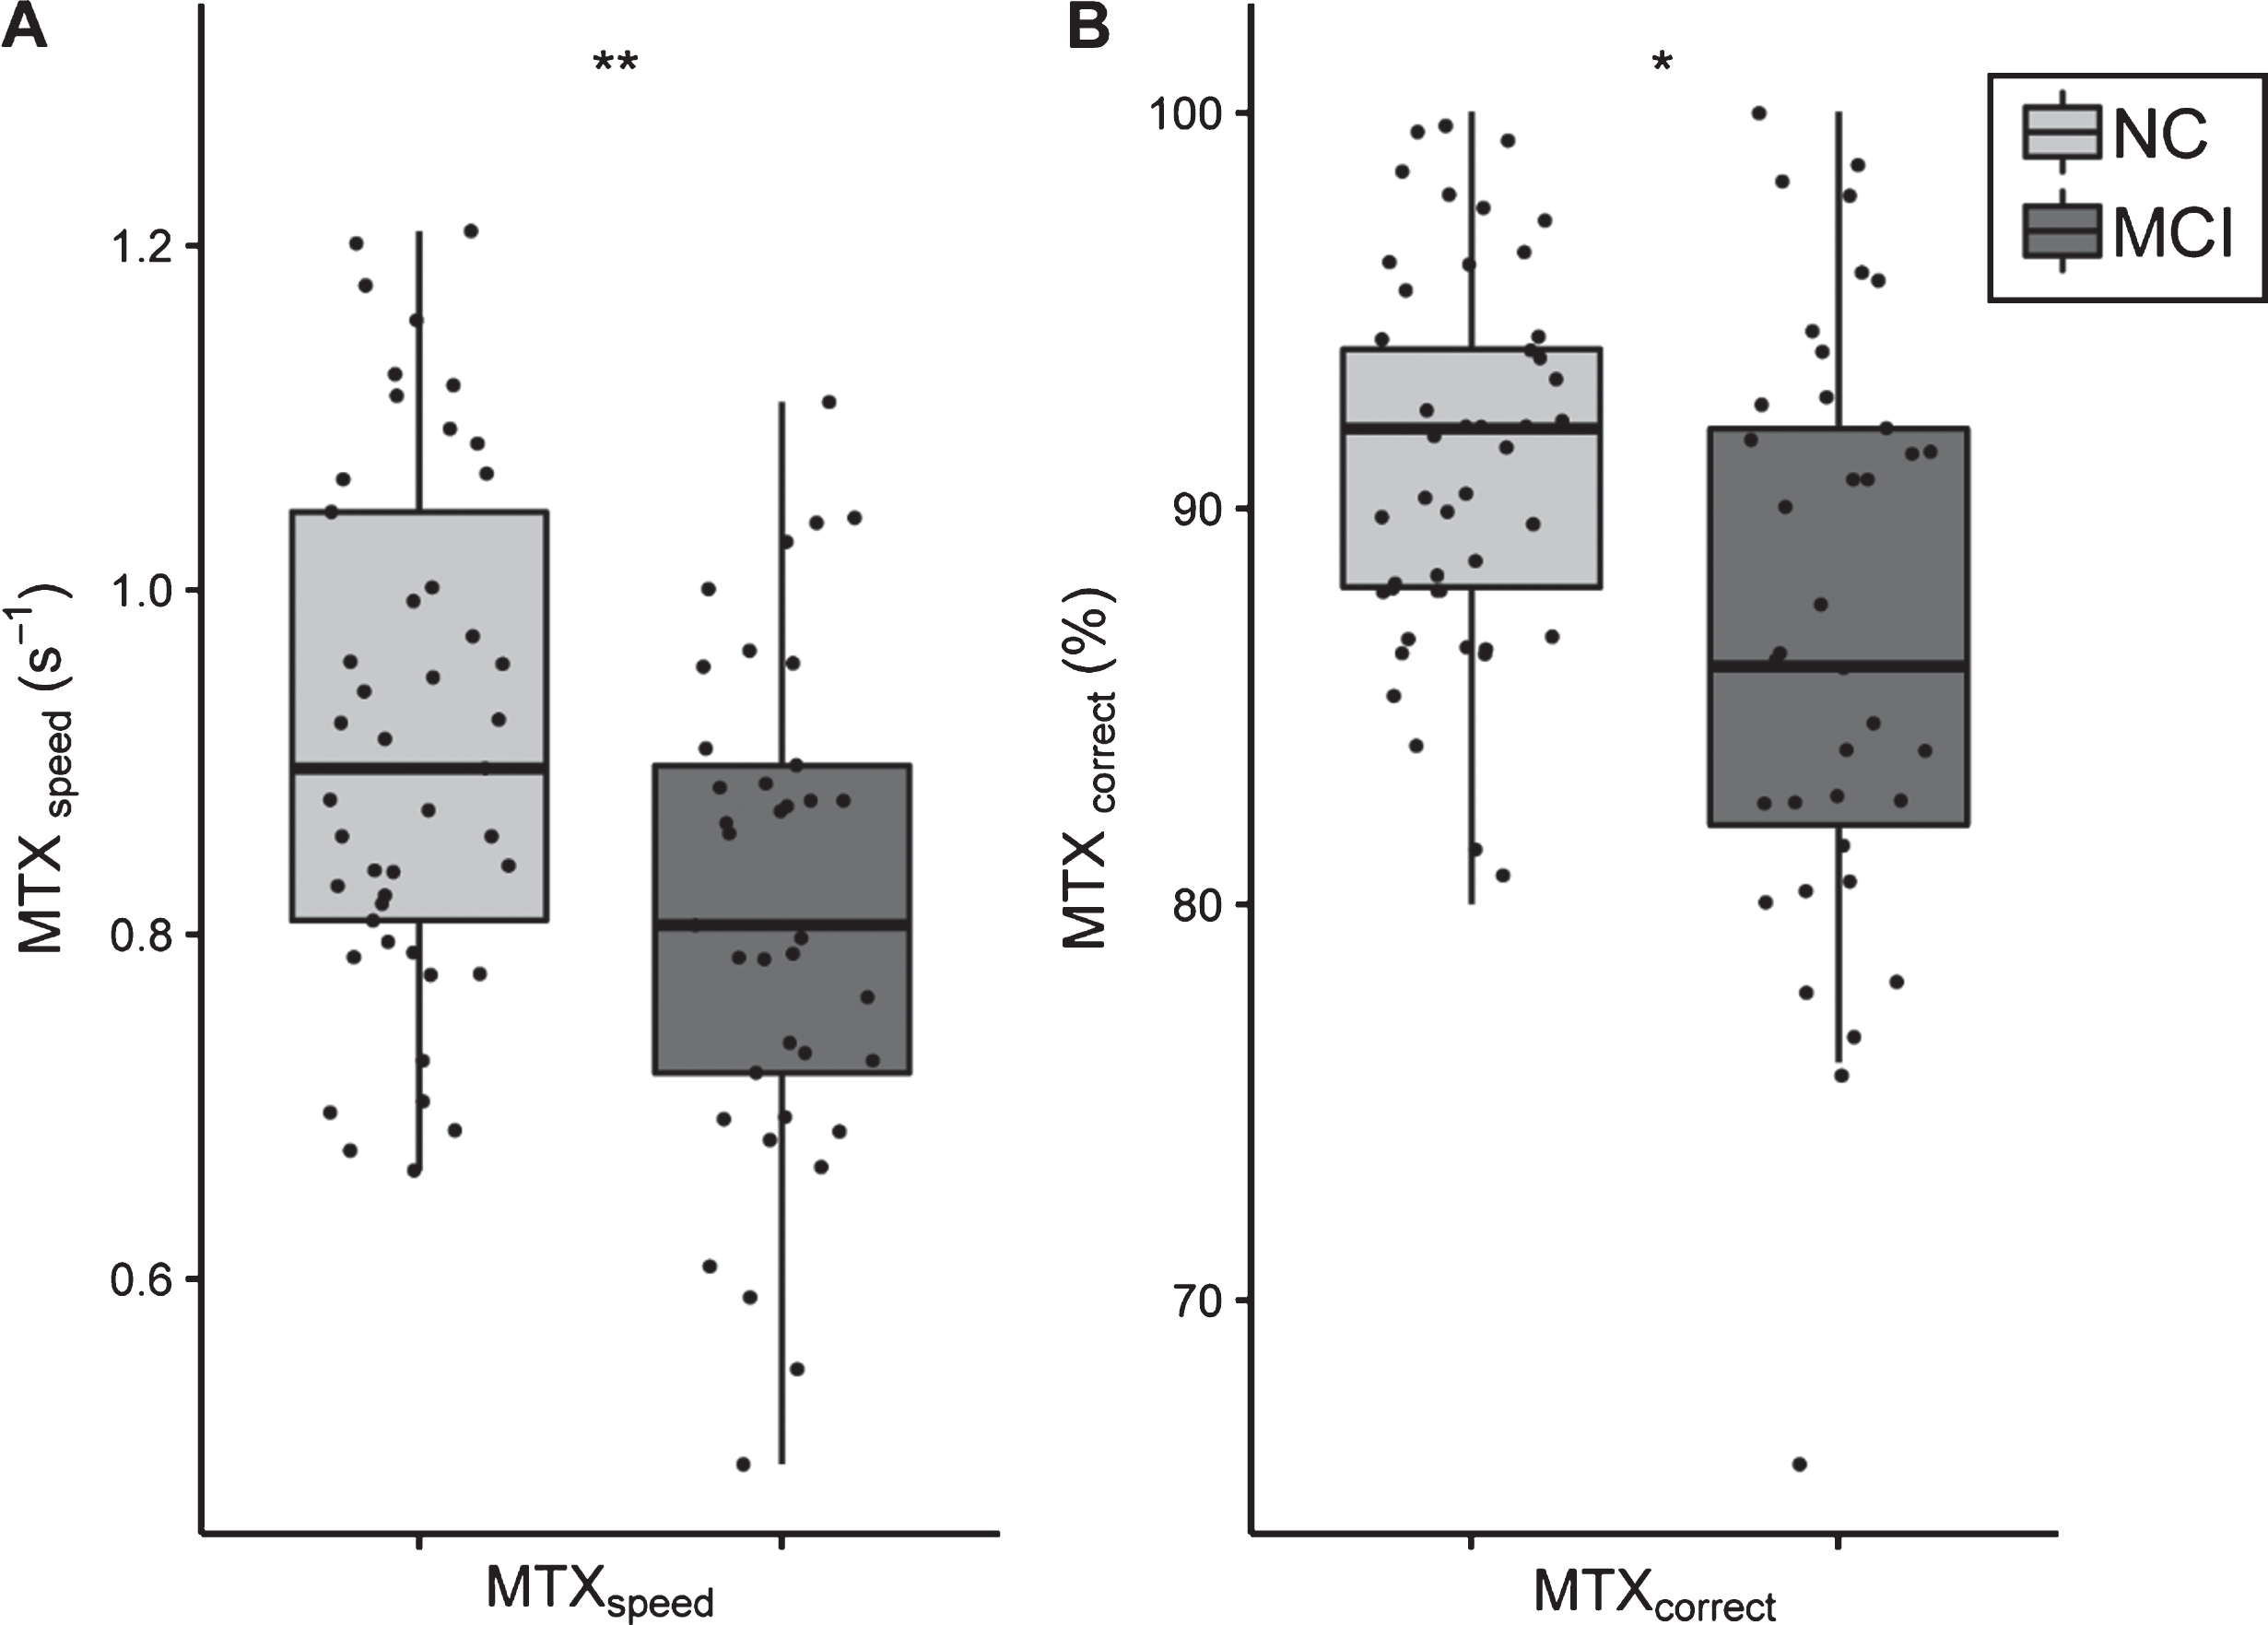
Cognitive status was measured by the MTX test. Figure 1 shows the results of the cognitive test outcomes of NC and MCI subjects. The mean MTX scores (e.g., MTXspeed and MTXcorrect) were significantly different between the two groups. NC subjects (0.916 ± 0.152 s-1) had a significant faster reaction speed compared to MCI subjects (0.816 ± 0.146 s-1); t(80) = 3.01, p = 0.003) (Fig. 1A). In addition, NC subjects had a better score on the MTXcorrect variable than MCI subjects (91.2 ± 5.0% versus 87.0 ± 7.7% respectively; tw (59) = 2.89, p = 0.005) (Fig. 1B).
Fig.1
Boxplots of MTX test results for NC and MCI groups. A) MTXspeed test result and B) MTXcorrect test result. Both outcome variables of the MTX tests are significantly lower in the MCI group compared to NC. The light grey color indicates NC subjects, whereas the dark grey color indicates MCI subjects.
Correlation between MTX and MOCA
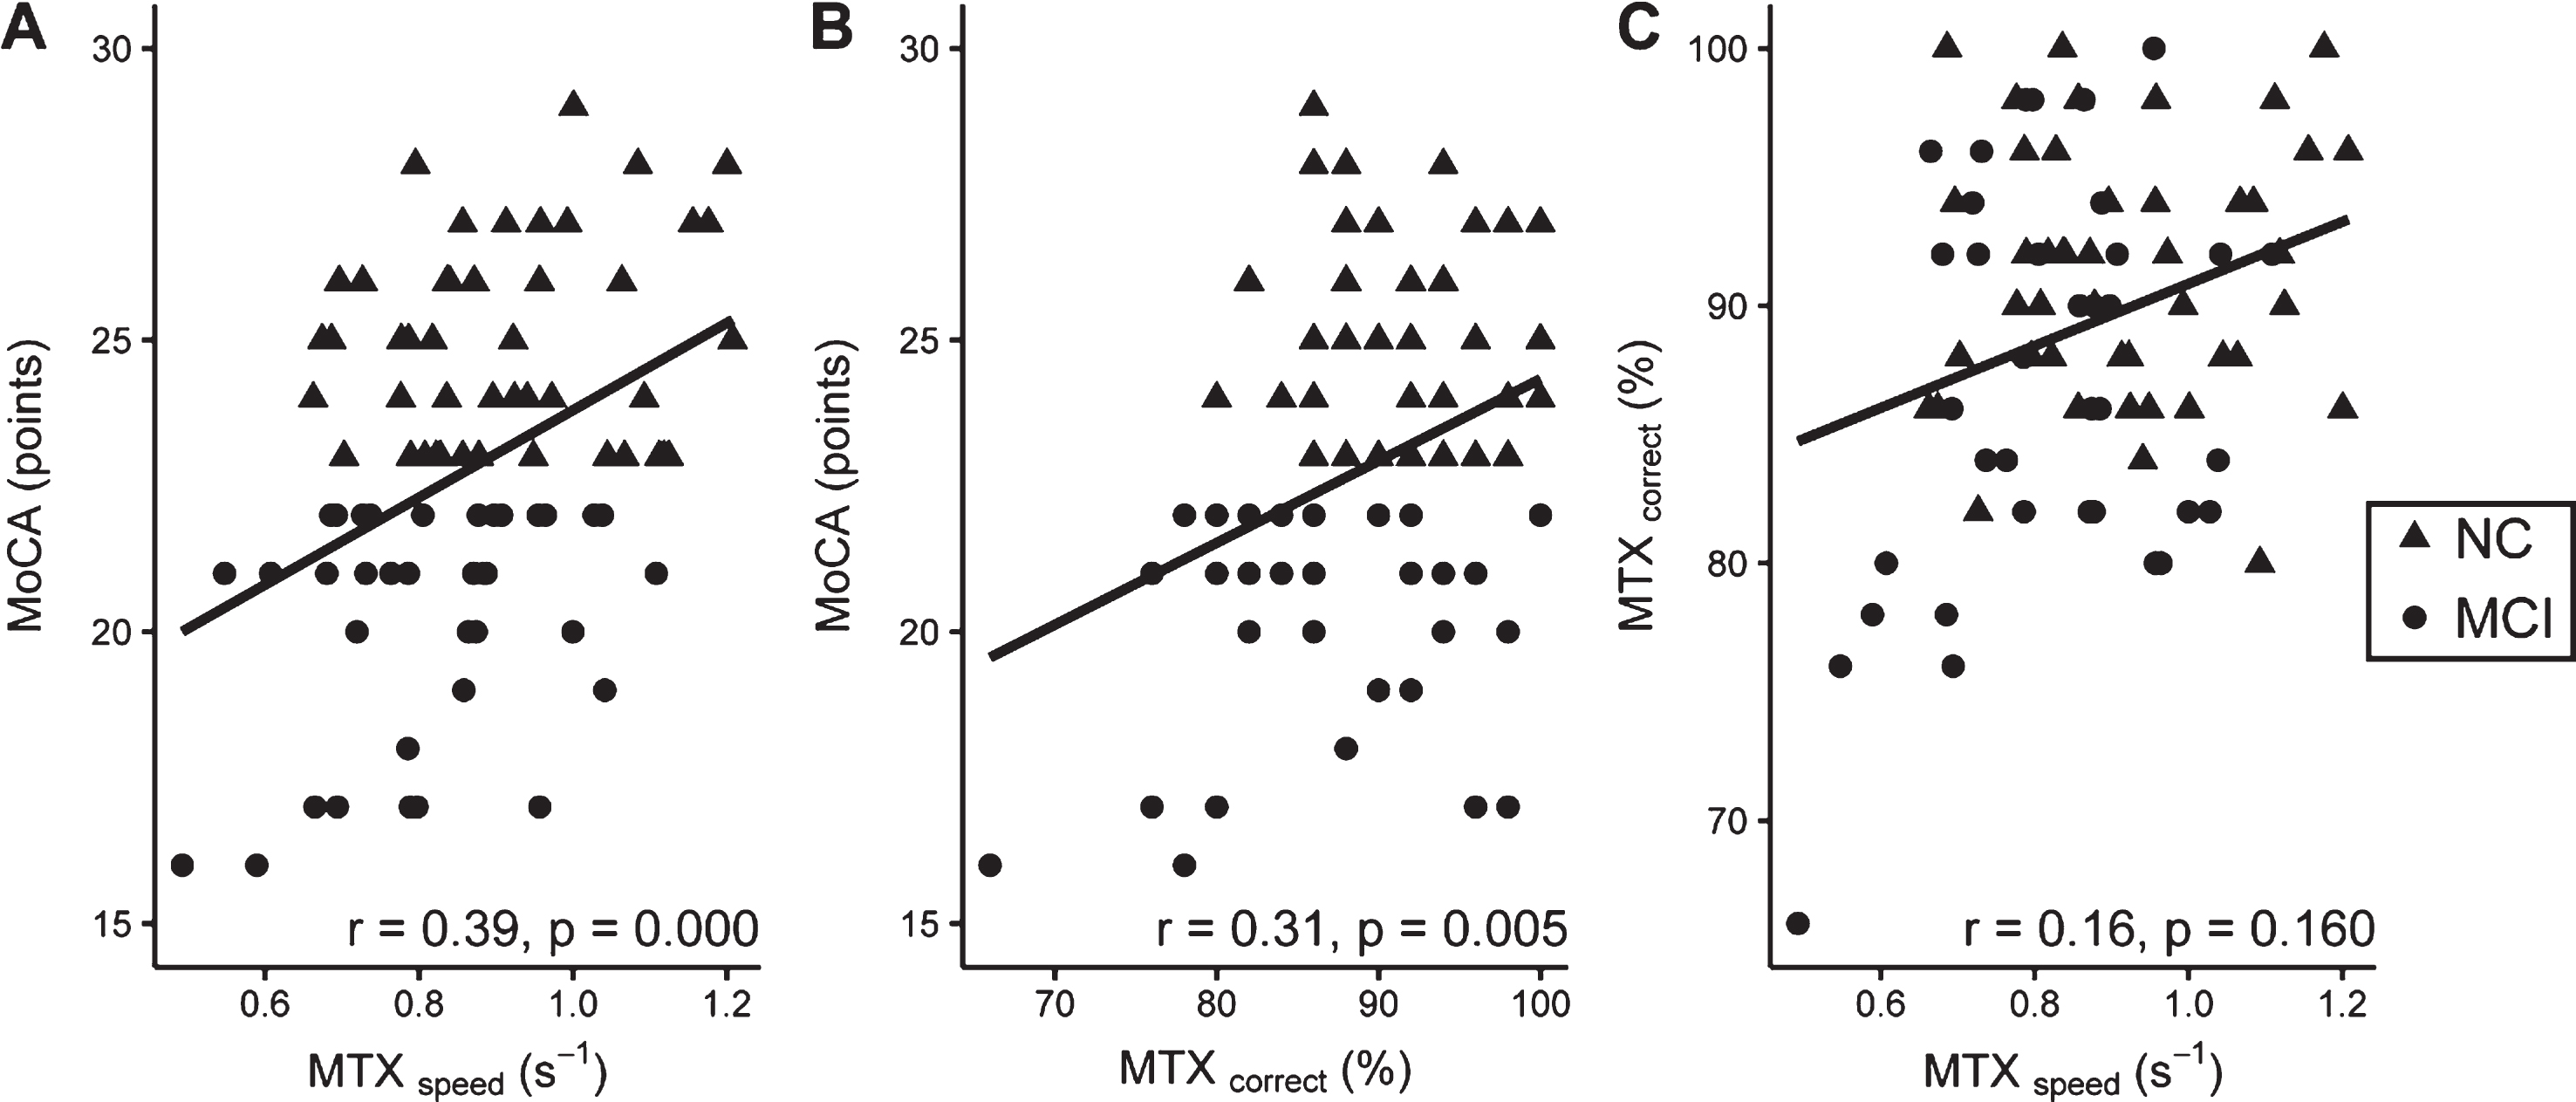
Associations between MTX test scores and MoCA are shown in Fig. 2. Both MTX variables were positively associated with the MoCA. MTXspeed and MoCA showed a significant correlation of r = 0.39 (p = 0.000), and the correlation between MTXcorrect and MoCA was r = 0.31 (p = 0.005). There was no association between MTXspeed and MTXcorrect.
Fig.2
Associations between A) MTXspeed and MoCA; B) MTXcorrect and MoCA; C) MTXcorrect and MTXspeed. NC and MCI subjects are indicated with dots and triangles respectively. In the right bottom corner of each graph the rho and corresponding p value are shown of the correlation between the two variables.
Polyserial correlations were calculated between the MTX test scores and the MoCA domains to determine the association of each domain with the MTX metrics. The polyserial correlations are shown in Table 2. Multiple domains of the MoCA were significantly correlated with MTXspeed . The domain “abstraction” showed the highest correlation, although moderate, with MTXspeed (r = 0.35, p = 0.002). The domains “naming” and “language” showed a weak to moderate significant association with MTXspeed (r = 0.29, p = 0.026 and r = 0.27, p = 0.012, respectively). MTXcorrect was not significantly associated to the MoCA domains, except for a weak correlation with the domain “visuospatial” (r = 0.25, p = 0.021).
Table 2
Polyserial correlations of MTX test outcomes with MoCA domains
| MTXspeed | MTXcorrect | |||
| r | p | r | p | |
| Visuospatial | 0.22 | 0.046 | 0.25 | 0.021 |
| Naming | 0.29 | 0.026 | 0.24 | 0.063 |
| Attention | 0.24 | 0.046 | 0.09 | 0.477 |
| Language | 0.27 | 0.012 | 0.160 | 0.165 |
| Abstraction | 0.35 | 0.002 | 0.211 | 0.079 |
| Recall | 0.15 | 0.159 | 0.143 | 0.163 |
| Orientation | 0.21 | 0.156 | 0.005 | 0.972 |
Note: Significant correlations are indicated in bold.
MTX scores and estimated cutoff values for MCI
To determine the corresponding scores of MTX and MoCA, the MTX scores of each MoCA score were averaged and linear regression was calculated to predict the relationships and corresponding equations. The results of the linear regression indicated that MTXspeed explained 55% of the variance in MoCA (R2 = 0.55, p = 0.001). The variable MTXcorrect explained 21% of the variance in MoCA (R2 = 0.21, p = 0.048). Based on the equations of these relationships, equivalent MoCA scores were calculated for given MTX scores, which are shown in Table 3. Based on these equations, the corresponding cutoff values (e.g., MoCA score of 23 points) for MTXspeed and MTXcorrect are 0.87 s-1 and 90%. In addition, multiple linear regression on both MTX variables was performed, but the variable MTXcorrect did not significantly contribute to the model and therefore the results are not shown.
Table 3
Suggested equivalent MoCA score for given MTX scores
| MoCA (points) | Equivalent MTXspeed (s-1)a | CI of prediction with MTXspeed (points) | Equivalent MTXcorrect (%)b | CI of prediction with MTXcorrect (points) |
| 15 | 0.55 | 7 – 23 | 68 | 3 – 28 |
| 16 | 0.59 | 8 – 24 | 71 | 5 – 28 |
| 17 | 0.63 | 10 – 24 | 73 | 6 – 28 |
| 18 | 0.67 | 11 – 25 | 76 | 8 – 28 |
| 19 | 0.71 | 12 – 26 | 79 | 9 – 29 |
| 20 | 0.75 | 13 – 27 | 82 | 11 – 29 |
| 21 | 0.79 | 14 – 28 | 84 | 12 – 30 |
| 22 | 0.83 | 15 – 29 | 87 | 13 – 30 |
| 23 | 0.87 | 16 – 30 | 90 | 14 – 30 |
| 24 | 0.91 | 17 – 30 | 93 | 15 – 30 |
| 25 | 0.95 | 18 – 30 | 95 | 16 – 30 |
| 26 | 0.99 | 19 – 30 | 98 | 16 – 30 |
| 27 | 1.03 | 20 – 30 | 100 | 17 – 30 |
| 28 | 1.07 | 21 – 30 | 100 | 17 – 30 |
| 29 | 1.11 | 21 – 30 | 100 | 17 – 30 |
| 30 | 1.15 | 22 – 30 | 100 | 17 – 30 |
aEquation used: 1.1 + 25.2 *MTXspeed; b Equation used: –9.7 + 0.36 *MTXcorrect.
In addition, MTX cutoff values and the corresponding sensitivity and specificity were determined via a ROC analysis. The ROC curves of the MTX variables are presented in Fig. 3. The AUCs for MTXspeed and MTXcorrect are, respectively, 66.7 (CI: 54.9 – 78.4) and 66.4% (CI: 54.1 – 78.7). The AUCs of the MTX variables used to assess MCI established by MoCA were not significantly different. Table 4 shows the sensitivity and specificity of different cutoff points of the MTX variables. The optimal cutoff scores, which maximized true positives while minimizing false positives, for MTXspeed and MTXcorrect were 0.91 s-1 (sensitivity = 48.9% specificity = 78.4%) and 85% (sensitivity = 43.2%; specificity = 93.3%), respectively.
Fig.3
ROC curves of the MTX test outcomes to assess MCI rated by MoCA. The dotted line indicates MTXspeed and the solid line MTXcorrect. The grey line represents the reference line of 0.5.
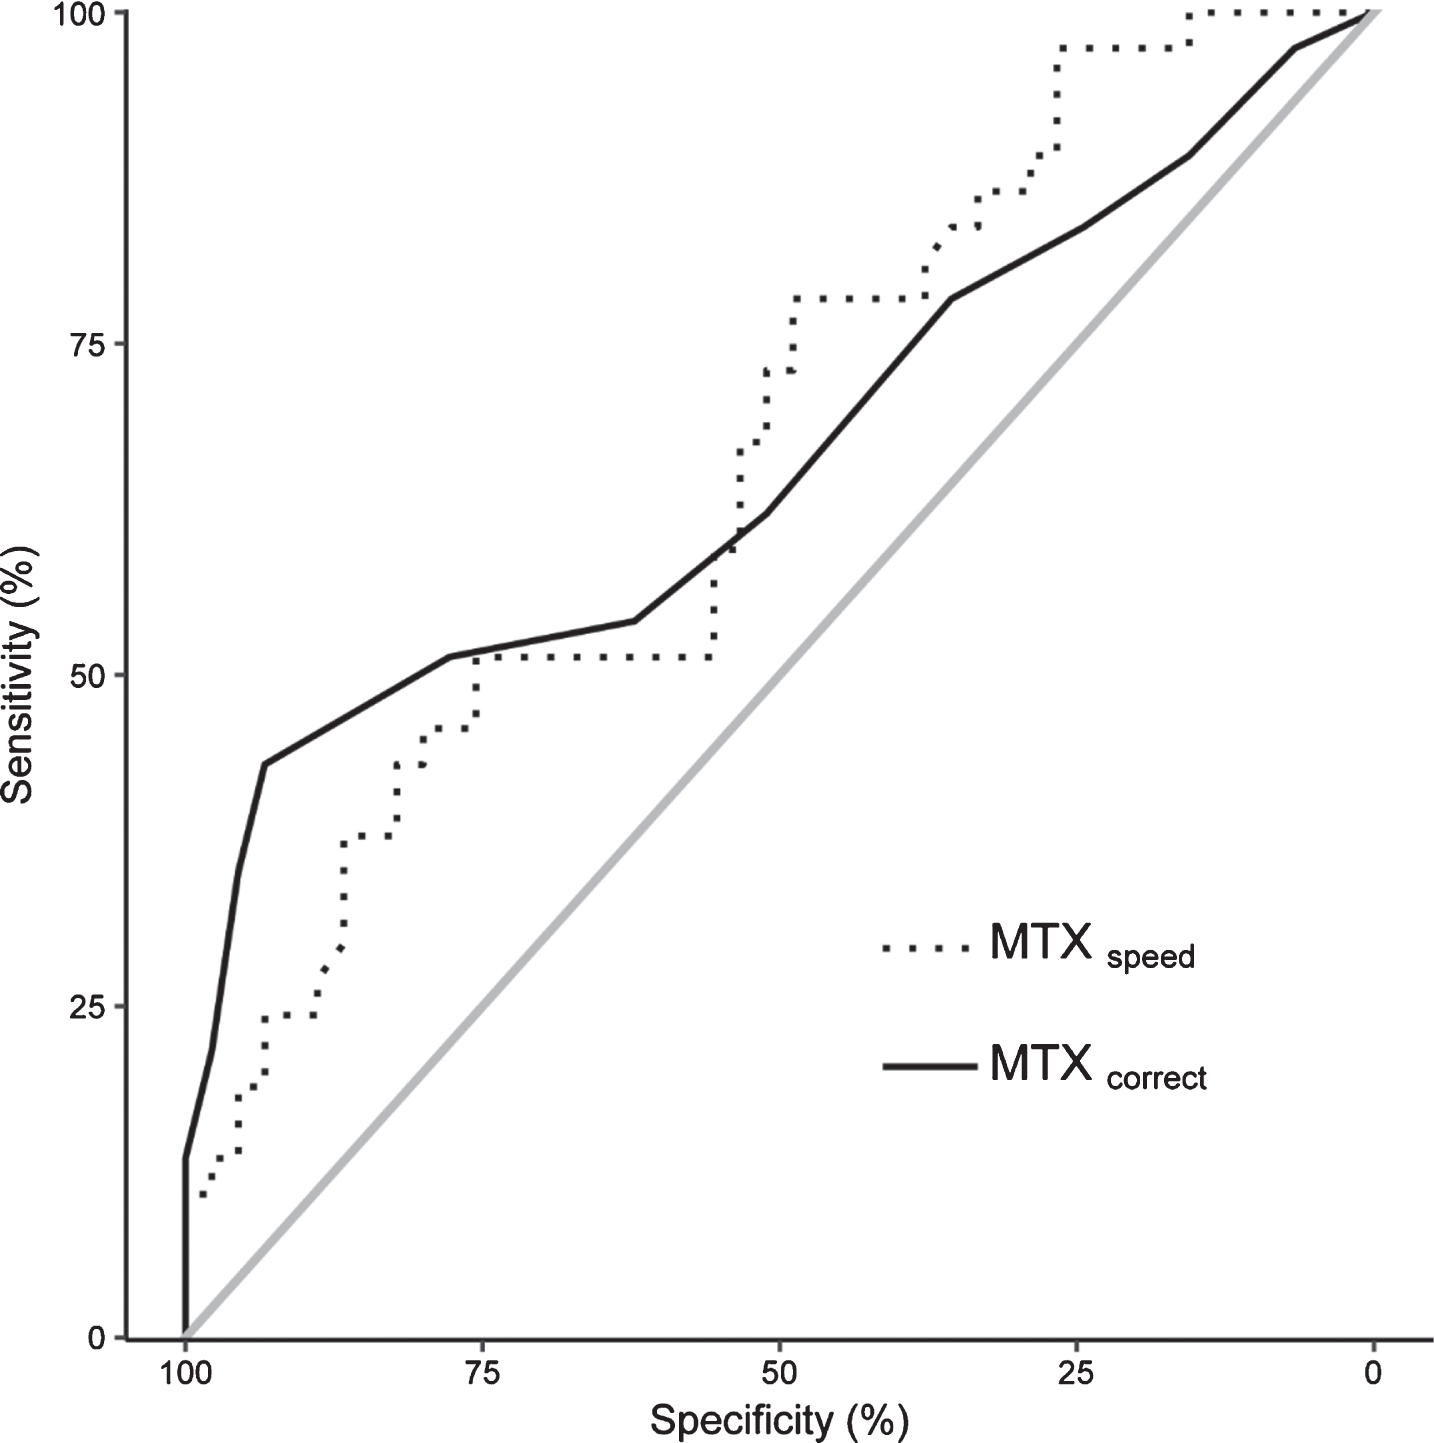
Table 4
MTXspeed and MTXcorrect cutoff points and corresponding specificity and sensitivity
| Cutoff point | Tp (#) | tn (#) | Fp (#) | Fn (#) | Specificity (%) | Sensitivity (%) | |
| MTXspeed | 1.20 | 37 | 1 | 44 | 0 | 2.2 | 100 |
| 1.10 | 36 | 7 | 38 | 1 | 15.6 | 97.3 | |
| 1.0 | 33 | 13 | 32 | 4 | 28.9 | 89.2 | |
| 0.90 | 28 | 22 | 23 | 9 | 48.9 | 75.7 | |
| 0.80 | 18 | 34 | 11 | 19 | 75.6 | 48.6 | |
| 0.70 | 9 | 41 | 4 | 28 | 91.1 | 24.3 | |
| 0.60 | 3 | 45 | 0 | 34 | 100 | 8.1 | |
| MTXcorrect | 99 | 36 | 3 | 42 | 1 | 97.3 | 6.7 |
| 95 | 31 | 11 | 34 | 6 | 83.8 | 24.4 | |
| 91 | 23 | 23 | 22 | 14 | 62.2 | 51.1 | |
| 89 | 20 | 28 | 17 | 17 | 54.1 | 62.2 | |
| 85 | 16 | 42 | 3 | 21 | 43.2 | 93.3 | |
| 81 | 8 | 44 | 1 | 29 | 21.6 | 97.8 | |
| 77 | 3 | 45 | 0 | 34 | 8.1 | 100 |
tp, true positive; tn, true negative; fp, false positive; fn, false negative.
DISCUSSION
This study was set up to investigate the on-line MTX tool, a CRT-based test, using the MoCA as reference. The MoCA was chosen because this test is currently widely used to screen for MCI. However, the optimal cut-points for the MoCA are not clearly established [28]. The comparisons of the individual measures of MTX with the MoCA show that a simple, short, on-line test can capture a significant proportion of the variance in cognitive functioning and cognitive impairment. In this analysis, the strongest effect was seen for the speed measure. The correctness measure showed a less robust relationship. A significant finding was that no correlation was observed between the MTX speed and correctness measures, indicating that these variables measure different components of the underlying brain processing function. Thus, no indication of a speed-accuracy trade-off was found across subjects. In addition, two different methods were used to estimate the cutoff values of the MTX test to detect MCI. These methods showed that for the outcomes speed and correctness, a score below the ranges of respectively 0.87 – 91 s-1 and 85 – 90% are an indication that individuals who score below one of those ranges are more likely to have MCI. A “cost-worthiness analysis” would indicate at what point an individual should be advised to consult a physician about performing more comprehensive tests to screen for MCI [8, 35].
In the present study, it was found that the domains “naming”, “language”, and “abstraction” measured by the MoCA had the highest correlations with one of the MTX outcomes, although the correlations were weak to moderate. This is in contrast to what was expected, since previous studies showed in examining the Mini-Mental State Exam using Item Response Theory, that the domains “memory/delayed recall” and “orientation” were the most sensitive to early AD [12]. At this very early stage of cognitive dysfunction, it appears that MoCA indicators of subtle impairments in naming, language, and abstraction are more sensitive to MCI than the measures of memory and orientation, consistent with previous findings in an Item Response Theory analysis of the MoCA [36]. Further, the MTX measure of recognition speed appears to reflect this early impairment before recognition memory as measured by MTX (which has a significant ceiling effect). This constellation of effects suggests that the complex aspects of the pathology causing MCI reflect the early brain changes which have been difficult to conceptualize with simple neurocognitive approaches and may actually reflect the progression of the underlying neuropathology [37].
Strong points in the present study are that the sample size (n = 82) was more than adequate to detect the correlations between the MoCA and MTX in this relatively old population. In addition, a practice test was administered to all subjects, so that elderly individuals who were not used to a computer had a chance to adjust to the testing environment and the equipment. Compared to the MoCA, subjects indicated that the MTX was more fun to do, whereas the MoCA felt more like an exam. The age of the subjects and their community independence restricted the focus of the analysis to this select group of relatively high-functioning individuals, but this group is among the most difficult for impairment identification.
Of note, although considered a standard screening test, the MoCA is only a test for indicating the possible presence of MCI, not a diagnostic tool or an absolute measurement of cognitive dysfunction. So, accordingly, the comparison of the MoCA and MTX is relative, and either is likely to have captured independent variance in the MCI identification. Accordingly, an important issue in the literature has been the effort to define the usefulness of the MoCA [38], its validation [39], the establishment of normative scores [40], the comparison with other brief cognitive assessments [41–45], and its utility as a screening tool for MCI [46] (reviewed by Carson et al., 2017 [28]), as well as the applicability of an electronic version [47]. Such analyses involve examination of sensitivity and specificity, usually using ROC analysis with measurement of “area under the curve”, and the recommendation of a cutoff for “diagnosis”. However, in the absence of any approach for determining absolutely where an individual lies on the continuum of mild impairment, together with the tremendous variability in the underlying brain functions contributing to that impairment, all such tools can only provide a probabilistic estimation. Providing correlations between different measures only shows that the underlying condition is being correctly addressed, but the real biological state cannot be precisely defined with this approach. Though higher level analyses can be practically useful in a clinical setting, establishment of such utility requires additional consideration of four factors: the prevalence of the condition in the population; the cost of test, the cost of the false-positive results, and the material benefit of true positive diagnosis [8, 35].
A major part of the problem in evaluating AD and its associated cognitive impairment is that there are no real “stages” [48], but rather a temporal continuum of progression [8, 17, 49]. The distinction of “normal” from MCI is actually much more difficult than distinguishing either of these conditions from the mild dementia associated with AD [50, 51]. Using the concept of “Modern Test Theory”, the issue becomes determining where on the continuum an individual is most likely to be within a particular confidence-interval range, given a particular test score. To make such determinations, more precise assessments are needed than are provided by most brief cognitive tests, but such as are provided by MTX. Increased precision and removal of observer bias with computerized testing is a promising direction. Also, a computerized test, such as the MTX, provides the possibility of an unlimited number of comparable tests, substantially reducing the variance of the impairment estimation. Further, in principle, computerized testing can test many of the memory-related domains affected by AD. This study did not compare MTX with the numerous other computerized tests which have been created (see introduction), but none of the ones available so far use the powerful approach offered by a CRT. Further development of computerized testing is an important area for further attention and support. Finally, training effects can be factored into the analyses.
At this time, computerized on-line testing is not an established approach to screen for dementia, assess cognitive impairment, or make any clinical diagnosis. However, the power and potential of this approach, particularly the use of CRT, to evaluate episodic (short-term) memory, is enormous and will likely be critical in future applications of cognitive evaluation, including dementia screening and assessment, post-operative confusion monitoring, establishment of mental capacity for decision making, detecting post-concussion deficits, and estimation of potential impairment for driving safety. In this study, it is shown that MTX can capture a significant proportion of the variance of cognitive impairment. In addition, cutoff values are presented for the MTX variables that are equal to the MoCA cutoff score for MCI. For future research, it is suggested to investigate in larger, more clearly defined populations to establish MTX as screening tool for MCI. Such population should include clinical samples where diagnostic issues can be defined as precisely as possible and subjects can be followed over time with MTX and other cognitive tests. Such analyses can determine variations in the trajectories of cognitive decline, related to both normal aging and various pathological conditions. As computerized testing and registries develop, much more information about levels of health will become available and undoubtedly lead to great improvement in health care and hopefully approaches to preventing such conditions as AD.
ACKNOWLEDGMENTS
We would like to thank Anne van der Heijden, Hanneke Rasing, Esther Sinnema, and Melinda Lodders for their work in this study. In addition, we would like to thank the MemTrax, LLC for providing free full versions of the MemTrax test. This work is part of a research program, which is financed by the Province of Fryslân (01120657), the Netherlands and Alfasigma Nederland B.V (direct contribution to grant number 01120657).
Authors’ disclosures available online (https://www.j-alz.com/manuscript-disclosures/18-1003r1).
REFERENCES
[1] | Jorm AF , Jolley D ((1998) ) The incidence of dementia: a meta-analysis. Neurology 51: , 728–733. |
[2] | Hebert LE , Weuve. J , Scherr PA , Evans DA ((2013) ) Alzheimer disease in the United States (2010-2050) estimated using the 2010 census. Neurology 80: , 1778–1783. |
[3] | Weuve. J , Hebert LE , Scherr PA , Evans DA ((2015) ) Prevalence of Alzheimer disease in US states. Epidemiology 26: , e4–6. |
[4] | Brookmeyer R , Abdalla N , Kawas CH , Corrada MM ((2018) ) Forecasting the prevalence of preclinical and clinical Alzheimer’s disease in the United States. Alzheimers Dement 14: , 121–129. |
[5] | Borson S , Frank L , Bayley PJ , Boustani M , Dean M , Lin PJ , McCarten JR , Morris JC , Salmon DP , Schmitt FA , Stefanacci RG , Mendiondo MS , Peschin S , Hall EJ , Fillit H , Ashford JW ((2013) ) Improving dementia care: the role of screening and detection of cognitive impairment. Alzheimers Dement 9: , 151–159. |
[6] | Loewenstein DA , Curiel RE , Duara R , Buschke H ((2018) ) Novel cognitive paradigms for the detection of memory impairment in preclinical Alzheimer’s disease. Assessment 25: , 348–359. |
[7] | Thyrian JR , Hoffmann W , Eichler T ((2018) ) Editorial: Early recognition of dementia in primary care-current issues and concepts. Curr Alzheimer Res 15: , 2–4. |
[8] | Ashford JW ((2008) ) Screening for memory disorders, dementia, and Alzheimer’s disease. Aging Health 4: , 399–432. |
[9] | Yokomizo JE , Simon SS , Bottino CM ((2014) ) Cognitive screening for dementia in primary care: a systematic review. Int Psychogeriatr 26: , 1783–1804. |
[10] | Bayley PJ , Kong JY , Mendiondo M , Lazzeroni LC , Borson S , Buschke H , Dean M , Fillit H , Frank L , Schmitt FA , Peschin S , Finkel S , Austen M , Steinberg C , Ashford JW ((2015) ) Findings from the National Memory Screening Day program. J Am Geriatr Soc 63: , 309–314. |
[11] | Nasreddine ZS , Phillips NA , Bedirian V , Charbonneau S , Whitehead V , Collin I , Cummings JL , Chertkow H ((2005) ) The Montreal Cognitive Assessment, MoCA: a brief screening tool for mild cognitive impairment. J Am Geriatr Soc 53: , 695–699. |
[12] | Ashford JW , Kolm P , Colliver JA , Bekian C , Hsu LN ((1989) ) Alzheimer patient evaluation and the mini-mental state: item characteristic curve analysis. J Gerontol 44: , P139–P146. |
[13] | Ashford JW , Jarvik L ((1985) ) Alzheimer’s disease: does neuron plasticity predispose to axonal neurofibrillary degeneration? N Engl J Med 313: , 388–389. |
[14] | Ashford JW ((2015) ) Treatment of Alzheimer’s disease: the legacy of the cholinergic hypothesis, neuroplasticity, and future directions. J Alzheimers Dis 47: , 149–156. |
[15] | Larner AJ ((2015) ) Performance-based cognitive screening instruments: an extended analysis of the time versus accuracy trade-off. Diagnostics (Basel) 5: , 504–512. |
[16] | Ashford JW , Shan M , Butler S , Rajasekar A , Schmitt FA ((1995) ) Temporal quantification of Alzheimer’s disease severity: ‘time index’ model. Dementia 6: , 269–280. |
[17] | Ashford JW , Schmitt FA ((2001) ) Modeling the time-course of Alzheimer dementia. Curr Psychiatry Rep 3: , 20–28. |
[18] | Li K , Chan W , Doody RS , Quinn J , Luo S ((2017) ) Prediction of conversion to Alzheimer’s disease with longitudinal measures and time-to-event data. J Alzheimers Dis 58: , 361–371. |
[19] | Dede E , Zalonis I , Gatzonis S , Sakas D ((2015) ) Integration of computers in cognitive assessment and level of comprehensiveness of frequently used computerized batteries. Neurol Psychiatry Brain Res 21: , 128–135. |
[20] | Siraly E , Szabo A , Szita B , Kovacs V , Fodor Z , Marosi C , Salacz P , Hidasi Z , Maros V , Hanak P , Csibri E , Csukly G ((2015) ) Monitoring the early signs of cognitive decline in elderly by computer games: an MRI study. PLoS One 10: , e0117918. |
[21] | Gates NJ , Kochan NA ((2015) ) Computerized and on-line neuropsychological testing for late-life cognition and neurocognitive disorders: are we there yet? Curr Opin Psychiatry 28: , 165–172. |
[22] | Zygouris S , Tsolaki M ((2015) ) Computerized cognitive testing for older adults: a review. Am J Alzheimers Dis Other Demen 30: , 13–28. |
[23] | Possin KL , Moskowitz T , Erlhoff SJ , Rogers KM , Johnson ET , Steele NZR , Higgins JJ , Stiver. J , Alioto AG , Farias ST , Miller BL , Rankin KP ((2018) ) The Brain Health Assessment for detecting and diagnosing neurocognitive disorders. J Am Geriatr Soc 66: , 150–156. |
[24] | Shepard RN , Teghtsoonian M ((1961) ) Retention of information under conditions approaching a steady state. J Exp Psychol 62: , 302–309. |
[25] | Wixted JT , Goldinger SD , Squire LR , Kuhn JR , Papesh MH , Smith KA , Treiman DM , Steinmetz PN ((2018) ) Coding of episodic memory in the human hippocampus. Proc Natl Acad Sci U S A 115: , 1093–1098. |
[26] | Ashford JW , Gere E , Bayley PJ ((2011) ) Measuring memory in large group settings using a continuous recognition test. J Alzheimers Dis 27: , 885–895. |
[27] | Weiner MW , Nosheny R , Camacho M , Truran-Sacrey D , Mackin RS , Flenniken D , Ulbricht A , Insel P , Finley S , Fockler J , Veitch D ((2018) ) The Brain Health Registry: An internet-based platform for recruitment, assessment, and longitudinal monitoring of participants for neuroscience studies. Alzheimers Dement 14: , 1063–1076. |
[28] | Carson N , Leach L , Murphy KJ ((2018) ) A re-examination of Montreal Cognitive Assessment (MoCA) cutoff scores. Int J Geriatr Psychiatry 33: , 379–388. |
[29] | Faul F , Erdfelder E , Buchner A , Lang AG ((2009) ) Statistical power analyses using G*Power 3.1: tests for correlation and regression analyses. Behav Res Methods 41: , 1149–1160. |
[30] | Drasgow F ((1986) ) Polychoric and polyserial correlations. In Encyclopedia of Statistical Sciences, Kotz S , Johnson NL , Read CB , eds. John Wiley & Sons, New York, pp. 68–74. |
[31] | Revelle WR ((2018) ) psych: Procedures for Personality and Psychological Research. Northwestern University, Evanston, IL, USA. https://CRAN.R-project.org/package=psych. |
[32] | Robin X , Turck N , Hainard A , Tiberti N , Lisacek F , Sanchez JC , Muller M ((2011) ) pROC: an open-source package for R and S+ to analyze and compare ROC curves. BMC Bioinformatics 12: , 77. |
[33] | Fluss R , Faraggi D , Reiser B ((2005) ) Estimation of the Youden Index and its associated cutoff point. Biom J 47: , 458–472. |
[34] | Youden WJ ((1950) ) Index for rating diagnostic tests. Cancer 3: , 32–35. |
[35] | Kraemer H ((1992) ) Evaluating Medical Tests, Sage Publications, Inc., Newbury Park, CA. |
[36] | Tsai CF , Lee WJ , Wang SJ , Shia BC , Nasreddine Z , Fuh JL ((2012) ) Psychometrics of the Montreal Cognitive Assessment (MoCA) and its subscales: validation of the Taiwanese version of the MoCA and an item response theory analysis. Int Psychogeriatr 24: , 651–658. |
[37] | Aschenbrenner AJ , Gordon BA , Benzinger TLS , Morris JC , Hassenstab JJ ((2018) ) Influence of tau PET, amyloid PET, and hippocampal volume on cognition in Alzheimer disease. Neurology 91: , e859–e866. |
[38] | Puustinen. J , Luostarinen L , Luostarinen M , Pulliainen V , Huhtala H , Soini M , Suhonen J ((2016) ) The use of MoCA and other cognitive tests in evaluation of cognitive impairment in elderly patients undergoing arthroplasty. Geriatr Orthop Surg Rehabil 7: , 183–187. |
[39] | Chen KL , Xu Y , Chu AQ , Ding D , Liang XN , Nasreddine ZS , Dong Q , Hong Z , Zhao QH , Guo QH ((2016) ) Validation of the Chinese Version of Montreal Cognitive Assessment Basic for screening mild cognitive impairment. J Am Geriatr Soc 64: , e285–e290. |
[40] | Borland E , Nagga K , Nilsson PM , Minthon L , Nilsson ED , Palmqvist S ((2017) ) The Montreal Cognitive Assessment: normative data from a large Swedish population-based cohort. J Alzheimers Dis 59: , 893–901. |
[41] | Ciesielska N , Sokolowski R , Mazur E , Podhorecka M , Polak-Szabela A , Kedziora-Kornatowska K ((2016) ) Is the Montreal Cognitive Assessment (MoCA) test better suited than the Mini-Mental State Examination (MMSE) in mild cognitive impairment (MCI) detection among people aged over 60? Meta-analysis. Psychiatr Pol 50: , 1039–1052. |
[42] | Giebel CM , Challis D ((2017) ) Sensitivity of the Mini-Mental State Examination, Montreal Cognitive Assessment and the Addenbrooke’s Cognitive Examination III to everyday activity impairments in dementia: an exploratory study. Int J Geriatr Psychiatry 32: , 1085–1093. |
[43] | Kopecek M , Bezdicek O , Sulc Z , Lukavsky. J , Stepankova H ((2017) ) Montreal Cognitive Assessment and Mini-Mental State Examination reliable change indices in healthy older adults. Int J Geriatr Psychiatry 32: , 868–875. |
[44] | Roalf DR , Moore TM , Mechanic-Hamilton D , Wolk DA , Arnold SE , Weintraub DA , Moberg PJ ((2017) ) Bridging cognitive screening tests in neurologic disorders: A crosswalk between the short Montreal Cognitive Assessment and Mini-Mental State Examination. Alzheimers Dement 13: , 947–952. |
[45] | Solomon TM , deBros GB , Budson AE , Mirkovic N , Murphy CA , Solomon PR ((2014) ) Correlational analysis of 5 commonly used measures of cognitive functioning and mental status: an update. Am J Alzheimers Dis Other Demen 29: , 718–722. |
[46] | Mellor D , Lewis M , McCabe M , Byrne L , Wang T , Wang. J , Zhu M , Cheng Y , Yang C , Dong S , Xiao S ((2016) ) Determining appropriate screening tools and cut-points for cognitive impairment in an elderly Chinese sample. Psychol Assess 28: , 1345–1353. |
[47] | Snowdon A , Hussein A , Kent R , Pino L , Hachinski V ((2015) ) Comparison of an electronic and paper-based Montreal Cognitive Assessment Tool. Alzheimer Dis Assoc Disord 29: , 325–329. |
[48] | Eisdorfer C , Cohen D , Paveza GJ , Ashford JW , Luchins DJ , Gorelick PB , Hirschman RS , Freels SA , Levy PS , Semla TP et al. ((1992) ) An empirical evaluation of the Global Deterioration Scale for staging Alzheimer’s disease. Am J Psychiatry 149: , 190–194. |
[49] | Butler SM , Ashford JW , Snowdon DA ((1996) ) Age, education, and changes in the Mini-Mental State Exam scores of older women: findings from the Nun Study. J Am Geriatr Soc 44: , 675–681. |
[50] | Schmitt FA , Davis DG , Wekstein DR , Smith CD , Ashford JW , Markesbery WR ((2000) ) “Preclinical” AD revisited: neuropathology of cognitively normal older adults. Neurology 55: , 370–376. |
[51] | Schmitt FA , Mendiondo MS , Kryscio RJ , Ashford JW ((2006) ) A brief Alzheimer’s screen for clinical practice. Res Pract Alzheimers Dis 11: , 1–4. |


