
Improved Differential Diagnosis of Alzheimer’s Disease by Integrating ELISA and Mass Spectrometry-Based Cerebrospinal Fluid Biomarkers
Abstract
Background:
Alzheimer’s disease (AD) is diagnosed based on a clinical evaluation as well as analyses of classical biomarkers: Aβ42, total tau (t-tau), and phosphorylated tau (p-tau) in cerebrospinal fluid (CSF). Although the sensitivities and specificities of the classical biomarkers are fairly good for detection of AD, there is still a need to develop novel biochemical markers for early detection of AD.
Objective:
We explored if integration of novel proteins with classical biomarkers in CSF can better discriminate AD from non-AD subjects.
Methods:
We applied ELISA, mass spectrometry, and multivariate modeling to investigate classical biomarkers and the CSF proteome in subjects (n = 206) with 76 AD patients, 74 mild cognitive impairment (MCI) patients, 11 frontotemporal dementia (FTD) patients, and 45 non-dementia controls. The MCI patients were followed for 4–9 years and 21 of these converted to AD, whereas 53 remained stable.
Results:
By combining classical CSF biomarkers with twelve novel markers, the area of the ROC curves (AUROCS) of distinguishing AD and MCI/AD converters from non-AD were 93% and 96%, respectively. The FTDs and non-dementia controls were identified versus all other groups with AUROCS of 96% and 87%, respectively.
Conclusions:
Integration of new and classical CSF biomarkers in a model-based approach can improve the identification of AD, FTD, and non-dementia control subjects.
INTRODUCTION
Currently, Alzheimer’s disease (AD) is diagnosed based on a clinical evaluation with support from imaging techniques as well as analyses of Aβ42, total tau (t-tau), and phosphorylated tau (p-tau) in cerebrospinal fluid (CSF) [1]. The combination of decreased Aβ42, increased t-tau and p-tau is indicative of AD with a sensitivity of 71–95% and a specificity of 44–87% [2, 3]. Importantly, the sensitivity can be even lower at prodromal disease stages, i.e., in patients with an amnestic form of mild cognitive impairment (MCI) who later will convert to AD dementia [4]. Using logistic regression, studies have evaluated the diagnostic accuracy of combining the classical CSF markers with additional proteins such as YKL-40, NFL, and neurogranin [5–8]. However, such composite biomarker profiles for AD have so far not resulted in any diagnostic improvements [8], implying that there is still a need to identify additional biomarkers to further improve the diagnostic accuracy of CSF analysis.
Here, we combined the classical AD CSF biomarkers with mass spectrometry (MS) based shotgun proteomics data to assess if multivariate modelling using sparse partial least squares discriminant analysis (sPLS-DA) could improve the diagnostic accuracy of recognizing AD from healthy controls and from other conditions of cognitive dysfunction.
METHODS
Samples
This study includes CSF samples from 76 AD patients, 74 mild cognitive impairment (MCI) patients, 11 frontotemporal dementia (FTD) patients, and 45 non-dementia controls. The MCI patients were followed for 4–8 years at 6–12 months intervals and eventually diagnosed with AD (MCI/AD converters) (n = 21) or remained at the MCI stage (stable MCI) (n = 53). Samples were collected according to the recommended consensus protocol for CSF collection and biobanking [9]. All patients underwent computed tomography or magnetic resonance imaging scans, caregiver interviews, thorough cognitive assessments, and in some cases regional glucose uptake by positron emission tomography. The diagnosis of probable AD dementia was set according to the National Institute of Neurological and Communicative Disorders and Stroke/Alzheimer’s Disease and Related Disorders Association criteria [10] and the Diagnostic and Statistical Manual of Mental Disorders, Fourth Edition, criteria [11]. MCI was defined according to the International Working Group of MCI [12]. The control subjects were recruited by advertising in the local newspaper and were considered cognitively unimpaired, based on their history and a Mini-Mental State Examination (MMSE) test. Approximately half of the controls consisted of 87–89-year-old men from the ULSAM cohort, individuals who have been followed since the early 1970 s [13].
The Regional Ethical Review Board in Uppsala, Sweden had approved the collection of CSF samples, the conducted research (collection of the samples: 2005-244 and Ö 48-2005; 2005-11-02 and 2006-01-30 as well as the use of samples for the analyses: 2011/044; 2011-02-23). All participants provided their written informed consent before any samples were collected. The main clinical features of the patients are summarized in Table 1 and Supplementary Table 1.
Table 1
Main clinical features information of patients and controls. AD, Alzheimer’s disease; MCI, mild cognitive impairment; FTD, frontotemporal dementia
| AD | MCI/AD converter | Stable MCI | FTD | CONTROL | |
| Gender (F/M) | 47/29 | 11/10 | 20/33 | 4/7 | 8/37 |
| Age (Median[range]) | 72 (54–88) | 71 (59–79) | 71 (44–81) | 66 (50–75) | 88 (74–89) |
| Aβ42 ng/l (Median[range]) | 405 (160–1160) | 388 (234–645) | 756 (320–1500) | 720 (350–1180) | 676 (337–1343) |
| t-tau ng/l (Median[range]) | 617 (160–1720) | 540 (329–1370) | 244 (82–742) | 281 (200–600) | 414 (202–1121) |
| p-tau ng/l (Median[range]) | 82 (28–220) | 78 (35–184) | 45 (22–97) | 44 (24–59) | 63 (29–122) |
Sample handling and analysis
The detailed description of sample handling and analysis is available in Supplementary Material 1. Briefly, the CSF samples were collected via lumbar puncture into polypropylene tubes. The concentrations of Aβ42, t-tau, and p-tau in CSF were measured using sandwich ELISAs (INNOTEST, Fujirebio, Ghent, Belgium) and procedures accredited by the Swedish Board of Accreditation and Conformity Assessment.
For MS analysis, the samples were first subjected to multiaffinity immunodepletion to deplete the seven most abundant proteins. The proteins in the depleted CSF sample were digested to peptides using a trypsin/Lys-C mixture, followed by nanoLC-MS/MS analyses using a 7 T hybrid LTQ FT MS. The samples were run in a random order and, in addition, a pool of CSF was run after every eight biological samples for the purpose of quality control. Identification and quantification of MS data were performed using OpenMS [14]. Proteins identified (q-value <0.05) with five or more significant peptides (q-value <0.05) were included in downstream analyses. The proteins with less than 20% missing values in the QC samples and the biological samples and coefficients of variation (CV) <1 in the QC samples were selected for modeling. The data was transformed to log2 scale and normalized using cyclic loess normalization on protein level [6]. The levels of MS based proteins as well as Aβ42, t-tau, p-tau, and MMSE were adjusted for age and gender using linear regression [7].
Identification of AD using Aβ42, t-tau, and p-tau at baseline
To assess diagnostic accuracy of AD based on Aβ42, t-tau, and p-tau at baseline, we performed classification of AD (Aβ42 <530 (ng/L) and t-tau>350 (ng/L)) according to Hansson et al. [15]. For comparison, the results of additional cutoffs, as suggested by Hansson et al. [15], were also included.
Multivariate modelling to diagnose AD using Aβ42, t-tau, and p-tau at baseline
We evaluated if PLS-DA could improve the accuracy of diagnosing AD versus non-AD subjects (MCIs, FTDs, and non-dementia controls) by taking combinatorial effects of Aβ42, t-tau, and p-tau into account. A linear model using PLS-DA [20] was trained using the three components for prediction. Importantly, for training, MCI/AD converters and MCI/non-AD converters were regarded as a single group, “MCI”. Therefore, the model was not provided with information on whether the MCI patients were AD converters or not. A leave-one-out cross-validation was performed to evaluate the accuracy by calculating an area of the ROC curve (AUROC) for AD versus non-AD subjects (stable MCI, FTD, and controls), MCI/AD converters versus non-AD subjects (FTD, stable MCI, and controls), FTD versus non-FTD subjects (AD, MCI/AD converters, stable MCI, and controls) and controls versus all other groups (cognitively declined patients).
Integrative multivariate statistical analysis
Using sparse PLS-DA (sPLS-DA), we evaluated if a combination of Aβ42, t-tau, and p-tau levels with levels of proteins evaluated by MS could improve the diagnostic performance. The training and evaluation of the model, was the same as for the PLS-DA model described above. The variable importance (VIP) of the four most important variables (proteins) for each of the four components used for the diagnostic prediction were automatically selected and extracted from the model using mixOmics [16]. The AUROCs were compared between the models using DeLong test.
Univariate statistical analysis
Nonparametric tests (Kruskal-Wallis, KW) were performed to evaluate group-wise differences of Aβ42, t-tau, p-tau, and proteins found in the sPLS-DA analysis. For statistically significant (p < 0.05) results of the KW test, pairwise post hoc comparisons were performed using Mann-Whitney U Test. A result of p < 0.05 was considered statistically significant.
Correlation analysis
The Spearman’s rank-order correlation was performed to evaluate association between Aβ42, t-tau, p-tau and proteins found in the sPLS-DA analysis. A result of p < 0.05 was considered statistically significant.
RESULTS
The clinical features of the 206 subjects are summarized in Table 1 and Supplementary Table 1. The 76 AD patients were 54–88 years old and 62% were women. The 74 MCI patients were 59–79 years old and 52% were women. During the 4–8 years follow-up period, 21 of the MCI patients were diagnosed with AD. The eleven FTD patients were 50–75 years old and 57% were women. The non-neurological control subjects were 74–89 years old and 18% were women. Upon KW tests there was a significant age difference (p < 0.001), as well as of age and gender adjusted MMSE level (p < 0.001) between the groups. The pairwise post hoc testing showed that controls were significantly older than AD, MCI/AD converters, and stable MCI and FTDs (p < 0.001). The MMSE scores were significantly lower for AD (p < 0.01) and stable MCI (p < 0.05) compared to controls. Moreover, the MMSE scores were significantly lower in AD (p < 0.001) compared to both MCI/AD converters and stable MCI.
Identification of AD using Aβ42, t-tau, and p-tau at baseline
To assess diagnostic accuracy of Aβ42, t-tau, and p-tau at baseline, we performed classification of AD, FTD, MCI/AD converters, and non-dementia controls according to Hansson et al. [15]. The cut off levels of Aβ42 <530 (ng/L) and t-tau>350 (ng/L) resulted in an accuracy for identification of AD of 72% (55 out of 76) and incipient AD of 71% (15 out 21). Using this cutoff none of the FTD subjects were classified as AD, but 31% (14 out of 45) of the non-dementia controls were falsely classified as AD. The results using alternative cutoffs, as suggested by Hansson et al. [15], are found in Fig. 1 and Supplementary Table 3. However, the regular cut off levels of Aβ42 <530 (ng/L) and t-tau>350 (ng/L) showed the best diagnostic performance.
Fig.1
Alzheimer’s disease classification criteria, as reported by Hansson et al. [15]. The dashed lines represent cutoff levels based on Aβ42 <530 (ng/L), t-tau>350 (ng/L), and p-tau> = 60 (ng/L).
![Alzheimer’s disease classification criteria, as reported by Hansson et al. [15]. The dashed lines represent cutoff levels based on Aβ42 <530 (ng/L), t-tau>350 (ng/L), and p-tau> = 60 (ng/L).](https://content.iospress.com:443/media/jad/2019/67-2/jad-67-2-jad180855/jad-67-jad180855-g001.jpg)
Multivariate modelling to diagnose AD using Aβ42, t-tau, and p-tau at baseline
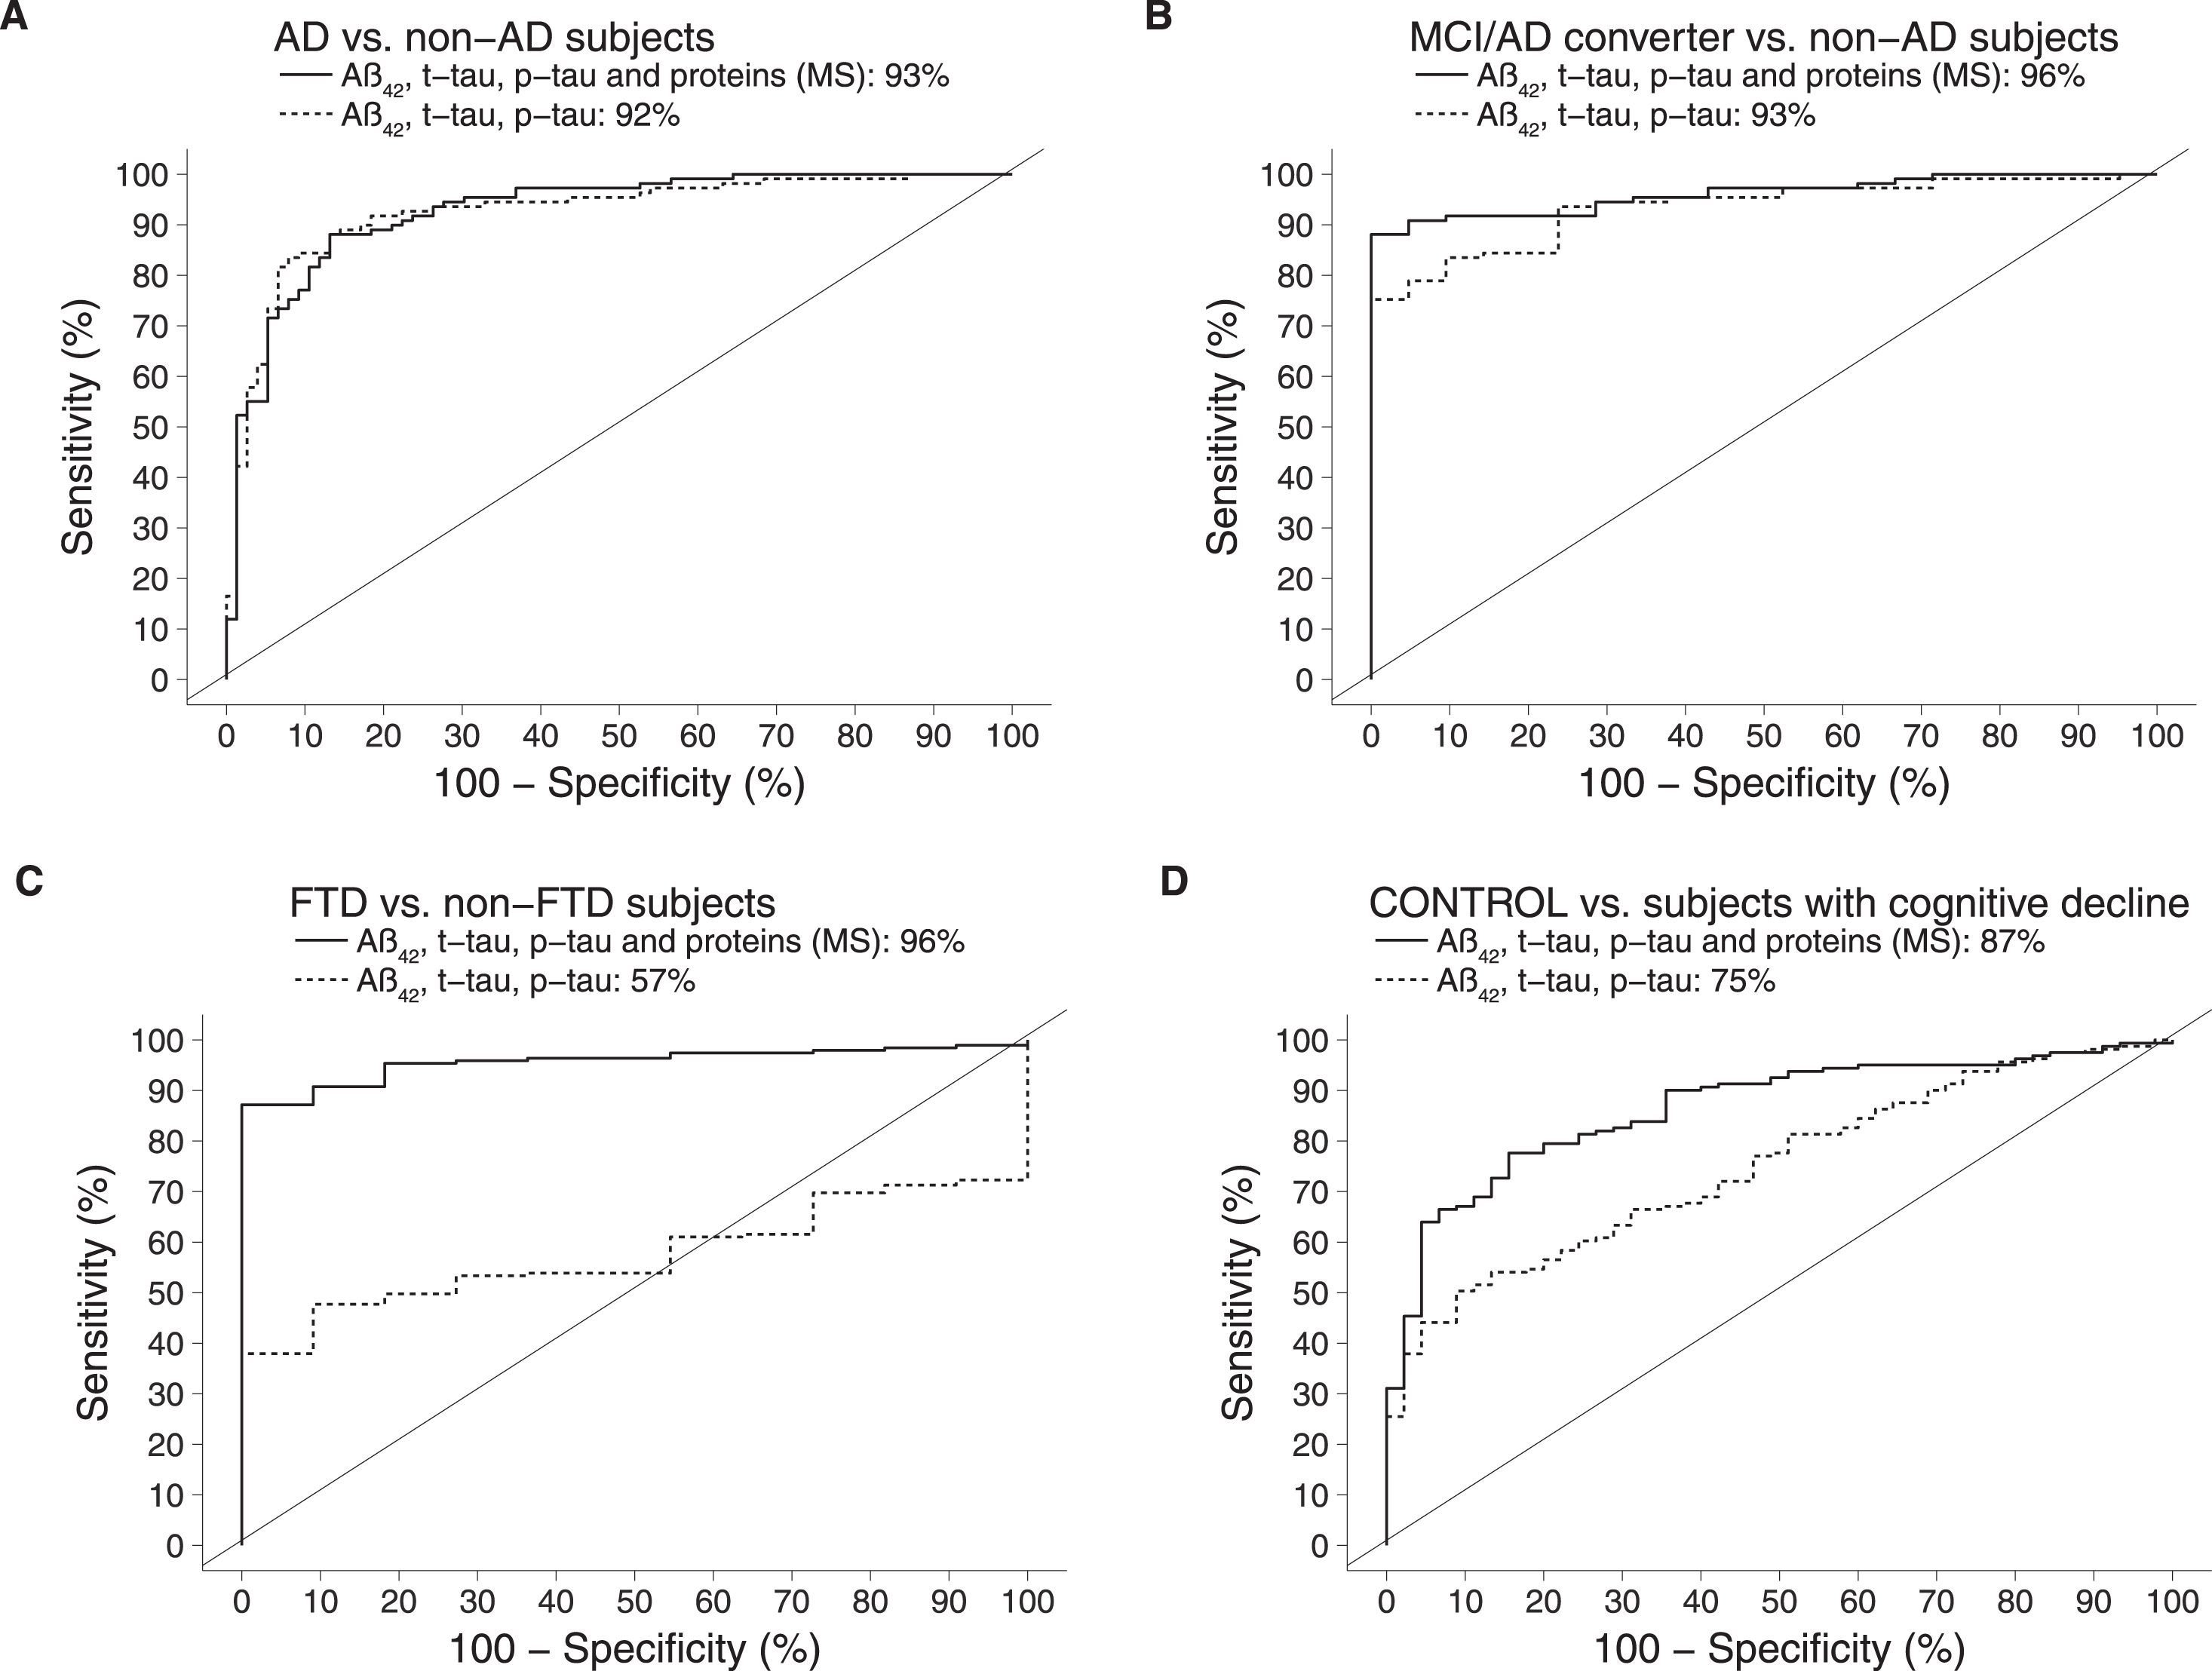
We evaluated if PLS-DA modelling could improve the accuracy of diagnosing AD and MCI/AD converters whilst also correctly classifying FTD and non-dementia controls (Fig. 2). This resulted in an AUROC of 92% for discriminating AD versus non-AD subjects and 96% for detecting MCI/AD converters (p < 0.01). The AUROC for distinguishing FTD versus all other groups was 57% (not statistically significant). The AUROC for recognition of controls versus cognitively declined subjects was 75% (p < 0.01).
Fig.2
Comparison of AUROCs between the classical model (ELISA measurements of Aβ42, t-tau, p-tau) and the integrative model (ELISA measurements of Aβ42, t-tau, p-tau in combination with MS-based measurements of 12 proteins). AD, Alzheimer’s disease; MCI, mild cognitive impairment; FTD, frontotemporal dementia.
Integrative multivariate modeling to identify incipient AD
Next, we evaluated if a combination of Aβ42, t-tau, and p-tau levels with MS based protein measurements could improve the diagnostic accuracy using sPLS-DA. Label free shotgun MS was used to analyze the proteome in all CSF samples. A total of 672 proteins were identified and quantified. After applying sample coverage and CV cutoffs, 78 proteins remained for downstream analyses.
Using sPLS-DA the AUROC for identifying AD versus non-AD was 93% and the recognition of incipient AD (MCI/AD converters) was 96% versus non-AD. The AUROC for distinguishing FTD versus non-FTD increased to 96% (p < 0.01). As for recognition of controls versus all other groups, AUROC increased to 87% (p < 0.01) (Fig. 2). Comparing the AUROC for the model on the classical biomarkers to the integrated model, the improvements on distinguishing controls versus others and FTD versus others were statistically significant (p < 0.005).
Disease-associated proteins
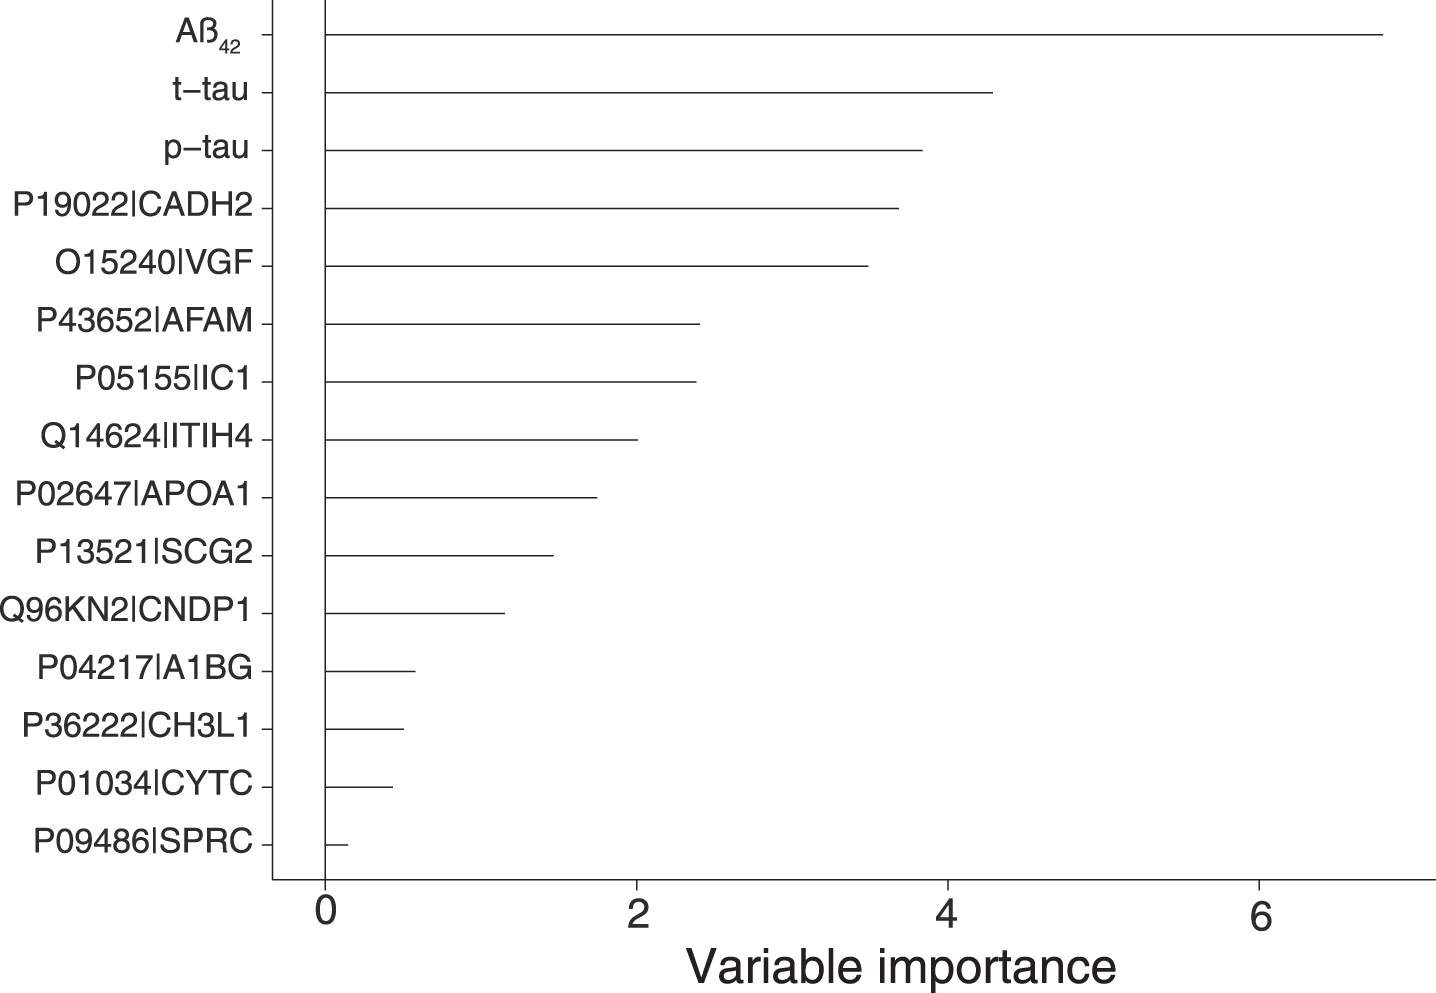
Using sPLS-DA we evaluated the different proteins relative contribution to the model predictions (Fig. 3). They were in decreasing order: Aβ42, t-tau, p-tau, cadherin-2, neurosecretory protein VGF, afamin, plasma protease C1 inhibitor, inter-alpha-trypsin inhibitor heavy chain H4, apolipoprotein A-I, secretogranin-2, beta-Ala-His dipeptidase, alpha-1B-glycoprotein, chitinase-3-like protein 1 (also known as YKL-40), cystatin-C and SPARC.
Fig.3
Variable importance extracted from the sPLS-DA model trained on a model of proteins (MS) and Aβ42, t-tau, and p-tau. The model selected the proteins with the most influence on the responses resulting in a total of 15 unique variables including Aβ42, t-tau, and p-tau. Aβ42 (VIP = 6.80), t-tau (VIP = 4.29), p-tau (VIP = 3.84), cadherin-2 (VIP = 3.68, Uniprot AC: P19022, Uniprot ID: CADH2), neurosecretory protein VGF (VIP = 3.49, Uniprot AC: O15240, Uniprot ID: VGF), afamin (VIP = 2.41, Uniprot AC: P43652, Uniprot ID: AFAM), plasma protease C1 inhibitor (VIP = 2.38, Uniprot AC: P05155, Uniprot ID: IC1), inter-alpha-trypsin inhibitor heavy chain H4 (VIP = 2.01, Uniprot AC: Q14624, Uniprot ID: ITIH4), apolipoprotein A-I (VIP = 1.75, Uniprot AC: P02647, Uniprot ID: APOA1), secretogranin-2 (VIP = 1.47, Uniprot AC: P13521, Uniprot ID: SCG2), beta-Ala-His dipeptidase (VIP = 1.15, Uniprot AC: Q96KN2, Uniprot ID: CNDP1), alpha-1B-glycoprotein (VIP = 0.58, Uniprot AC: P04217, Uniprot ID: A1BG), chitinase-3-like protein 1 (VIP = 0.5, Uniprot AC: P36222, Uniprot ID: CH3L1, also known as YKL-40), cystatin-C (VIP = 0.43, Uniprot AC: P01034, Uniprot ID: CYTC) and SPARC (VIP = 0.15, Uniprot AC: P09486, Uniprot ID: SPRC).
Univariate statistical testing on the selected proteins
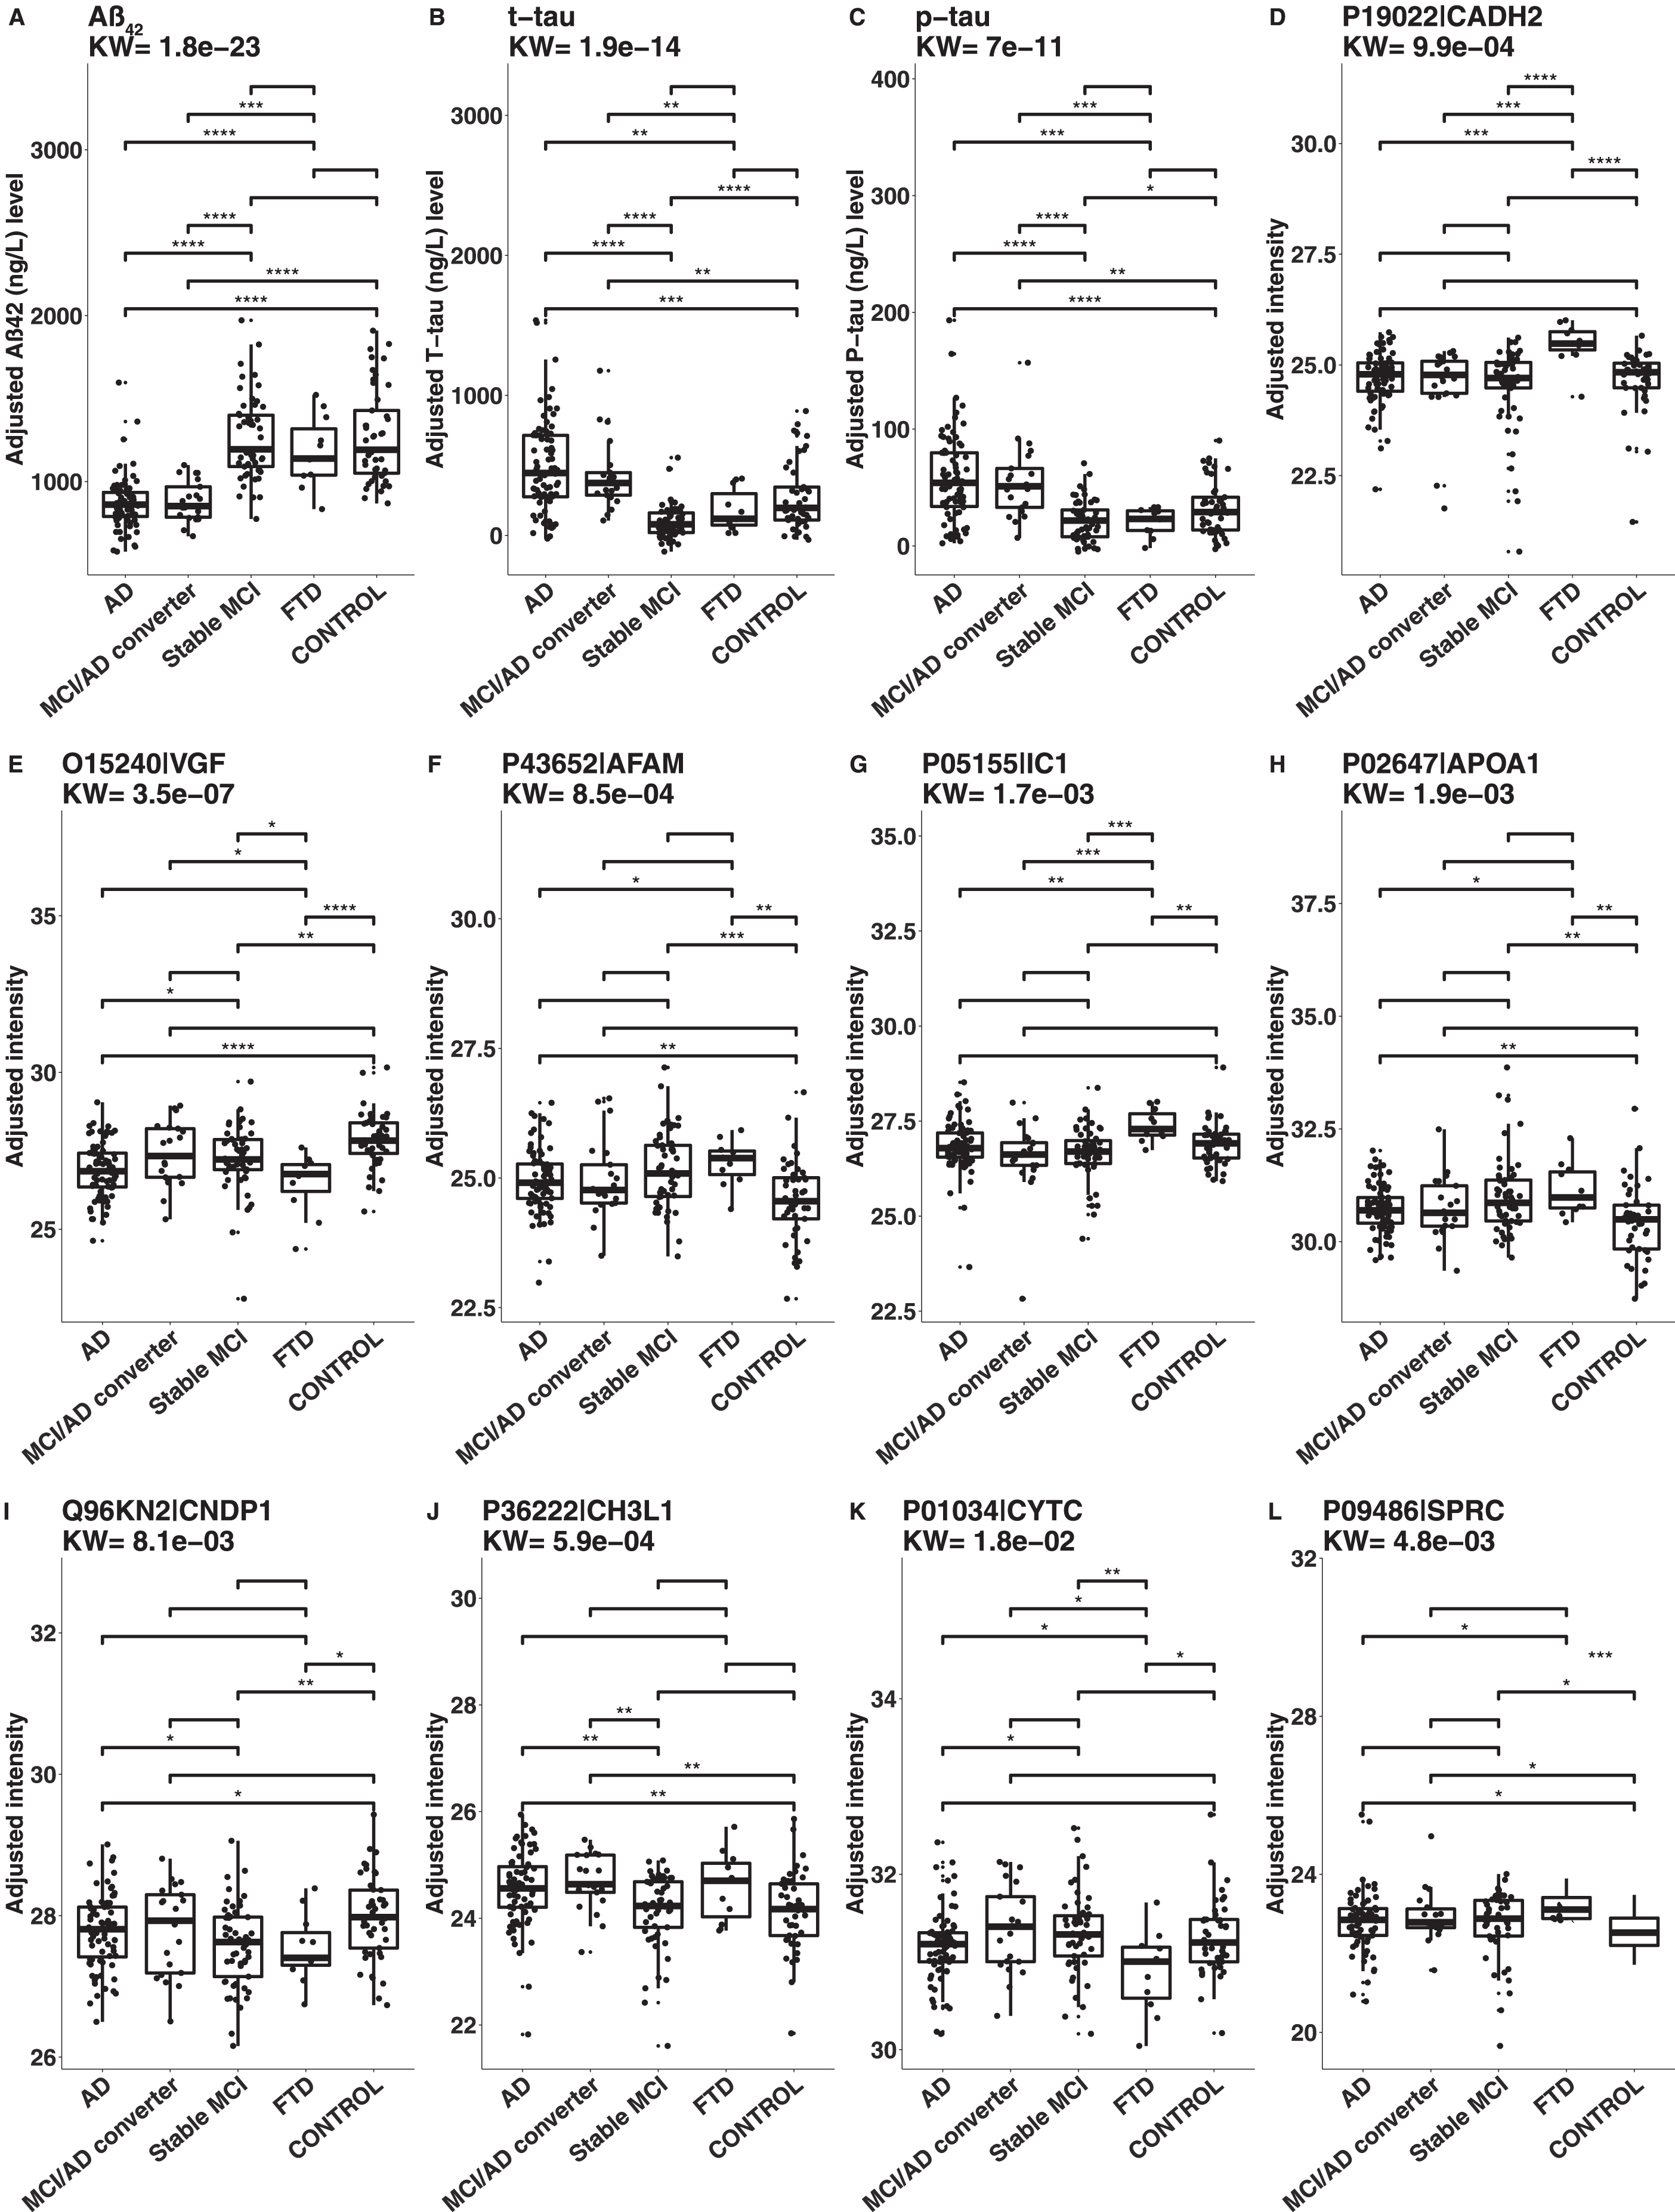
The results of KW and Mann-Whitney tests on age and gender adjusted CSF protein levels are illustrated in Fig. 4. The CSF levels of Aβ42 were lower for AD and MCI/AD converters compared to stable MCI, FTD, and controls. The levels of t-tau and p-tau were higher in AD and MCI/AD converters compared to stable MCI, FTD and controls, but lower in stable MCI compared to controls. The levels of cadherin-2 were higher in FTD compared to controls, AD, MCI/AD converters, and stable MCI. The levels of neurosecretory protein VGF were lower in AD, stable MCI and FTD compared to controls. The levels of afamin were higher in AD, stable MCI and FTD compared to controls. The levels of plasma protease C1 inhibitor were higher in FTD compared to controls, AD, MCI/AD converters, and stable MCI. The levels of apolipoprotein A-I were higher in AD, stable MCI, and FTD compared to controls. The levels of beta-Ala-His dipeptidase were lower in AD, stable MCI, and FTD compared to controls. Chitinase-3-like protein 1 (YKL-40) was the only protein with higher levels only in AD and MCI/AD converters compared to controls. The levels of Cystatin-C were lower in FTD compared to controls. Finally, the levels of SPARC were higher in AD, MCI/AD converters, stable MCI, and FTD compared to controls (Supplementary Table 4).
Fig.4
Boxplots of CSF levels of the analyzed proteins. The levels were compared between the different groups with nonparametric statistical testing. A: Aβ42, B: t-tau, C: p-tau, D: cadherin-2 (Uniprot AC: P19022, Uniprot ID: CADH2), E: neurosecretory protein VGF (Uniprot AC: O15240, Uniprot ID: VGF), F: afamin (Uniprot AC: P43652, Uniprot ID: AFAM), G: plasma protease C1 inhibitor (Uniprot AC: P05155, Uniprot ID: IC1), H: apolipoprotein A-I (Uniprot AC: P02647, Uniprot ID: APOA1), I: beta-Ala-His dipeptidase (Uniprot AC: Q96KN2, Uniprot ID: CNDP1), J: chitinase-3-like protein 1(Uniprot AC: P36222, Uniprot ID: CH3L1, also known as YKL-40), K: cystatin-C (Uniprot AC: P01034, Uniprot ID: CYTC) and L: SPARC (Uniprot AC: P09486, Uniprot ID: SPRC). AD, Alzheimer’s disease; MCI, mild cognitive impairment; FTD, frontotemporal dementia. p-value: ****0–0.0001, ***0.0001–0.001, **0.001–0.01, *0.01–0.05.
Correlations between CSF biomarkers
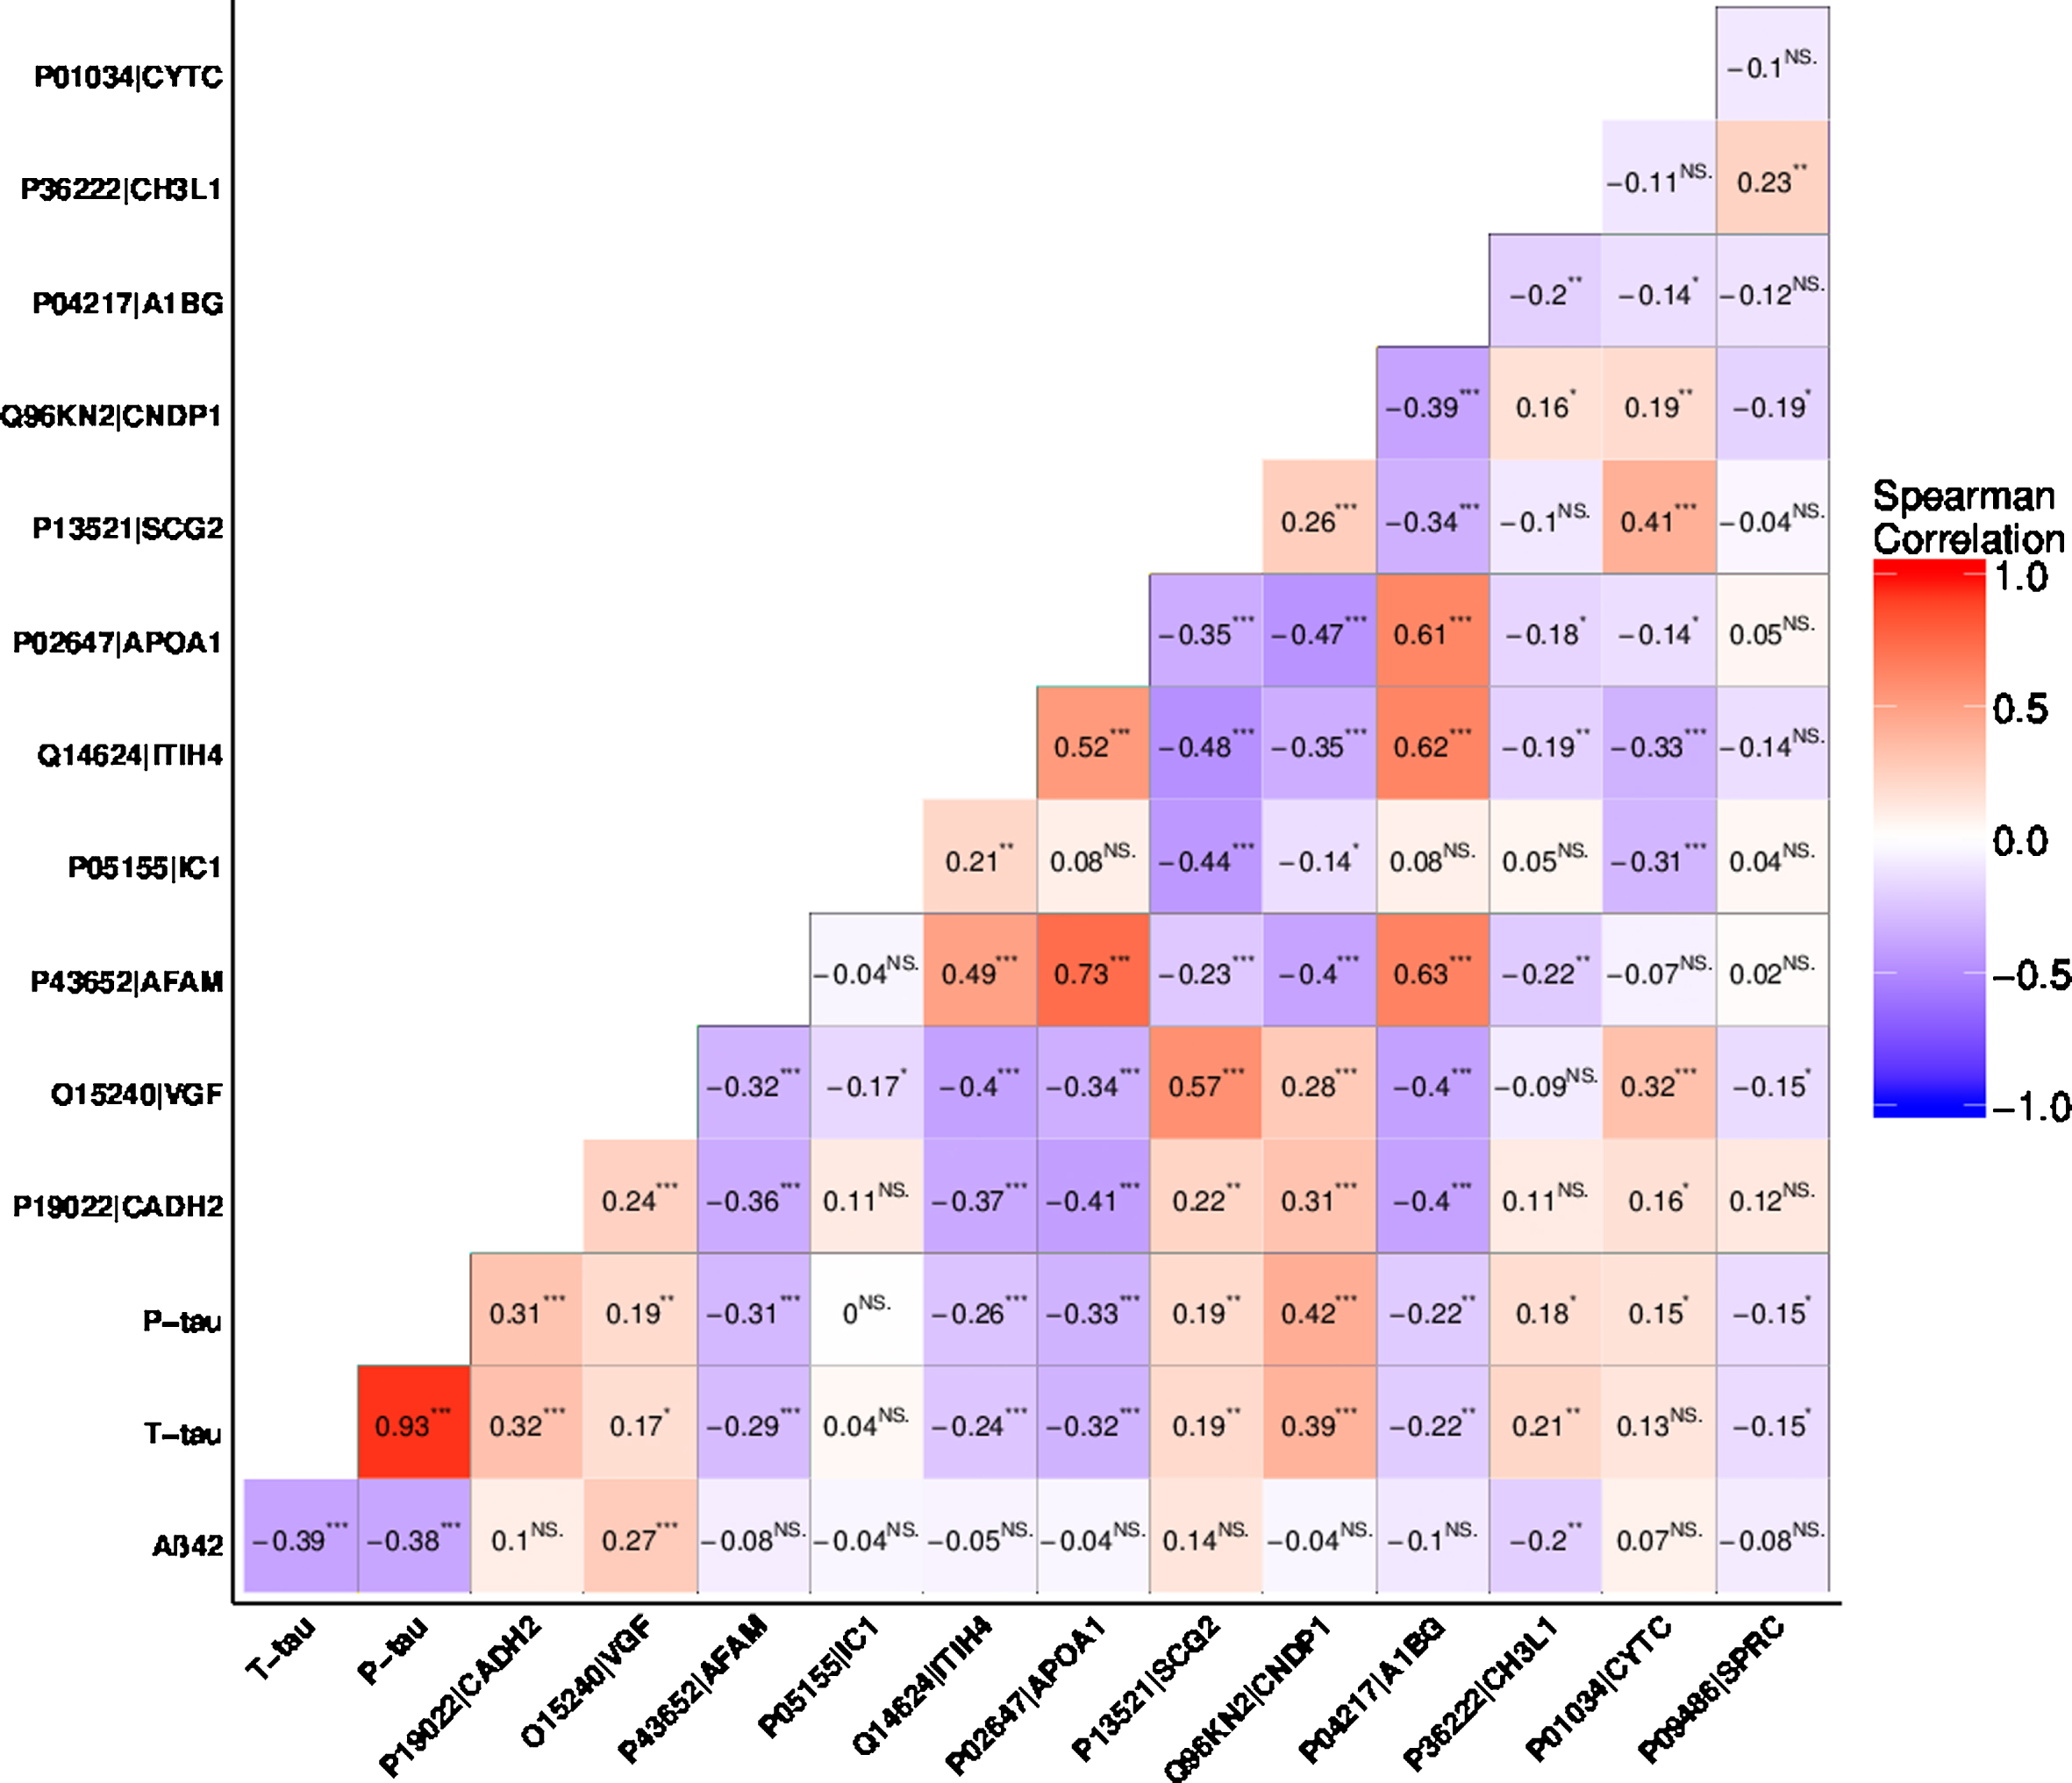
Figure 5 shows the correlation matrix between Aβ42, t-tau, and p-tau and the twelve MS-based proteins. Aβ42 showed a statistically significant correlation to t-tau, p-tau, VGF, and YKL-40. Total-tau showed a statistically significant correlation to all the analyzed biomarkers except plasma protease C1 inhibitor and cystatin-C. Levels of p-tau were also found to be correlated to the levels of all the markers, except for plasma protease C1 inhibitor. In general, the levels of most proteins showed an inter-correlation, with the exception of plasma protease C1 inhibitor, YKL-40, and SPARC that were found to correlate less frequently to other proteins.
Fig.5
Rank based correlations of the selected proteins. Aβ42, t-tau, p-tau, cadherin-2 (Uniprot AC: P19022, Uniprot ID: CADH2), neurosecretory protein VGF (Uniprot AC: O15240, Uniprot ID: VGF), afamin (Uniprot AC: P43652, Uniprot ID: AFAM), plasma protease C1 inhibitor (Uniprot AC: P05155, Uniprot ID: IC1), inter-alpha-trypsin inhibitor heavy chain H4 (Uniprot AC: Q14624, Uniprot ID: ITIH4), apolipoprotein A-I (Uniprot AC: P02647, Uniprot ID: APOA1), secretogranin-2 (Uniprot AC: P13521, Uniprot ID: SCG2), beta-Ala-His dipeptidase (Uniprot AC: Q96KN2, Uniprot ID: CNDP1), alpha-1B-glycoprotein (Uniprot AC: P04217, Uniprot ID: A1BG), chitinase-3-like protein 1(Uniprot AC: P36222, Uniprot ID: CH3L1, also known as YKL-40), cystatin-C (Uniprot AC: P01034, Uniprot ID: CYTC) and SPARC (Uniprot AC: P09486, Uniprot ID: SPRC). p-value: ****0–0.0001, ***0.0001–0.001, **0.001–0.01, *0.01–0.05.
DISCUSSION
The use of CSF biomarkers to support the diagnosis of AD has become gradually more accepted and is today broadly used at memory disorder units in many countries. Although the sensitivities and specificities of the ELISA-based measures of Aβ42, t-tau, and p-tau are fairly good there is still a need to develop novel biochemical markers. In this study, we assessed the CSF levels of the classical AD biomarkers but also applied mass spectrometry to identify additional CSF proteins that were evaluated individually and in combination with the ELISA-based markers. In addition to AD and MCI patients, FTD patients and healthy controls were represented among the 206 subjects included.
By only evaluating the combination of CSF t-tau and Aβ42 we found, in agreement with others [8, 15], that AD and MCI/AD converters could be recognized with an acceptable accuracy (72% and 71% correct classification), although these markers showed a tendency to diagnose non-dementia controls as AD subjects. Allowing for combinatorial effects of Aβ42, t-tau, p-tau, using PLS-DA, improved the accuracy of identifying AD and MCI/AD converters, although the accuracies for recognizing FTDs and non-dementia controls remained low. This means that these markers play a very limited role as a diagnostic test for objectively diagnosing AD, but they serve a purpose when AD is suspected and other diseases have been excluded. Therefore, complementary information is necessary for development of a test based diagnostic system.
When combining the classical biomarkers with MS-based markers the diagnostic accuracy of distinguishing AD (including MCI/AD converters) from patients with other cognitive conditions and healthy controls could be improved just marginally (AUROC for AD: 93% compared to 92%; for MCI/AD converters 96% compared to 93%). These findings are in line with the work by Hampel et al. [8], which demonstrated that a combination of additional proteins (NFL, neurogranin, and YKL-40; as measured by ELISA) could improve the identification of AD from controls (AUROC of 86% compared to 84%) and of AD from FTD (AUROC of 82% compared to 80%). However, their combined additional proteins could not result in an accurate identification of FTD versus healthy controls (maximum AUROC of 78%) and more importantly healthy controls from MCI subjects (maximum AUROC of 62%).
In our study, the combination of ELISA- and MS-based data substantially improved the identification of FTD as compared to the ELISA-based data alone (AUROC of 96% compared to 57%, versus all other groups). In addition, the non-dementia controls could also be recognized with a much improved accuracy as compared to the ELISA-based data alone (AUROC of 87% compared to 75%, versus all other groups).
Multivariate modeling
The modelling approach of combining CSF Aβ42, t-tau, and p-tau with MS-based markers has several implications. Importantly, the information regarding which MCI subjects that subsequently converted to AD was not provided to the model at the training stage. By excluding this information, we maintained a high level of stringency and avoided bias for early diagnosis of AD by instead letting the model extract early AD pattern from the data. Therefore, the estimated accuracies for AD and MCI/AD converters should rather be viewed as underestimations. Also, despite that our model increased the risk of misclassification (since the classification was done for each group against all other groups instead of in a pair-wise fashion) it could improve the diagnostic accuracy for AD and FTD as well as more accurately recognize non-dementia controls.
Disease-associated proteins
To our knowledge this report represents the largest MS based proteomics study on AD CSF published to date. We undertook a very rigorous experimental approach, where we created a CSF QC pool, which was divided into subsamples that were treated like all other samples, i.e. by depletion, digestion and measurement. This approach allowed us to set an extra stringent cutoff level for the CV of proteins that were included in the final analyses. In addition, we deliberately used a very conservative cutoff for the inclusion of proteins (at least five unique peptides, as compared to the standard procedure of including only two [17]). This conservative approach necessarily leads to an underestimation of the number of proteins that could have been included in the analyses, at the benefit of only including high-abundant proteins displaying low technical variation.
Importantly, the three traditional markers (Aβ42, t-tau, and p-tau) were identified as the top three variables. In addition, the automatic variable selection resulted in the identification of twelve others proteins that were useful for the discrimination of AD, MCI/AD converters, stable MCI, FTD, and non-dementia controls. Nine of these proteins were found to be altered across the groups, according to the KW test.
Additional AD markers
The VGF protein was ranked high in the list, indicating its value of being included in a panel of biomarkers for AD differential diagnosis. In agreement with previous reports we found decreased levels of VGF in AD compared to non-dementia controls [18–21] as well as in FTD compared to controls [18, 21]. Moreover, we found that the VGF levels were increased in stable MCI compared to AD, which is also in agreement with recent findings [21]. However, we did not find any difference between MCI/AD converters and stable MCI, contrary to what was recently reported [21].
In agreement with other studies [22–27], we found increased CSF levels of YKL-40 in AD and MCI/AD converters compared to non-dementia controls. Increased levels of YKL-40 in FTD compared to both controls [5] and AD [8] have been previously reported. However, in the current study we did not find any increase in FTD compared to non-dementia controls (p = 0.07), which may be due to the limited number of FTD cases included (n = 11). The value of adding YKL-40 in combination with traditional markers is likely to be associated with distinguishing between dementia and non-dementia controls and to some extent between AD and FTD.
Markers of neurodegeneration and cognitive decline
The increase in afamin CSF levels in AD, stable MCI, and FTD compared to controls, which correlated strongly to those of apolipoprotein A-I (correlation coefficient of 0.73), have, to our knowledge, not been previously demonstrated. Moreover, the CSF levels of beta-Ala-His dipeptidase were found to be lower in AD, FTD and stable MCI compared to controls.
We found increased CSF levels of apolipoprotein A-I in AD, stable MCI, and FTD compared to non-dementia controls. The results with respect to AD corroborate those of a previous study [28], whereas other studies have failed to replicate those results [29, 30].
SPARC was also found at lower levels in all the patient groups compared to control subjects, indicating its usefulness as a more general biomarker for cognitive decline. Increased CSF levels of the closely related SPARC like 1 protein have been previously reported in AD and MCI compared to controls [31].
Thus, these four proteins seem to have a more general role in neurodegeneration [28, 32–34] and they probably could serve as biomarkers only when used in combination with other markers.
FTD markers
The CSF levels of cadherin-2 were found to be specifically increased in FTD compared to all other groups. The protein was ranked just after the traditional markers, meaning that it had a high value to discriminate the different groups from each other.
We found plasma protease C1 inhibitor to be higher in FTD compared to controls, which contradicts the hypothesis that this protein is AD specific, as previously suggested [35].
For cystatin-C we were not able to detect the previously reported decrease in AD compared to controls [36]. However, the levels were decreased in FTD compared to all other groups, which is in accordance with a previous study [37]. Cystatin-C has been implicated as a potential diagnostic marker in both AD, other neurodegenerative diseases and cognitive decline [38, 39]. The CSF levels of cystatin-C showed significant correlation with plasma protease C1 inhibitor and cadherin-2 but with low magnitude, suggesting that these proteins may be complementary to each other and that their value as biomarkers therefore may depend on covariations with other proteins.
Regarding the interpretations of single proteins, it is of importance to emphasize that several markers were found to correlate with each other, but the magnitudes of the correlations were in general small indicating that the markers are complementary to each other and thus could be used in a combinatorial setting. In line with this, the value from the remaining three proteins were most likely also based on covariations with other proteins, making it harder to interpret their respective values. Among these, inter-alpha-trypsin inhibitor heavy chain H4, secretogranin-2 and alpha-1B-glycoprotein have previously all been associated with AD [36, 40, 41].
Integrated diagnostics in the clinic
The molecular events in neurological diseases are complex, emphasizing that no single marker alone can reflect the full pathology. Using a combination of Aβ42, t-tau, and p-tau in CSF is efficient for diagnosing AD and MCI/AD converters, but mainly serves a purpose when other diseases have been excluded. Recent advances in modern technologies have enabled comprehensive measurements of patients suffering from neurological diseases at different molecular levels [42]. Considering the complexity of pathological events, integrating information from multiple sources can therefore result in a more refined tool for diagnostic and prognostic purposes. An example of this is that the incorporation of APOE4 allele information to spectrochemical analysis of can improve the differential diagnosis in AD [43].
We have here demonstrated that adding a limited number of CSF protein measurements in a model-based manner can improve the differential diagnosis. In line with this, we have recently demonstrated that integration of CSF protein, metabolite, and MRI measurements can improve differential diagnosis in multiple sclerosis [44]. Integrative diagnostics holds great potential in future diagnostic assessments, yet the challenge is to identify a limited number of markers that holds complementary information and that preferably can be acquired in a clinical setting. The traditional CSF markers (Aβ42, t-tau, and p-tau) play a central role in AD, but by adding proteins to the model we have here demonstrated that this can improve the differential diagnosis to FTD and recognition of non-dementia controls. By inclusion of more disease specific markers, this could be developed into a more general and multipurpose diagnostic test for neurological diseases that could be used in the clinic. However, translating this into routine healthcare will necessitate rigorous validation process and general acceptance of such a combinatorial test system. This requires more integrative studies to demonstrate and confirm the potential of combinatorial biomarker panels.
Limitations of the study
There are a number of limitations to the present study. Firstly, the values of the MS-based proteins represent normalized relative intensities and are thus not representing their respective absolute concentrations. In contrast Aβ42, t-tau, and p-tau were measured by a sandwich ELISA. Secondly, the sample size of our cohort was small (especially the FTD group) and all subjects were recruited at one single center. The findings have not been validated in an independent cohort. Therefore, the results might not be applicable to the general population. In addition, there was an age and gender bias, as our non-dementia controls were mostly men and older than the cognitively declined subjects. We controlled for age and gender in our statistical analyses, but an impact from these factors cannot be entirely ruled out. Lastly, the model fitting and calculation of AUROC were based on the latest known health status of the subjects. Therefore, classification of controls as, e.g., AD or MCI/AD converters can be both due to true miss-classification or the subjects having presymptomatic AD.
Conclusions
By combining the ELISA-based classical AD CSF biomarkers with a set of protein markers identified by MS, a marginal improvement of the diagnostic accuracy of AD and incipient AD at the MCI stage could be achieved. Moreover, FTD patients could be distinguished from non-FTD and non-dementia controls could be distinguished from cognitively declined subjects with significantly enhanced precision. Our findings thus suggest that incorporating new CSF biomarkers into the currently adopted diagnostic test can further improve the differential diagnosis of AD and concludes that integrative diagnostics holds great potential in future diagnostic assessments. Further studies are needed to investigate the generalizability of our results.
ACKNOWLEDGMENTS
This research was supported by Uppsala Berzelii Technology Centre for Neurodiagnostics with financing from the Swedish Governmental Agency for Innovation Systems, Swedish Alzheimer’s foundation, Gun och Bertil Stohnes stiftelse, Geriatriska fonden, Åke Wiberg Foundation and Gamla Tjänarinnor Foundation. The funders had no role in study design, data collection and analysis, decision to publish, or preparation of the manuscript.
Authors’ disclosures available online (https://www.j-alz.com/manuscript-disclosures/18-0855r2).
SUPPLEMENTARY MATERIAL
[1] The supplementary material is available in the electronic version of this article: http://dx.doi.org/10.3233/JAD-180776.
REFERENCES
[1] | Sperling R , Johnson K ((2013) ) Biomarkers of Alzheimer disease: Current and future applications to diagnostic criteria. Continuum 19: , 325–338. |
[2] | Beach TG , Monsell SE , Phillips LE , Kukull W ((2012) ) Accuracy of the clinical diagnosis of Alzheimer disease at National Institute on Aging Alzheimer’s Disease Centers, 2005–2010. J Neuropathol Exp Neurol 71: , 266–273. |
[3] | Hansson O , Zetterberg H , Buchhave P , Londos E , Blennow K , Minthon L ((2006) ) Association between CSF biomarkers and incipient Alzheimer’s disease in patients with mild cognitive impairment: A follow-up study. Lancet Neurol 5: , 228–234. |
[4] | Blennow K , Dubois B , Fagan AM , Lewczuk P , de Leon MJ , Hampel H ((2015) ) Clinical utility of cerebrospinal fluid biomarkers in the diagnosis of early Alzheimer’s disease. Alzheimers Dement 11: , 58–69. |
[5] | Janelidze S , Hertze J , Zetterberg H , Landqvist Waldo M , Santillo A , Blennow K , Hansson O ((2016) ) Cerebrospinal fluid neurogranin and YKL-40 as biomarkers of Alzheimer’s disease. Ann Clin Transl Neurol 3: , 12–20. |
[6] | Hellwig K , Kvartsberg H , Portelius E , Andreasson U , Oberstein TJ , Lewczuk P , Blennow K , Kornhuber J , Maler JM , Zetterberg H , Spitzer P ((2015) ) Neurogranin and YKL-40: Independent markers of synaptic degeneration and neuroinflammation in Alzheimer’s disease. Alzheimers Res Ther 7: , 74. |
[7] | Mattsson N , Insel PS , Palmqvist S , Portelius E , Zetterberg H , Weiner M , Blennow K , Hansson O , Alzheimer’s Disease Neuroimaging Initiative ((2016) ) Cerebrospinal fluid tau, neurogranin, and neurofilament light in Alzheimer’s disease. EMBO Mol Med 8: , 1184–1196. |
[8] | Hampel H , Toschi N , Baldacci F , Zetterberg H , Blennow K , Kilimann I , Teipel SJ , Cavedo E , Melo Dos Santos A , Epelbaum S , Lamari F , Genthon R , Dubois B , Floris R , Garaci F , Lista S , Alzheimer Precision Medicine Initiative (APMI) ((2018) ) Alzheimer’s disease biomarker-guided diagnostic workflow using the added value of six combined cerebrospinal fluid candidates: Aβ1-42, total-tau, phosphorylated-tau, NFL, neurogranin, and YKL-40. Alzheimers Dement 14: , 492–501. |
[9] | Teunissen CE , Petzold A , Bennett JL , Berven FS , Brundin L , Comabella M , Franciotta D , Frederiksen JL , Fleming JO , Furlan R , Hintzen RQ , Hughes SG , Johnson MH , Krasulova E , Kuhle J , Magnone MC , Rajda C , Rejdak K , Schmidt HK , vanPesch V , Waubant E , Wolf C , Giovannoni G , Hemmer B , Tumani H , Deisenhammer F ((2009) ) A consensus protocol for the standardization of cerebrospinal fluid collection and biobanking. Neurology 73: , 1914–1922. |
[10] | McKhann G , Drachman D , Folstein M , Katzman R , Price D , Stadlan EM ((1984) ) Clinical diagnosis of Alzheimer’s disease: Report of the NINCDS-ADRDA Work Group under the auspices of Department of Health and Human Services Task Force on Alzheimer’s Disease. Neurology 34: , 939–944. |
[11] | Bell CC ((1994) ) DSM-IV: Diagnostic and statistical manual of mental disorders. JAMA 272: , 828–829. |
[12] | Winblad B , Palmer K , Kivipelto M , Jelic V , Fratiglioni L , Wahlund L-O , Nordberg A , Bäckman L , Albert M , Almkvist O , Arai H , Basun H , Blennow K , de Leon M , DeCarli C , Erkinjuntti T , Giacobini E , Graff C , Hardy J , Jack C , Jorm A , Ritchie K , van Duijn C , Visser P , Petersen RC ((2004) ) Mild cognitive impairment–beyond controversies, towards a consensus: Report of the International Working Group on Mild Cognitive Impairment. J Intern Med 256: , 240–246. |
[13] | Velickaite V , Giedraitis V , Ström K , Alafuzoff I , Zetterberg H , Lannfelt L , Kilander L , Larsson E-M , Ingelsson M ((2017) ) Cognitive function in very old men does not correlate to biomarkers of Alzheimer’s disease. BMC Geriatr 17: , 208. |
[14] | Rost HL , Sachsenberg T , Aiche S , Bielow C , Weisser H , Aicheler F , Andreotti S , Ehrlich HC , Gutenbrunner P , Kenar E , Liang X , Nahnsen S , Nilse L , Pfeuffer J , Rosenberger G , Rurik M , Schmitt U , Veit J , Walzer M , Wojnar D , Wolski WE , Schilling O , Choudhary JS , Malmstrom L , Aebersold R , Reinert K , Kohlbacher O ((2016) ) OpenMS: A flexible open-source software platform for mass spectrometry data analysis. Nat Methods 13: , 741–748. |
[15] | Hansson O , Zetterberg H , Buchhave P , Londos E , Blennow K , Minthon L ((2006) ) Association between CSF biomarkers and incipient Alzheimer’s disease in patients with mild cognitive impairment: A follow-up study. Lancet Neurol 5: , 228–234. |
[16] | Rohart F , Gautier B , Singh A , LêCao KA ((2017) ) mixOmics: An R package for ’omics feature selection and multiple data integration. PLoS Comput Biol 13: , e1005752. |
[17] | Gupta N , Pevzner PA ((2009) ) False discovery rates of protein identifications: A strike against the two-peptide rule. J Proteome Res 8: , 4173–4181. |
[18] | Jahn H , Wittke S , Zurbig P , Raedler TJ , Arlt S , Kellmann M , Mullen W , Eichenlaub M , Mischak H , Wiedemann K ((2011) ) Peptide fingerprinting of Alzheimer’s disease in cerebrospinal fluid: Identification and prospective evaluation of new synaptic biomarkers. PLoS One 6: , e26540. |
[19] | Carrette O , Demalte I , Scherl A , Yalkinoglu O , Corthals G , Burkhard P , Hochstrasser DF , Sanchez J-C ((2003) ) A panel of cerebrospinal fluid potential biomarkers for the diagnosis of Alzheimer’s disease. Proteomics 3: , 1486–1494. |
[20] | Hölttä M , Minthon L , Hansson O , Holmén-Larsson J , Pike I , Ward M , Kuhn K , Rüetschi U , Zetterberg H , Blennow K , Gobom J ((2015) ) An integrated workflow for multiplex CSF proteomics and peptidomics-identification of candidate cerebrospinal fluid biomarkers of Alzheimer’s disease. J Proteome Res 14: , 654–663. |
[21] | Duits FH , Brinkmalm G , Teunissen CE , Brinkmalm A , Scheltens P , Van der Flier WM , Zetterberg H , Blennow K ((2018) ) Synaptic proteins in CSF as potential novel biomarkers for prognosis in prodromal Alzheimer’s disease. Alzheimers Res Ther 10: , 5. |
[22] | Kester MI , Teunissen CE , Sutphen C , Herries EM , Ladenson JH , Xiong C , Scheltens P , Flier WM van der , Morris JC , Holtzman DM , Fagan AM ((2015) ) Cerebrospinal fluid VILIP-1 and YKL-40, candidate biomarkers to diagnose, predict and monitor Alzheimer’s disease in a memory clinic cohort. Alzheimers Res Ther 7: , 59. |
[23] | Wennstrom M , Surova Y , Hall S , Nilsson C , Minthon L , Hansson O , Nielsen HM ((2015) ) The inflammatory marker YKL-40 is elevated in cerebrospinal fluid from patients with Alzheimer’s but not Parkinson’s disease or dementia with Lewy bodies. PLoS One 10: , e0135458. |
[24] | Choi J , Lee HW , Suk K ((2011) ) Plasma level of chitinase 3-like 1 protein increases in patients with early Alzheimer’s disease. J Neurol 258: , 2181–2185. |
[25] | Rosen C , Andersson CH , Andreasson U , Molinuevo JL , Bjerke M , Rami L , Llado A , Blennow K , Zetterberg H ((2014) ) Increased levels of chitotriosidase and YKL-40 in cerebrospinal fluid from patients with Alzheimer’s disease. Dement Geriatr Cogn Dis Extra 4: , 297–304. |
[26] | Kang K , Lee H-W , Yoon U ((2013) ) Plasma levels of lipocalin 2 and chitinase 3-like 1 protein in patients with amnestic mild cognitive impairment and Alzheimer’s disease. Alzheimers Dement 9: , P860. |
[27] | Gispert JD , Monté GC , Suárez-Calvet M , Falcon C , Tucholka A , Rojas S , Rami L , Sánchez-Valle R , Lladó A , Kleinberger G , Haass C , Molinuevo JL ((2017) ) The APOE ɛ4 genotype modulates CSF YKL-40 levels and their structural brain correlates in the continuum of Alzheimer’s disease but not those of sTREM2. Alzheimers Dement (Amst) 6: , 50–59. |
[28] | Slot RER , Van Harten AC , Kester MI , Jongbloed W , Bouwman FH , Teunissen CE , Scheltens P , Veerhuis R , van der Flier WM ((2017) ) Apolipoprotein A1 in cerebrospinal fluid and plasma and progression to Alzheimer’s disease in non-demented elderly. J Alzheimers Dis 56: , 687–697. |
[29] | Johansson P , Almqvist EG , Bjerke M , Wallin A , Johansson J-O , Andreasson U , Blennow K , Zetterberg H , Svensson J ((2017) ) Reduced cerebrospinal fluid concentration of apolipoprotein A-I in patients with Alzheimer’s disease. J Alzheimers Dis 59: , 1017–1026. |
[30] | Liu H-C , Hu C-J , Chang J-G , Sung S-M , Lee L-S , Yuan R-Y , Leu S-J ((2006) ) Proteomic identification of lower apolipoprotein A-I in Alzheimer’s disease. Dement Geriatr Cogn Disord 21: , 155–161. |
[31] | Vafadar-Isfahani B , Ball G , Coveney C , Lemetre C , Boocock D , Minthon L , Hansson O , Miles AK , Janciauskiene SM , Warden D , Smith AD , Wilcock G , Kalsheker N , Rees R , Matharoo-Ball B , Morgan K ((2012) ) Identification of SPARC-like 1 protein as part of a biomarker panel for Alzheimer’s disease in cerebrospinal fluid. J Alzheimers Dis 28: , 625–636. |
[32] | Keeney JTR , Swomley AM , Förster S , Harris JL , Sultana R , Butterfield DA ((2013) ) Apolipoprotein A-I: Insights from redox proteomics for its role in neurodegeneration. Proteomics Clin Appl 7: , 109–122. |
[33] | Hu Y , Hosseini A , Kauwe JSK , Gross J , Cairns NJ , Goate AM , Fagan AM , Townsend RR , Holtzman DM ((2007) ) Identification and validation of novel CSF biomarkers for early stages of Alzheimer’s disease. Proteomics Clin Appl 1: , 1373–1384. |
[34] | Kauwe JSK , Mayo K , Bertelsen S , Shah AR , Morris JC , Fagan AM , Holtzman DM , Goate AM ((2008) ) P3-232: SNPs in SOAT1, TFAM, and CNDP1 are associated with cerebrospinal fluid amyloid-beta levels. Alzheimers Dement 4: , T588-T589. |
[35] | Chiam JTW , Dobson RJB , Kiddle SJ , Sattlecker M ((2015) ) Are blood-based protein biomarkers for Alzheimer’s disease also involved in other brain disorders? A systematic review. J Alzheimers Dis 43: , 303–314. |
[36] | Brinkmalm G , Sjödin S , Simonsen AH , Hasselbalch SG , Zetterberg H , Brinkmalm A , Blennow K ((2018) ) A parallel reaction monitoring mass spectrometric method for analysis of potential CSF biomarkers for Alzheimer’s disease. Proteomics Clin Appl 12: . doi: 10.1002/prca.201700131 |
[37] | Hansson SF , Andréasson U , Wall M , Skoog I , Andreasen N , Wallin A , Zetterberg H , Blennow K ((2009) ) Reduced levels of amyloid-beta-binding proteins in cerebrospinal fluid from Alzheimer’s disease patients. J Alzheimers Dis 16: , 389–397. |
[38] | Mathews PM , Levy E ((2016) ) Cystatin C in aging and in Alzheimer’s disease. Ageing Res Rev 32: , 38–50. |
[39] | Sevilla RR , Naranjo IC , Cuenca JCP , de San Juan BD , Rodriguez JMF , Espuela FL ((2018) ) Vascular risk factors and white matter hyperintensities as predictors of progression to dementia in patients with mild cognitive impairment. Curr Alzheimer Res 15: , 671–678. |
[40] | Yang M-H , Yang Y-H , Lu C-Y , Jong S-B , Chen L-J , Lin Y-F , Wu S-J , Chu P-Y , Chung T-W , Tyan Y-C ((2012) ) Activity-dependent neuroprotector homeobox protein: A candidate protein identified in serum as diagnostic biomarker for Alzheimer’s disease.J Proteomics 75: , 3617–3629. |
[41] | Song F , Poljak A , Kochan NA , Raftery M , Brodaty H , Smythe GA , Sachdev PS ((2014) ) Plasma protein profiling of Mild Cognitive Impairment and Alzheimer’s disease using iTRAQ quantitative proteomics. Proteome Sci 12: , 5. |
[42] | Sancesario GM , Bernardini S ((2018) ) Alzheimer’s disease in the omics era. Clin Biochem 59: , 9–16. |
[43] | Paraskevaidi M , Morais CLM , Lima KMG , Snowden JS , Saxon JA , Richardson AMT , Jones M , Mann DMA , Allsop D , Martin-Hirsch PL , Martin FL ((2017) ) Differential diagnosis of Alzheimer’s disease using spectrochemical analysis of blood. Proc Natl Acad Sci U S A 114: , E7929–E7938. |
[44] | Herman S , Khoonsari PE , Tolf A , Steinmetz J , Zetterberg H , Åkerfeldt T , Jakobsson P-J , Larsson A , Spjuth O , Burman J , Kultima K ((2018) ) Integration of magnetic resonance imaging and protein and metabolite CSF measurements to enable early diagnosis of secondary progressive multiple sclerosis. Theranostics 8: , 4477–4490. |


