
Subjective Cognitive Decline Is Associated with Greater White Matter Hyperintensity Volume
Abstract
Background:
Research in older adults with subjective cognitive decline (SCD) has mainly focused on Alzheimer’s disease (AD)-related MRI markers, such as hippocampal volume. However, small vessel disease (SVD) is currently established as serious comorbidity in dementia and its preliminary stages. It is therefore important to examine SVD markers in addition to AD markers in older adults presenting with SCD.
Objective:
The aim of our study was to elucidate the role of SVD markers in late middle-aged to older adults with and without SCD in addition to the commonly found role of AD markers (hippocampal volume).
Methods:
67 healthy late middle-aged to older adults participated in this study (mean age 68 years); 25 participants with SCD and 42 participants without SCD. We evaluated quantitative as well as qualitative AD markers (i.e., hippocampal volume and medial temporal lobe atrophy (MTA) scale) and SVD markers (i.e., white matter hyperintensities (WMH) volume, Fazekas scale, microbleeds, and lacunar infarcts), and neuropsychological function and amount of memory complaints.
Results:
We found a significant effect of SCD on hippocampal atrophy, as assessed using the MTA scale, but not on hippocampal volume. In addition, we found a significant effect of SCD, and amount of memory complaints, on WMH volume and Fazekas score, suggesting larger WMH volumes in participants with SCD.
Conclusion:
SVD MRI markers are related to amount of memory complaints, in addition to the commonly observed AD MRI markers, as demonstrated by the greater WMHs in healthy late middle-aged to older adults with SCD.
INTRODUCTION
Alzheimer’s disease (AD) is characterized by a long preclinical phase in which neuropathological changes in the brain build up without apparent signs or symptoms of the disease [1, 2]. Subjective cognitive decline (SCD, also known as subjective memory complaints, subjective cognitive impairment, or subjective memory impairment) is common in older adults, and refers to a subjective decline in levels of cognitive functioning, which cannot be confirmed by neuropsychological evaluation [3]. Longitudinal population-based studies have reported an association between SCD and future cognitive decline [4] and dementia [5]. Moreover, neuroimaging studies have shown brain changes in participants with SCD are similar to those observed in AD patients [6–11]. The existing literature indicates that AD-related changes, including hippocampal volume loss, already occur in older adults with SCD before cognitive decline becomes evident [6, 9]. Therefore, SCD may be a marker of the preclinical phase of AD. Alternatively, cognitive complaints may be caused by other factors such as depression, anxiety, and quality of life [12–15]. Regardless, detection of an early phase of AD would be advantageous as it would allow for the study of disease progression. Early detection would also widen the therapeutic window, allowing for treatment earlier in the disease process.
AD is the most common form of dementia, and therefore the most common cause of mild cognitive impairment (MCI) and possibly SCD [16, 17]. Given this, it is unsurprising that neuroimaging research in older adults with SCD has mainly focused on AD-related MRI markers, such as hippocampal volume. However, vascular damage is currently established as a serious comorbidity in dementia and its early stages, and as having an independent effect on cognition [18–21]. In fact, among memory clinic patients the diagnosis of mixed dementia, which is a combination of AD and vascular dementia, is very common [22]. Even individuals in presumed early stages of AD (SCD and MCI) [6–11, 23] might already show abnormal vascular differences [24]. Cerebral small vessel disease (SVD), which is considered the most common cause of vascular cognitive impairment and vascular dementia, is characterized by both ischemic and hemorrhagic lesions, such as white matter hyperintensities (WMHs), lacunar infarcts, and microbleeds [25, 26]. It is therefore possible that in addition to AD markers, SVD markers may also be present in older adults experiencing SCD.
Currently, very few studies have examined the role of SVD imaging markers, such as white matter hyperintensities (WMHs) and microbleeds, in older adults with SCD. The results of a longitudinal study by Benedictus and colleagues (2015) suggest an important role of WMHs in SCD, as half of the participants with SCD in their sample showed signs of SVD [27]. Microbleeds are also a relatively common finding in memory clinic patients with a prevalence of 17% in all patients and a prevalence of 10% in older adults with SCD [28]. However, the amount of cognitive complaints reported by these individuals was not taken into account in these studies. Given that a majority of older adults do report some level of cognitive complaints, even if they are not yet concerned about them, additional information may be provided by examining cognitive complaints in a continuous manner as well as making comparisons between older adults with and without SCD.
The aim of our study was to elucidate the role of SVD in late middle-aged to older adults with and without SCD in addition to the commonly found role of AD (hippocampal atrophy). Therefore, we investigated the association of AD and SVD MRI markers with the presence of SCD, as well as with the amount of memory complaints reported by all individuals. We used hippocampal atrophy as an AD MRI marker [29]. Because previous research shows opposing results considering the most sensitive method to detect early decline in hippocampal integrity[30–39], we assessed both quantitative (i.e., automated volumetry) and qualitative (i.e., a visual rating scale[40]) measures of hippocampal atrophy. This approach enabled us to compare our research findings across studies using either one of these techniques. For SVD markers we used WMHs, also assessed quantitatively (i.e., volume measurements) and qualitatively (i.e., visually rated using the Fazekas scale [41]), microbleeds and lacunar infarcts [27]. Based on the literature, we expected to find associations between markers for AD and SVD and the presence of SCD and the amount of reported memory complaints. More specifically, we expected that individuals with SCD and those who reported more memory complaints would be more likely to have AD and SVD markers than those without SCD and those who reported fewer memory complaints.
MATERIALS AND METHODS
Participants
A total of 67 healthy late middle-aged to older adults participated in this study, mean age 68 years (range 45–85 years, 24 male/43 female). Of these participants, 25 were classified as experiencing SCD (mean age 68 years; range 45–84 years; 7 male/18 female), and 42 were classified as not experiencing SCD (mean age 68 years; range 50–85 years, 17 male/25 female). Data were collected in two locations (Detroit, MI, United States of America, and Leiden, Netherlands) from participants recruited in memory clinics and communities surrounding both cities using the same inclusion criteria. Only participants who were capable of giving informed consent and had a Mini-Mental State Examination (MMSE) score ≥25, which is considered within the cognitively normal range, were selected for inclusion [42–44]. Participants were categorized as those with or without SCD based on the self-reported experience of a worrisome decline in memory that brought the participant to seek advice from a medical professional. Such participants from the memory clinic were diagnosed as having SCD. Participants recruited from the community were specifically asked before inclusion if they had experienced a worrisome decline in their memory. They were considered for our SCD group if they answered “yes” to the following three questions: “Do you have memory complaints? If yes, do these complaints worry you?” and “Have you seen a medical professional for your memory complaints?” Because previous research suggests that an increased risk for dementia is restricted to individuals who are worried about the presence of SCD [45], we only included participants who felt their perceived change in memory was concerning. Participants with SCD were recruited from memory clinic (15 participants) and community settings (10 participants) to increase recruitment success, particularly at the US location where recruitment of eligible participants through memory clinics was low. All participants experiencing SCD sought advice from a medical professional prior to participation and were informed that their objective cognitive functioning was typical for their age. Furthermore, all SCD participants performed in the cognitively normal range as determined by either clinical assessment or performance on Wechsler Memory Scale VI indices of no less than 1.5 standard deviations below the normative mean. All individuals who were interested in participating were screened and excluded for current use of psychotropic medications, uncontrolled medical conditions, or presence of MRI contra-indications. Additional exclusion criteria included a history of neurological disorders, psychiatric disorders (including major depression), brain injury, and treatment of cancer using radiation or chemotherapy. This study was approved by the local institutional review boards, and in all cases, informed consent was obtained according to the declaration of Helsinki [46].
MRI
Image acquisition
T1-w, T2-w, T2 *-w, and FLAIR images were acquired solely for research purposes from all participants using 3 Tesla MRI scanners. MRI was performed at the Leiden Institute for Brain and Cognition in the Netherlands on a 3 Tesla Philips Achieva TX scanner. In Leiden, 3D T1-weighted images were acquired with: repetition time (TR) 9.7 ms, echo time (TE) 4.6 ms, flip angle 8°, 140 slices, field of view (FOV) 224×177×168 mm, voxel size 1.2×1.2×1.2 mm, scan duration ∼5 min. T2-weighted images were acquired with: TR 4.2 s, TE 80 ms, flip angle 90°, 40 slices, FOV 224×180×144 mm, voxel size 0.5×0.6×3.6 mm and scan duration ∼3 min. T2 *-weighted scans were performed with: TR 29 ms, TE 15 ms, 56 slices, FOV 250×175×112 mm, voxel size 1.0×1.0×2.0 mm, scan duration ∼2.5 min. 3D FLAIR scans were performed with: TR 4.8 s, inversion time (TI) 50 ms, TE 1.65 s, 162 slices, FOV 250×250×180 mm, voxel size 1.1×1.1×1.1 mm, scan duration ∼2.5 min. In Detroit, MRI was performed on a 3 Tesla Siemens Magnetom Verio scanner using a 32-channel Head Matrix coil. 3D T1-weighted images were acquired with: TR 1680, TE 3.51 ms, flip angle 9°, 176 slices, FOV 256×256×236 mm, voxel size 0.7 mm×0.7 mm×1.3 mm ∼6 min. T2-weighted images were acquired with: TR 3.2 s, TE 354 ms, flip angle 90°, 176 slices, FOV 350×263×350 mm, voxel size 1.0×1.0×1.0 mm, slice thickness 1.0 mm and scan duration ∼5 min. T2 *-weighted scans were performed with: TR 29 ms, TE 20 ms, 88 slices, FOV 256×192×176 mm, voxel size 1.0×0.5×2.0 mm, scan duration ∼5 min. 3D FLAIR scans were performed with: TR 8.44 s, TI 2.5 s, TE 122 ms, 72 slices, FOV = 256×256×144 mm, voxel size 1.3×1.3×2.0 mm, scan duration ∼4 min.
Image analysis
We used both a quantitative and qualitative measure of hippocampal atrophy as MRI markers for AD-related pathology, i.e., calculated as volume (cm3) and visually rated using the medial temporal lobe atrophy (MTA) scale [40].
Hippocampal volume was calculated using FIRST. The FIRST algorithm estimated left and right hippocampal volumes separately. FIRST is part of FMRIB’s Software Library (FSL) and performs both registration and segmentation of subcortical regions [47]. During registration, input data (3D T1 images) are transformed to MNI (Montreal Neurological Institute) 152 standard space by affine transformation based on 12 degrees of freedom (three translations, three rotations, three skews, and scaling along three axes). After subcortical registration, sub-cortical mask application locates the different subcortical structures, followed by segmentation based on shape models and voxel intensities. Absolute volumes of subcortical structures are then calculated, accounting for first stage transformations [47]. Finally, boundary correction determines which boundary voxels belong to the structure. In this study, a Z-value of 3 was used, corresponding to a 99.998% certainty in voxel classification. After registration and segmentation of all images, subcortical regions were visually checked for registration and segmentation errors. None were found. The output hippocampal volume uncorrected for intracranial volume was used for analysis.
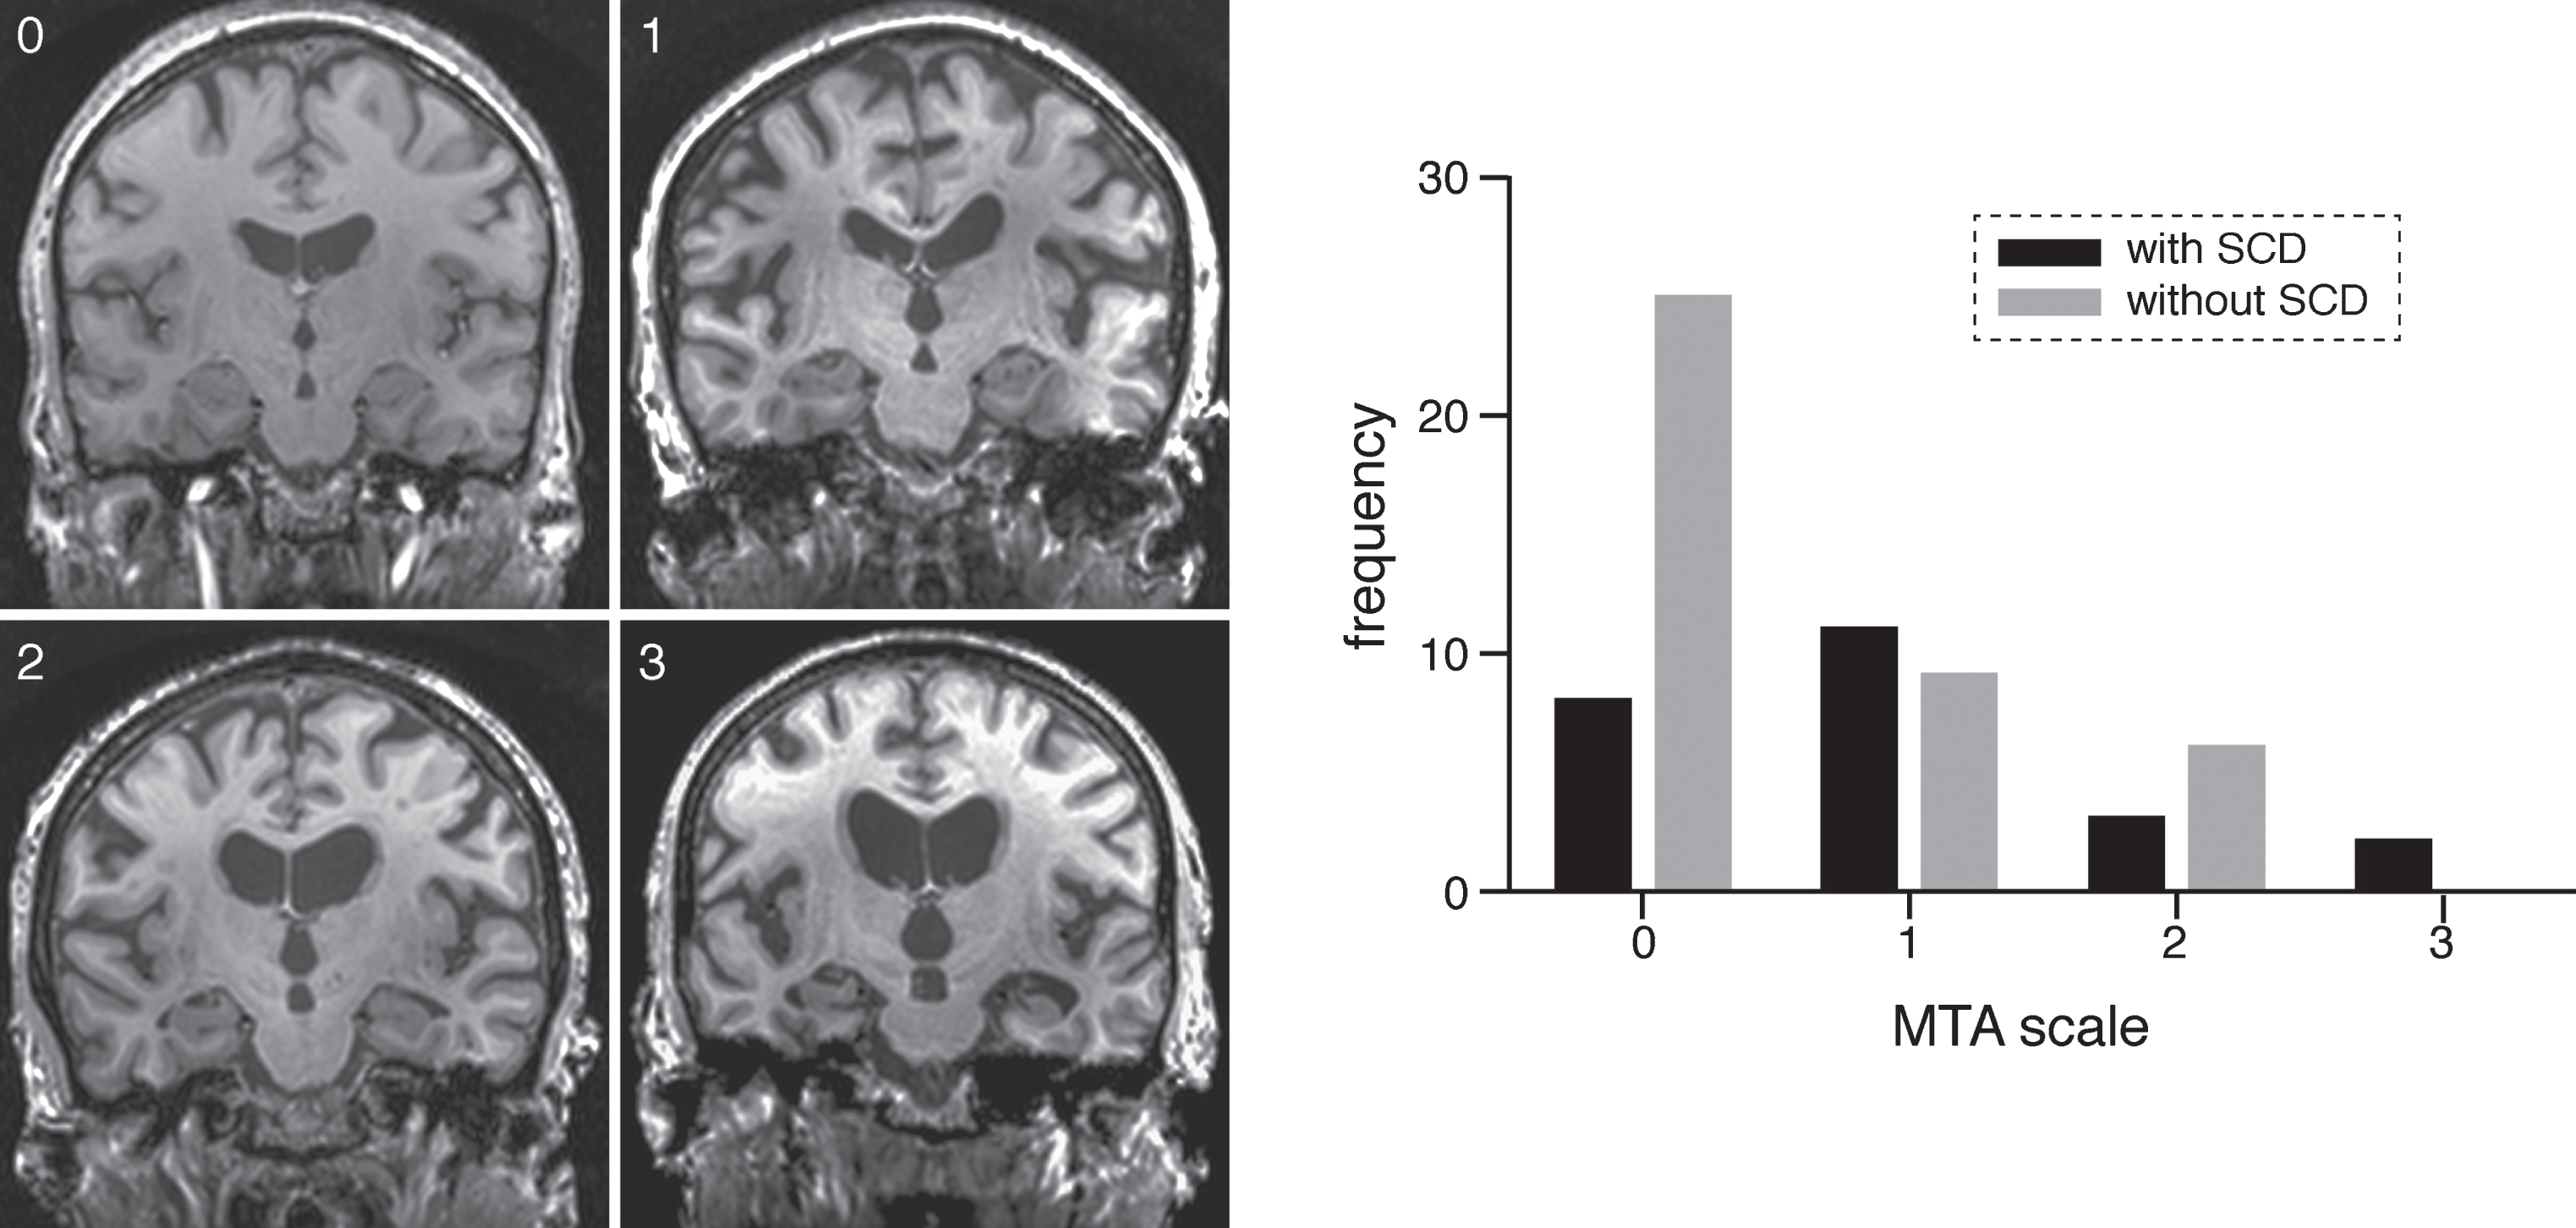
The MTA scale for medial temporal lobe atrophy is a commonly used clinical measure [37, 40]. Medial temporal lobe atrophy was scored by two independent raters (SvR and JvdG) who were blinded to participant group, on the coronal T1-weighted images at the level of the anterior pons, according to the procedures outlined by Scheltens and colleagues (1995). See Fig. 1 for representative examples of MTA scores in our sample.
Fig. 1.
On the left MTA scores from 0–1–2–3 in participants without SCD (0, 1, and 2) and in a participant with SCD (3). On the right frequency of participants with and without SCD with MTA scales from 0–3.
SVD MRI markers were subdivided into two categories: ischemic, which included WMHs and lacunar infarcts; and hemorrhagic, which included intracerebral hemorrhages (ICHs) and microbleeds (MBs) [25].
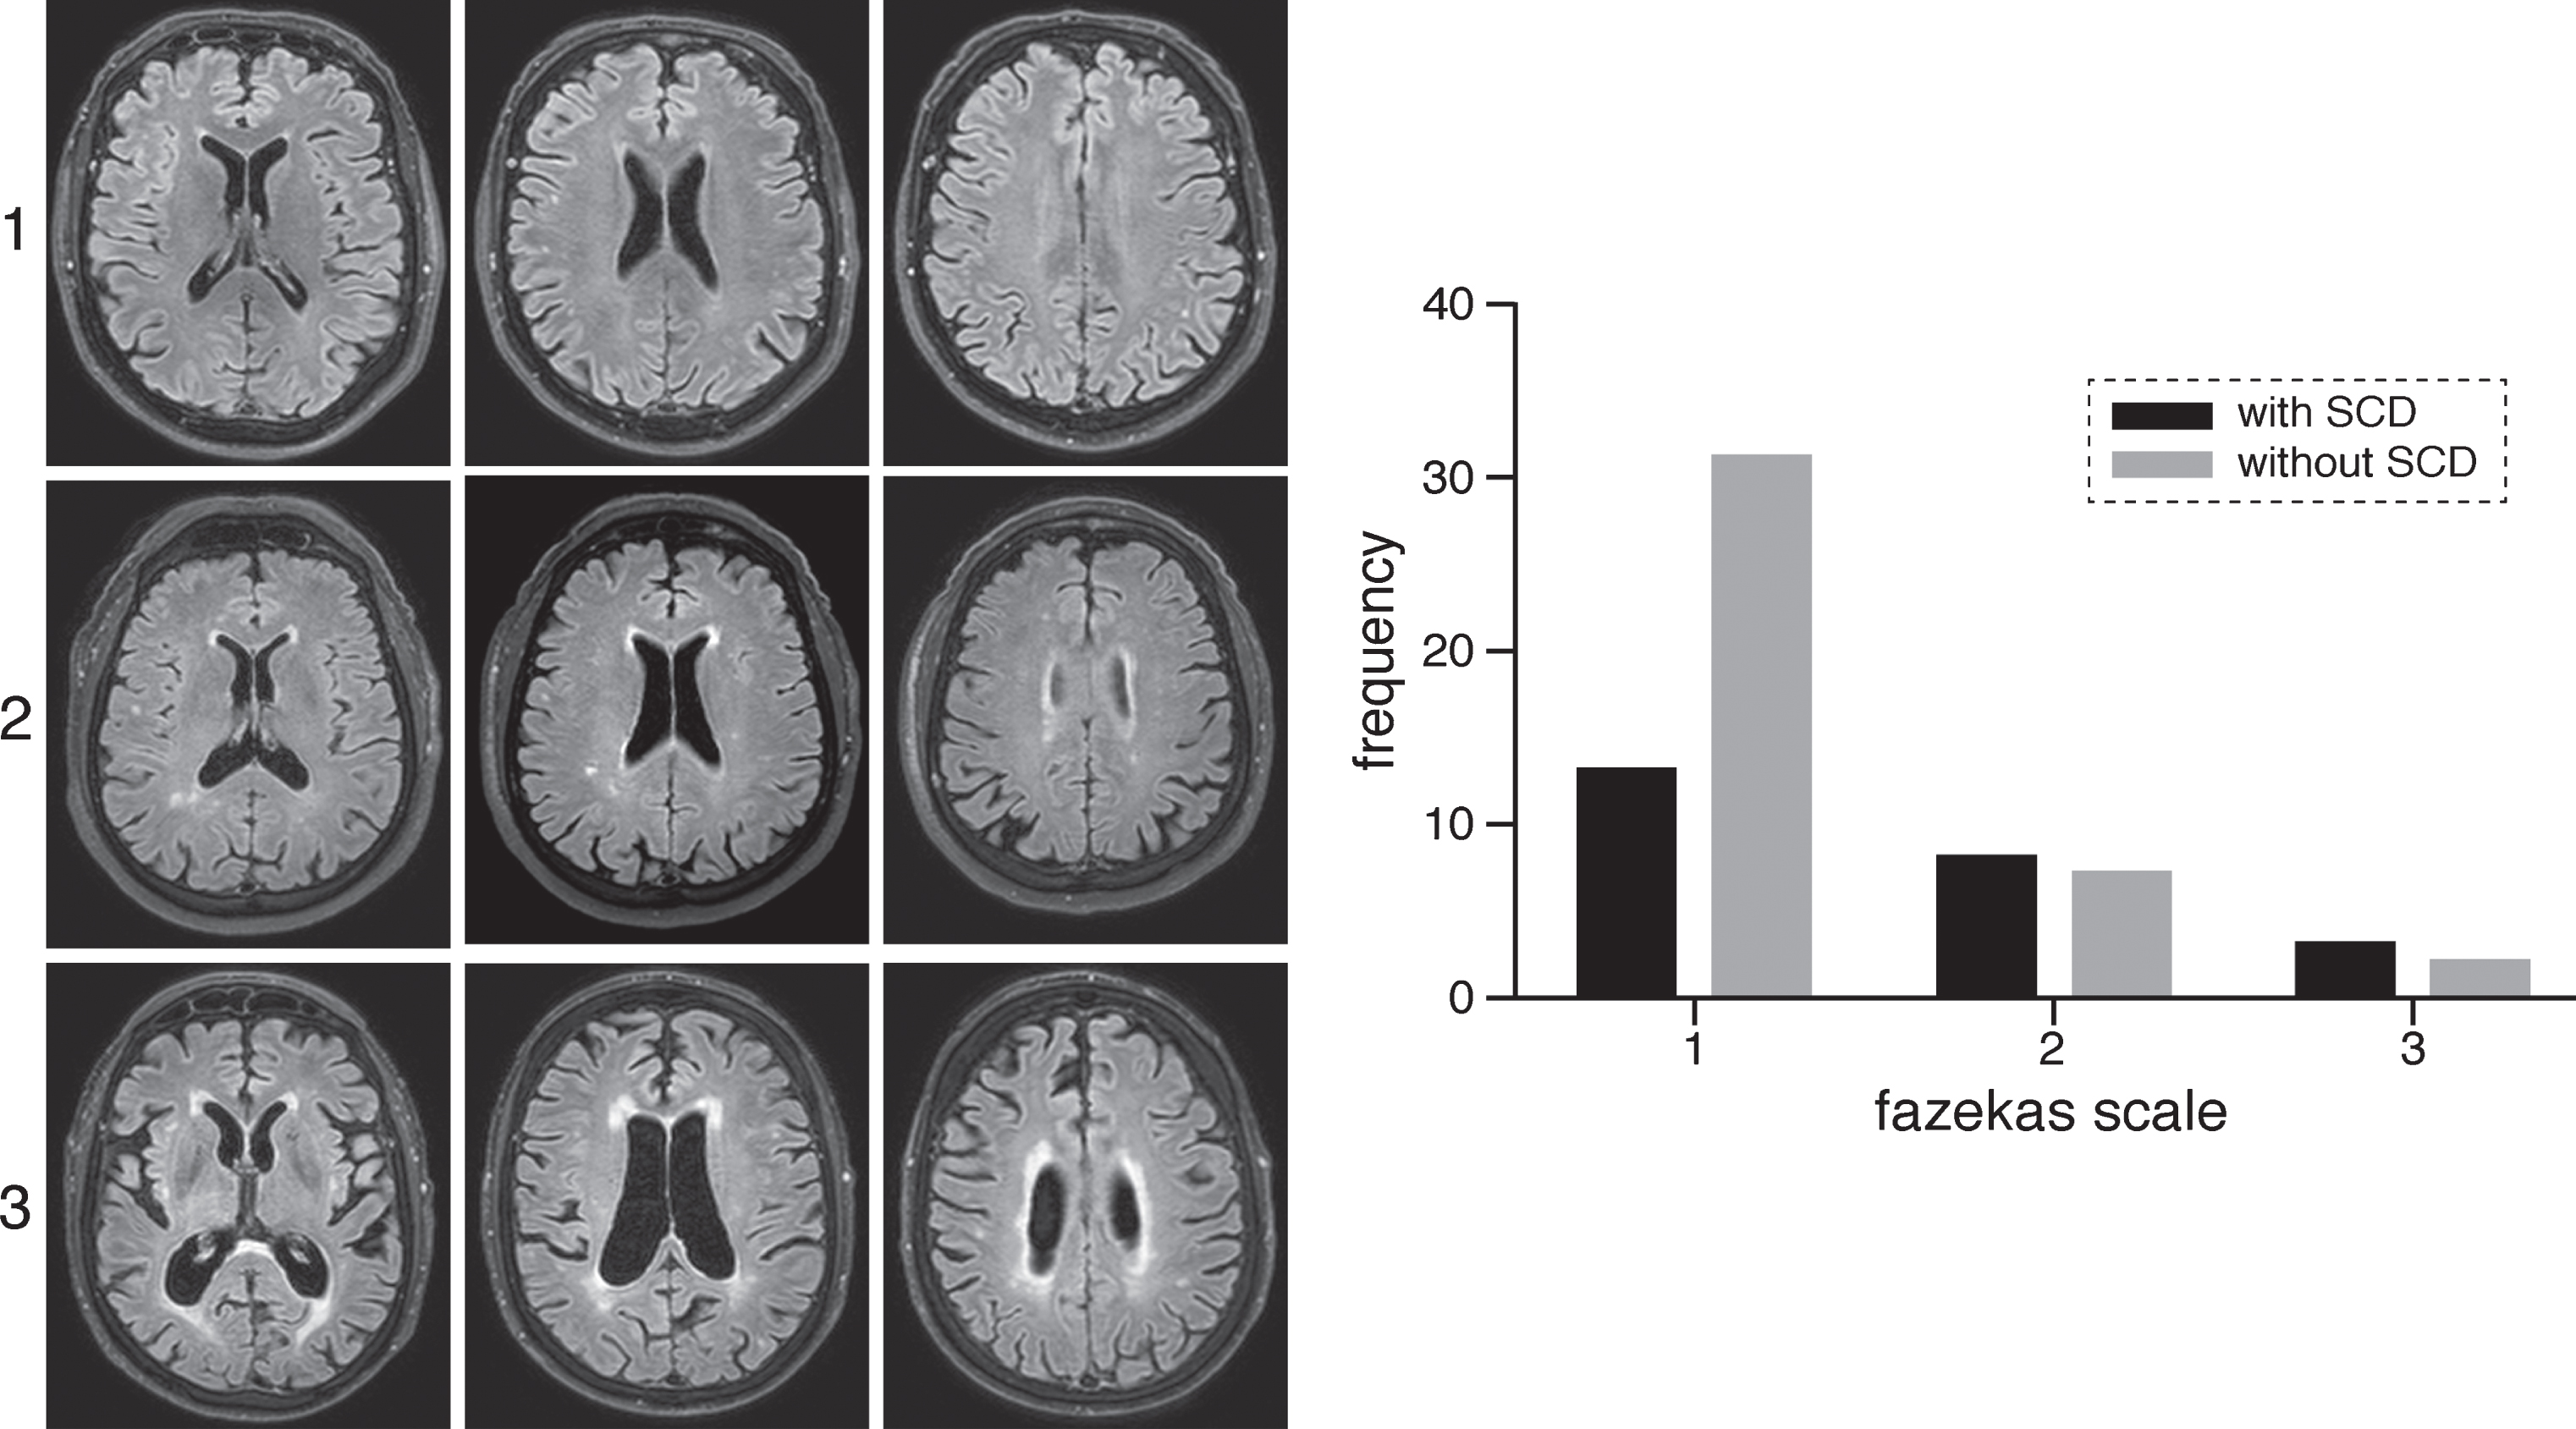
We assessed WMHs both quantitatively and qualitatively, i.e., calculated as volume (ml) and visually rated using the Fazekas scale [41]. WMH volume was automatically quantified by using an adapted version of a previously validated method [48]. In the first step the 3D T1-weighted image was skull stripped using BET and non-linear registered to standard MNI 152 space using the FMRIB’s tool for small-displacement non-linear registration FNIRT [49]. Next after co-registration of the FLAIR image to the 3D T1-image using FMRIB’s Linear Image Registration Tool [50], the warpfield from the first step was applied to register the FLAIR image to MNI 152 standard space. Subsequently the FLAIR image was masked with a conservative MNI 152 white matter mask. A threshold of 2 standard deviations above the mean FLAIR signal intensity was used to automatically identify WMHs. For this purpose, mean FLAIR signal was obtained from the cerebral periphery to limit skewing of the signal intensity distribution from hyperintense periventricular white matter voxels. The brainstem and cerebellum were excluded from this analysis. WMH volume was corrected for intracranial volume. The Fazekas scale for white matter lesions, a common clinical measurement, was scored on transversal FLAIR images [41] by two independent raters (SvR and JvdG) who were blinded to participant group, see Fig. 2 for representative examples in our sample.
Fig. 2.
On the left examples of Fazekas scoring in participants on FLAIR images. First row shows a participant without SCD with Fazekas score of 1, second row shows a participant with SCD and a Fazekas score of 2 and the last row shows a participant with SCD with Fazekas score of 3. On the right frequency of participants with and without SCD with Fazekas scales from 1–3.
Lacunar infarcts were defined as hyperintense lesions on T2-weighted images with corresponding hypointense lesions with a hyperintense rim on FLAIR, located in the basal ganglia, thalamus, internal or external capsule, or brain stem with a diameter < 20 mm and not compatible with clinical findings and scored blinded for group [51].
The detection of hemorrhagic lesions (ICHs and MBs) was evaluated blinded for group on T2 *-weighted images. ICHs were defined as parenchymal defects with evidence of hemosiderin in their wall. Microbleeds were defined as focal, nodular areas of signal loss in brain parenchyma on T2 *-weighted gradient-echo images and were scored as previously described [52].
Cognitive and neuropsychiatric function
For all participants level of education was assessed based on highest degree earned, such that 1 = less than high school, 2 = high school, 3 = associate’s degree, 4 = bachelor’s degree, 5 = master’s degree, 6 = PhD or equivalent. As previous research shows an association between education and SCD, we included education as a regressor in all analyses [53]. At both test sites, the same neuropsychological test battery was administered to measure global cognitive functioning (MMSE [42]), memory (Wechsler Memory Scale IV (WMS IV) [54], and Rey Auditory Verbal Learning Test [55]), language (verbal fluency) [56], and executive function (Digit symbol of the Wechsler Adult Intelligence Scale (WAIS) III [57], Stroop [58], and Trail Making Test (TMT) [59]). Cognitive scores on these measures were not age-normed. The WMS IV includes several indices assessing different memory functions, i.e., auditory memory, visual memory, visual working memory, immediate memory, and delayed memory. Proportional index scores were calculated for the WMS IV based on the raw scores, which retained age-related variance. For the Stoop and TMT, ratio scores were calculated to reflect measures of executive function independent of processing speed.
The Wechsler Abbreviated Scale of Intelligence II [60] was used to determine participant IQ for those recruited in Detroit, and the four corresponding subtests (block design, vocabulary, matrix reasoning and similarities) of the Dutch language version of the WAIS III [57] were used to assess the IQ of participants in the Netherlands. IQ scores were age-normed.
Self-report questionnaires to assess the amount of memory complaints (Memory Functioning Questionnaire (MFQ) [61]), depressive symptomology (Geriatric Depression Scale (GDS) [62], and Beck Depression Inventory (BDI) II [63]), personality (Big Five Inventory [64]), and handedness (Edinburgh Handedness Inventory [65]) were also completed by participants at both test sites. Given that the frequency of forgetting (FOF) subscale of the MFQ has been shown to be a reliable marker for memory self-efficacy [66], it was used to quantify the amount of memory complaints reported by each participant. To facilitate a more intuitive interpretation of the FOF subscale, scores were inverted so that higher scores would be indicative of more complaints as opposed to indicating no complaints. The mean response to items on the FOF subscale was calculated from the inverted scores.
Previous studies have demonstrated that depression [13, 67] and high neuroticism [68, 69] co-occur with SCD. Therefore, differences between those with and without SCD in subclinical depressive symptomology and personality characteristics were evaluated. The GDS contains a question that asks 14) “Do you feel you have more problems with memory than most?” Since this question may capture variance related to cognitive complaints without depression, comparisons between those with and without SCD on this measure were done both with and without inclusion of this question.
APOE ɛ genotype
DNA isolation from saliva was performed using the Qiagen EZ1 Advanced Nucleic Acid Purification System in conjunction with the EZ1 DNA Tissue Kit and the EZ1 DNA Tissue Card. The “High-throughput DNA purification with the Qiagen BioRobot™ EZ1”, (http://www.dnagenotek.com/US/pdf/MK-AN-006.pdf) an in-house validated procedure, was followed. APOE single nucleotide polymorphism (SNP) genotyping was performed for rs429358 and rs7412 using 5μl of Kapa Probe Fast ABI Prism 2x qPCR Master Mix, 1μl template DNA, 0.25μl of 20x TaqMan SNP Genotyping Assays (Applied Biosystems), and 1.25μl molecular grade water. A CEPH and an in-house control were run along with samples. Samples and controls were run on an Applied Biosystems Quantstudio 12K Flex Real-Time PCR Instrument using the following thermocycling protocol: 95°C for 5 min and 40 cycles of 95°C for 5 s and 60°C for 30 s.
Statistics
Interobserver agreement κ values (including standard errors of the mean) were calculated for MTA and Fazekas scores. Consensus (with the readers still blinded to the diagnosis) was reached in all cases of disagreement. The grading of interobserver agreement was performed according to the recommendations of Landis and Koch [70].
Independent sample t-tests were used to assess differences between groups for age, blood pressure, total IQ, MFQ scales, depression scales, personality scales, and neuropsychological tests (including subscales of the WMS IV). A Mann-Whitney U test was performed to assess differences between groups in education. Chi square tests were performed to assess differences between groups for sex, APOE ɛ genotype, and the ratio of participants in each group between test sites.
Because the number of microbleeds and lacunar infarcts were so sparse, we considered it irrelevant to assess the association between these MRI markers and presence/amount of memory complaints. Therefore, only prevalence in each group is reported. Furthermore, none of the participants showed ICHs, therefore these lesions were not considered for statistical analysis. The association between scale MRI markers (hippocampal volume and WMH volume) and presence of SCD/amount of memory complaints across all participants (FOF subscale of the MFQ) was examined using a linear regression analysis per MRI marker. These MRI markers were first checked for outliers. The association between ordinal MRI markers (MTA and Fazekas) and presence of SCD/amount of memory complaints across all participants (FOF subscale of the MFQ) was examined using ordinal regression analysis per MRI marker. Furthermore, we used a hierarchical logistic regression and linear regression, adjusted for age, sex, education and test-site, to explore which marker (hippocampal atrophy or WMH) was a stronger predictor for either SCD or amount of memory complaints. Analyses were performed for volumetric measurement and visual assessment separately.
Age, sex, education, and test-site were adjusted for in all analyses and significance levels for all statistical tests were corrected for multiple comparisons with Bonferroni correction where applicable. Bonferroni correction was determined per bold printed category in the tables (p < 0.05 / the number of measurements within each category). All statistical analyses were performed with SPSS (version 23; SPSS, Chicago, Ill).
RESULTS
Demographic, neuropsychiatric, and cognitive characteristics
See Table 1 for demographic, neuropsychiatric, and cognitive characteristics. There was no difference in the ratio of participants in each group between test sites and the groups showed no significant differences in age, sex, blood pressure, IQ, and education. As expected, we found more complaints reported on the FOF subscale of the MFQ by adults with SCD than by those without SCD. Furthermore, the groups did not differ in depressive symptomology according to the GDS (with and without Q14) and BDI II scores. No group differences were observed for neuroticism or consciousness, as measured by the Big Five Inventory. No significant difference in the proportion of APOE ɛ4 carriers between groups was found; 48% (12/25) of the participants with SCD were APOE ɛ4 carriers whereas 28% (11/40) of those without SCD were ɛ4-carriers. We found no significant differences in cognitive function between groups, see Table 1.
Table 1
Participant characteristics and mean cognitive scores in participants with and without SCD. M±SD unless otherwise noted.
| With SCD (n = 25) | Without SCD (n = 42) | p | |
| Participant characteristics | |||
| Age (range) | 68±9.1 (45–84) | 68±9.2 (50–85) | 0.961 |
| Sex (m/f) | 7/18 | 17/25 | 0.303 |
| Test site (US/NL) | 13/12 | 26/16 | 0.427 |
| Systolic blood pressure | 138±14.4 | 140±21.7 | 0.596 |
| Diastolic blood pressure | 81±10.6 | 81±11.6 | 0.773 |
| APOE ɛ genotype (ɛ4 carrier) | 12/25 | 11/40 | 0.093 |
| Full scale IQ | 101.5±12.8 | 105.0±14.7 | 0.377 |
| Education (median) | 3 (Associate’s Degree) | 4 (Bachelor’s degree) | 0.599 |
| Memory Functioning Questionnaire | |||
| Frequency of forgetting | 3.6±1.0 | 2.7±0.8 | <0.0001 |
| Seriousness of Forgetting | 4.0±1.4 | 3.3±1.7 | 0.106 |
| Retrospective Functioning | 5.5±1.1 | 4.3±1.1 | <0.001 |
| Mnemonic usage | 5.4±1.1 | 4.8±1.2 | 0.039 |
| Depression screenings | |||
| Geriatric Depression Scale | 5.4±4.1 | 3.1±4.0 | 0.026 |
| Geriatric Depression Scale (without Q14) | 4.8±4.0 | 3.0±4.0 | 0.090 |
| Beck Depression Inventory | 6.9±5.6 | 4.4±5.5 | 0.090 |
| Personality measures (BFI) | |||
| Openness | 37.0 + 5.5 | 38.1 + 5.7 | 0.417 |
| Conscientiousness | 34.2±5.9 | 36.5±5.5 | 0.110 |
| Extraversion | 28.4 + 5.0 | 26.6 + 4.8 | 0.142 |
| Agreeableness | 37.5 + 5.7 | 36.9 + 5.7 | 0.645 |
| Neuroticism | 19.4±5.7 | 17.1±5.4 | 0.107 |
| Cognitive functioning | |||
| MMSE | 28.7±1.2 | 29±1.4 | 0.428 |
| WMS IV Auditory Memory Index | 82.1±17.3 | 86.4±19.6 | 0.376 |
| WMS IV Visual Memory Index | 166.7±27.3 | 179.2±34.3 | 0.133 |
| WMS IV Visual Working Memory Index | 31.4±7.9 | 35.5±9.3 | 0.070 |
| WMS IV Immediate Memory Index | 148.4±22.8 | 156.4±26.1 | 0.217 |
| WMS IV Delayed Memory Index | 100.4±19.3 | 108.1±24.4 | 0.186 |
| Rey Auditory Verbal Learning Task (total) | 43.2±10.0 | 43.6±8.8 | 0.857 |
| Verbal fluency (number correct) | 39.3±8.3 | 41.7±7.6 | 0.227 |
| WAIS III - Digit symbol | 46.8±14.8 | 50.2±15.6 | 0.391 |
| Stroop ratio (3/2) | 1.9±0.5 | 1.7±0.3 | 0.226 |
| Trail Making Test ratio (B/A) | 2.4±0.9 | 42.9±0.8 | 0.569 |
Independent sample t-tests were used to assess differences between groups for age, blood pressure, total IQ, MFQ scales (inverted and averaged scores), depression scales, personality measures and neuropsychological tests. Mann-Whitney U test was performed to assess differences between groups in education. Chi square tests were performed to assess differences between groups for sex, APOE ɛ genotype, and the ratio of participants in each group between test sites. Significant p-values in bold after Bonferroni correction (significant p-values per category set at memory functioning questionnaire p < (0.05/4=) 0.0125, depression p < (0.05/3=) 0.016, personality measures p < (0.05/5=) 0.01, cognitive functioning p < (0.05/11=) 0.005).
Neuroimaging and subjective cognitive decline
The κ value for interobserver agreement was substantial for MTA score (κ = 0.730 ± 0.106, [standard error of mean], p < 0.001), and almost perfect for Fazekas score (κ=0.823 ± 0.104, p < 0.001). Table 2 shows the results of the relationship between AD and SVD MRI markers and presence of SCD as assessed by a linear/ordinal regression analysis per MRI marker, adjusted for age, sex, education, and test-site. As expected, SCD was a significant predictor of medial temporal lobe atrophy, as measured with the MTA scale, (χ2 = 5.395, p = 0.020, see Fig. 1), such that those with SCD were more likely to have higher scores on the MTA scale than those without. However, there was not a significant effect of SCD status on volumetric measurements of the hippocampus (β=0.117, p = 0.229). Furthermore, we found a significant effect of SCD status on WMH volume (β=–0.283, p = 0.024), suggesting larger WMH volumes in adults with SCD. We also found that the presence of SCD was a significant predictor of WMHs, as measured by Fazekas score (χ2=5.274, p = 0.022), such that those with SCD were more likely to have higher Fazekas scores indicating more severe WMHs than those without SCD, see Fig. 2. The prevalence of microbleeds was 16% (3/19) for adults with SCD and 6% (2/36) for those without SCD. The prevalence of lacunar infarcts was 12% (3/25) for adults with SCD and 10% (4/42) for those without SCD.
Table 2
MRI markers in participants with and without SCD
| MRI marker | With SCD (n = 25) | Without SCD (n = 42) | p | |
| AD markers | Hippocampal volume (cm3) (mean (SD)) | 6.8 (1.2) | 7.0 (0.9) | 0.229 |
| MTA (median (range)) | 1 (0–3) | 0 (0–2) | 0.020 | |
| SVD markers | WMHs (cm3) (mean (SD)) | 16.3 (21.3) | 7.9 (4.6) | 0.024 |
| Fazekas (median (range)) | 1 (1–3) | 1 (1–3) | 0.022 | |
| Microbleeds (prevalence) | 16% (3/19) | 6% (2/36) | - | |
| Lacunar infarcts (prevalence) | 12% (3/25) | 10% (4/42) | - |
p-values of linear and ordinal regression analysis. Significant p-values in bold after Bonferroni correction (significant p-values set at AD markers p< (0.05/2=) 0.025 and SVD markers p< (0.05/2=) 0.025).
Exploration of which MRI marker was the strongest contributor to presence of SCD, demonstrated that for the visual measurement both MTA alone (χ2=5.473, p = 0.019) as well as MTA (χ2 =4.135, p = 0.042) and Fazekas (χ2 =4.025, p = 0.045) significantly contributed to the model. The volumetric measurements showed no significant results.
Neuroimaging and amount of memory complaints
Because most of our participants reported some level of memory complaints, regardless of whether they experienced these as worrisome or not, we were also interested in the association between amount of memory complaints (as measured by the FOF scale of the MFQ) and our AD and SVD MRI markers across all participants. MTA score and hippocampal volume were not significantly associated with amount of memory complaints. The amount of memory complaints was significantly associated with the amount of WMHs as measured using the Fazekas scale (χ2 =7.227, p = 0.007) and with WMH volume in all participants (∂=–0.277, p = 0.025), indicating that larger WMH volume was related to more memory complaints. Exploration of which MRI marker is the strongest contributor to the amount of memory complaints, hierarchical linear regression of amount of memory complaints for the visual measurements shows a significant contribution of MTA alone (∂=–0.323, p = 0.031), however when Fazekas score is also entered in the model only Fazekas shows a significant contribution to amount of memory complaints (∂=–0.359, p = 0.007) and MTA is not significant anymore. For the volumetric measurements, hippocampal volume shows no significant contribution, and WMH volume demonstrates a significant contribution to amount of memory complaints (∂=–0.277, p = 0.029).
DISCUSSION
Our findings show that in addition to hippocampal atrophy, a common marker of AD, larger volumes of WMHs, a marker of vascular dementia, are also related to SCD. Furthermore, WMHs were associated with the amount of memory complaints reported across all participants. These findings were independent of objective cognitive function, depressive symptoms, personality traits, and APOE ɛ genotype.
An association between the presence of SCD and hippocampal atrophy has been demonstrated in earlier research [6, 9]. However, in our study only the visual rating using the MTA scale demonstrated this association, and not the hippocampal volume measurement. Our results therefore suggest that visual rating using the MTA scale may be more sensitive to detecting early AD-related hippocampal atrophy than automated volume measurements. A possible explanation for the lack of correspondence between measures could lie in the observed over-estimation, and age bias, of automated hippocampal demarcation tools compared to manual segmentation [71]. Nevertheless, previous studies show mixed results with some suggesting that automated volumetry measurements are less sensitive [37–39], equally sensitive [32–36], or more sensitive [30, 31] than visual assessment. Regardless of the measurement approach, overall the literature suggests a consistent association between hippocampal volume/atrophy and possible early phase AD.
Our data suggest that late middle-aged to older adults with SCD have greater WMH volume compared to those without concerns about their cognitive functioning. Visual rating using the Fazekas scale showed the same pattern of results and was also associated with the amount of memory complaints reported across all participants on the FOF subscale of the MFQ. These findings regarding WMHs are in line with an earlier study showing that older adults with SCD and severe WMHs had a higher risk of clinical progression to dementia than those without WMHs [27]. Our results indicate that in addition to typical AD markers (hippocampal atrophy), SVD markers are also present in possible early phase AD. In line with previous research, these findings suggest that the vascular component might indeed be dysregulated and that mixed disease may already be present in very early stages of dementia [24], i.e., in late middle-aged to older adults with SCD.
In addition to these findings, we have demonstrated that the strongest predictor of amount of memory complaints when comparing atrophy and SVD measures is SVD. Both the visual assessment of WMHs via Fazekas score and the volumetric assessment of WMH volume were stronger predictors for the amount of reported memory complaints than scores on the MTA scale or hippocampal volume. This implies that vascular damage might be one of the earliest markers of SCD. This is in line with recent research showing that vascular dysregulation might be the earliest pathological event in AD assuming that SCD is an early stage of AD [24]. Vascular damage is currently established as a serious comorbidity in AD and its early stages, and having an independent effect on cognition [18–21]. Even presumed early stages of AD (SCD and MCI) [6, 9, 23] might already show abnormal vascular reactivity [24].
We also assessed other SVD markers, such as microbleeds and lacunar infarcts, but because of overall low prevalence we did not statistically assess between-group differences. Still, the occurrence of microbleeds in participants with SCD (16%) seemed higher compared to those without SCD (6%). Studies in older adults with SCD on microbleeds are sparse. In a study on microbleeds performed using a 1.0T MRI scanner in a memory clinic setting, the prevalence of microbleeds in participants with SCD was 10%, which is somewhat lower than the 16% found in our participants with SCD [28]. However, these numbers are difficult to compare as MRI methods and field strength can greatly influence the number of detected microbleeds [52]. Our study is limited by a relatively smaller sample size; future studies with larger study samples are needed to assess the association between microbleeds, lacunar infarcts, and SCD.
Other tentative differences between participants with and without SCD did not reach significance but may be worth mentioning. We observed a trend-level effect of SCD on the visual working memory index of the WMS IV, suggesting that participants with SCD performed worse than those without SCD. Working memory deficits have previously been associated with early AD [72], therefore this measure could prove sensitive to detect early cognitive changes in SCD. Also, the prevalence of APOE ɛ4 genotype, an important known risk factor for AD [73], appeared slightly higher in participants with SCD compared to those without. Lastly, we found a trend towards more subclinical depressive symptoms in those with SCD compared to those without, an association that has been observed by earlier research [12, 13]. Even though we find these tentative associations potentially of interest, longitudinal research and a larger sample size are needed to elucidate the association between these measures and early phase AD.
Conclusions
Our results indicate that SCD is related to more hippocampal atrophy and greater WMHs in healthy middle-aged to older adults, independent of objective cognitive function, depressive symptoms, personality traits, and APOE ɛ genotype. Furthermore, WMHs were a stronger predictor for the amount of reported memory complaints than hippocampal atrophy. WMHs are a prominent marker for SVD, which appears to be an important factor contributing to SCD. Our results warrant further research to elucidate the role of SVD in middle-aged to older adults with SCD and possible subsequent cognitive decline.
ACKNOWLEDGMENTS
This work was supported in part by the Netherlands Organisation for Scientific Research [Veni grant: 016.136.072]. SR was sponsored by the Netherlands Organisation for Scientific Research [Vici grant: 016.130.677].
Authors’ disclosures available online (https://www.j-alz.com/manuscript-disclosures/18-0285r2).
REFERENCES
[1] | Jack CR Jr , Knopman DS , Jagust WJ , Shaw LM , Aisen PS , Weiner MW , Petersen RC , Trojanowski JQ ((2010) ) Hypothetical model of dynamic biomarkers of the Alzheimer’s pathological cascade. Lancet Neurol 9: , 119–128. |
[2] | Nelson PT , Braak H , Markesbery WR ((2009) ) Neuropathology and cognitive impairment in Alzheimer disease: a complex but coherent relationship. J Neuropathol Exp Neurol 68: , 1–14. |
[3] | Jessen F , Amariglio RE , van BM , Breteler M , Ceccaldi M , Chetelat G , Dubois B , Dufouil C , Ellis KA , van der Flier WM , Glodzik L , van Harten AC , de Leon MJ , McHugh P , Mielke MM , Molinuevo JL , Mosconi L , Osorio RS , Perrotin A , Petersen RC , Rabin LA , Rami L , Reisberg B , Rentz DM , Sachdev PS , de LS , V, Saykin AJ , Scheltens P , Shulman MB , Slavin MJ , Sperling RA , Stewart R , Uspenskaya O , Vellas B , Visser PJ , Wagner M ; Subjective Cognitive Decline Initiative (SCD-I) Working Group ((2014) ) A conceptual framework for research on subjective cognitive decline in preclinical Alzheimer’s disease. Alzheimers Dement 10: , 844–852. |
[4] | Dik MG , Jonker C , Comijs HC , Bouter LM , Twisk JW , Van Kamp GJ , Deeg DJ ((2001) ) Memory complaints and APOE-epsilon4 accelerate cognitive decline in cognitively normal elderly. Neurology 57: , 2217–2222. |
[5] | Jessen F , Wiese B , Bachmann C , Eifflaender-Gorfer S , Haller F , Kolsch H , Luck T , Mosch E , van den Bussche H , Wagner M , Wollny A , Zimmermann T , Pentzek M , RiedelHeller SG , Romberg HP , Weyerer S , Kaduszkiewicz H , Maier W , Bickel H ((2010) ) Prediction of dementia by subjective memory impairment: effects of severity and temporal association with cognitive impairment. Arch Gen Psychiatry 67: , 414–422. |
[6] | van der Flier WM , van Buchem MA , Weverling-Rijnsburger AW , Mutsaers ER , Bollen EL , Admiraal-Behloul F , Westendorp RG , Middelkoop HA ((2004) ) Memory complaints in patients with normal cognition are associated with smaller hippocampal volumes. J Neurol 251: ,671–675. |
[7] | Striepens N , Scheef L , Wind A , Popp J , Spottke A , Cooper-Mahkorn D , Suliman H , Wagner M , Schild HH , Jessen F ((2010) ) Volume loss of the medial temporal lobe structures in subjective memory impairment. Dement Geriatr Cogn Disord 29: , 75–81. |
[8] | Saykin AJ , Wishart HA , Rabin LA , Santulli RB , Flash-man LA , West JD , McHugh TL , Mamourian AC ((2006) ) Older adults with cognitive complaints show brain atrophy similar to that of amnestic MCI. Neurology 67: , 834–842. |
[9] | Stewart R , Godin O , Crivello F , Maillard P , Mazoyer B , Tzourio C , Dufouil C ((2011) ) Longitudinal neuroimag-ing correlates of subjective memory impairment: 4-year prospective community study. Br J Psychiatry 198: , 199–205. |
[10] | Jessen F , Feyen L , Freymann K , Tepest R , Maier W , Heun R , Schild HH , Scheef L ((2006) ) Volume reduction of the entorhinal cortex in subjective memory impairment. Neurobiol Aging 27: , 1751–1756. |
[11] | Stewart R , Dufouil C , Godin O , Ritchie K , Maillard P , Delcroix N , Crivello F , Mazoyer B , Tzourio C ((2008) ) Neuroimaging correlates of subjective memory deficits in a community population. Neurology 70: , 1601–1607. |
[12] | Eramudugolla R , Cherbuin N , Easteal S , Jorm AF , Anstey KJ ((2012) ) Self-reported cognitive decline on the informant questionnaire on cognitive decline in the elderly is associated with dementia, instrumental activities of daily living and depression but not longitudinal cognitive change. Dement Geriatr Cogn Disord 34: , 282–291. |
[13] | Montejo P , Montenegro M , Fernandez MA , Maestu F ((2011) ) Subjective memory complaints in the elderly: Prevalence and influence of temporal orientation, depression and quality of life in a population-based study in the city of Madrid. Aging Ment Health 15: , 85–96. |
[14] | Jorm AF , Christensen H , Korten AE , Jacomb PA , Henderson AS ((2001) ) Memory complaints as a precursor of memory impairment in older people: a longitudinal analysis over 7-8 years. Psychol Med 31: , 441–449. |
[15] | Knopman DS ((2012) ) Subjective cognitive impairment: fickle but fateful. Neurology 79: , 1308–1309. |
[16] | Ward A , Tardiff S , Dye C , Arrighi HM ((2013) ) Rate of conversion from prodromal Alzheimer’s disease to Alzheimer’s dementia: a systematic review of the literature. Dement Geriatr Cogn Dis Extra 3: , 320–332. |
[17] | Wolfsgruber S , Kleineidam L , Wagner M , Mosch E , Bickel H , Lupsilonhmann D , Ernst A , Wiese B , Steinmann S , Konig HH , Brettschneider C , Luck T , Stein J , Weyerer S , Werle J , Pentzek M , Fuchs A , Maier W , Scherer M , RiedelHeller SG , Jessen F ((2016) ) Differential risk of incident Alzheimer’s disease dementia in stable versus unstable patterns of subjective cognitive decline. J Alzheimers Dis 54: , 1135–1146. |
[18] | Abner EL , Kryscio RJ , Schmitt FA , Fardo DW , Moga DC , Ighodaro ET , Jicha GA , Yu L , Dodge HH , Xiong C , Woltjer RL , Schneider JA , Cairns NJ , Bennett DA , Nelson PT ((2017) ) Outcomes after diagnosis of mild cognitive impairment in a large autopsy series. Ann Neurol 81: , 549–559. |
[19] | Arvanitakis Z , Capuano AW , Leurgans SE , Bennett DA , Schneider JA ((2016) ) Relation of cerebral vessel disease to Alzheimer’s disease dementia and cognitive function in elderly people: a cross-sectional study. Lancet Neurol 15: , 934–943. |
[20] | Boyle PA , Yu L , Nag S , Leurgans S , Wilson RS , Bennett DA , Schneider JA ((2015) ) Cerebral amyloid angiopathy and cognitive outcomes in community-based older persons. Neurology 85: , 1930–1936. |
[21] | Bennett DA , Schneider JA , Arvanitakis Z , Wilson RS ((2012) ) Overview and findings from the religious orders study. Curr Alzheimer Res 9: , 628–645. |
[22] | Jellinger KA ((2007) ) The enigma of vascular cognitive disorder and vascular dementia. Acta Neuropathol 113: , 349–388. |
[23] | Albert MS , DeKosky ST , Dickson D , Dubois B , Feld-man HH , Fox NC , Gamst A , Holtzman DM , Jagust WJ , Petersen RC , Snyder PJ , Carrillo MC , Thies B , Phelps CH ((2011) ) The diagnosis of mild cognitive impairment due to Alzheimer’s disease: recommendations from the National Institute on Aging-Alzheimer’s Association workgroups on diagnostic guidelines for Alzheimer’s disease. Alzheimers Dement 7: , 270–279. |
[24] | Iturria-Medina Y , Sotero RC , Toussaint PJ , Mateos-Perez JM , Evans AC ((2016) ) Early role of vascular dysregulation on late-onset Alzheimer’s disease based on multifactorial data-driven analysis. Nat Commun 7: , 11934. |
[25] | Pantoni L ((2010) ) Cerebral small vessel disease: from pathogenesis and clinical characteristics to therapeutic challenges. Lancet Neurol 9: , 689–701. |
[26] | Wardlaw JM , Smith C , Dichgans M ((2013) ) Mechanisms of sporadic cerebral small vessel disease: insights from neuroimaging. Lancet Neurol 12: , 483–497. |
[27] | Benedictus MR , van Harten AC , Leeuwis AE , Koene T , Scheltens P , Barkhof F , Prins ND , van der Flier WM ((2015) ) White matter hyperintensities relate to clinical progression in subjective cognitive decline. Stroke 46: , 2661–2664. |
[28] | Cordonnier C , van der Flier WM , Sluimer JD , Leys D , Barkhof F , Scheltens P ((2006) ) Prevalence and severity of microbleeds in a memory clinic setting. Neurology 66: , 1356–1360. |
[29] | Frisoni GB , Fox NC , Jack CR Jr , Scheltens P , Thompson PM ((2010) ) The clinical use of structural MRI in Alzheimer disease. Nat Rev Neurol 6: , 67–77. |
[30] | Boutet C , Chupin M , Colliot O , Sarazin M , Mutlu G , Drier A , Pellot A , Dormont D , Lehericy S ((2012) ) Is radiological evaluation as good as computer-based volumetry to assess hippocampal atrophy in Alzheimer’s disease? Neuroradiology 54: , 1321–1330. |
[31] | Menendez Gonzalez M , Suarez-Sanmartin E , Garcia C , Martinez-Camblor P , Westman E , Simmons A ((2016) ) Manual planimetry of the medial temporal lobe versus automated volumetry of the hippocampus in the diagnosis of Alzheimer’s disease. Cureus 8: , e544. |
[32] | Varon D , Barker W , Loewenstein D , Greig M , Bohorquez A , Santos I , Shen Q , Harper M , Vallejo-Luces T , Duara R ((2015) ) Visual rating and volumetric measurement of medial temporal atrophy in the Alzheimer’s Disease Neuroimaging Initiative (ADNI) cohort: Baseline diagnosis and the prediction of MCI outcome. Int J Geriatr Psychiatry 30: , 192–200. |
[33] | Westman E , Cavallin L , Muehlboeck JS , Zhang Y , Mecocci P , Vellas B , Tsolaki M , Kloszewska I , Soininen H , Spenger C , Lovestone S , Simmons A , Wahlund LO ((2011) ) Sensitivity and specificity of medial temporal lobe visual ratings and multivariate regional MRI classification in Alzheimer’s disease. PLoS One 6: , e22506. |
[34] | Bresciani L , Rossi R , Testa C , Geroldi C , Galluzzi S , Laakso MP , Beltramello A , Soininen H , Frisoni GB ((2005) ) Visual assessment of medial temporal atrophy on MR films in Alzheimer’s disease: Comparison with volumetry. Aging Clin Exp Res 17: , 8–13. |
[35] | Dhikav V , Duraiswamy S , Anand KS ((2017) ) Correlation between hippocampal volumes and medial temporal lobe atrophy in patients with Alzheimer’s disease. Ann Indian Acad Neurol 20: , 29–35. |
[36] | Visser PJ , Verhey FR , Hofman PA , Scheltens P , Jolles J ((2002) ) Medial temporal lobe atrophy predicts Alzheimer’s disease in patients with minor cognitive impairment. J Neurol Neurosurg Psychiatry 72: , 491–497. |
[37] | Wahlund LO , Julin P , Johansson SE , Scheltens P ((2000) ) Visual rating and volumetry of the medial temporal lobe on magnetic resonance imaging in dementia: A comparative study. J Neurol Neurosurg Psychiatry 69: , 630–635. |
[38] | Persson K , Barca ML , Cavallin L , Braekhus A , Knap-skog AB , Selbaek G , Engedal K ((2018) ) Comparison of automated volumetry of the hippocampus using Neuro-Quant(R) and visual assessment of the medial temporal lobe in Alzheimer’s disease. Acta Radiol 59: , 997–1001. |
[39] | Shen Q , Loewenstein DA , Potter E , Zhao W , Appel J , Greig MT , Raj A , Acevedo A , Schofield E , Barker W , Wu Y , Potter H , Duara R ((2011) ) Volumetric and visual rating of magnetic resonance imaging scans in the diagnosis of amnestic mild cognitive impairment and Alzheimer’s disease. Alzheimers Dement 7: , e101–108. |
[40] | Scheltens P , Launer LJ , Barkhof F , Weinstein HC , van Gool WA ((1995) ) Visual assessment of medial temporal lobe atrophy on magnetic resonance imaging: Interobserver reliability. J Neurol 242: , 557–560. |
[41] | Fazekas F , Chawluk JB , Alavi A , Hurtig HI, Zimmerman RA ((1987) ) MR signal abnormalities at 1.5 Tin Alzheimer’s dementia and normal aging. AJR Am J Roentgenol 149: , 351–356. |
[42] | Folstein MF , Folstein SE , McHugh PR ((1975) ) "Minimental state". A practical method for grading the cognitive state of patients for the clinician. J Psychiatr Res 12: , 189–198. |
[43] | Creavin ST , Wisniewski S , Noel-Storr AH , Trevelyan CM , Hampton T , Rayment D , Thom VM , Nash KJ , Elhamoui H , Milligan R , Patel AS , Tsivos DV , Wing T , Phillips E , Kellman SM , Shackleton HL , Singleton GF , Neale BE , Watton ME , Cullum S ((2016) ) Mini-Mental State Examination (MMSE) for the detection of dementia in clinically unevaluated people aged 65 and over in community and primary care populations. Cochrane Database Syst Rev, CD011145. |
[44] | Tombaugh TN , McIntyre NJ ((1992) ) The mini-mental state examination: A comprehensive review. J Am Geriatr Soc 40: , 922–935. |
[45] | Jessen F , Wolfsgruber S , Wiese B , Bickel H , Mosch E , Kaduszkiewicz H , Pentzek M , Riedel-Heller SG , Luck T , Fuchs A , Weyerer S , Werle J , van den Bussche H , Scherer M , Maier W , Wagner M ((2014) ) AD dementia risk in late MCI, in early MCI, and in subjective memory impairment. Alzheimers Dement 10: , 76–83. |
[46] | Lynoe N , Sandlund M , Dahlqvist G , Jacobsson L ((1991) ) Informed consent: Study of quality of information given to participants in a clinical trial. BMJ 303: , 610–613. |
[47] | Patenaude B , Smith SM , Kennedy DN , Jenkinson M ((2011) ) A Bayesian model of shape and appearance for subcortical brain segmentation. Neuroimage 56: , 907–922. |
[48] | Hafkemeijer A , Altmann-Schneider I , de Craen AJ , Slagboom PE , van der Grond J , Rombouts SA ((2014) ) Associations between age and gray matter volume in anatomical brain networks in middle-aged to older adults. Aging Cell 13: , 1068–1074. |
[49] | Andersson JLRJ , Jenkinson M , Smith S ((2010) ) TR07JA2: Non-linear registration, aka Spatial normalisation. FMRIB technical report TR07JA2. http://www.fmrib.ox.ac.uk/datasets/techrep/tr07ja2/tr07ja2.pdf |
[50] | Jenkinson M , Smith S ((2001) ) A global optimisation method for robust affine registration of brain images. Med Image Anal 5: , 143–156. |
[51] | Klarenbeek P , van Oostenbrugge RJ , Rouhl RP , Knottnerus IL , Staals J ((2013) ) Ambulatory blood pressure in patients with lacunar stroke: Association with total MRI burden of cerebral small vessel disease. Stroke 44: , 2995–2999. |
[52] | Greenberg SM , Vernooij MW , Cordonnier C , Viswanathan A , Al-Shahi SR , Warach S , Launer LJ , van Buchem MA , Breteler MM ((2009) ) Cerebral microbleeds: A guide to detection and interpretation. Lancet Neurol 8: , 165–174. |
[53] | Garcia-Ptacek S , Cavallin L , Kareholt I , Kramberger MG , Winblad B , Jelic V , Eriksdotter M ((2014) ) Subjective cognitive impairment subjects in our clinical practice. Dement Geriatr Cogn Dis Extra 4: , 419–430. |
[54] | Wechsler DA ((1945) ) A standardized memory scale for clinical use. J Psychol 19: , 87–95. |
[55] | Rey A ((1964) )L'examen clinique en psychologie. Clinical tests in psychology. |
[56] | Lezak MD ((1995) ) Neuropsychological assessment. Oxford University Press, Oxford. |
[57] | Wechsler D ((1997) ) Wechsler Adult Intelligence Scale-Third Edition. The Psychological Corporation Limited, London. |
[58] | Stroop JR ((1935) ) Studies of interference in serial verbal reactions. J Exp Psychol 18: , 643–662. |
[59] | Reitan RM ((1958) ) Validity of the Trail Making Test as an indication of organic brain damage. Percept Mot Skills 8: , 271–276. |
[60] | Wechsler D ((2011) ) Wechsler Abbreviated Scale of Intelligence -Second Edition. Pearson, San Antonio, TX. |
[61] | Gilewski MJ , Zelinski EM , Schaie KW ((1990) ) The Memory Functioning Questionnaire for assessment of memory complaints in adulthood and old age. Psychol Aging 5: , 482–490. |
[62] | Yesavage JA , Brink TL , Rose TL , Lum O , Huang V , Adey M , Leirer VO ((1982) ) Development and validation of a geriatric depression screening scale: A preliminary report. J Psychiatr Res 17: , 37–49. |
[63] | Beck AT , Steer RA , Brown GK ((1996) ) Beck Depression Inventory-II. Psychological Corporation, San Antonio, TX. |
[64] | John OP , Donahue EM , Kentle RL ((1991) ) The Big Five Inventory- Versions 4a and 54., Berkeley, Institute of Personality and Social Research. University of California, Berkeley. |
[65] | Oldfield RC ((1971) ) The assessment and analysis of hand-edness: The Edinburgh inventory. Neuropsychologia 9: , 97–113. |
[66] | Hertzog C , Hultsch DF , Dixon RA ((1989) ) Evidence for the convergent validity of two self-report metamemory questionnaires. Dev Psychol 25: , 687–700. |
[67] | Schmand B , Jonker C , Geerlings MI , Lindeboom J ((1997) ) Subjective memory complaints in the elderly: Depressive symptoms and future dementia. Br J Psychiatry 171: , 373–376. |
[68] | Comijs HC , Deeg DJ , Dik MG , Twisk JW , Jonker C ((2002) ) Memory complaints; the association with psycho-affective and health problems and the role of personality characteristics. A 6-year follow-up study. J Affect Disord 72: , 157–165. |
[69] | Ponds RWHM , Jolles, J ((1996) ) Memory complaints in elderly people: The role of memory abilities, metamemory, depression, and personality. Educ Gerontol 22: , 341–357. |
[70] | Landis JR , Koch GG ((1977) ) The measurement of observer agreement for categorical data. Biometrics 33: , 159–174. |
[71] | Wenger E , Martensson J , Noack H , Bodammer NC , Kuhn S , Schaefer S , Heinze HJ , Duzel E , Backman L , Lin-denberger U , Lovden M ((2014) ) Comparing manual and automatic segmentation of hippocampal volumes: Reliability and validity issues in younger and older brains. Hum Brain Mapp 35: , 4236–4248. |
[72] | Huntley JD , Howard RJ ((2010) ) Working memory in early Alzheimer’s disease: A neuropsychological review. Int J Geriatr Psychiatry 25: , 121–132. |
[73] | Farrer LA , Cupples LA , Haines JL , Hyman B , Kukull WA , Mayeux R , Myers RH , Pericak-Vance MA , Risch N , van Duijn CM ((1997) ) Effects of age, sex, and ethnicity on the association between apolipoprotein E genotype and Alzheimer disease. A meta-analysis. APOE and Alzheimer Disease Meta Analysis Consortium. JAMA 278: , 1349–1356. |


