
Can 11C-PiB-PET Relative Delivery R1 or 11C-PiB-PET Perfusion Replace 18F-FDG-PET in the Assessment of Brain Neurodegeneration?
Abstract
Background:
Pittsburgh Compound B (PiB) positron emission tomography (PET) is used to visualize in vivo amyloid plaques in the brain. Frequently the PiB examinations are complemented with a fluorodeoxyglucose (FDG) PET scan to further assess neurodegeneration.
Objective:
Our goal is to identify alternative correlates of FDG images by assessing which kinetic methods originate PiB derived relative delivery ratio (R1) images that can be correlated with the FDG images, and to compare them with PiB perfusion (pPiB) images obtained from the early-phase of PiB acquisition.
Methods:
We selected 52 patients with cognitive impairment who underwent a dynamic PiB and FDG acquisitions. To compute the R1 images, two simplified reference tissue models (SRTM and SRTM2) and two multi-linear reference tissue models (MRTM and MRTM2) were used. The pPiB images were obtained in two different time intervals.
Results:
All six types of images were of good quality and highly correlated with the FDG images (mean voxelwise within-subjects r > 0.92). The higher correlation was found for FDG-R1(MRTM). Regarding the voxelwise regional correlation, the higher mean all brain correlations was r = 0.825 for FDG-R1(MRTM) and statistically significant in the whole brain analysis.
Conclusion:
All R1 and pPiB images here tested have potential to assess the metabolic impact of neurodegeneration almost as reliably as the FDG images. However, this is not enough to validate these images for a single-subject analysis compared with the FDG image, and thus they cannot yet be used clinically to replace the FDG image before such evaluation.
INTRODUCTION
Positron emission tomography (PET) imaging with Pittsburgh Compound B (PiB) labeled with 11C tracer has been increasingly used in many nuclear medicine centers to visualize in vivo amyloid plaques in the brain, which is a core molecular imaging feature of Alzheimer’s disease (AD) [1]. However, the presence of high levels of amyloid plaques in the brain does not directly imply concurrent neural degeneration. Thus, regional cerebral blood flow (rCBF) and regional cerebral glucose metabolism have been extensively used as indirect biomarkers of synaptic dysfunction and neurodegeneration. Previous studies have shown a tight coupling between rCBF and regional glucose metabolism [2]. This last one has frequently been assessed with fluorodeoxyglucose (FDG) labeled with 18F for PET systems.
Frequently, patients with cognitive impairments for whom a differential diagnosis is difficult to provide are requested to undergo double PET imaging: PiB (or other available amyloid tracer, as florbetaben or florbetapir) and FDG, to help solve such diagnostic difficulties. However, this has the potential drawback of cost and radiation exposure increase. Complementary surrogate measures that avoid these problems are therefore worth being investigated. As a possible alternative, if a dynamic PiB PET acquisition is performed, beyond the parametric binding potential (BPND) image, the relative regional cerebral blood flow
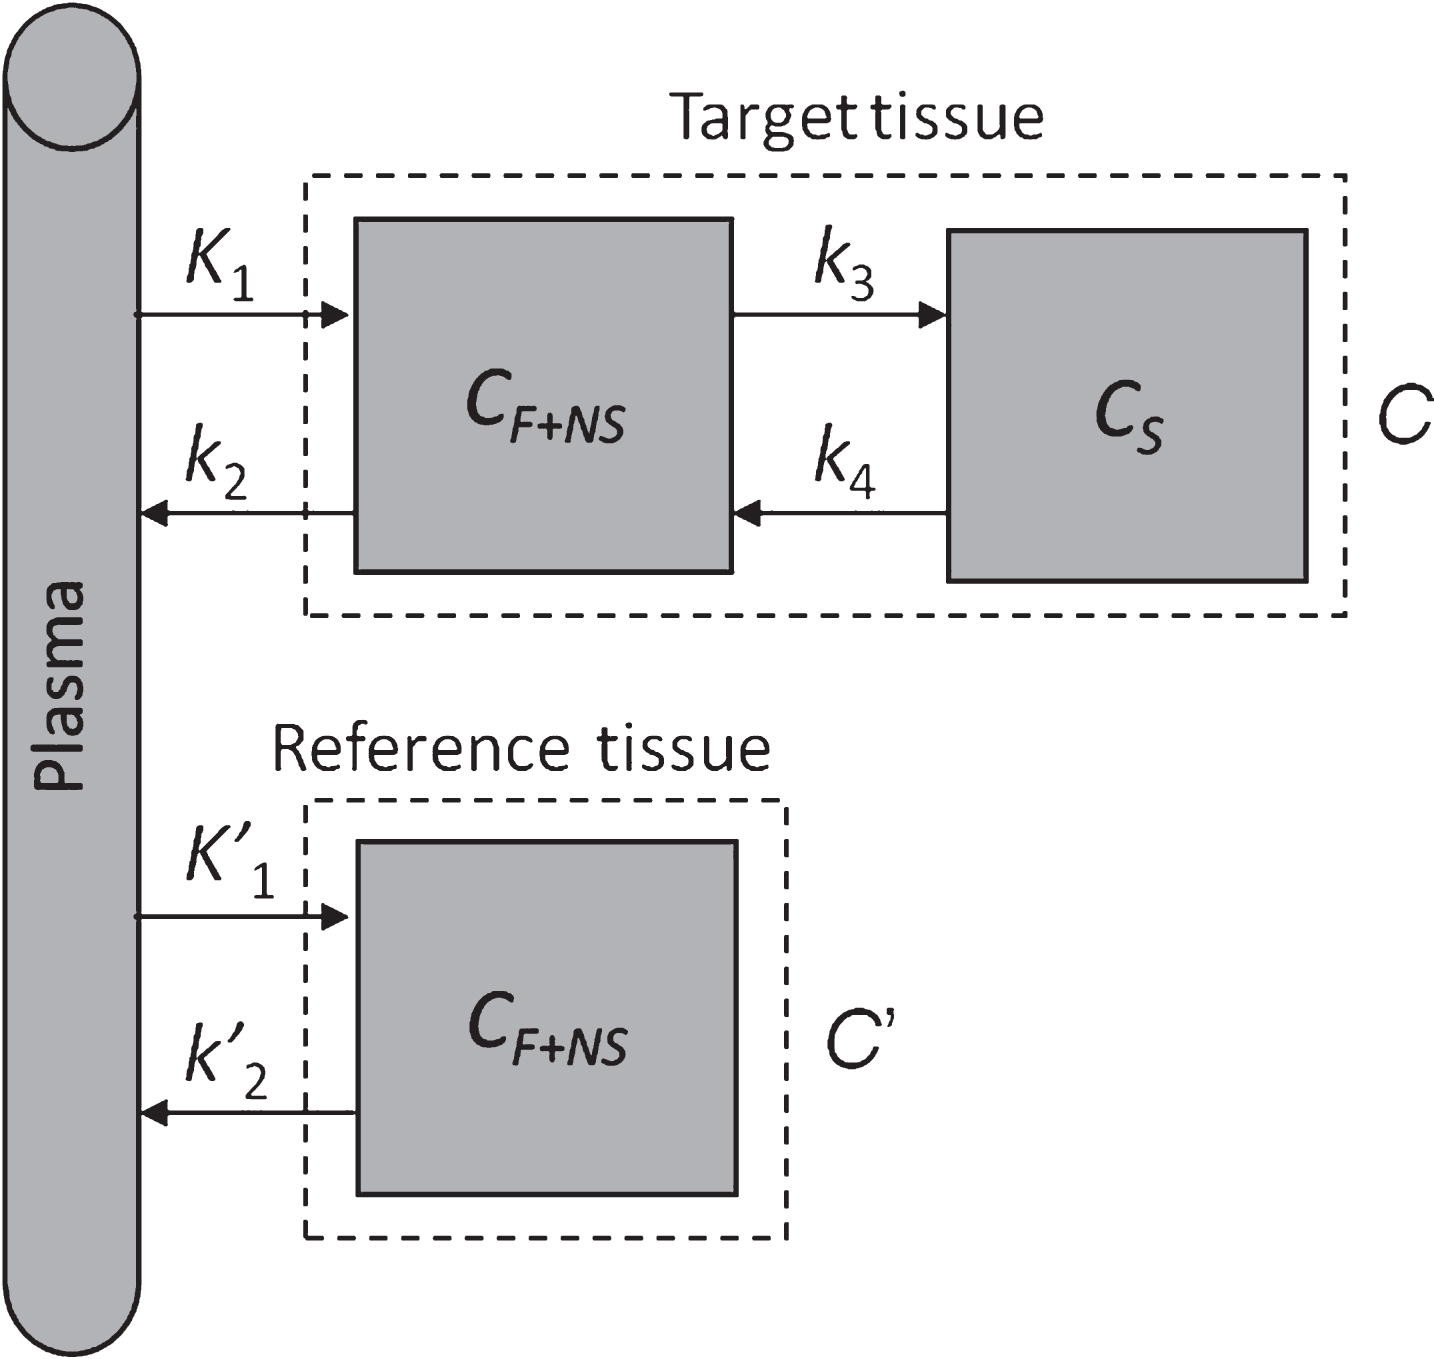
Fig. 1
Two-tissue compartment model with reference region. CF+NS is the concentration due to free and nonspecific binding, CS is the concentration due to specific binding.
A previous study has suggested that there is a significant correlation between the FDG images and the R1 images [3]. Two other studies also have found a significant correlation between the FDG and the PiB perfusion (pPiB) images [4, 5]. In addition, Chen and colleagues [6] showed that the relative delivery ratio R1 of PiB is highly correlated with relative rCBF measured by 15O-water normalized to cerebellum. Other research groups have focused on these issues using other available markers of amyloid plaques. For instance, Daerr et al. [7] showed a good correlation of early acquisitions of [18F]-florbetaben (FBB) PET with FDG PET [7], and Lin et al. [8] showed that Mini-Mental State Examination (MMSE) scores are significantly associated with the degree of perfusion impairment as assessed by early phase of 18F-AV-45 PET on a dataset of patients with AD, mild cognitive impairment (MCI), and healthy controls (HC).
Our main goal is to assess which is the best solution to obtain an image from the PiB PET acquisitioncomparable with the FDG PET image, and thus to provide a proxy measure of synaptic dysfunction and neurodegeneration. We considered four models to obtain the R1 images and two time periods to obtain the pPiB images. For the R1 images, we used the simplified reference tissue model (SRTM), the multi-linear reference tissue model (MRTM), the SRTM with fixed
MATERIALS AND METHODS
Patients
A total of 52 patients who underwent 11C-PiB PET and 18F-FDG PET examinations were included in this study. We included all patients from Institute of Nuclear Science Applied to Health (ICNAS, University of Coimbra), except patients with head movements during the acquisitions above the scanner resolution. All patients gave written informed consent, as approved by the Ethics committee of the University of Coimbra. Demographic and clinical information are summarized in Table 1. The criteria for the diagnosis of the neurodegenerative disorders were: probable AD dementia according to NINCDS-ADRDA criteria [11], MCI due to AD following the NINCDS-ADRDA criteria [12], primary progressive aphasia according to the recommendations of Gorno-Tempini and colleagues [13], and the behavioral variant of frontotemporal dementia (FTD) according to the criteria of the International Behavioural Variant FTD Criteria Consortium [14].
Table 1
Synthesis of clinical and demographic data of the patients
| Subjects | Number of | Age | Amyloid burden |
|---|---|---|---|
| patients (M/F) | (mean±SD) | negative / low / high | |
| AD | 20 (6/14) | 68±6 | 1 / 0 / 19 |
| MCI | 19 (8/11) | 69±7 | 6 / 7 / 6 |
| PPA | 5 (3/2) | 66±7 | 2 / 0 / 3 |
| FTD | 4 (1/3) | 72±10 | 3 / 1 / 0 |
| Other | 4 (1/3) | 54±10 | 4 / 0 / 0 |
| Total | 52 (19/33) | 67±8 | 16 / 8 / 28 |
We also categorized PiB-PET images in three groups— amyloid negative, amyloid borderline/low burden, and high amyloid deposition—following our local classifier based on support vector machines (SVM), which uses the voxelwise brain grey matter standardized uptake value ratio (SUVR) computed from the PiB-PET images, and using the cerebellar grey matter as reference region.
PET acquisitions
All 11C-PIB PET and 18F-FDG PET acquisitions were performed in the same scanner (Philips PET/CT Gemini GXL), preceded by a low-dose brain CT acquisition for attenuation correction. Except for one patient, both scans were acquired on the same day (18F-FDG was injected approximately 2 h after 11C-PiB injection). For each acquisition, the patient’s head was restrained with a soft elastic tape. All patients fasted for at least 6 h before 18F-FDG injection.
The 11C-PiB PET acquisitions were dynamic, lasted for 90 min (37 frames: 4×15 s + 8×30 s + 9×60 s + 2×180 s + 14×300 s) and started immediately after the intravenous bolus injection of approximately 555 MBq of 11C-PiB. The 18F-FDG PET acquisitions were static, started approximately 30 min after the intravenous bolus injection of approximately 185 MBq of 18F-FDG and lasted for 30 min.
Both acquisitions were reconstructed using the LOR RAMLA algorithm (Philips PET/CT Gemini GXL) with attenuation and scatter correction. In both cases, an isotropic voxel size of 2 mm was defined.
Quantification of pPiB images and relative delivery ratio R1 parametric images
Voxelwise pPiB(0– 6 min) and pPiB(1– 8 min) images were computed by cumulatively adding the frames in the time periods between 0 and 6 min and between 1 and 8 min after injection, respectively. These time intervals where chosen since they were found optimal in previous works.
Four different approaches were used for quantification of relative delivery ratio R1: MRTM, SRTM, MRTM2 and SRTM2. For all four methods, the cerebellar grey matter was used as reference region. This choice is based on the work of Thal et al. [15] where the authors showed that there is no amyloid deposition in the cerebellar grey matter before the phase 5 (advanced cases) and even in this phase the deposition is very small. This was confirmed using PiB PET by Klunk et al. [16].
SRTM and SRTM2
We implemented the SRTM [17] method using basis functions [18], since this solution is more stable than non-linear least squares method at the voxel level. The simplified operational equation is
The SRTM2 is based on SRTM but implemented in two steps [19]. In the first one, the SRTM is applied to compute the BPND, R1 and k2 at the voxel level [18]. Then, is derived as. Since should be the same for all brain voxels, it is estimated by computing the median of all obtained. Then, in the second step, it is fixed and the equation is rearranged, with only two parameters remaining to be optimized [19]. As for the SRTM, we implemented SRTM2 using basis functions and the same range of values for θ3. Since estimation is very sensitive to noise when computed at the voxel level, to compute it in the first step we have resampled the original dynamic images with voxels of 8×8×8 mm3 and only considered the values of when 0 < BPND < 3, k2> 0 and R1 > 0.
MRTM and MRTM2
The MRTM implemented is based on the following multi-linear reference tissue model equation [20]:
MRTM2 is a two-step implementation of the MRTM [20]. In the first step, the median of
Implementation of algorithms
For the computation of the R1 and pPiB images, in the initial step a sum image was built using all frames and then the sum image was registered to the Montreal Neurological Institute (MNI) space using in-house made software using a deformable model based on cubic B-splines and a PiB sum image template as reference image. Next, all frames of the dynamic image were also registered using the same geometric transformation. Image registration algorithms were implemented using the Insight Toolkit (ITK) software library, version 3.20, and based on the optimization of the mutual information similarity measure [21]. Parameter optimization was done using the Vision Numerics Library (VNL) available in the ITK [21]. The sum PiB template is in the MNI space and was built in our institution using a set of normal PiB scans and with the help of the MRI of the subjects.
18F-FDG image processing
The 18F-FDG images were first rigidly registered with the correspondent R1(MRTM) image and then registered to the MNI space using the transformation found when the respective 11C-PiB images were registered to the MNI space.
Statistics
Intensity normalization
The pPiB, R1 and 18F-FDG registered images were smoothed with a Gaussian kernel with 8 mm full width at half maximum and then intensity normalized. The intensity normalization was done independently per each image by dividing each voxel value by the mean brain values of the respective image. The brain voxels were defined based on the MNI template.
Within-subjects correlation
For each subject, the mean Pearson correlation coefficients between the pairs FDG-pPiB(0– 6 min), FDG-pPiB(1– 8 min), FDG-R1(MRTM), FDG-R1(MRTM2), FDG-R1(SRTM), and FDG-R1(SRTM2) were computed. For each FDG image, all brain voxels were correlated with the correspondent voxels of the pPiB or R1 image, yielding a correlation coefficient per pair of images per subject. Comparison of correlations was performed using repeated measures ANOVA.
To assess differences of the correlation among the amyloid burden groups (negative, low and high) the Kruskal-Wallis test was used. ANOVA and Kruskal-Wallis test were performed using the Statistical Package for the Social Sciences (SPSS, v20).
Voxelwise regional correlation
Since variations of cerebral blood flow and glucose metabolism coupling are not homogeneous across all brain regions [22], we assessed the regional correlation at voxel level. Per each voxel location, we computed the correlation between the group of the FDG images against the groups of pPiB or R1 images. Thus, we obtained the whole-brain correlation distribution.
Correlation significance was assessed per each voxel using Benjamini-Hochberg false discovery rate (FDR) correction for multiple comparisons with α= 0.05. Differences in the mean whole brain voxelwise correlation were assessed using ANOVA.
RESULTS
Within-subjects correlation
Results of the Pearson linear correlation coefficient between FDG, R1 and pPiB images are shown in Fig. 2. Mean±standard deviation values were 0.929±0.016, 0.924±0.020, 0.936±0.015, 0.933±0.016, 0.933±0.016, and 0.932±0.018, for the correlations FDG-R1(SRTM), FDG-R1(SRTM2), FDG-R1(MRTM), FDG-R1(MRTM2), FDG-pPiB(0– 6 min), and FDG-pPiB(1– 8 min), respectively. This means that the R1 and pPiB images can explain about 85% of the content of the FDG images. Figure 3 shows two examples of the FDG, pPiB(1– 8 min), and R1(MRTM) images of two patients where it is easy to visually identify asymmetric uptake, which very likely indicates hypometabolism in region with lower FDG, R1 and pPiB values.
Fig. 2
Boxplot graph comparing the within subjects correlation coefficient between the FDG images and the R1(SRTM), R1(SRTM2), R1(MRTM), R1(MRTM2), pPiB(0– 6min) and pPiB(1– 8min) images.
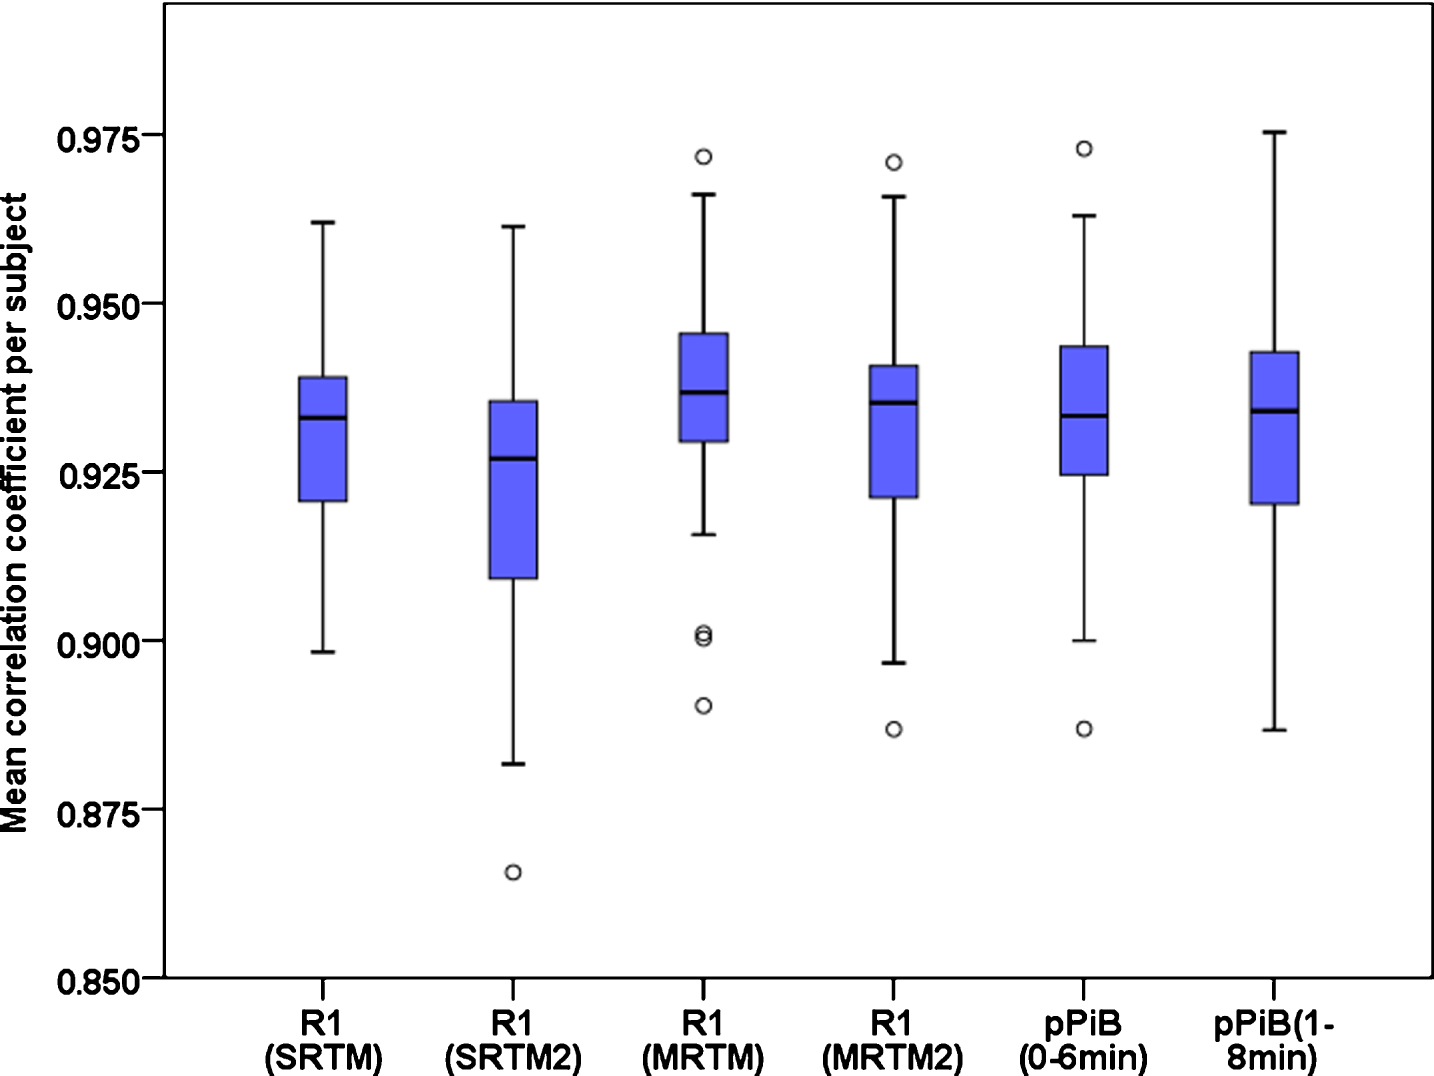
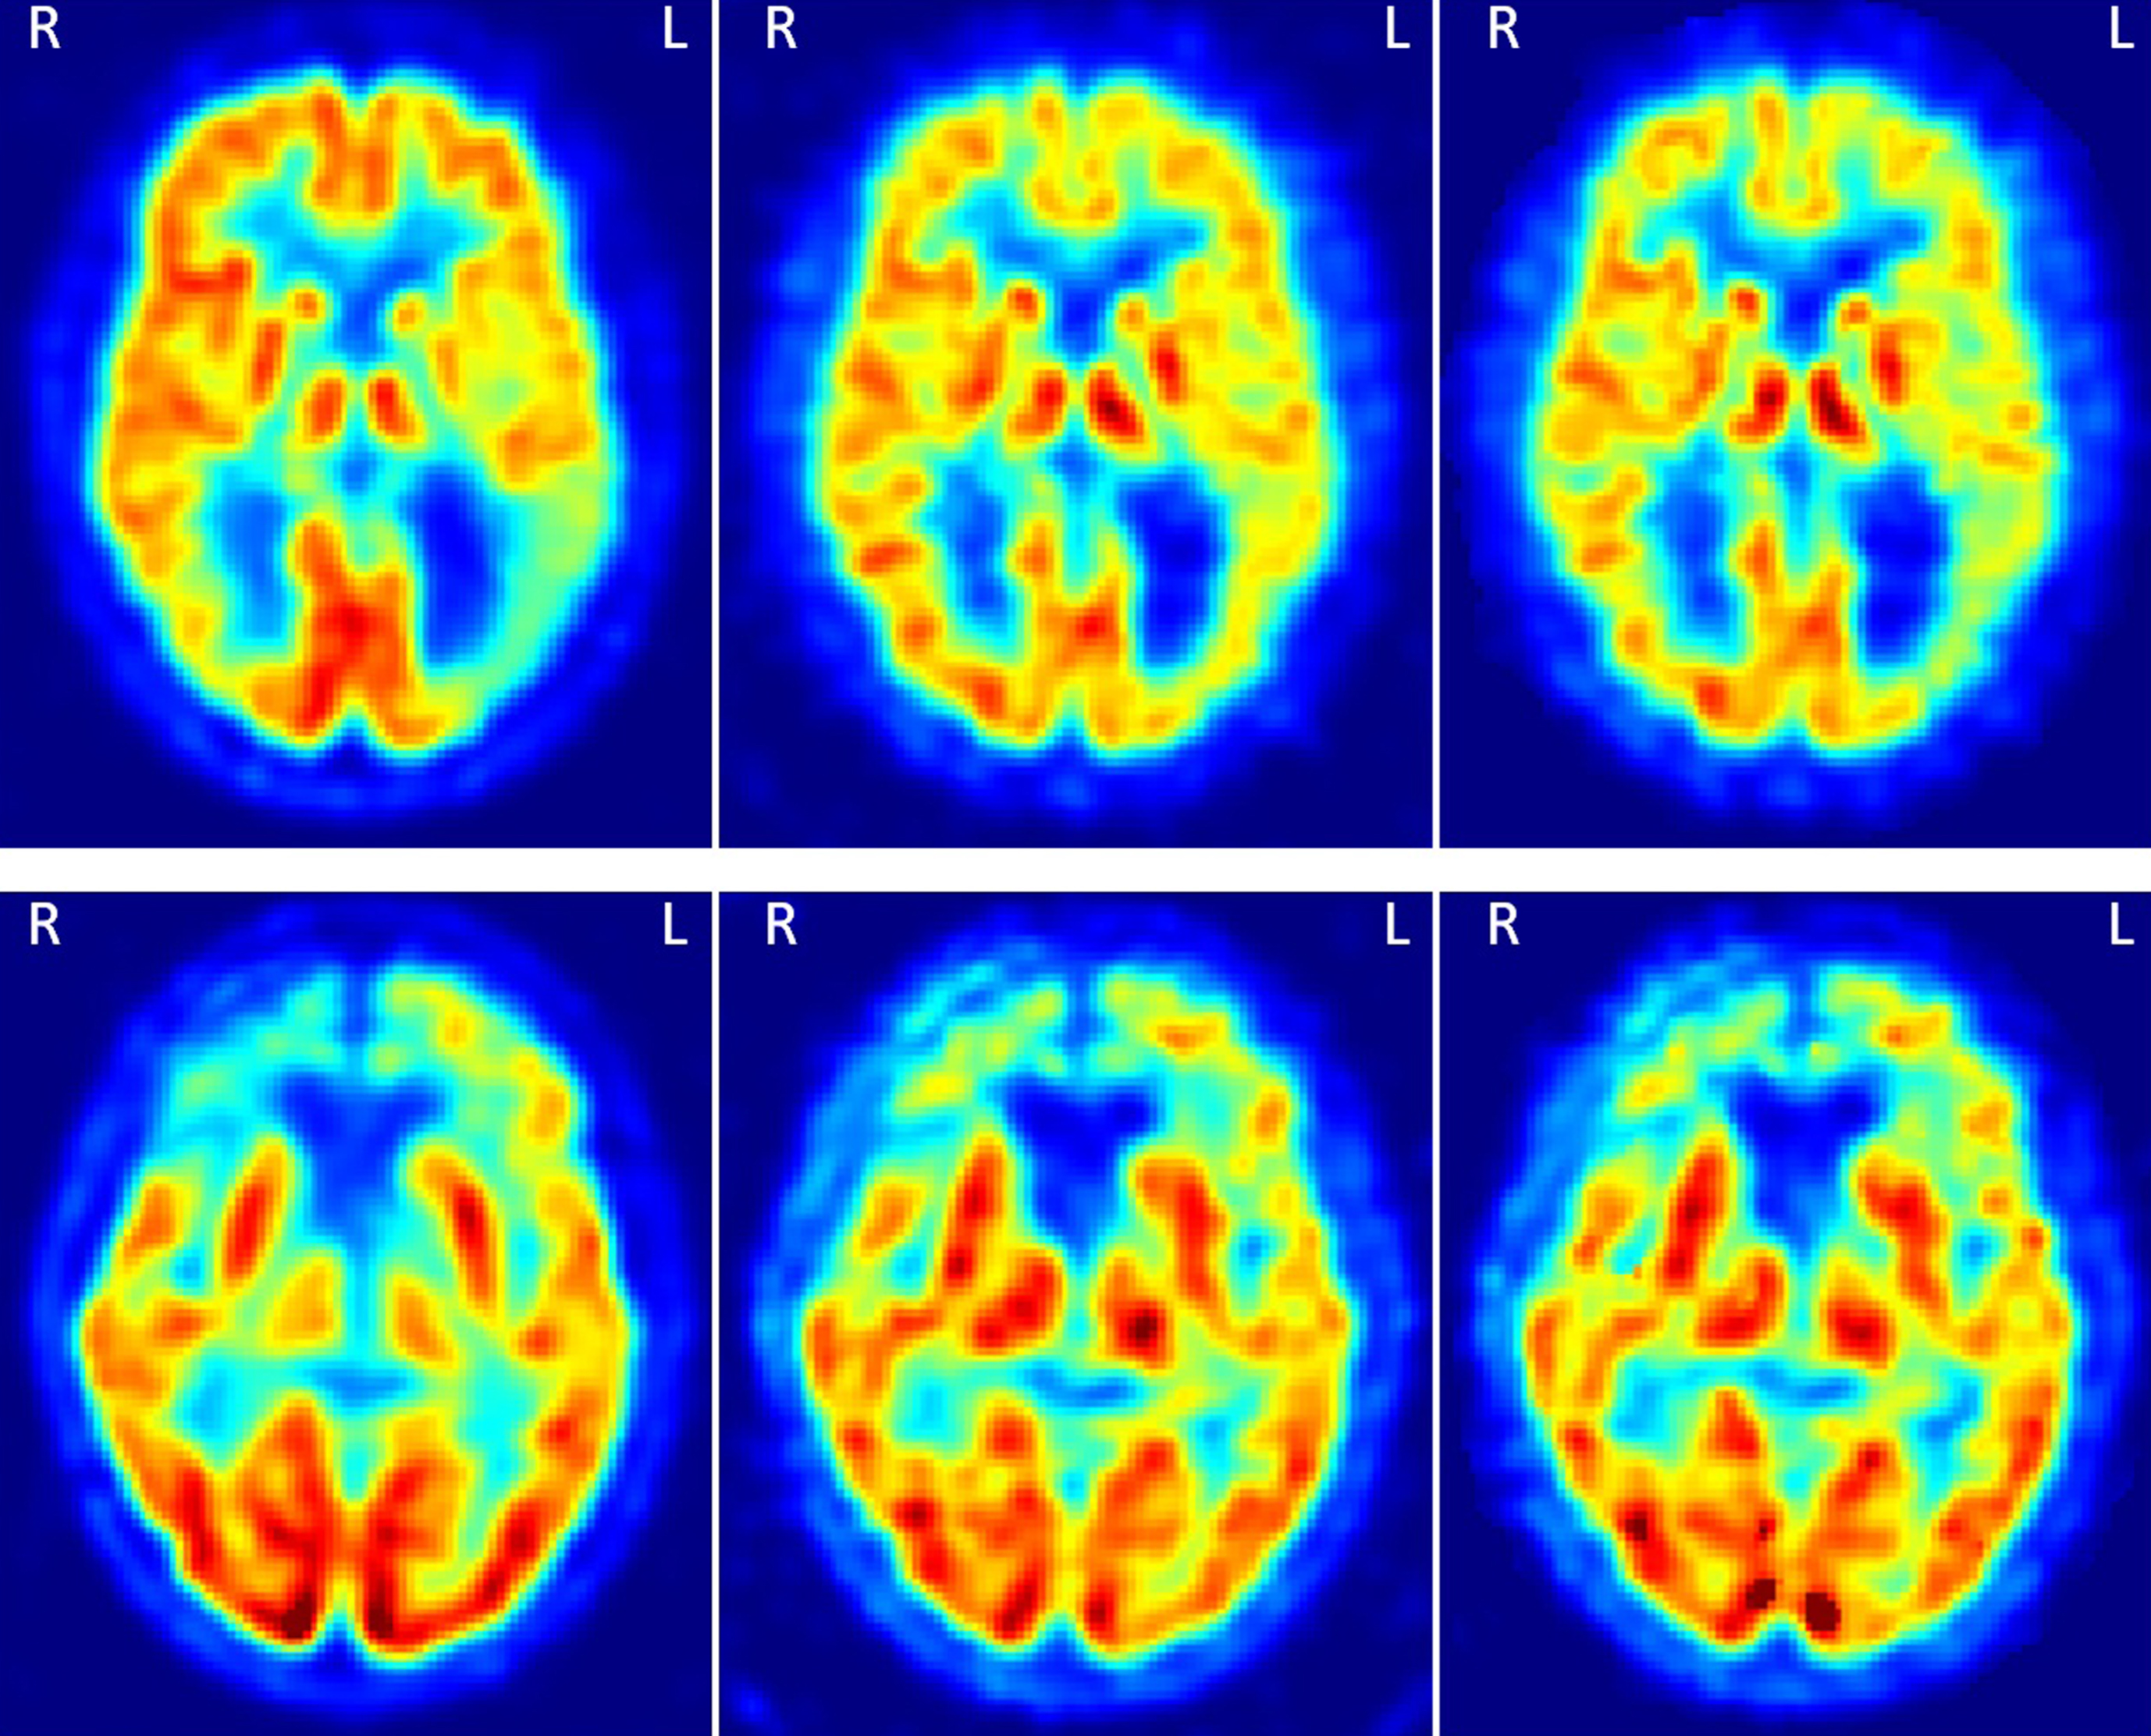
Fig. 3
Two examples of the FDG, pPiB(1– 8min), and R1(MRTM) images, respectively from the left to the right. The images on the top are from a patient with AD, and on the bottom from a patient with FTD. In the top there is an asymmetric uptake in the parietal cortex and on the bottom an asymmetric uptake in the frontal cortex. These patterns can be seen in the three types of images.
Repeated measures ANOVA with Greenhouse-Geisser correction shows that there is a statistically significant difference (F = 23.359, p < 0.001) among the correlation coefficients. Based on post hoc paired t-test with Bonferroni correction for multiple comparisons, it was observed that the correlation between the FDG and R1(MRTM) images is significantly higher (p < 0.004) than the other correlations. Although statistically significant differences have been found among the mean computed correlations, the differences are low and with likely irrelevant biologically significance (lesser than 0.012).
There is not a statistically significant difference in the correlation between groups of patients, amyloid positive, amyloid doubtful or amyloid negative, per any type of images (Kruskal-Wallis test, p≥0.180), suggesting that their biological correlates remain the same across groups.
Voxelwise regional correlation
A summary of the results for all brain voxels Pearson correlation coefficients is shown in Table 2. Voxelwise correlations between FDG and R1 or pPiB were statistically significant in all brain voxels, except for the R1(SRTM2) where it was nevertheless significant in more than 99.9% of the brain voxels. There is a statistically significant difference among the mean voxelwise whole-brain magnitude of correlations between the six types of images; however the difference of the mean is very low (maximum difference of the mean is 0.023). As can be seen in Table 2, the median of the Pearson correlation coefficient is higher than 0.81, which means the correlation is strong or very strong in most of the brain voxels, irrespective of the particular model, suggesting that this proxy-based approach is relatively model independent.
Table 2
Voxelwise regional Pearson correlation coefficient between the FDG and R1 or pPiB images
| Images | Median | Mean±SD | Range (min - max) |
|---|---|---|---|
| R1(SRTM) | 0.826 | 0.809±0.093 | 0.247– 0.972 |
| R1(SRTM2) | 0.819 | 0.802±0.097 | 0.194– 0.977 |
| R1(MRTM) | 0.841 | 0.825±0.090 | 0.345– 0.981 |
| R1(MRTM2) | 0.838 | 0.820±0.094 | 0.267– 0.980 |
| pPiB(0– 6min) | 0.827 | 0.809±0.097 | 0.276– 0.984 |
| pPiB(1– 8min) | 0.838 | 0.817±0.097 | 0.285– 0.981 |
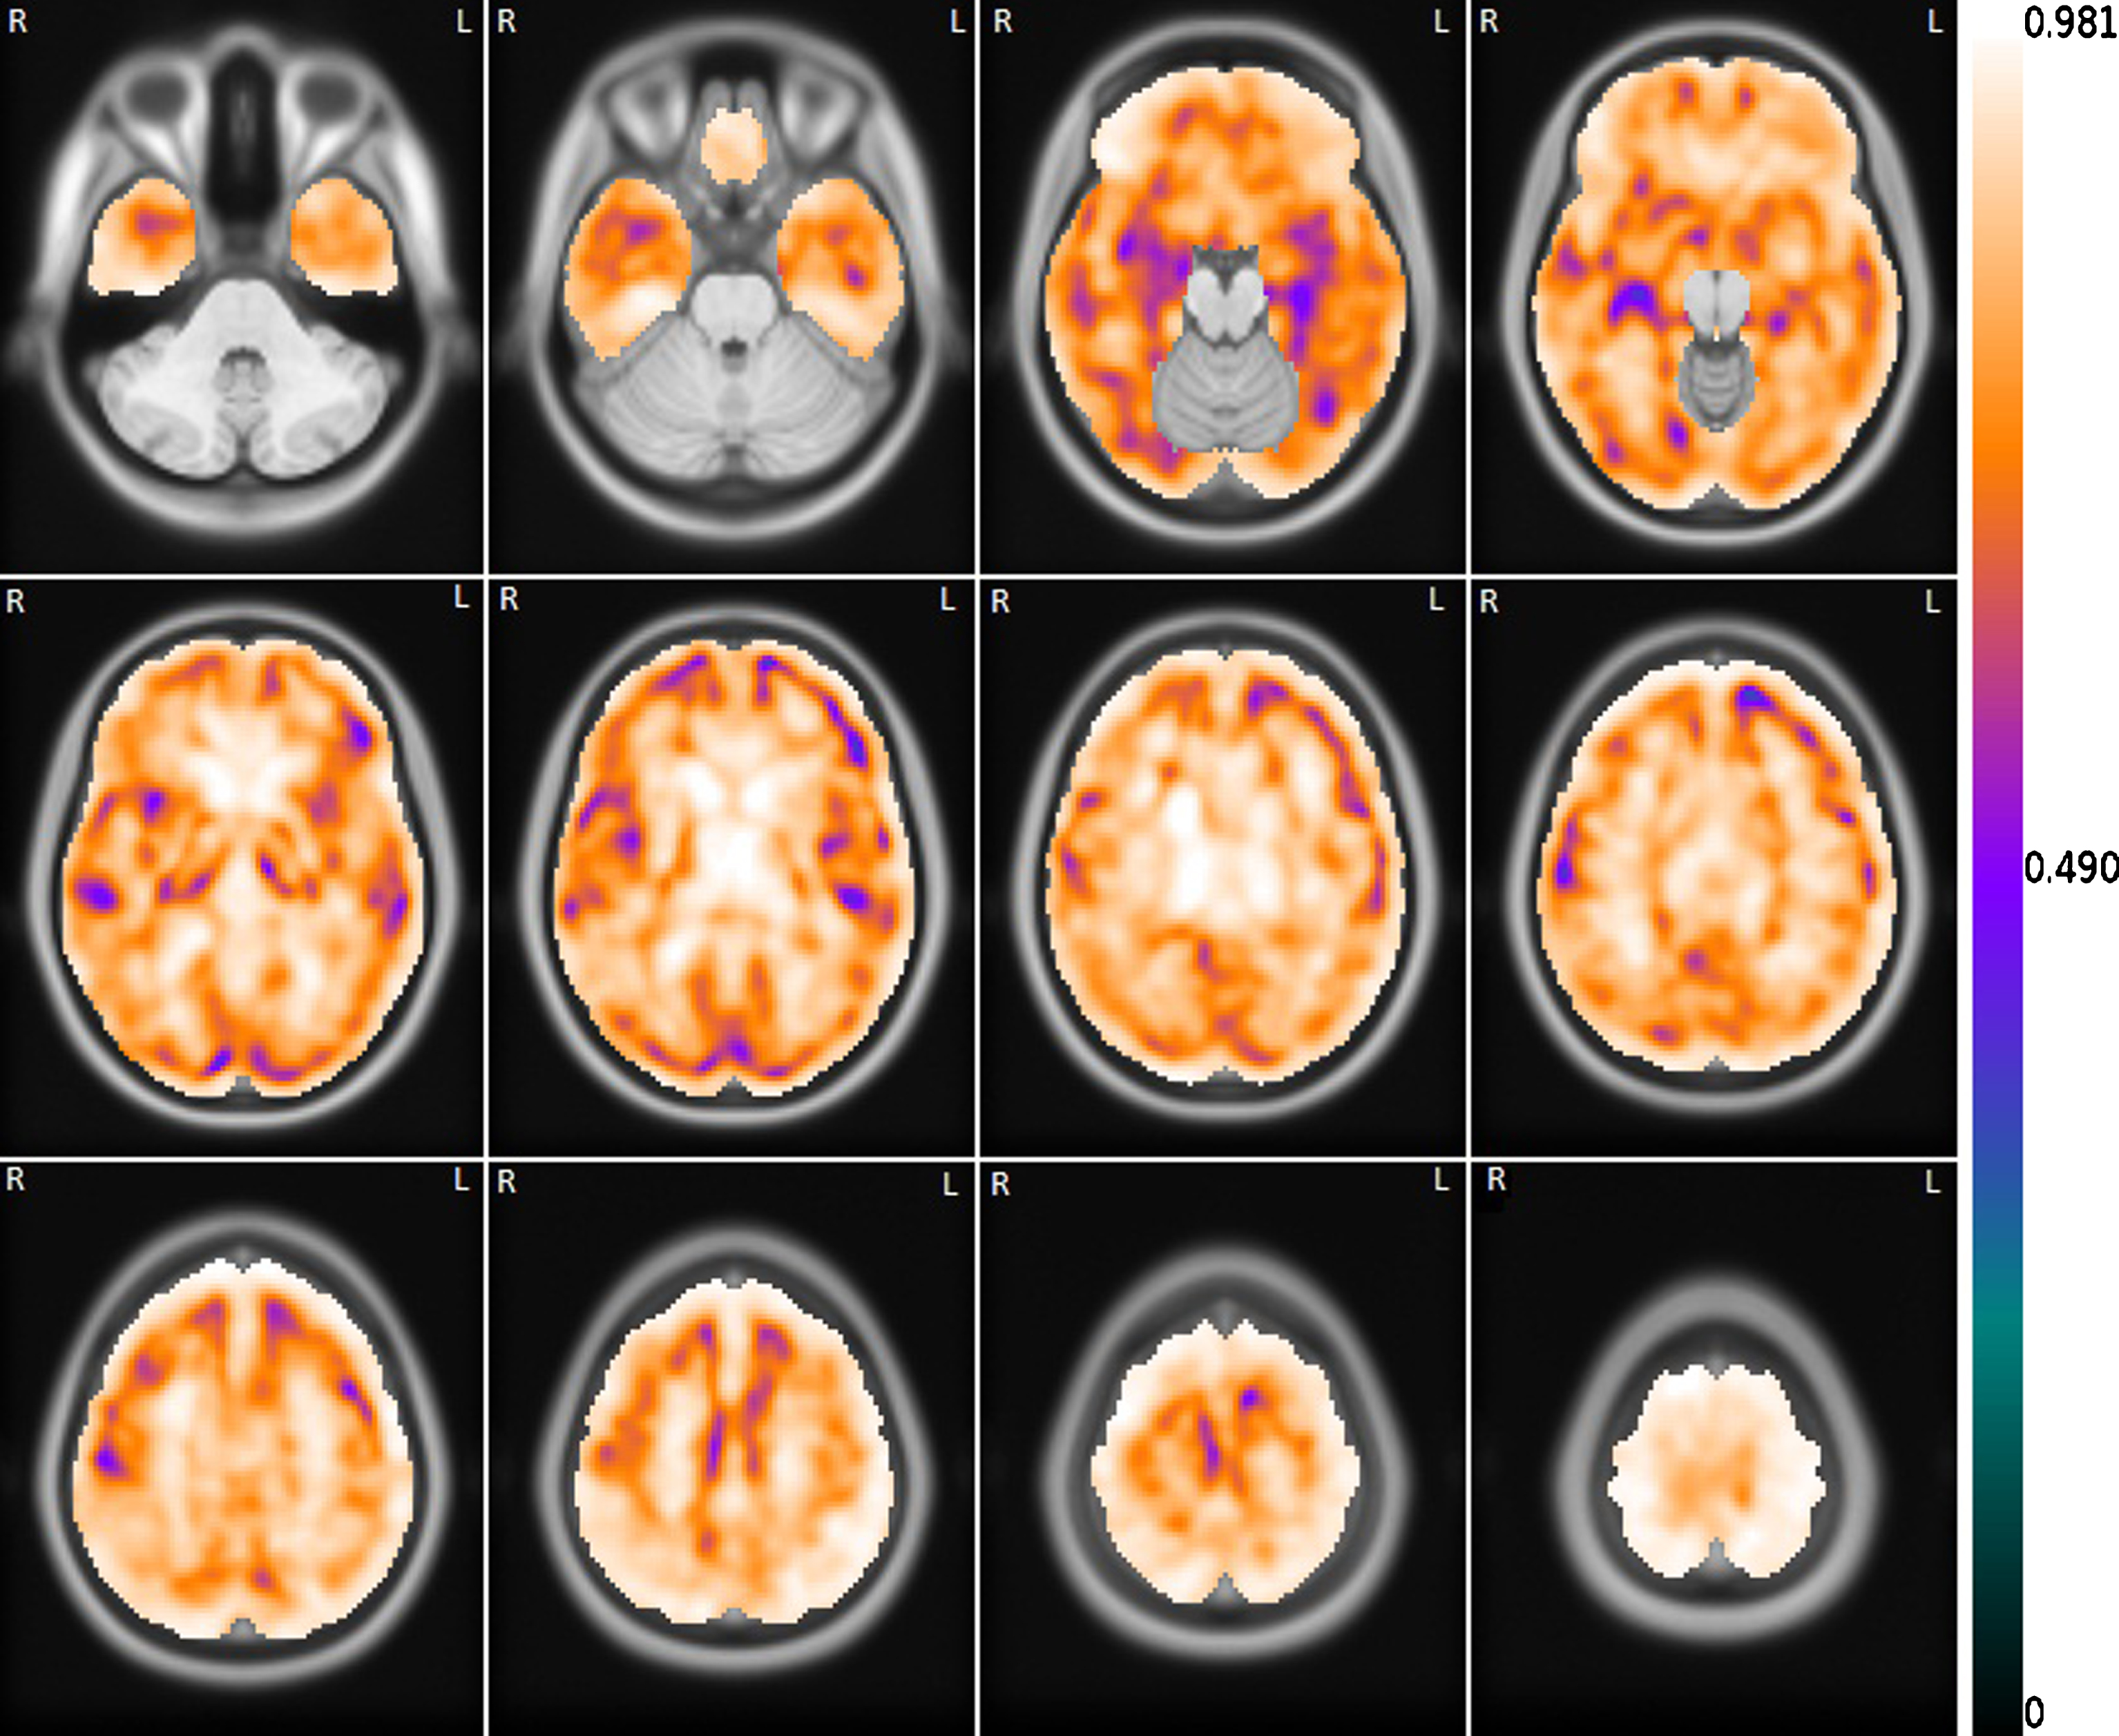
Figure 4 shows the voxelwise correlation between the FDG images and the correspondent set of R1(MRTM) images. As can be seen, the correlation is strong or very strong (r ≥ 0.7) in most of the brain. The regions where the correlation is not as robust are mainly in the transition between the grey and white matter. The distributions of the brain correlation between the FDG and the other R1 or pPiB images are similar.
Fig. 4
Mean voxelwise correlation between the set of FDG images and the correspondent set of R1(MRTM) images. The correlation image is overlapping the template MRI image.
DISCUSSION
In this work we performed a voxelwise analysis of the correlation between the FDG-PET images with the R1 or pPiB images computed from PiB-PET dynamic acquisitions. Results show a very high (r > 0.9) mean within-subject Pearson correlation coefficient of the FDG images with the pPiB and R1 images. A significantly higher correlation was found for the FDG-R1(MRTM) against the correlation of the other pairs, however the difference had a very small effect size, and is therefore of likely irrelevant biological significance.
A previous study, Meyer et al. [3], also studied the correlation between R1-PiB and FDG images, but using only the SRTM2 kinetic model and a small dataset of 22 patients, while we tested four kinetic models for the computation of the R1 and used a dataset of 52 patients. Moreover, we further computed the correlation between the FDG and pPiB images using two time intervals and compared them with the correlation obtained between the R1 and FDG images. They found a slightly inferior within-subject correlation of approximately r = 0.79 between the FDG and R1 generated by the SRTM2 [19], using a similar protocol acquisition. We think there are two main reasons that may explain our superior results. First, different datasets were used; second, the implementation of the algorithms, both the kinetic models and the image processing. As in Meyer et al. [3], we did not find a statistically significant difference in the correlation among groups of patients (amyloid negative versus amyloid borderline versus high amyloid deposition) for the R1 images. The same occurred for the pPiB images, suggesting that the use of these proxy measures is robust and independent of the used analysis method.
Regarding the regional voxelwise correlation of the FDG images with the pPiB and R1 images, a high median voxelwise correlation correlation was found for the six types of images (r≥0.82). The regions with lesser correlation are mostly in the border between the grey and white matter. We think this can be partially explained by the image registration imperfections, since the uptake difference is higher from the grey matter to the white matter than within the grey matter or white matter.
We have opted to use the R1, pPiB and FDG images after intensity normalization since the standardized uptake value (SUV) of the FDG images are highly dependent on the several factors that are not related to the cerebral glucose metabolism, for instance, the blood glucose levels, insulin levels or anemia; and the R1 images depend on the free and non-specific binding in the cerebellar grey matter of each patient. Thus, after intensity normalization the variability of the uptake due to brain external factors is reduced, which is important for the computation of the voxelwise regional correlation. However, it is important to stress out that this normalization has no influence in the within-subject correlation, since the correlation is independent on scale factors.
In clinical practice, the R1 and pPiB images should not be normalized, neither spatially nor intensity. The spatial normalization may introduce distortions that difficult the clinical analysis and the SUV of the pPiB images may have clinical implications.
In a previous study, the SRTM2 and the MRTM2 methods were found as the best options to compute the BPND for clinical studies [23]. These two methods have shown to be less affected by noise, producing BPND images with better contrast than the images obtained from the other tested methods, and also because they provided the best accuracies in simulated studies. In our implementation, SRTM2 and MRTM2 originated BPND images with less noise than the SRTM and MRTM methods, respectively; however, the R1 images had higher level of noise.
Intriguingly, SRTM and MRTM originated better quality R1 images than their two steps version SRTM2 and MRTM2, respectively. This was not expected, since SRTM2 and MRTM2 have been used in previous studies and have originated high quality R1 and BPND images [3, 6, 23]. In fact, in our implementation, the BPND obtained using the SRTM2 and MRTM2 are of better quality than the BPND obtained using the SRTM and MRTM, however the same did not happen for the R1 parametric images.
In terms of pPiB images, our results are as expected, since they confirm previous works where a significant correlation between the FDG and the PiB perfusion (pPiB) images was found [4, 5].
We have shown that there is high whole-brain within-subject correlation between R1 or pPiB and FDG measures (Fig. 2), however this is not enough to validate the R1 or pPiB images for a single-subject analysis compared with the FDG image [24], and thus these images cannot be used clinically to replace the FDG image before such evaluation. Other limitation of this study is that we cannot ascertain that the small differences found between the normalized R1 or pPiB images and the normalized FDG images do not hide some information related with neuronal injury. In any case, the work of Lin et al. [8] showed that the MMSE scores are significantly associated with the degree of perfusion impairment, which we believe is solid evidence for the usefulness of the R1 and pPiB images.
In conclusion, the results show that both R1 and pPiB images can explain about 85% of the content of the FDG images, and thus they may be of great importance to assess the synaptic dysfunction and neurodegeneration when the FDG images are not available. The higher correlation with the FDG images was found for the R1(MRTM). However, the differences for the others R1 and pPiB images are rather small.
The pPiB images have originated results which are very close to the best R1 images and are easier to compute, with shorter acquisition time. Thus they are probably the best choice to be computed routinely in the busy nuclear medicine centers. On the other hand, in centers where the BPND images are computed for helping in the differential diagnosis, the R1 images may be the best choice, since they can be obtained simultaneously with the BPND images.
ACKNOWLEDGMENTS
This work was supported by the following grants: Strategic project FCT-UID/NEU/04539/2013 – COMPETE, POCI-01-0145-FEDER-007440, BIGDATIMAGE, CENTRO-01-0145-FEDER-000016, Centro 2020 FEDER, COMPETE, PAC – MEDPERSYST, POCI-01- 0145-FEDER-016428.
Authors’ disclosures available online (https://www.j-alz.com/manuscript-disclosures/18-0274r2).
REFERENCES
[1] | Hardy J , Selkoe DJ ((2002) ) The amyloid hypothesis of Alzheimer’s disease: Progress and problems on the road to therapeutics. Science 297: , 353–356. |
[2] | Paulson OB , Hasselbalch SG , Rostrup E , Knudsen GM , Pelligrino D ((2010) ) Cerebral blood flow response to functional activation. J Cereb Blood Flow Metab 30: , 2–14. |
[3] | Meyer PT , Hellwig S , Amtage F , Rottenburger C , Sahm U , Reuland P , Weber WA , Hüll M ((2011) ) Dual-biomarker imaging of regional cerebral amyloid load and neuronal activity in dementia with PET and 11C-labeled Pittsburgh compound B. J Nucl Med 52: , 393–400. |
[4] | Rostomian AH , Madison C , Rabinovici GD , Jagust WJ ((2011) ) Early 11C-PIB frames and 18F-FDG PET measures are comparable: A study validated in a cohort of AD and FTLD patients. J Nucl Med 52: , 173–179. |
[5] | Rodriguez-Vieitez E , Carter SF , Chiotis K , Saint-Aubert L , Leuzy A , Schöll M , Almkvist O , Wall A , Långström B , Nordberg A ((2016) ) Comparison of early-phase 11C-Deuterium-L-Deprenyl and 11C-PiB PET for assessing brain perfusion in Alzheimer’s disease. J Nucl Med 57: , 1071–1077. |
[6] | Chen YJ , Rosario BL , Mowrey W , Laymon CM , Lu X , Lopez OL , Klunk WE , Lopresti BJ , Mathis CA , Price JC ((2015) ) Relative 11C-PiB delivery as a proxy of relative CBF: Quantitative evaluation using single-session 15O-water and 11C-PiB PET. J Nucl Med 56: , 1199–1205. |
[7] | Daerr S , Brendel M , Zach C , Mille E , Schilling D , Zacherl MJ , Bürger K , Danek A , Pogarell O , Schildan A , Patt M , Barthel H , Sabri O , Bartenstein P , Rominger A ((2017) ) Evaluation of early-phase [18F]-florbetaben PET acquisition in clinical routine cases. Neuroimage Clin 14: , 77–86. |
[8] | Lin K-J , Hsiao I-T , Hsu J-L , Huang C-C , Huang K-L , Hsieh C-J , Wey S-P , Yen T-C ((2016) ) Imaging characteristic of dual-phase 18F-florbetapir (AV-45/Amyvid) PET for the concomitant detection of perfusion deficits and beta-amyloid deposition in Alzheimer’s disease and mild cognitive impairment. Eur J Nucl Med Mol Imaging 43: , 1304–1314. |
[9] | Forsberg A , Engler H , Blomquist G , Långström B , Nordberg A ((2012) ) The use of PIB-PET as a dual pathological and functional biomarker in AD. Biochim Biophys Acta 1822: , 380–385. |
[10] | Fu L , Liu L , Zhang J , Xu B , Fan Y , Tian J ((2014) ) Comparison of dual-biomarker PIB-PET and dual-tracer PET in AD diagnosis. Eur Radiol 24: , 2800–2809. |
[11] | McKhann GM , Knopman DS , Chertkow H , Hyman BT , Jack CR , Kawas CH , Klunk WE , Koroshetzl WJ , Manly JJ , Mayeux R , Mohs RC , Morris JC , Rossor MN , Scheltens P , Carrillo MC , Thies B , Weintraub S , Phelps CH ((2011) ) The diagnosis of dementia due to Alzheimer’s disease: Recommendations from the National Institute on Aging-Alzheimer’s Association workgroups on diagnostic guidelines for Alzheimer’s disease. Alzheimers Dement 7: , 263–269. |
[12] | Albert MS , DeKosky ST , Dickson D , Dubois B , Feldman HH , Fox NC , Gamst A , Holtzman DM , Jagust WJ , Petersen RC , Snyder PJ , Carrillo MC , Thies B , Phelps CH ((2011) ) The diagnosis of mild cognitive impairment due to Alzheimer’s disease: Recommendations from the National Institute on Aging-Alzheimer’s Association workgroups on diagnostic guidelines for Alzheimer’s disease. Alzheimers Dement 7: , 270–279. |
[13] | Gorno-Tempini ML , Hillis AE , Weintraub S , Kertesz A , Mendez M , Cappa SF , Ogar JM , Rohrer JD , Black S , Boeve BF , Manes F , Dronkers NF , Vandenberghe R , Rascovsky K , Patterson K , Miller BL , Knopman DS , Hodges JR , Mesulam MM , Grossman M ((2011) ) Classification of primary progressive aphasia and its variants. Neurology 76: , 1006–1014. |
[14] | Rascovsky K , Hodges JR , Knopman D , Mendez MF , Kramer JH , Neuhaus J , Swieten JCv , Seelaar H , Dopper EGP , Onyike CU , Hillis AE , Josephs KA , Boeve BF , Kertesz A , Seeley WW , Rankin KP , Johnson JK , Gorno-Tempini M-L , Rosen H , Prioleau-Latham CE , Lee A , Kipps CM , Lillo P , Piguet O , Rohrer JD , Rossor MN , Warren JD , Fox NC , Galasko D , Salmon DP , Black SE , Mesulam M , Weintraub S , Dickerson BC , Diehl-Schmid J , Pasquier F , Deramecourt V , Lebert F , Pijnenburg Y , Chow TW , Manes F , Grafman J , Cappa SF , Freedman M , Grossman M , Miller BL ((2011) ) Sensitivity of revised diagnostic criteria for the beavihoural variant of frontotemporal dementia. Brain 134: , 2456–2477. |
[15] | Thal DR , Rüb U , Orantes M , Braak H ((2002) ) Phases of Ab-deposition in the human brain and its relevance for the development of AD. Neurology 58: 1791–1800. |
[16] | Klunk WE , Engler H , Nordberg A , Wang Y , Blomqvist G , Holt DP , Bergström M , Savitcheva I , Huang G-f , Estrada S , Ausén B , Debnath ML , Barletta J , Price JC , Sandell J , Lopresti BJ , Wall A , Koivisto P , Antoni G , Mathis CA , Långström B ((2004) ) Imaging brain amyloid in Alzheimer’s disease with Pittsburgh compound-B. Ann Neurol 55: , 306–319. |
[17] | Lammertsma AA , Hume SP ((1996) ) Simplified reference tissue model for PET receptor studies. Neuroimage 4: , 153–158. |
[18] | Gunn RN , Lammertsma AA , Hume SP , Cunningham VJ ((1997) ) Parametric imaging of ligand-receptor binding in PET using a simplified reference region model. Neuroimage 6: , 279–287. |
[19] | Wu Y , Carson RE ((2002) ) Noise reduction in the simplified reference tissue model for neuroreceptor functional imaging. J Cereb Blood Flow Metab 22: , 1440–1452. |
[20] | Ichise M , Liow J-S , Lu J-Q , Takano A , Model K , Toyama H , Suhara T , Suzuki K , Innis RB , Carson RE ((2003) ) Linearized reference tissue parametric imaging methods: Application to [11C]DASB positron emission tomography studies of the serotonin transporter in human brain. J Cereb Blood Flow Metab 23: , 1096–1112. |
[21] | Ibáñez L , Schroeder W , Ng L , Cates J , Consortium IS eds. ((2005) ) The ITK Software Guide, Kitware, Inc., Clifton Park, NY. |
[22] | Gur RC , Ragland JD , Reivich M , Greenberg JH , Alavi A , Gur RE ((2009) ) Regional differences in the coupling between resting cerebral blood flow and metabolism may indicate action preparedness as a default state. Cereb Cortex 19: , 375–382. |
[23] | Yaqub M , Tolboom N , Boellaard R , Berckel BNMv , Tilburg EWv , Luurtsema G , Scheltens P , Lammertsma AA ((2008) ) Simplified parametric methods for [11C]PIB studies. Neuroimage 42: , 76–86. |
[24] | Garibotto V , Morbelli S , Pagani M ((2016) ) Dual-phase amyloid PET: Hitting two birds with one stone. Eur J Nucl Med Mol Imaging 43: , 1300–1303. |


