
Combining Cognitive, Genetic, and Structural Neuroimaging Markers to Identify Individuals with Increased Dementia Risk
Abstract
Background:
Cognitive and biological markers have shown varying degrees of success in identifying persons who will develop dementia.
Objective: To evaluate different combinations of cognitive and biological markers and identify prediction models with the highest accuracy for identifying persons with increased dementia risk.
Methods:
Neuropsychological assessment, genetic testing (apolipoprotein E –APOE), and structural magnetic resonance imaging (MRI) were performed for 418 older individuals without dementia (60–97 years) from a population-based study (SNAC-K). Participants were followed for six years.
Results:
Cognitive, genetic, and MRI markers were systematically combined to create prediction models for dementia at six years. The most predictive individual markers were perceptual speed or carrying at least one APOE ɛ4 allele (AUC = 0.875). The most predictive model (AUC = 0.924) included variables from all three modalities (category fluency, general knowledge, any ɛ4 allele, hippocampal volume, white matter-hyperintensity volume).
Conclusion:
This study shows that combining markers within and between modalities leads to increased predictivity for future dementia. However, minor increases in predictive value should be weighed against the cost of additional tests in larger-scale screening.
INTRODUCTION
Dementia and Alzheimer’s disease (AD) have a long preclinical phase during which a range of cognitive and biological markers may be used to identify people in the early stages of disease development [1]. Many clinical trials and interventions for dementia are focused on this period, where they are most likely to result in the prevention or delaying of dementia onset. In the present study, we evaluate the ability of a set of commonly used markers from three modalities: cognitive, genetic, and structural-magnetic resonance imaging (MRI), to identify individuals with a high probability to develop dementia within the next 6 years.
Cognitive deficits can present years or decades before a clinical diagnosis of dementia [2, 3], with perceptual speed, executive function, and episodic memory being most consistently impaired in the preclinical phase [4, 5]. Of the dementia risk genes, carrying the ɛ4 allele of apolipoprotein E (APOE) is the strongest risk factor for AD [6]. In addition, MRI markers, such as grey matter volumes, can predict future AD up to 10 years before clinical diagnosis [7] and white matter hyperintensities (WMHs) have been associated with increased dementia risk [8, 9].
Whereas all of these markers hold some predictive value, the power of individual markers is more limited. Recent research has therefore focused on the possible benefits of combining various prodromal markers. Increased predictivity has been reported from combining neuropsychological tests with MRI markers [10, 11] or by combining MRI markers and APOE [12]. Some [13], but not all [14], studies suggest that combining across modalities yields higher predictive value than combining within modalities. Moreover, several studies report a plateau in accuracy, after which the benefit of adding further markers is limited [10, 15]. From a practical perspective, due to financial, availability, or time constraints, it might not be possible to include a large number of predictors, if screening is to be implemented on a larger scale.
In this study, we perform a systematic investigation of the added value of combining markers from cognitive, genetic and MRI domains, both within and across modalities, to identify those at increased risk of developing dementia.
MATERIALS AND METHODS
Participants
Data were collected from participants involved in a longitudinal population-based study, the Swedish National Study on Aging and Care in Kungsholmen (SNAC-K). Baseline assessment was conducted on 3,363 individuals, belonging to specific age cohorts. Older age groups (≥78 years) were re-examined after 3 and 6 years and younger age groups (60–72 years) after 6 years. The assessment at each wave consisted of a nurse interview, a medical examination, and a neuropsychological testing session.
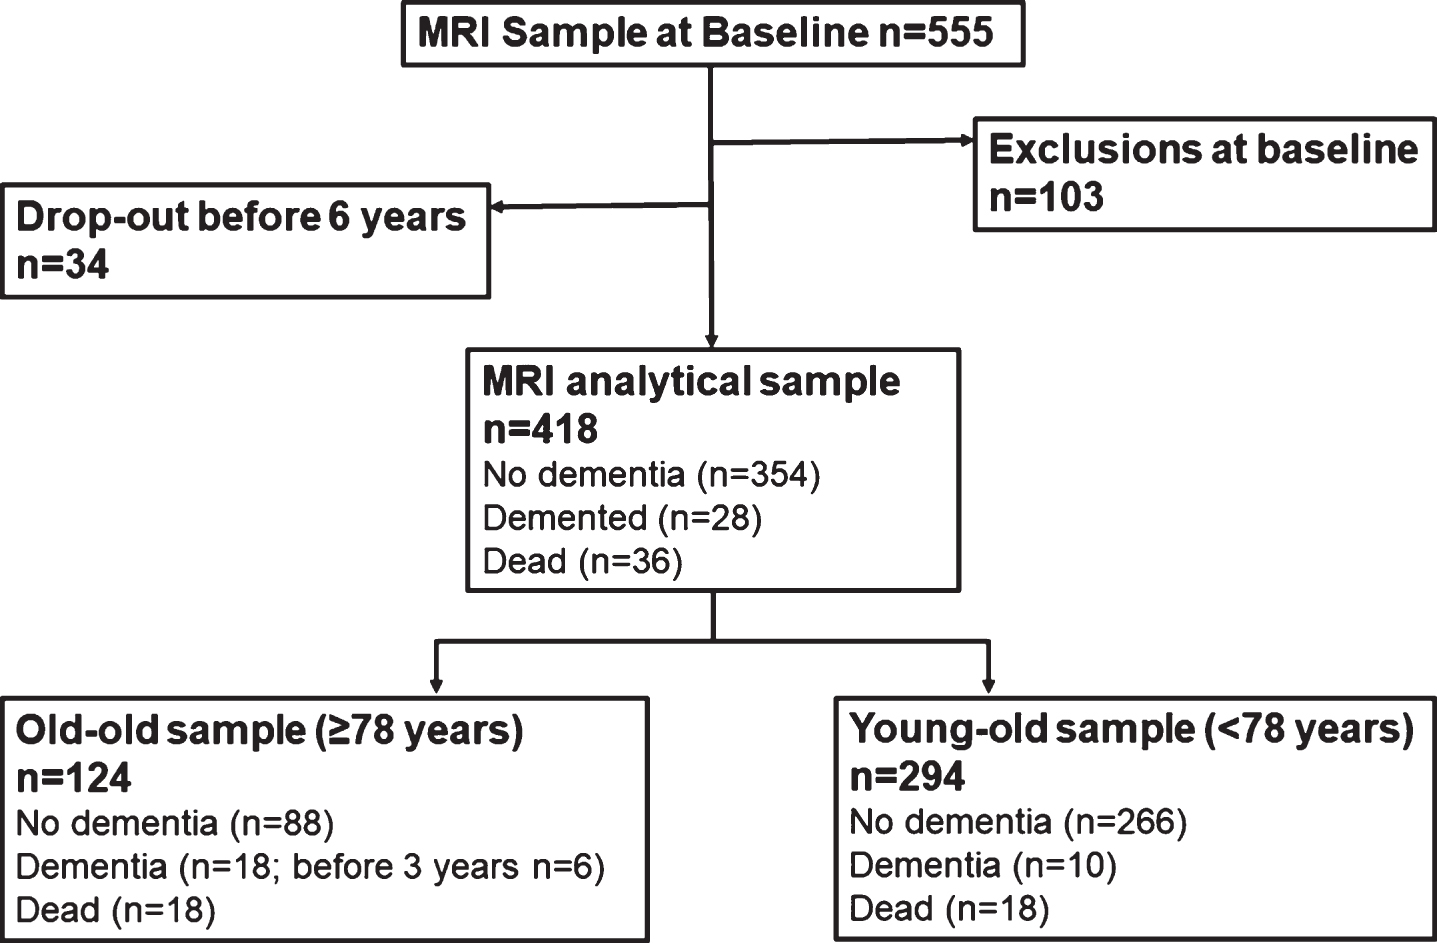
The present study focuses on a subgroup (n = 555) from the baseline study sample that underwent MRI scanning. Due to exclusion (poor quality images/technical issues; n = 52, missing cognitive data; n = 12, infarct/tumor/neural abnormality; n = 31, neurological disorder; n = 7, autoimmune disorder; n = 1) and drop-out, follow-up data were available for 418 participants. Of those, 354 remained dementia free, 28 developed dementia, and 36 died during the 6-year follow-up (see Fig. 1).
Fig. 1
Flowchart of study participants.
Compared to the full sample, the MRI sample was significantly younger, more educated, had a higher Mini-Mental State Examination (MMSE) score, and included more women (p < 0.01).
All stages of SNAC-K have been approved by the Karolinska Institutet ethical committee or the regional ethical review board and written informed consent was collected from all participants. In cases where participants had severe cognitive impairment, a proxy was asked for consent.
Dementia diagnosis
Dementia diagnoses were made according to the Diagnostic and Statistical Manual of Mental Disorders, 4th edition [16]. A preliminary diagnosis was made by the examining physician, followed by a secondary diagnosis based on computerized data from the medical examination. In cases of disagreement, a final decision was made by a senior physician. The cognitive assessment used for diagnosis included the MMSE [17], the Clock test [18] and items regarding memory, executive functioning, problem solving, orientation, and interpretation of proverbs. Neuropsychological, genetic, and neuroimaging information was not used for diagnostic purposes. For those who died before receiving a dementia diagnosis in SNAC-K, death certificates and medical records were reviewed to identify additional dementia cases.
Cognitive assessment
A detailed description of the included tasks has been previously published [19], except the trail making test (TMT) which is described below.
Assessment of episodic memory involved free recall of a 16-item wordlist and a 32-item yes/no recognition test [20]. Two tasks of semantic memory were administered, a general knowledge task and a vocabulary task [21, 22]. Verbal fluency was assessed with letter (‘F’ and ‘A’) and category (‘animals’ and ‘professions’) fluency. Tasks of perceptual speed included digit cancellation [23], pattern comparison [24] and TMT-A [25]. This task involved connecting 13 encircled digits in numeric order as fast and accurately as possible. The TMT-A score was calculated by dividing number of correct connections by completion time. Executive function was measured using TMT-B [25], where circles with numbers and letters were connected based on numeric and alphabetical order, alternating between the two categories (1-A, 2-B, etc.). The TMT-B score was calculated by dividing number of correct connections by completion time, after which TMT-A performance was regressed out to minimize the influence of motor speed.
Genotyping
DNA was obtained from peripheral blood samples and genotyping was performed using MALDI-TOF analysis on the Sequenom MassARRAY platform [26]. Because very few individuals carried two ɛ4 alleles, the APOE (rs429358) polymorphism was analyzed as a binary variable, i.e. ‘ɛ4 versus no ɛ4’. However, there was no significant effect of having two ɛ4 alleles (n = 15) over having only one ɛ4 allele (n = 89; p = 0.355) with regard to future dementia risk.
MRI assessment
Acquisition
MRI data were acquired using a 1.5T scanner (Philips Intera, Netherlands). The protocol included an axial 3D T1-weighted fast field echo (FFE) sequence with repetition time (TR) 15 ms, echo time (TE) 7 ms, flip angle (FA) 15°, field of view (FOV) 240, 128 slices with slice thickness 1.5 mm and in-plane resolution 0.94×0.94 mm, no gap, matrix 256×256, and an axial turbo FLAIR sequence (TR 6000 ms, TE 100 ms, inversion time 1900 ms, FA 90°, ETL 21, FOV 230, 22 slices with slice thickness 5 mm and in-plane resolution 0.90×0.90 mm, gap 1 mm, matrix 256×256).
Post-processing
The T1-weighted images were first segmented into grey matter, white matter and cerebro-spinal fluid (CSF) using the unified segmentation method approach [27] and SPM12b (Statistical Parametric Mapping, Wellcome Trust Centre for Neuroimaging, http://www.fil.ion.ucl.ac.uk/spm/). Further removal of odd voxels from the segments was achieved through the ‘light clean-up’ option. Total intracranial volume (ICV) was obtained by adding grey matter, white matter and CSF volumes.
Automatic segmentation of hippocampal volumes was performed using the Freesurfer image analysis suite (v. 5.0.1, Martinos Center for Biomedical Imaging, Harvard-MIT, Boston, USA; http://surfer.nmr.mgh.harvard.edu/). This procedure has previously been described by Gerritsen et al. [28].
WMHs were manually delineated on the FLAIR images by a single rater. For details about the procedure, see Köhncke et al. [29].
All volumes were corrected for ICV, using the analysis of covariance approach [30].
Statistical analysis
All statistical analyses were conducted in IBM SPSS 23. Baseline differences between incident dementia and no dementia groups were determined using χ2 tests for dichotomous variables and ANOVAs for continuous variables.
Multinomial logistic regressions were employed to investigate how well various markers, or combination of markers, predicted future dementia, with three outcomes possible: no dementia (reference group), incident dementia, and death. The third outcome was included to take into account mortality as a competing risk. However, as the outcome of interest was dementia, only estimates from the reference and incident dementia groups are reported in this paper. Age, sex, and education were included as covariates in all models and all variables were entered simultaneously. To determine which variable or combination of variables best predicted future dementia, the estimated probabilities from the multinomial regressions were saved and receiver operating characteristics (ROC) were calculated for the dementia outcome using the no dementia group as reference.
The predictive value of individual variables was determined first. Significant individual measures, based on the regression analyses, with the highest area under the curve (AUC) value within their domain were entered into subsequent models. This was done to reduce the number of variables and to address issues of collinearity. The threshold for statistical significance was set to p < 0.05.
Predictive models were built within and between modalities (cognitive, genetic, MRI). Models were created by starting with the best predictor (based on AUC value) and adding a second variable from the same or a different modality, systematically testing all available combinations. The 2-variable model with the highest AUC was then used as the base for testing a possible 3-variable model using the same method. When no predictor could add further unique variance, in the regression analyses, this was considered the final model. The statistical significance of differences in AUC between models was assessed using DeLong’s test. The Bayesian information criterion (BIC) was used as a measure of model fit.
All non-dichotomous variables were standardized and all scores where a higher value was related to a decreased risk were reversed so that odds ratios (ORs) represent increased risk per SD-unit change in the predictor.
RESULTS
Background
Descriptive characteristics across follow-up status are shown in Table 1. Persons who developed dementia were significantly older, had fewer years of education, and lower MMSE scores at baseline compared to the no dementia group (p < 0.001). Both groups included more women but there was no difference in sex distributions between groups (p = 0.20).
Table 1
Descriptive characteristics across dementia status at follow-up
| No dementia Incident dementia | ||
|---|---|---|
| n | 354 | 28 |
| Female, n (%) | 211 (59.60) | 20 (71.40) |
| Age, years mean (SD) | 68.95 (8.34) | 78.85 (6.61) |
| Follow-up time, years mean (SD) | 5.78 (.30) | 4.88 (1.40) |
| Education, years mean (SD) | 13.22 (4.25) | 9.78 (3.49) |
| MMSE mean (SD) | ||
| Baseline | 29.25 (.97) | 28.11 (1.50) |
| Follow-upa | 28.39 (1.49) | 21.40 (2.72) |
aFollow-up refers to the 6-year follow-up for the no dementia and time of diagnosis (3-year, n = 6, or 6-year, n = 22, follow-up) for the incident dementia group.
Raw scores and baseline differences in predictor variables between those who developed dementia and those who did not are presented in Supplementary Table 1. Correlations among all variables included in the prediction models are available in Supplementary Table 2.
Individual predictors
Results from multinomial logistic regressions and ROC analyses showed that the pattern comparison task (perceptual speed) and the presence of at least one ɛ4 allele were the strongest individual predictors of future dementia up to six years later (Table 2). Word recall (episodic memory), TMT-B (executive function), category fluency (verbal fluency), and general knowledge (semantic memory) were the best predictors in their respective cognitive domains and were therefore entered in the combined models. Hippocampal and WMH volume were the only significant MRI variables and both were kept for model development. However, results from DeLong’s test show none of the individual models were significantly more predictive of future dementia when compared to the covariate model (model 0) including age, sex and education.
Table 2
Multinomial logistic regressions for individual variables
| Variables | No dementia (n) | Incident dementia (n) | OR (95% C.I.) | p | ROC–AUCa |
|---|---|---|---|---|---|
| Sex (female versus male) | 354 | 28 | 1.69 (0.726–3.95) | 0.222 | 0.559 |
| Age | 354 | 28 | 3.15 (2.06–4.82) | 0.000 | 0.809 |
| Education | 354 | 28 | 2.85 (1.68–4.83) | 0.000 | 0.742 |
| Covariates (combined) | 354 | 28 | 0.845 | ||
| Cognition | |||||
| Episodic Memory | |||||
| Word recall | 353 | 28 | 2.38 (1.45–3.90) | 0.001 | 0.872 |
| Word recognition | 353 | 28 | 1.68 (1.12–2.51) | 0.012 | 0.852 |
| Semantic Memory | |||||
| Vocabulary | 352 | 28 | 1.54 (1.04–2.28) | 0.033 | 0.864 |
| General knowledge | 353 | 28 | 1.95 (1.26–3.02) | 0.003 | 0.866 |
| Verbal Fluency | |||||
| Letter fluency | 354 | 27 | 1.60 (0.98–2.62) | 0.062 | 0.853 |
| Category fluency | 353 | 27 | 2.25 (1.31–3.87) | 0.003 | 0.866 |
| Perceptual Speed | |||||
| Digit cancellation | 352 | 26 | 2.32 (1.28–4.22) | 0.006 | 0.869 |
| Pattern comparison | 352 | 26 | 2.48 (1.37–4.50) | 0.003 | 0.875 |
| Trail-making task A | 353 | 27 | 2.59 (1.34–5.02) | 0.005 | 0.863 |
| Executive Function | |||||
| Trail-making task B | 351 | 26 | 1.77 (1.04–3.02) | 0.035 | 0.870 |
| Genetic | |||||
| APOE (ɛ4 versus no ɛ4) | 349 | 28 | 4.89 (2.02–11.85) | 0.000 | 0.875 |
| MRI | |||||
| Total tissue volume | 354 | 28 | 1.35 (0.96–1.90) | 0.081 | 0.846 |
| Total grey matter volume | 354 | 28 | 1.60 (0.88–2.92) | 0.127 | 0.853 |
| Hippocampal volume | 346 | 27 | 2.15 (1.23–3.79) | 0.008 | 0.859 |
| Total white matter volume | 354 | 28 | 1.31 (0.82–2.08) | 0.254 | 0.841 |
| WMH volume | 342 | 28 | 1.72 (1.06–2.78) | 0.027 | 0.858 |
aIncident dementia versus no dementia. AUC, area under the curve; CI, confidence intervals; OR, odds ratio; ROC, receiver operating characteristic curve; WMH, white matter hyperintensity.
As pattern comparison, carrying any ɛ4 allele, and hippocampal volume were the strongest individual predictors of their respective modalities, they were chosen as bases for the combined models.
Intra-modality models
Adding further variables from within the base variable’s modality numerically increased predictivity (Table 3). Of the intra-modality models, the highest predictive value was obtained by adding a test of episodic memory (word recall) to the perceptual speed predictor (pattern comparison), which yielded the highest combined predictive value (AUC = 0.901). Among the MRI variables, hippocampal volume and WMHs both contributed unique variance and remained significant within the same model (AUC = 0.878). The final model for the cognitive modality was significantly more predictive (DeLong’s, p = 0.01) than the model including only the covariates (model 0); however, there was no significant increase in predictivity from model 0 to the final MRI model (p = 0.080).
Table 3
Multinomial logistic regressions for intramodality models
| Variables | No dementia (n) | Incident dementia (n) | OR (95% C.I.) | p | BIC | ROC–AUCa (95% C.I.) | |
|---|---|---|---|---|---|---|---|
| Model 0 | Covariates | 354 | 28 | 426.09 | 0.845 (0.793–0.896) | ||
| Cognition | |||||||
| Model 1 | Pattern comparison | 352 | 26 | 2.48 (1.37–4.50) | 0.003 | 414.28 | 0.875 (0.822–0.928) |
| Model 2 | Pattern comparison | 352 | 26 | 2.02 (1.10–3.73) | 0.025 | 414.28 | 0.901 (0.858–0.944) |
| Word recall | 2.46 (1.42–4.25) | 0.001 | |||||
| MRI | |||||||
| Model 1 | Hippocampal volume | 346 | 27 | 2.15 (1.23–3.79) | 0.008 | 408.43 | 0.859 (0.798–0.920) |
| Model 2 | Hippocampal volume | 334 | 27 | 1.97 (1.12–3.47) | 0.019 | 410.85 | 0.878 (0.828–0.928) |
| WMH volume | 1.85 (1.12–3.05) | 0.016 |
aIncident dementia versus no dementia. AUC, area under the curve; CI, confidence intervals; OR, odds ratio; BIC, Bayesian information criterion; ROC, receiver operating characteristic curve; WMH, white matter hyperintensity. Model 0 includes sex, age, and education.
Inter-modality models
The models with the numerically highest predictive values were obtained by combining variables across modalities (Table 4).
Table 4
Multinomial logistic regressions for intermodality models
| Variables | No dementia (N) | Incident dementia (N) | OR (95% C.I.) | p | BIC | ROC–AUCa (95% C.I.) | |
|---|---|---|---|---|---|---|---|
| Model 0 | Covariates | 354 | 28 | 426.09 | 0.845 (0.793–0.896) | ||
| Cognitive | |||||||
| Model 1 | Pattern comparison | 352 | 26 | 2.48 (1.37–4.50) | 0.003 | 414.28 | 0.875 (0.822–0.928) |
| Model 2 | Pattern comparison | 352 | 26 | 2.02 (1.10–3.73) | 0.025 | 414.28 | 0.901 (0.858–0.944) |
| Word recall | 2.46 (1.42–4.25) | 0.001 | |||||
| Model 3 | Pattern comparison | 344 | 25 | 1.96 (1.04–3.69) | 0.036 | 401.28 | 0.913 (0.874–0.952) |
| Word recall | 2.18 (1.24–3.82) | 0.007 | |||||
| Hippocampal volume | 2.07 (1.11–3.86) | 0.022 | |||||
| Genetic | |||||||
| Model 1 | APOE (ɛ4 versus no ɛ4) | 349 | 28 | 4.89 (2.02–11.85) | 0.000 | 398.82 | 0.875 (0.826–0.923) |
| Model 2 | APOE (ɛ4 versus no ɛ4) | 348 | 28 | 5.48 (2.16–13.94) | 0.000 | 397.06 | 0.908 (0.867–0.949) |
| Word recall | 2.50 (1.49–4.19) | 0.001 | |||||
| Model 3 | APOE (ɛ4 versus no ɛ4) | 347 | 28 | 5.81 (2.21–15.28) | 0.000 | 393.07 | 0.922 (0.883–0.960) |
| Word recall | 2.47 (1.46–4.19) | 0.001 | |||||
| General knowledge | 1.96 (1.21–3.16) | 0.006 | |||||
| MRI | |||||||
| Model 1 | Hippocampal volume | 346 | 27 | 2.15 (1.23–3.79) | 0.008 | 408.43 | 0.859 (0.798–0.920) |
| Model 2 | Hippocampal volume | 345 | 26 | 2.68 (1.44–4.99) | 0.002 | 398.63 | 0.895 (0.845–0.944) |
| Category fluency | 2.56 (1.40–4.70) | 0.002 | |||||
| Model 3 | Hippocampal volume | 340 | 26 | 2.17 (1.16–4.05) | 0.015 | 377.70 | 0.911 (0.869–0.953) |
| Category fluency | 2.58 (1.37–4.85) | 0.003 | |||||
| APOE (ɛ4 versus no ɛ4) | 4.09 (1.51–11.06) | 0.005 | |||||
| Model 4 | Hippocampal volume | 328 | 26 | 2.04 (1.08–3.85) | 0.028 | 382.15 | 0.921 (0.882–0.960) |
| Category fluency | 2.60 (1.39–4.89) | 0.003 | |||||
| APOE (ɛ4 versus no ɛ4) | 4.04 (1.46–11.18) | 0.007 | |||||
| WMH volume | 1.81 (1.05–3.09) | 0.031 | |||||
| Model 5 | Hippocampal volume | 327 | 26 | 2.16 (1.14–4.11) | 0.019 | 385.08 | 0.924 (0.883–0.965) |
| Category fluency | 2.45 (1.28–4.69) | 0.007 | |||||
| APOE (ɛ4 versus no ɛ4) | 4.15 (1.47–11.71) | 0.007 | |||||
| WMH volume | 1.75 (1.00–3.07) | 0.049 | |||||
| General knowledge | 1.77 (1.05–2.97) | 0.031 |
aIncident dementia versus no dementia. AUC, area under the curve; CI, confidence intervals; OR, odds ratio; BIC, Bayesian information criterion; ROC, receiver operating characteristic curve; WMH, white matter hyperintensity. Model 0 includes sex, age and education.
The model starting with the strongest individual cognitive predictor (pattern comparison, AUC = 0.875) was most improved by adding the word recall test (AUC = 0.901). The final model also included hippocampal volume (AUC = 0.913). Although the addition of pattern comparison did not increase predictivity compared to model 0 (p = 0.222), the 2-variable model (p = 0.012), followed by the 3-variable model (p = 0.007) led to a significant increase in predictivity, relative to model 0.
Even though the presence of at least one ɛ4 allele was a strong predictor in itself (AUC = 0.875), adding a cognitive test, word recall, further improved dementia prediction (AUC = 0.908). The addition of the general knowledge task resulted in a final model where all three variables gave independent contributions to dementia prediction (AUC = 0.922). Compared to the covariate model, the addition of a single variable did not significantly increase predictive value (p = 0.171), whereas predictivity for models with two or more variables increased from model 0 (p = 0.001).
A model starting with hippocampal volume, the strongest MRI predictor, was most improved by adding the category fluency test (AUC = 0.895). Adding the presence of at least one ɛ4 allele resulted in a 3-variable model including tests from each modality (AUC = 0.911). Prediction was further increased by the inclusion of WMHs (AUC = 0.921). The addition of the general knowledge task resulted in a final model of 5 variables spanning all modalities, which had the highest predictivity of all models tested (AUC = 0.924). As with the other modality bases, there was no significant increase in predictivity from the inclusion of only one variable (p = 0.476), although, all models from three variable onwards showed a significant increase in predictive value (p < 0.05). Taking into account the BIC values, note that, although the highest predictive value was obtained using all 5 variables, BIC increased after three variables suggesting a lowering of model fit.
All model bases showed a significant increase in AUC from model 0 to the final models (cognitive base, p = 0.007; genetic base, p = 0.001; MRI base, p = 0.005). However, there was no significant difference in predictivity between any of the final models. The final inter-modality models were also not significantly different from the final intra-modality models.
For ROC curves for all model bases, see Supplementary Figure 1.
DISCUSSION
The present study demonstrates that markers commonly used in clinical praxis from cognitive, genetic, and MRI modalities can be used for predicting future dementia. Including additional markers in the models increased predictivity and to obtain a significant increase in predictivity over age sex and education, at least two predictors were required. Adding markers from a different modality led to a higher numerical increase in predictivity and the model with the highest predictive value included markers from all three modalities. However, it should be noted that none of the final models were significantly different from each other. When choosing which and how many predictors to include, economical and practical aspects should also be considered.
Individual predictors
The observably strongest predictor of future dementia within the cognitive modality was perceptual speed (pattern comparison). This was also, numerically, the strongest predictor overall (alongside APOE). Previous research has often indicated episodic memory [10, 31, 32] or executive function [33, 34] as the most predictive cognitive domains. Nevertheless, our current findings are in line with results suggesting that perceptual speed does equally well in differentiating persons with preclinical AD from controls [4]. As AD and dementia is preceded by multiple changes in neural structure and function, both in the hippocampus and beyond [35], it may be that global cognitive deficits reflect the wide-ranging brain changes in the preclinical phase.
The current results are in line with previous research showing deficits in multiple cognitive domains in preclinical AD and MCI [4, 5]. Possible underlying mechanisms for these cognitive deficits are hippocampal atrophy, which may primarily affect episodic memory [36], and alterations in the white matter, which have been linked to speed [37]. The findings that hippocampal volume and WMHs were strong predictors of dementia are consistent with these observations.
Alongside perceptual speed, the presence of any APOE ɛ4 allele was the strongest predictor of future dementia. APOE is known to be the strongest genetic risk factor for AD [6], thus, our findings support previous research regarding the predictivity of the ɛ4 allele [14, 38]. Although there are studies showing no significant predictive value when competing with other variables, such as hippocampal volume, cognitive tests, and CSF markers [33].
Among the MRI variables included, hippocampal volume and WMHs were significantly predictive of dementia. Hippocampal integrity is a well-established neuroimaging marker for dementia, particularly AD [39]. While more wide-spread or whole-brain atrophy has been shown to predict future dementia [7], this is not a consistent finding [40] and was not the case in the current study. This may be due to the relatively long distance from diagnosis, as atrophy in preclinical AD begins in the entorhinal and hippocampal regions before spreading to other parts of the brain [41]. Vascular burden may also lead to brain atrophy; WMHs have been found to increase the rate of hippocampal atrophy in persons with MCI [42].
Studies that have used WMHs as a sole predictor of future dementia have produced mixed findings [8, 9]. While traditionally associated with vascular dementia [43], WMHs hold some predictive value for AD [8] as the effects of vascular lesions can exacerbate AD pathology [42, 43]. In this context it is important to note that in the general older population, persons with dementia will commonly present with a mix of vascular and AD pathology [44, 45]. Furthermore, many markers have been shown to predict vascular dementia and AD in a similar way [43, 46].
Although the numerically best individual predictors were the presence of any ɛ4 allele and a test of perceptual speed, there was homogeneity in predictivity across the variables tested. Previous studies have sometimes claimed that cognitive markers are the best predictors of future dementia [14, 32, 47, 48], although there are conflicting results [12, 34], potentially due to the inclusion of highly predictive and specific CSF markers. However, the current results show only minor variation in predictive ability among the included cognitive, genetic, and MRI variables, suggesting that no individual modality is clearly superior at predicting future dementia. The fact that no single test provided a significant increase in predictivity above that of the covariates highlights the need for predictor models that include multiple variables.
Combined models
Adding variables from the same modality (cognition or MRI) led to increased dementia prediction, consistent with previous findings [10, 13, 38], although, the increase in predictivity relative to the covariate model was only significant for the cognitive modality.
An important observation was that the highest predictive values were obtained by combining across modalities. All of the final models included variables from at least two modalities, with the numerically best model combining variables from all three modalities. Intercollinearity among variables within domains might partly explain why predictors from a different modality were more likely to contribute unique variance (Supplementary Table 2). Previous work supports the added benefit of combining between modalities such as MRI and cognition [14, 32, 34] or cognitive and genetic [38]. Dukart et al. [12] found that combining between cognitive, genetic and MRI conveyed greater predictive value than individual predictors or any combination of two modalities. The pattern of results from our study is consistent with these previous findings. However, when formally testing for differences in predictivity between models the addition of structural MRI variables increased predictive value only numerically from a model of cognition and APOE.
Moreover, a model of only cognitive markers did not differ significantly from models including multiple modalities. Worth noting is also that, although predictive value increased in the final models of the MRI base, the BIC value also increased after the 3-variable model indicating a worsening of model fit. This suggests that the models with more than three predictors may be over-fitted to this specific dataset, leading to an artificial increase in predictivity. Thus, adding more predictors may not be optimal, especially considering the relatively small increase in AUC.
Strengths and limitations
A major strength of the current study is the population-based sample, making the results generalizable outside a clinical setting. The fact that all individuals were assessed, not only those with subjective cognitive impairment, and that the dementia diagnosis was based on a clinical examination, without making use of the included predictors, minimizes the risk of circularity often present in clinical environments. Potential limitations are that precise information on time of dementia onset was lacking and that the MRI sample was slightly positively biased relative to the full SNAC-K sample. However, the bias in the MRI sample, in terms of younger age and higher education compared to the full sample, may have led to lower predictivity than would be expected in the general population, as smaller variance in the predictors leads to weaker associations with the outcome (i.e., dementia).
Implications
Our results show that a range of widely available markers may be used to identify persons in the general population who have an increased dementia risk. The predictors included in these models may all be suited as screening tools for selecting individuals who should take part in preventive interventions. Indeed, several ongoing trials are multimodal, targeting multiple dementia types [49]. Although the results show that dementia prediction could be improved by including additional predictors, there was no strong evidence to suggest one observably better combination over another. The marginal increases in predictive value seen beyond the 2- or 3-variable models should also be weighed against potential inconveniences of adding further assessments. However, cognitive tests may be particularly beneficial for pre-dementia screening as they were found to be equally predictive as a combination of markers from multiple modalities, while being easy to implement at a low cost.
ACKNOWLEDGMENTS
We thank the participants as well as all staff involved in the data collection and management of the SNAC-K study. SNAC-K is financially supported by the Swedish Ministry of Health and Social Affairs, the participating County Councils and Municipalities, and the Swedish Research Council. This work was further funded by grants from the Swedish Council for Working Life and Social Research (EL, LF, LB), the Swedish Research Council (EL), Swedish Alzheimer Foundation (EL), Osterman Foundation (EL), and Gamla Tjänarinnor Foundation (EL). This study was accomplished while NP was affiliated with the Swedish National Graduate School for Competitive Science on Aging and Health (SWEAH), which is funded by the Swedish Research Council.
Authors’ disclosures available online (https://www.j-alz.com/manuscript-disclosures/18-0199r1).
SUPPLEMENTARY MATERIAL
[1] The supplementary material is available in the electronic version of this article: http://dx.doi.org/10.3233/JAD-180199.
REFERENCES
[1] | Dubois B , Hampel H , Feldman HH , Scheltens P , Aisen P , Andrieu S , Bakardjian H , Benali H , Bertram L , Blennow K ((2016) ) Preclinical Alzheimer’s disease: Definition, natural history, and diagnostic criteria. Alzheimers Dement 12: , 292–323. |
[2] | Boraxbekk CJ , Lundquist A , Nordin A , Nyberg L , Nilsson LG , Adolfsson R ((2015) ) Free Recall episodic memory performance predicts dementia ten years prior to clinical diagnosis: Findings from the Betula Longitudinal Study. Dement Geriatr Cogn Dis Extra 5: , 191–202. |
[3] | Elias MF , Beiser A , Wolf PA , Au R , White RF , D’Agostino RB ((2000) ) The preclinical phase of Alzheimer disease: A 22-year prospective study of the Framingham cohort. Arch Neurol 57: , 808–813. |
[4] | Bäckman L , Jones S , Berger A-K , Laukka EJ , Small BJ ((2005) ) Cognitive impairment in preclinical Alzheimer’s disease: A meta-analysis. Neuropsychology 19: , 520–531. |
[5] | Economou A , Papageorgiou SG , Karageorgiou C , Vassilopoulos D ((2007) ) Nonepisodic memory deficits in amnestic MCI. Cogn Behav Neurol 20: , 99–106. |
[6] | Raber J , Huang YD , Ashford JW ((2004) ) ApoE genotype accounts for the vast majority of AD risk and AD pathology. Neurobiol Aging 25: , 641–650. |
[7] | Tondelli M , Wilcock GK , Nichelli P , De Jager CA , Jenkinson M , Zamboni G ((2012) ) Structural MRI changes detectable up to ten years before clinical Alzheimer’s disease. Neurobiol Aging 33: , 825.e825–825.e836. |
[8] | Brickman AM , Provenzano FA , Muraskin J , Manly JJ , Blum S , Apa Z , Stern Y , Brown TR , Luchsinger JA , Mayeux R ((2012) ) Regional white matter hyperintensity volume, not hippocampal atrophy, predicts incident Alzheimer disease in the community. Arch Neurol 69: , 1621–1627. |
[9] | Debette S , Markus H ((2010) ) The clinical importance of white matter hyperintensities on brain magnetic resonance imaging: Systematic review and meta-analysis. BMJ 341: , 3666. |
[10] | Devanand DP , Liu X , Tabert MH , Pradhaban G , Cuasay K , Bell K , de Leon MJ , Doty RL , Stern Y , Pelton GH ((2008) ) Combining early markers strongly predicts conversion from mild cognitive impairment to Alzheimer’s disease. Biol Psychiatry 64: , 871–879. |
[11] | Lopez ME , Turrero A , Cuesta P , Lopez-Sanz D , Bruna R , Marcos A , Gil P , Yus M , Barabash A , Cabranes JA , Maestu F , Fernandez A ((2016) ) Searching for primary predictors of conversion from mild cognitive impairment to Alzheimer’s disease: A multivariate follow-up study. J Alzheimers Dis 52: , 133–143. |
[12] | Dukart J , Sambataro F , Bertolino A ((2016) ) Accurate prediction of conversion to Alzheimer’s disease using imaging, genetic, and neuropsychological biomarkers. J Alzheimers Dis 49: , 1143–1159. |
[13] | Peters F , Villeneuve S , Belleville S ((2014) ) Predicting progression to dementia in elderly subjects with mild cognitive impairment using both cognitive and neuroimaging predictors. J Alzheimers Dis 38: , 307–318. |
[14] | Gomar JJ , Bobes-Bascaran MT , Conejero-Goldberg C , Davies P , Goldberg TE ((2011) ) Utility of combinations of biomarkers, cognitive markers, and risk factors to predict conversion from mild cognitive impairment to Alzheimer disease in patients in the Alzheimer’s disease neuroimaging initiative. Arch Gen Psychiatry 68: , 961–969. |
[15] | Korolev IO , Symonds LL , Bozoki AC , Alzheimer’s Disease Neuroimaging Initiative ((2016) ) Predicting progression from mild cognitive impairment to Alzheimer’s dementia using clinical, MRI, and plasma biomarkers via probabilistic pattern classification. Plos One 11: , e0138866. |
[16] | Frances A ((1994) ) Diagnostic and statistical manual of mental disorders: DSM-IV American Psychiatric Association. |
[17] | Folstein MF , Folstein SE , McHugh PR ((1975) ) “Mini-mental state”. A practical method for grading the cognitive state of patients for the clinician. J Psychiatr Res 12: , 189–198. |
[18] | Manos PJ , Wu R ((1994) ) The ten point clock test: A quick screen and grading method for cognitive impairment in medical and surgical patients. Int J Psychiatry Med 24: , 229–244. |
[19] | Laukka EJ , Lovden M , Herlitz A , Karlsson S , Ferencz B , Pantzar A , Keller L , Graff C , Fratiglioni L , Backman L ((2013) ) Genetic effects on old-age cognitive functioning: A population-based study. Psychol Aging 28: , 262–274. |
[20] | Laukka EJ , Lövdén M , Herlitz A , Karlsson S , Ferencz B , Pantzar A , Keller L , Graff C , Fratiglioni L , Bäckman L ((2013) ) Genetic effects on old-age cognitive functioning: A population-based study. Psychol Aging 28: , 262–274. |
[21] | Dureman I , Scholander T ((1960) ) Subjective estimation of drug-induced changes in actional level. Scand J Psychol 1: , 36–40. |
[22] | Nilsson L-G , Bäckman L , Erngrund K , Nyberg L , Adolfsson R , Bucht G , Karlsson S , Widing M , Winblad B ((1997) ) The Betula prospective cohort study: Memory, health, and aging. Aging Neuropsychol Cogn 4: , 1–32. |
[23] | Zazzo R ((1974) ) éé Delachaux et Nestle, Neuchatel, Switzerland. dagogiques et psychologiques. |
[24] | Salthouse TA , Babcock RL ((1991) ) Decomposing adult age differences in working memory. Dev Psychol 27: , 763–776. |
[25] | Lezak MD ((2004) ) USA. Neuropsychological assessment, Oxford University Press. |
[26] | Oeth P , Park C , Kosman D , del Mistro G , van den Boom D , Jurinke C ((2005) ) Assay: Increased Plexing Efficiency and Flexibility for MassARRAY System Through Single Base Primer Extension with Mass-Modified Terminators. |
[27] | Ashburner J , Friston KJ ((2005) ) Unified segmentation. Neuroimage 26: , 839–851. |
[28] | Gerritsen L , Kalpouzos G , Westman E , Simmons A , Wahlund L-O , Bäckman L , Fratiglioni L , Wang H-X ((2015) ) The influence of negative life events on hippocampal and amygdala volumes in old age: A life-course perspective. Psychol Med 45: , 1219–1228. |
[29] | Köhncke Y , Laukka EJ , Brehmer Y , Kalpouzos G , Li T-Q , Fratiglioni L , Bäckman L , Lövdén M ((2016) ) Three-year changes in leisure activities are associated with concurrent changes in white matter microstructure and perceptual speed in individuals aged 80 years and older. Neurobiol Aging 41: , 173–186. |
[30] | Jack CR Jr. , Twomey CK , Zinsmeister AR , Sharbrough FW , Petersen RC , Cascino GD ((1989) ) Anterior temporal lobes and hippocampal formations: Normative volumetric measurements from MR images in young adults. Radiology 172: , 549–554. |
[31] | Eckerström C , Olsson E , Bjerke M , Malmgren H , Edman Å , Wallin A , Nordlund A ((2013) ) A combination of neuropsychological, neuroimaging, and cerebrospinal fluid markers predicts conversion from mild cognitive impairment to dementia. J Alzheimers Dis 36: , 421–431. |
[32] | Cui Y , Liu B , Luo S , Zhen X , Fan M , Liu T , Zhu W , Park M , Jiang T , Jin JS ((2011) ) Identification of conversion from mild cognitive impairment to Alzheimer’s disease using multivariate predictors. PloS One 6: , e21896. |
[33] | Ewers M , Walsh C , Trojanowski JQ , Shaw LM , Petersen RC , Jack CR Jr , Feldman HH , Bokde ALW , Alexander GE , Scheltens P , Vellas B , Dubois B , Weiner M , Hampel H ((2012) ) Prediction of conversion from mild cognitive impairment to Alzheimer’s disease dementia based upon biomarkers and neuropsychological test performance. Neurobiol Aging 33: , 1203–1214.e1202. |
[34] | Eckerström C , Olsson E , Klasson N , Berge J , Nordlund A , Bjerke M , Wallin A ((2015) ) Multimodal prediction of dementia with up to 10 years follow up: The Gothenburg MCI study. J Alzheimers Dis 44: , 205–214. |
[35] | Twamley EW , Ropacki SAL , Bondi MW ((2006) ) Neuropsychological and neuroimaging changes in preclinical Alzheimer’s disease. J Int Neuropsychol Soc 12: , 707–735. |
[36] | Burgess N , Maguire EA , O’Keefe J ((2002) ) The human hippocampus and spatial and episodic memory. Neuron 35: , 625–641. |
[37] | Penke L , Maniega SM , Murray C , Gow AJ , Hernandez MCV , Clayden JD , Starr JM , Wardlaw JM , Bastin ME , Deary IJ ((2010) ) A general factor of brain white matter integrity predicts information processing speed in healthy older people. J Neurosci 30: , 7569–7574. |
[38] | Jungwirth S , Zehetmayer S , Bauer P , Weissgram S , Tragl KH , Fischer P ((2009) ) Prediction of Alzheimer dementia with short neuropsychological instruments. J Neural Transm (Vienna) 116: , 1513–1521. |
[39] | Teipel SJ , Grothe M , Lista S , Toschi N , Garaci FG , Hampel H ((2013) ) Relevance of magnetic resonance imaging for early detection and diagnosis of Alzheimer disease. Med Clin North Am 97: , 399–424. |
[40] | Stephan BCM , Tzourio C , Auriacombe S , Amieva H , Dufouil C , Alperovitch A , Kurth T ((2015) ) Usefulness of data from magnetic resonance imaging to improve prediction of dementia: Population based cohort study. BMJ 350: , 2863. |
[41] | Scahill RI , Schott JM , Stevens JM , Rossor MN , Fox NC ((2002) ) Mapping the evolution of regional atrophy in Alzheimer’s disease: Unbiased analysis of fluid-registered serial MRI. Proc Natl Acad Sci U S A 99: , 4703–4707. |
[42] | Fiford CM , Manning EN , Bartlett JW , Cash DM , Malone IB , Ridgway GR , Lehmann M , Leung KK , Sudre CH , Ourselin S , Biessels GJ , Carmichael OT , Fox NC , Cardoso MJ , Barnes J , Alzheimer’s Disease Neuroimaging Initiative ((2017) ) White matter hyperintensities are associated with disproportionate progressive hippocampal atrophy. Hippocampus 27: , 249–262. |
[43] | Prins ND , Scheltens P ((2015) ) White matter hyperintensities, cognitive impairment and dementia: An update. Nat Rev Neurol 11: , 157–165. |
[44] | Kalaria RN , Ballard C ((1999) ) Overlap between pathology of Alzheimer disease and vascular dementia. Alzheimer Dis Assoc Disord 13: (Suppl 3), 115–123. |
[45] | Neuropathology Group Medical Research Council Cognitive Function and Aging Study ((2001) ) Pathological correlates of late-onset dementia in a multicentre, community-based population in England and Wales. Neuropathology Group of the Medical Research Council Cognitive Function and Ageing Study (MRC CFAS). Lancet 357: , 169–175. |
[46] | Laukka EJ , Jones S , Small BJ , Fratiglioni L , Bäckman L ((2004) ) Similar patterns of cognitive deficits in the preclinical phases of vascular dementia and Alzheimer’s disease. J Int Neuropsychol Soc 10: , 382–391. |
[47] | Schmand B , Huizenga HM , van Gool WA ((2010) ) Meta-analysis of CSF and MRI biomarkers for detecting preclinical Alzheimer’s disease. Psychol Med 40: , 135–145. |
[48] | Gomar JJ , Conejero-Goldberg C , Davies P , Goldberg TE ((2014) ) Extension and refinement of the predictive value of different classes of markers in ADNI: Four-year follow-up data. Alzheimers Dement 10: , 704–712. |
[49] | Solomon A , Mangialasche F , Richard E , Andrieu S , Bennett DA , Breteler M , Fratiglioni L , Hooshmand B , Khachaturian AS , Schneider LS ((2014) ) Advances in the prevention of Alzheimer’s disease and dementia. J Intern Med 275: , 229–250. |


