
A Study of Amyloid-β and Phosphotau in Plaques and Neurons in the Hippocampus of Alzheimer’s Disease Patients
Abstract
The main pathological hallmarks in Alzheimer’s disease (AD) are the presence of extracellular amyloid plaques, primarily consisting of amyloid-β (Aβ) peptide, and the accumulation of paired helical filaments of hyperphosphorylated tau protein (PHF-Tau) within neurons. Since CA1 is one of the most affected regions in AD, mainly at early stages, we have performed a detailed analysis of the CA1 region from 11 AD patients (demented and clinically similar; Braak stages IV-VI) to better understand the possible relationship between the presence and distribution of different neurochemical types of Aβ plaques and PHF-Tau immunoreactive (- ir) neurons. Hence, we have examined hippocampal sections in confocal microscopy images from double and triple-immunostained sections, to study labeled plaques and PHF-Tau-ir neurons using specific software tools. There are four main findings in the present study. First, the pyramidal layer of proximal CA1 (close to CA2) contains the smallest number of both plaques and PHF-Tau-ir neurons. Second, a large proportion of Aβ-ir plaques were also characterized by the presence of PHF-Tau-ir. Third, all plaques containing one of the two PHF-Tau isoforms also express the other isoform, that is, if a plaque contains PHFpS396, it also contains PHFAT8, and vice versa. Fourth, the coexpression study of both PHF-Tau isoforms in CA1 neurons revealed that most of the labeled neurons express only PHFpS396. Our findings further support the idea that AD is not a unique entity even within the same neuropathological stage, since the microanatomical/neurochemical changes that occur in the hippocampus greatly vary from one patient to another.
INTRODUCTION
Alzheimer’s disease (AD) is a progressive brain disease and the most common cause of dementia [1]. The main pathological hallmarks in AD are the presence of extracellular amyloid plaques, primarily consisting of amyloid-β (Aβ) peptide, and the accumulation within neurons of paired helical filaments of hyperphosphorylated tau protein (PHF-Tau), which are known as neurofibrillary tangles (NFTs) [2–4].
Symptoms in early stages of AD are impairment of declarative memory, disorientation, and loss of context [5, 6]. The main brain structures that support these functions include the medial temporal lobe, especially the hippocampal formation and adjacent cortex [7, 8]. In particular, the CA1 hippocampal region is critical in spatial orientation, learning and in different memory functions, such as the retrieval of remote episodic memory and the strength of established memories [8–14]. Moreover, it has been shown that CA1 is one of the most affected regions in AD, mainly at early stages [14–18]. A variety of alterations have been widely reported in CA1 from AD patients, such as a decrease in the number of neurons [19–21] and neuronal alterations, including dendritic changes in pyramidal cells [14, 22, 23].
It is becoming apparent that the accumulation of Aβ plaques does not correlate with cognitive impairments in AD patients. Indeed, a large number of individuals without any cognitive impairment accumulate Aβ plaques in their brains [24–26]. However, the presence of PHF-Tau has been related to cognitive impairment in AD [22, 27] and there is evidence that it produces changes in the microanatomy of pyramidal neurons [22] and neurodegeneration [28]. Moreover, PHF-Tau has been reported to affect, among other functions, mitochondrial activity and axonal transport, and it has been proposed to make neurons vulnerable to Aβ [29]. Nevertheless, it is still unclear how pathological forms of tau and Aβ interact during the progression of AD, and understanding the underlying mechanism responsible for their possible potentiation is critical [28, 30–32].
In the present study, we performed a detailed analysis of different layers of the CA1 region from AD patients (demented and clinically similar; Braak stages V–VI) to try to better understand the possible relationship between the presence and distribution of different neurochemical types of Aβ plaques and PHF-Tau-ir neurons. For this purpose, we examined hippocampal sections and generated maps of labeled elements using specific software tools in confocal microscopy images from double- and triple-immunostained sections from these patients. The aim was to generate maps of plaque location and protein co-expression patterns (Aβ and PHF-Tau) to examine possible differences in the laminar and spatial distribution of labeled elements.
We also examined location and expression pattern of neurons containing NFTs labeled with different PHF-Tau isoforms (PHFpS396 and PHFAT8). We found that although labeled plaques and PHF-Tau-ir neurons revealed highly variable expression patterns between patients, the pyramidal layer of the proximal portion of CA1 region (close to CA2) contained both the lowest number of plaques and PHF-Tau-ir neurons. Furthermore, we found that a large proportion of Aβ-ir plaques were also characterized by the presence of PHF-Tau, whereas plaques lacking Aβ (i.e., plaques stained only with PHFpS396 or PHFAT8) were unusual. Finally, the study of the expression of PHF-Tau isoforms in neurons revealed that the majority of the CA1 labeled neurons in these patients expressed only PHFpS396.
MATERIALS AND METHODS
Tissue preparation
Human brain tissue was obtained from 11 patients (postmortem delay between 2 and 5.75 h; between 76 and 95 years old at time of death) diagnosed as having AD according to neuropathological examination as stated by Braak and Braak (1991) [33] and CERAD criteria [34]. These samples were obtained from two different sources: Banc de Teixits Neurologics from Hospital Universitari Clinic de Barcelona (Dr. I. Ferrer, Servicio de Anatomía Patológica, IBIDELL-Hospital Universitario de Bellvitge, Barcelona, Spain) and the Banco de Tejidos Fundación CIEN (Dr. A. Rábano, Área de Neuropatología, Centro Alzheimer, Fundación Reina Sofía, Madrid, Spain), following the guidelines of the Helsinki Declaration and with the approval of the local Ethical Committees. Clinical data and other variables from patients were obtained from the neurologist of each patient (Table 1).
Table 1
Summary of clinical and pathological data
| Patient | Gender | Age at diagnosis (y) | Disease progression (y) | Braak Stage | CERAD Stage | Co-pathology | Family history of dementia | Postmortem delay (h:m) |
| Az1B | Male | 80 | 10 | VI | C | Microinfarctions | AD | 4:30 |
| Az2B | Female | 70 | 12 | V | C | αSyn (amygdala) | No | 2:00 |
| Az3B | Female | 79 | 2 | V | C | TDP43 | No | 5:30 |
| Az4B | Female | 78 | 9 | IV | B | TDP43 | AD | 5:30 |
| Az5B | Female | 69 | 14 | V/VI | C | Cortical infarctions | Dementia | 4:00 |
| Az6B | Female | 69 | 7 | V | C | TDP43 (limbic) | Dementia | 5:00 |
| Az7B | Female | 89 | NA | VI | C | TDP43 (amygdala) | AD | 4:15 |
| Az8B | Female | 77 | 8 | VI | C | NA | No | 5:45 |
| Az9B | Female | 76 | 8 | VI | C | TDP43 (limbic); αSyn (orbitofrontal) | AD | 5:00 |
| Az10B | Female | 71 | 9 | V | C | Meningioma | MCI | 5:00 |
| Az11M | Female | 82 | 13 | V | NA | NA | No | 4:00 |
[i] Braak Stages [33]: I–II (NFTs in entorhinal cortex and closely related areas); III–IV (NFTs abundant in amygdala and hippocampus and extending slightly into the association cortex); V–VI (NFTs widely distributed throughout the neocortex and ultimately involving primary motor and sensory areas). CERAD Stages [34]: A, low density of neuritic plaques; B, intermediate density of neuritic plaques; C, high density of neuritic plaques. αSyn, alpha synuclein protein; AD, Alzheimer’s disease; MCI, mild cognitive impairment. TDP43: TAR DNA-binding protein 43; BBanc de Teixits Neurologics (Hospital Universitari Clinic de Barcelona); MBanco de Tejidos Fundación CIEN (Madrid); NA, data not available.
Tissue blocks were fixed (4% paraformaldehyde for 24 h at 4°C), cryoprotected (30% sucrose solution for at least 24 h) and deep-frozen (–80°C) for preservation. The blocks containing the hippocampus were cut with a sliding microtome (Thermo Fischer Scientific, MICROM, HM450; freeze unit, KS34, Massachusetts, USA), at –40°C, in serial coronal sections (50μm thick) and collected in 0.1 M PB for further processing.
Immunohistochemistry
Sections were first rinsed in 0.1 M PB, pretreated in 2% H2O2 for 30 min to remove endogenous peroxidase activity, and then incubated for 1 h at room temperature in a solution of 3% normal goat or horse serum (for polyclonal antisera and monoclonal antibodies, respectively; Vector Laboratories Inc., Burlingame, CA) and 0.25% Triton-X (Merck, Darmstadt, Germany). The sections were then incubated for 48 h at 4°C with mouse anti-NeuN antibody (1:2000; Chemicon; MAB377, Temecula, CA, USA). Afterwards, sections were processed with a secondary biotinylated horse anti-mouse IgG antibody (1:200, Vector Laboratories, Burlingame, CA, USA), then incubated for 1 h in an avidin-biotin peroxidase complex (Vectastain ABC Elite PK6100, Vector) and, then, with the chromogen 3,3′-diaminobenzidine tetrahydrochloride (DAB; Sigma-Aldrich, St. Louis, MO, USA). Finally, sections were dehydrated, cleared with xylene and cover-slipped. NeuN-immunostained sections were used to identify the hippocampal areas, especially CA1 boundaries.
Double and triple immunofluorescence
To ascertain the possible relation between Aβ and PHF-Tau, some sections were double stained combining anti-Aβ and different anti-PHF-Tau antibodies. Selected sections were first treated with 88% formic acid (Sigma-Aldrich, No. 251364, St. Louis, MO, USA) to prepare them for plaque immunostaining, and then they were incubated in a solution containing mouse antibody anti-Aβ (clone 6F/3D; 1:50, Dako M0872, Glostrup, Denmark). These sections were also treated with anti-PHF-Tau antibodies to study tau pathology [35–37], using the following antibodies: anti-human PHF-Tau clone PHF1 pS396 (1:2000, Invitrogen Corp., 44752G Carlsbad, CA, USA) and anti-human PHF-Tau antibody clone AT8 pSer202+Thr205 (1:2000, MN1020, Thermo Scientific, Waltham, MA, USA). For the sake of clarity, we refer to these antibodies as: anti-PHFpS396 and anti-PHFAT8, respectively. The sections were incubated in a solution containing the following combinations of primary antibodies: anti-Aβ/anti-PHFpS396, anti-Aβ/anti-PHFAT8 and anti-PHFpS396/anti-PHFAT8. After rinsing in 0.1 M PB, sections were incubated for 2 h at room temperature in different solutions containing a goat anti-rabbit antibody coupled to Alexa Fluor 594 and a goat anti-mouse coupled to Alexa Fluor 488 (1:1000; Molecular Probes, Eugene, OR, USA). Finally, sections were treated with Autofluorescence Eliminator Reagent (Chemicon) to reduce or eliminate lipofuscin like-autofluorescence. The sections were then washed and mounted with ProLong Gold Antifade Reagent (Invitrogen Corp.). In addition, triple-labeled sections were used to examine the relationships between PHFpS396, PHFAT8 and plaques in the same sections. To perform this study, immunolabeled sections for both PHFpS396 and PHFAT8 were also stained with Methoxy-X04 reagent (10 mg/mL). Methoxy-X04 is a fluorescent histological marker (Xcess Biosciences Inc., San Diego, CA, USA) derivate of Congo Red which stains plaques in postmortem sections of AD brain tissue samples [38].
Image acquisition and analysis
Sections were examined with a Zeiss LSM 710 confocal laser scanning system (Carl Zeiss Microscopy GmbH, Jena, Germany). Fluorescence emission was recorded through separated channels. To analyze all plaques present in the double-stained sections containing the CA1 region, we obtained tiled image stacks recorded at 3μm z-interval through separate channels with a 40x oil-immersion lens (Objective Plan-Apochromat 40x NA, 1.3 Oil). The number of optical planes in the confocal stacks ranged from 12 to 20 planes. In addition, individual examination of every single plaque in triple-labeled sections was performed by acquisition of image stacks at 0.5–1μm z-interval through separate channels with the same lens described. The number of optical planes in the confocal stacks ranged from 34 to 69 planes.
Composite images to visualize the entire CA1 region analyzed were constructed combining the confocal image stacks recorded through the different channels using Zen software (ZEN 2012, Carl Zeiss Microscopy GmbH; Fig. 1). The same software was used to obtain Z projection images (image resolution: 1024×1024 pixels). In addition, every single plaque was individually evaluated to assess its specific staining (PHFpS396, PHFAT8, Aβ, or Methoxy-X04) using the same software package. The software used to compose figures was Adobe Photoshop (CS4, v11.0, Adobe Systems Incorporated, San Jose, CA, USA).
Fig. 1
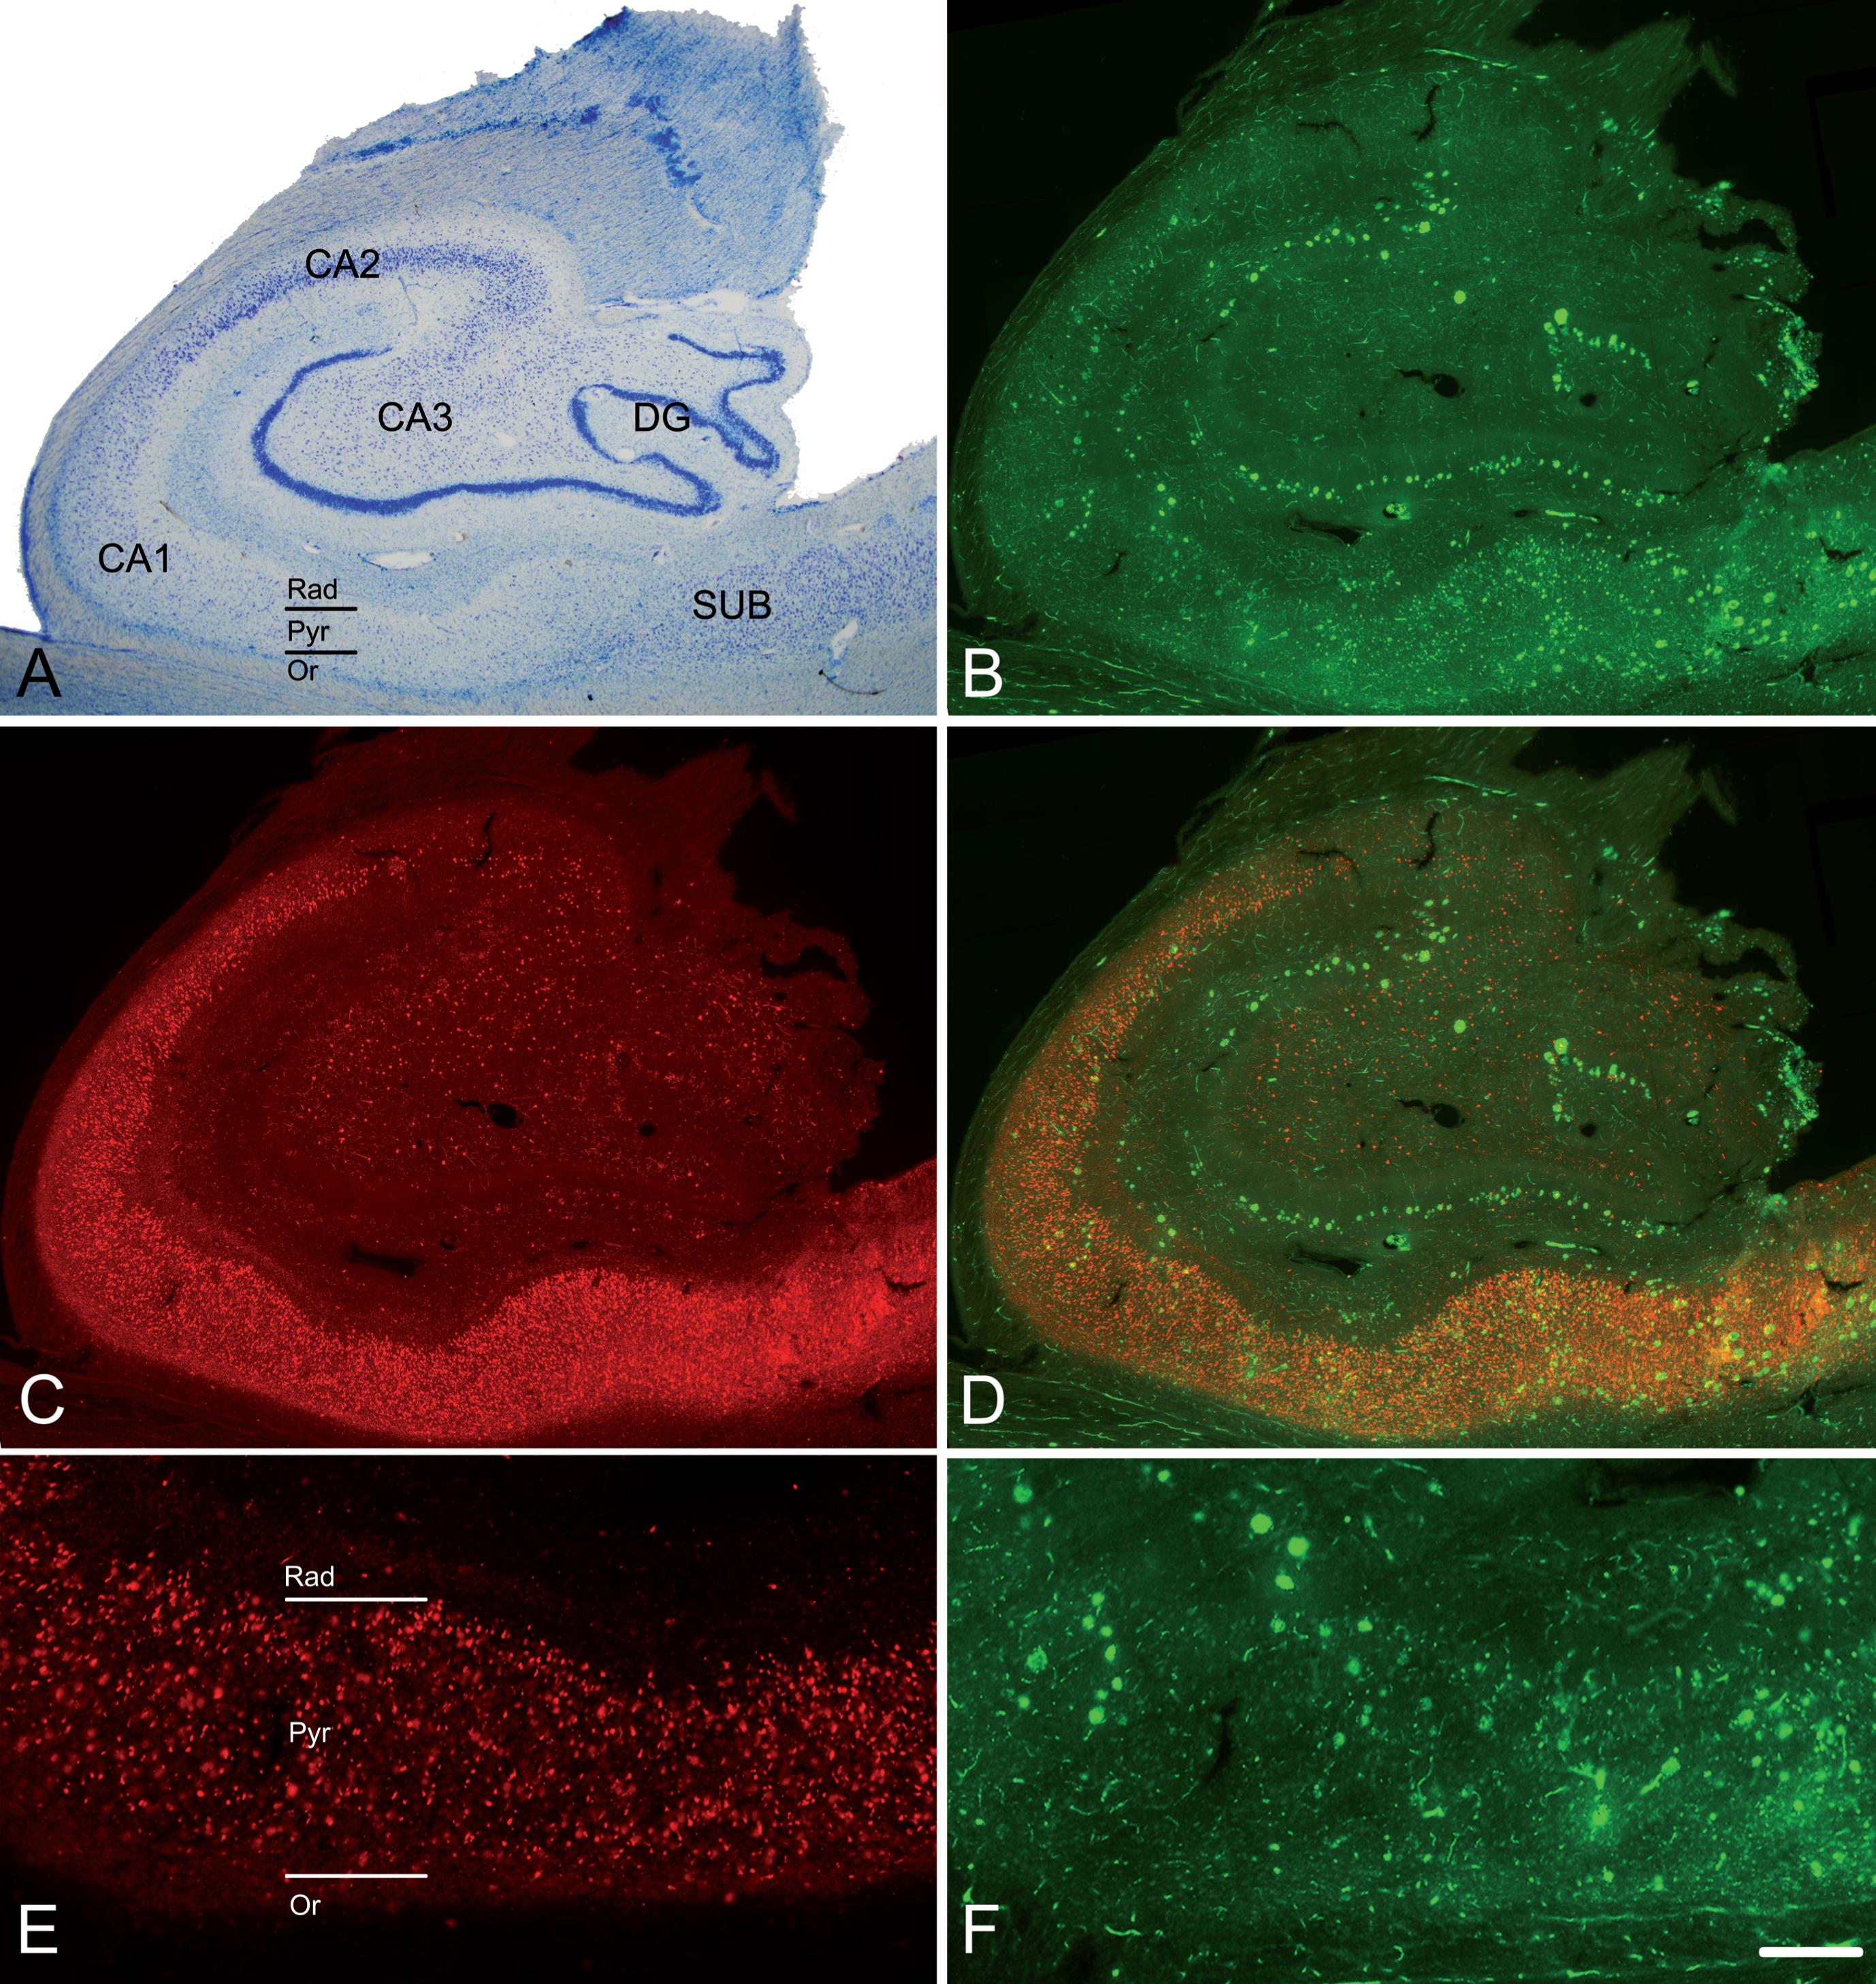
The hippocampal formation from an AD patient. A) Nissl-stained section from an AD patient (Az6) to illustrate the hippocampal fields. Note the neuronal loss in CA1. B) Confocal images showing immunostaining for anti-Aβ and C) anti-PHFpS396, taken from a double-immunostained section to illustrate the distribution pattern of Aβ-ir plaques and PHFpS396–ir neurons, respectively. D) Merge of both channels showing both anti-Aβ and anti-PHFpS396 antibody labeling. E, F) Higher magnification of the CA1 region to show the immunostaining pattern of PHFpS396–ir neurons (E) and Aβ-ir plaques (F). DG, dentate gyrus; CA1–CA3, cornu ammonis fields; SUB, subiculum; Rad, stratum radiatum; Pyr, stratum pyramidale; Or, stratum oriens. Scale bar (in F): 20μm in A; 25μm in B, C, D; 50μm in E, F.
Sections treated with antibodies against both isoforms of PHF-Tau were analyzed with Imaris software (7.1.5 Bitplane AG, Zurich, Switzerland) to estimate the number of neurons expressing PHFpS396 and/or PHFAT8. Briefly, this analysis consisted of the semiautomatic segmentation of neurons by the placement of spots of 20μm diameter (average size of a neuronal soma) in each immunolabeled neuron. Spots of different colors were used to mark PHFpS396, PHFAT8 neurons and those expressing both markers.
RESULTS
For the sake of clarity, in the present study we shall use the terms “co-localization” and “co-expression” to refer to the co-labeling of staining in plaques and neurons, respectively. In the case of plaques, their staining using two or more markers were considered to be co-localized when the different labeled elements of the plaques showed a full or partial spatial overlap. In the case of neurons, co-expression of two markers refers to when the two markers were located in the same neuron.
We have mapped the expression patterns of Aβ-ir and PHF-Tau-ir in plaques of six AD patients (Az1–Az6) using Zen software (ZEN 2012, Carl Zeiss Microscopy GmbH), which provides the three-dimensional location of the labeled plaques in all acquired channels. The whole CA1 field was studied, and the examined area ranged from 1.14 to 8.8 mm2 per case. Moreover, the study of neurons containing PHFpS396-ir and PHFAT8-ir was also performed in the whole CA1 in these same AD patients using the Imaris package.
In addition, plaques were studied in sections simultaneously labeled with both anti-PHF-Tau antibodies and Methoxy-X04 staining. These triple-immunostained sections (Methoxy-X04/PHFpS396/PHFAT8) were used to study the co-localization patterns of Aβ and PHF-Tau in CA1 plaques, in eleven AD patients (Az1–Az11) to provide information of their co-localization within plaques.
Plaque distribution in CA1
Immunostaining with anti-Aβ antibody revealed the presence of numerous plaques in all examined AD patients.
First, we analyzed the distribution of Aβ-labeled plaques in double-immunostained sections using three different combinations: Aβ/PHFpS396, Aβ/PHFAT8, and PHFpS396/PHFAT8 (Fig. 1). CA1 was arbitrarily subdivided into three equal portions: proximal (closer to CA2), medial and distal (closer to the subiculum), as previously described [39]. In addition, plaques were categorized according to their position in different CA1 strata (Figs. 1A, 1E, 2): oriens, pyramidale, radiatum, and lacunosum-moleculare. However, the stratum lacunosum-moleculare was not further considered since we did not observe the presence of plaques in this stratum (Fig. 3). The precise location of each analyzed plaque in CA1 was determined (Fig. 2). Briefly, most plaques (41%) were located in the medial portion of the CA1 pyramidal layer, followed by the distal CA1 portion (37%) and proximal portion (22%; Table 2). In addition, the pyramidal layer contained most of the plaques (84%), in agreement with previous reports [40], while in the stratum oriens, plaques were very scarce (1%).
Fig. 2
Maps of the hippocampal formation from AD patients to illustrate plaque distribution and staining patterns in CA1. Plots are based on the analysis of double-immunostained sections for anti-Aβ and anti-PHF-Tau antibodies. Borders between hippocampal fields are indicated by lines. CA1 is marked with a rectangle. Below each section profile, CA1 is shown schematically with its corresponding subregions and layers. Green dots correspond to Aβ-ir plaques, red dots to PHF-Tau-ir plaques (either PHFpS396 or PHFAT8), and yellow dots indicate plaques expressing both Aβ and PHF-Tau proteins. A–F) Representative drawings from patients Az1, Az2, Az3, Az4, Az5 and Az6, respectively. DG, dentate gyrus; CA1–CA3, cornu ammonis fields; SUB, subiculum; Prox, proximal; Med, medial; Dist, distal; Or, stratum oriens; Pyr, stratum pyramidale; Rad, stratum radiatum. Scale bar (in F): 2000μm.
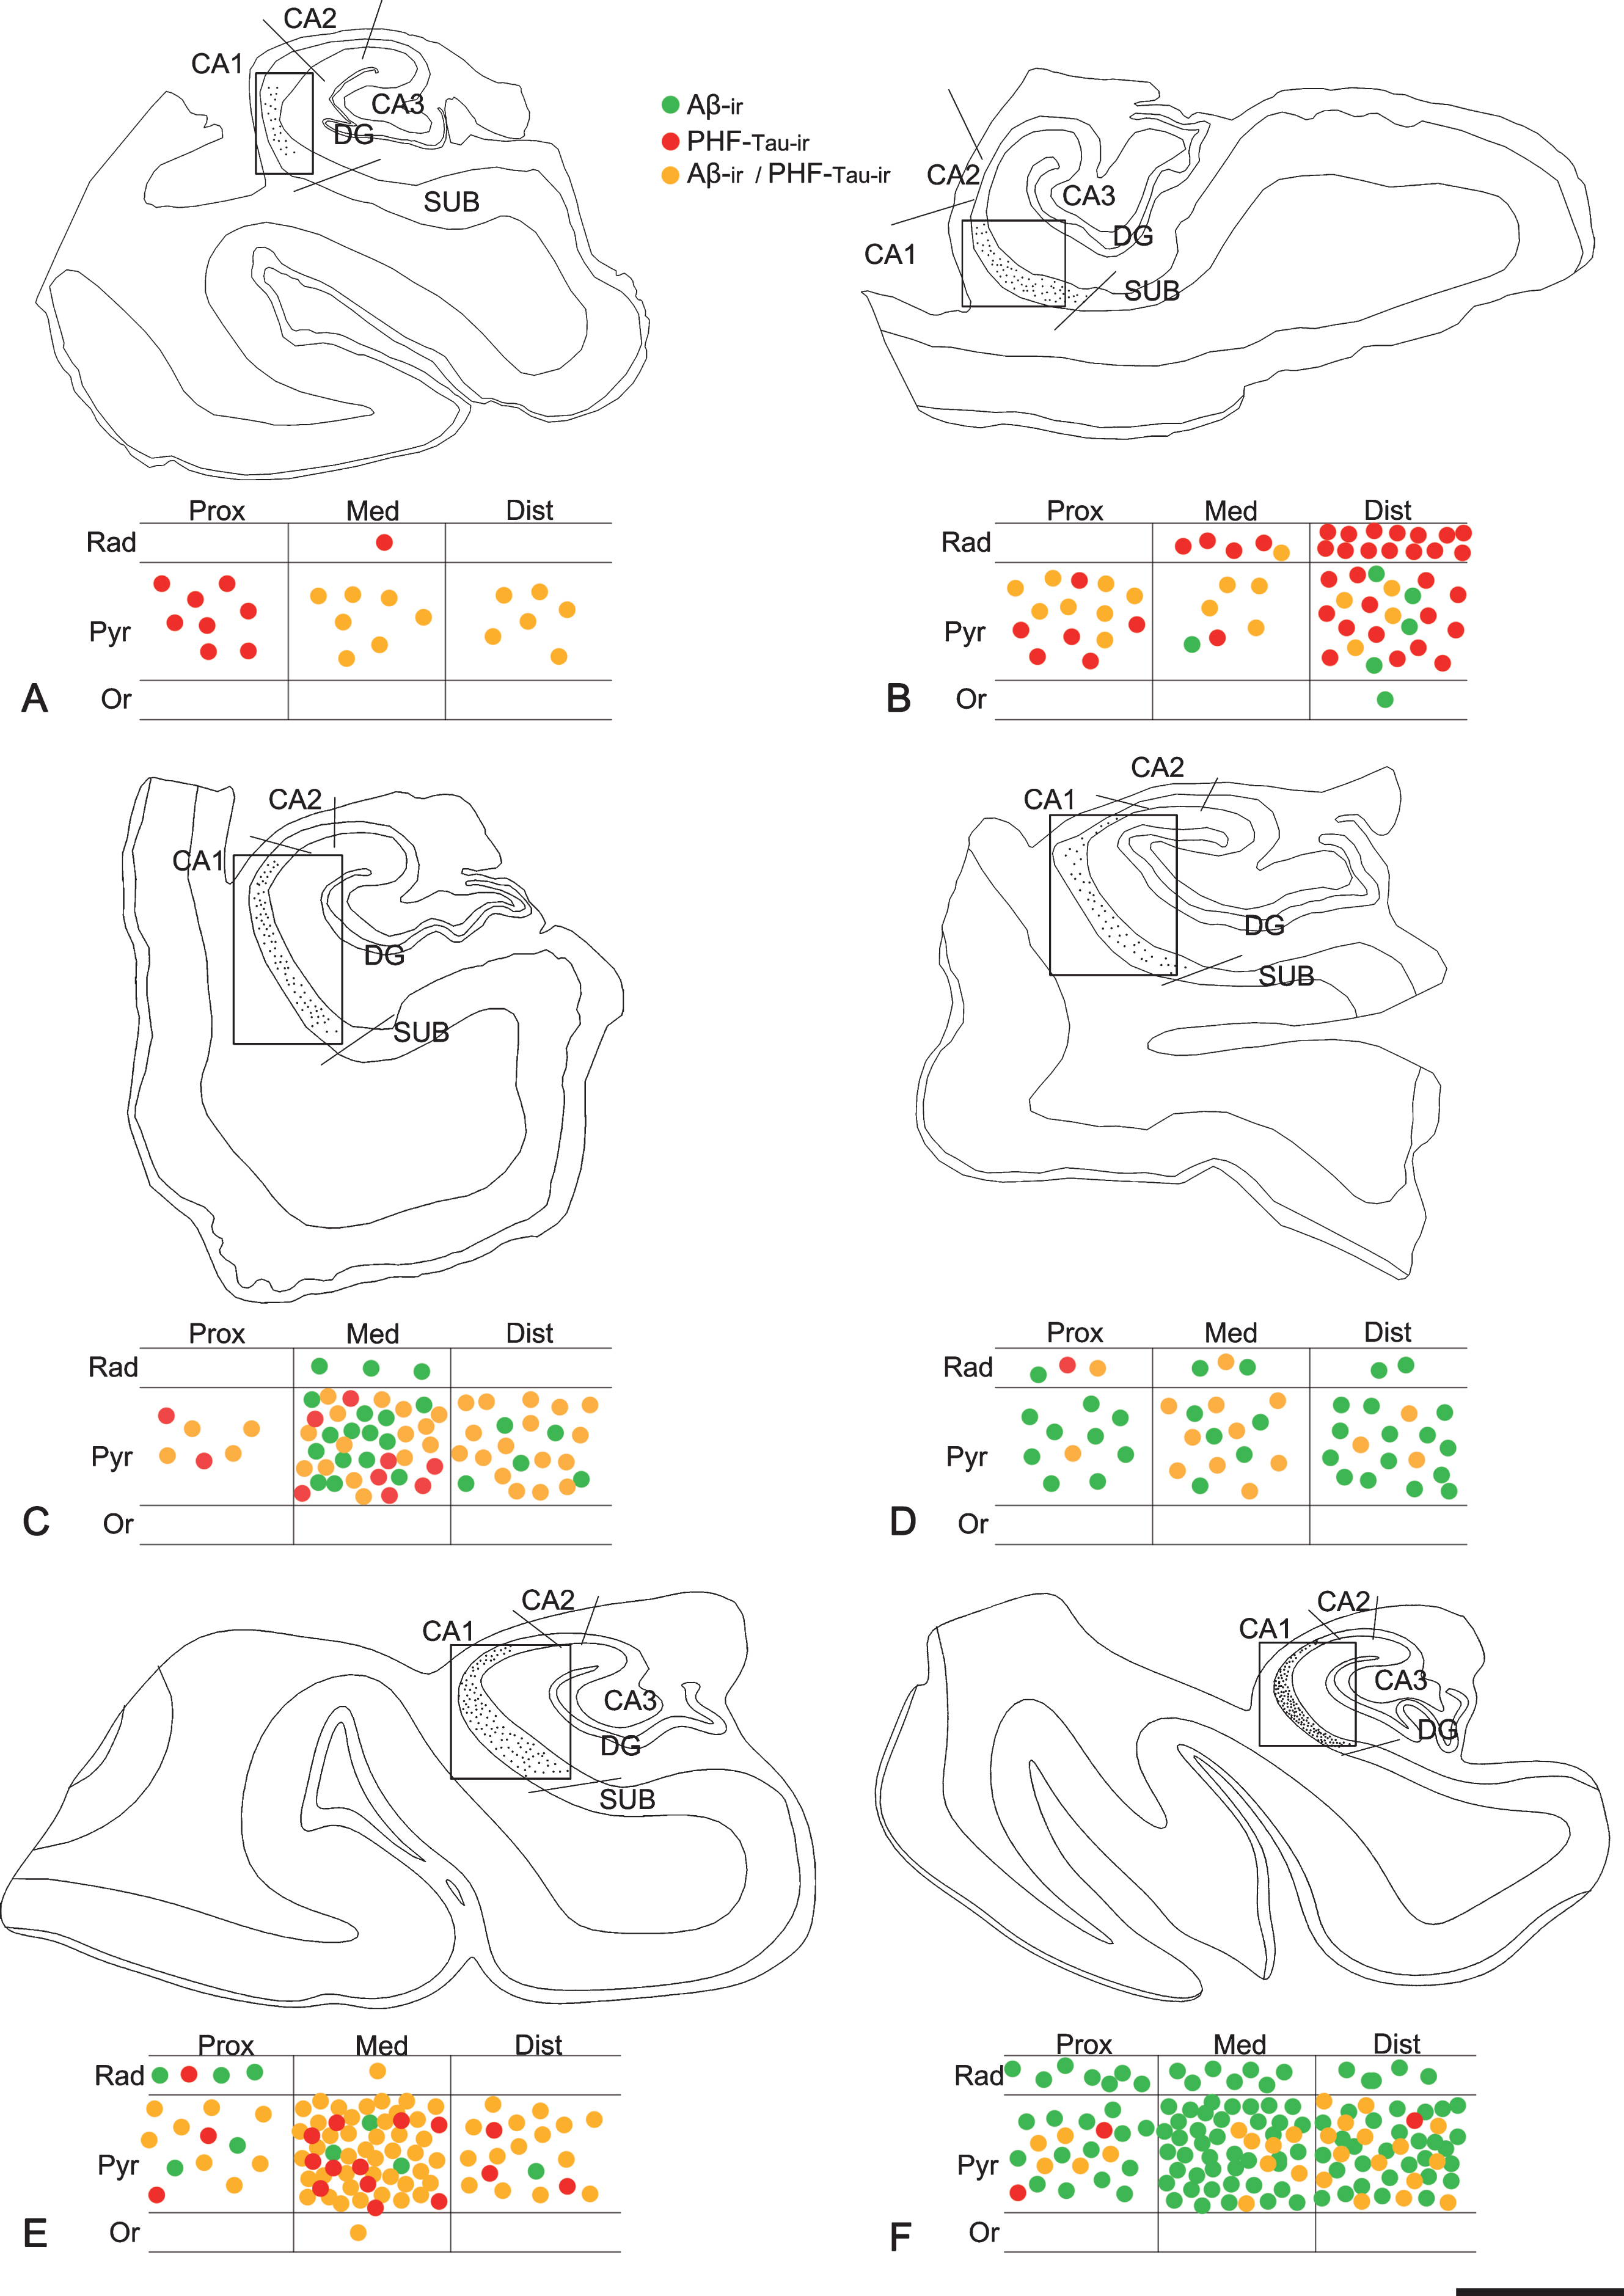
Fig. 3
Photomicrograph of the hippocampal formation from an AD patient in a double-stained section (Nissl and anti-Aβ). A) Low-power microphotograph to illustrate the hippocampal fields. B) Higher magnification of the boxed area in A, showing the distribution of plaques by layer in CA1 (Lac-mol, stratum lacunosum-moleculare; Rad, stratum radiatum; Pyr, stratum pyramidale; Or, stratum oriens). Note that no plaques are visualized in stratum lacunosum-moleculare or in oriens. DG, dentate gyrus; CA1–CA3, cornus ammonis fields; SUB, subiculum. Scale bar: 1000μm (in B); 860μm (in A).
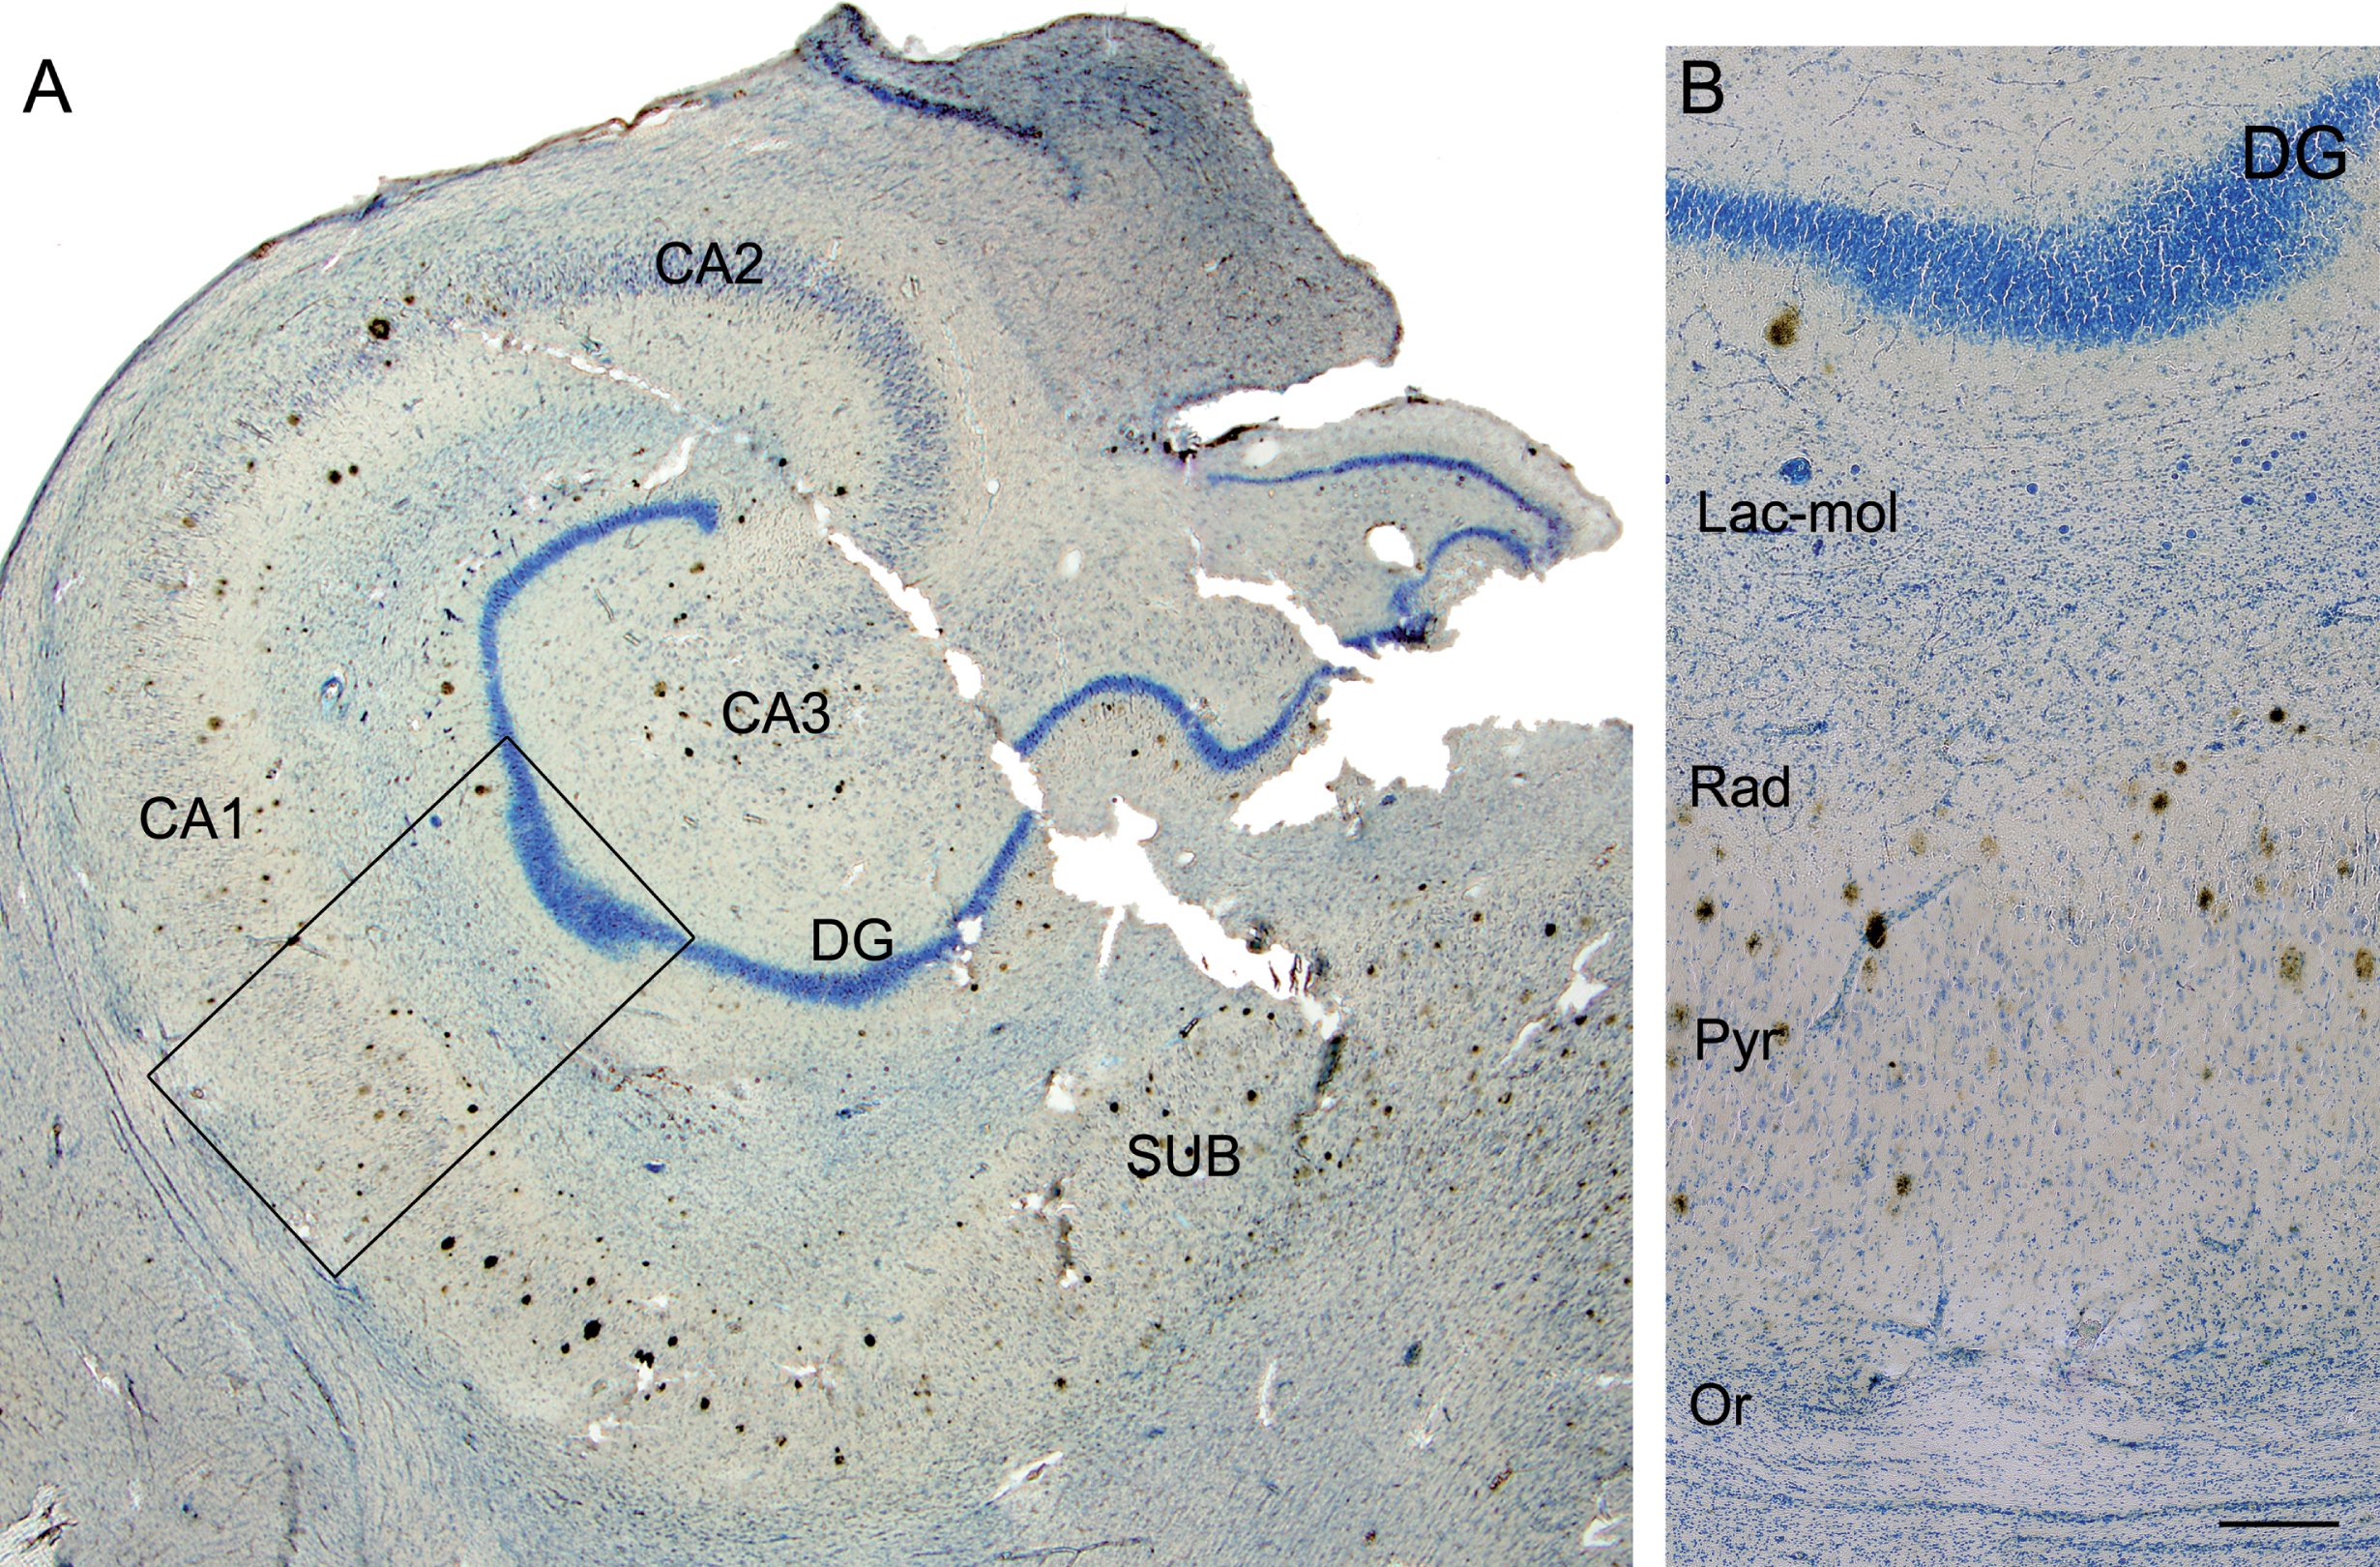
Table 2
Summary of identified plaques in the CA1 region according to location per subregion and stratum
| S. Oriens | S. Pyramidal | S. Radiatum | Total | |
| Proximal | 0 | 113 | 25 | 138 (22%) |
| Medial | 1 | 215 | 38 | 254 (41%) |
| Distal | 6 | 194 | 31 | 231 (37%) |
| Total | 7 (1%) | 522 (84%) | 94 (15%) | 623 (100%) |
[i] Data represent the number of plaques labeled with Aβ/PHFpS396, Aβ/PHFAT8 or PHFpS396/PHFAT8; see Table 3 for more details. Numbers in brackets indicate their relative percentages.
Table 3
Number of CA1 labeled plaques, per case, analyzed in double-immunostained sections
| Aβ/PHFpS396 | Aβ/PHFAT8 | PHFpS396/PHFAT8 | ||||||
| Patient | Aβ-ir/ PHFpS396-ir | Aβ-ir | PHFpS396-ir | Aβ-ir/ PHFAT8-ir | Aβ-ir | PHFAT8-ir | PHFpS396-ir/ PHFAT8-ir | Total plaques |
| Az1 | NA | NA | NA | 6 | 7 | 8 | NA | 21 |
| Az2 | 13 | 19 | 2 | 5 | 21 | 5 | 24 | 89 |
| Az3 | 38 | 23 | 11 | NA | NA | NA | 68 | 140 |
| Az4 | 6 | 24 | 0 | 4 | 13 | 1 | 15 | 63 |
| Az5 | 42 | 5 | 3 | 30 | 1 | 13 | 59 | 153 |
| Az6 | 24 | 40 | 1 | 5 | 62 | 2 | 23 | 157 |
| Total | 123 | 111 | 17 | 50 | 104 | 29 | 189 | 623 |
[i] Three different combinations of antibodies were used: Aβ/PHFpS396, Aβ/PHFAT8 and PHFpS396/PHFAT8. In the combination of anti-PHFpS396 and anti-PHFAT8, all analyzed plaques expressed both isoforms (PHFpS396 and PHFAT8). NA, data not available.
Co-localization of Aβ and PHF-Tau in CA1 plaques
We characterized CA1 plaques according to their labeling with Aβ markers and PHF-Tau antibodies using double and triple staining.
Co-localization of Aβ and PHF-Tau proteins in double-stained sections
First, we examined the co-expression of Aβ with PHFpS396 and Aβ with PHFAT8. A total of 251 plaques were examined in double-stained sections for Aβ/PHFpS396 (Fig. 4). Most of them (93%) were identified with anti-Aβ, with this percentage breaking down into 44% displaying only Aβ-ir, and 49% showing both Aβ-ir/PHFpS396-ir (Fig. 5A). Thus, only 7% of plaques did not display anti-Aβ, and they were identified only with anti-PHFpS396 (Figs. 4B, 5A). In the case of double-stained sections for Aβ/PHFAT8, we analyzed a total of 183 plaques, of which 84% were identified with anti-Aβ (comprising 57% displaying only Aβ-ir and 27% showing both Aβ-ir/PHFAT8-ir), whereas 16% of the plaques were identified only with anti-PHFAT8 (Figs. 4D, 5B).
Fig. 4
Plaque expression patterns in double-stained hippocampal sections. Trios of confocal stack projection images taken from Aβ/PHFpS396 double-immunostained sections (A, B, E) and from Aβ/PHFAT8 double-immunostained sections (C, D). Plaques expressing both Aβ and PHFpS396, as well as Aβ and PHFAT8 are shown in A and C, respectively. Images illustrate plaques expressing only PHFpS396 (B) and PHFAT8 (D). A plaque which only displays anti-Aβ is shown in E. Scale bar (in E): 50μm.
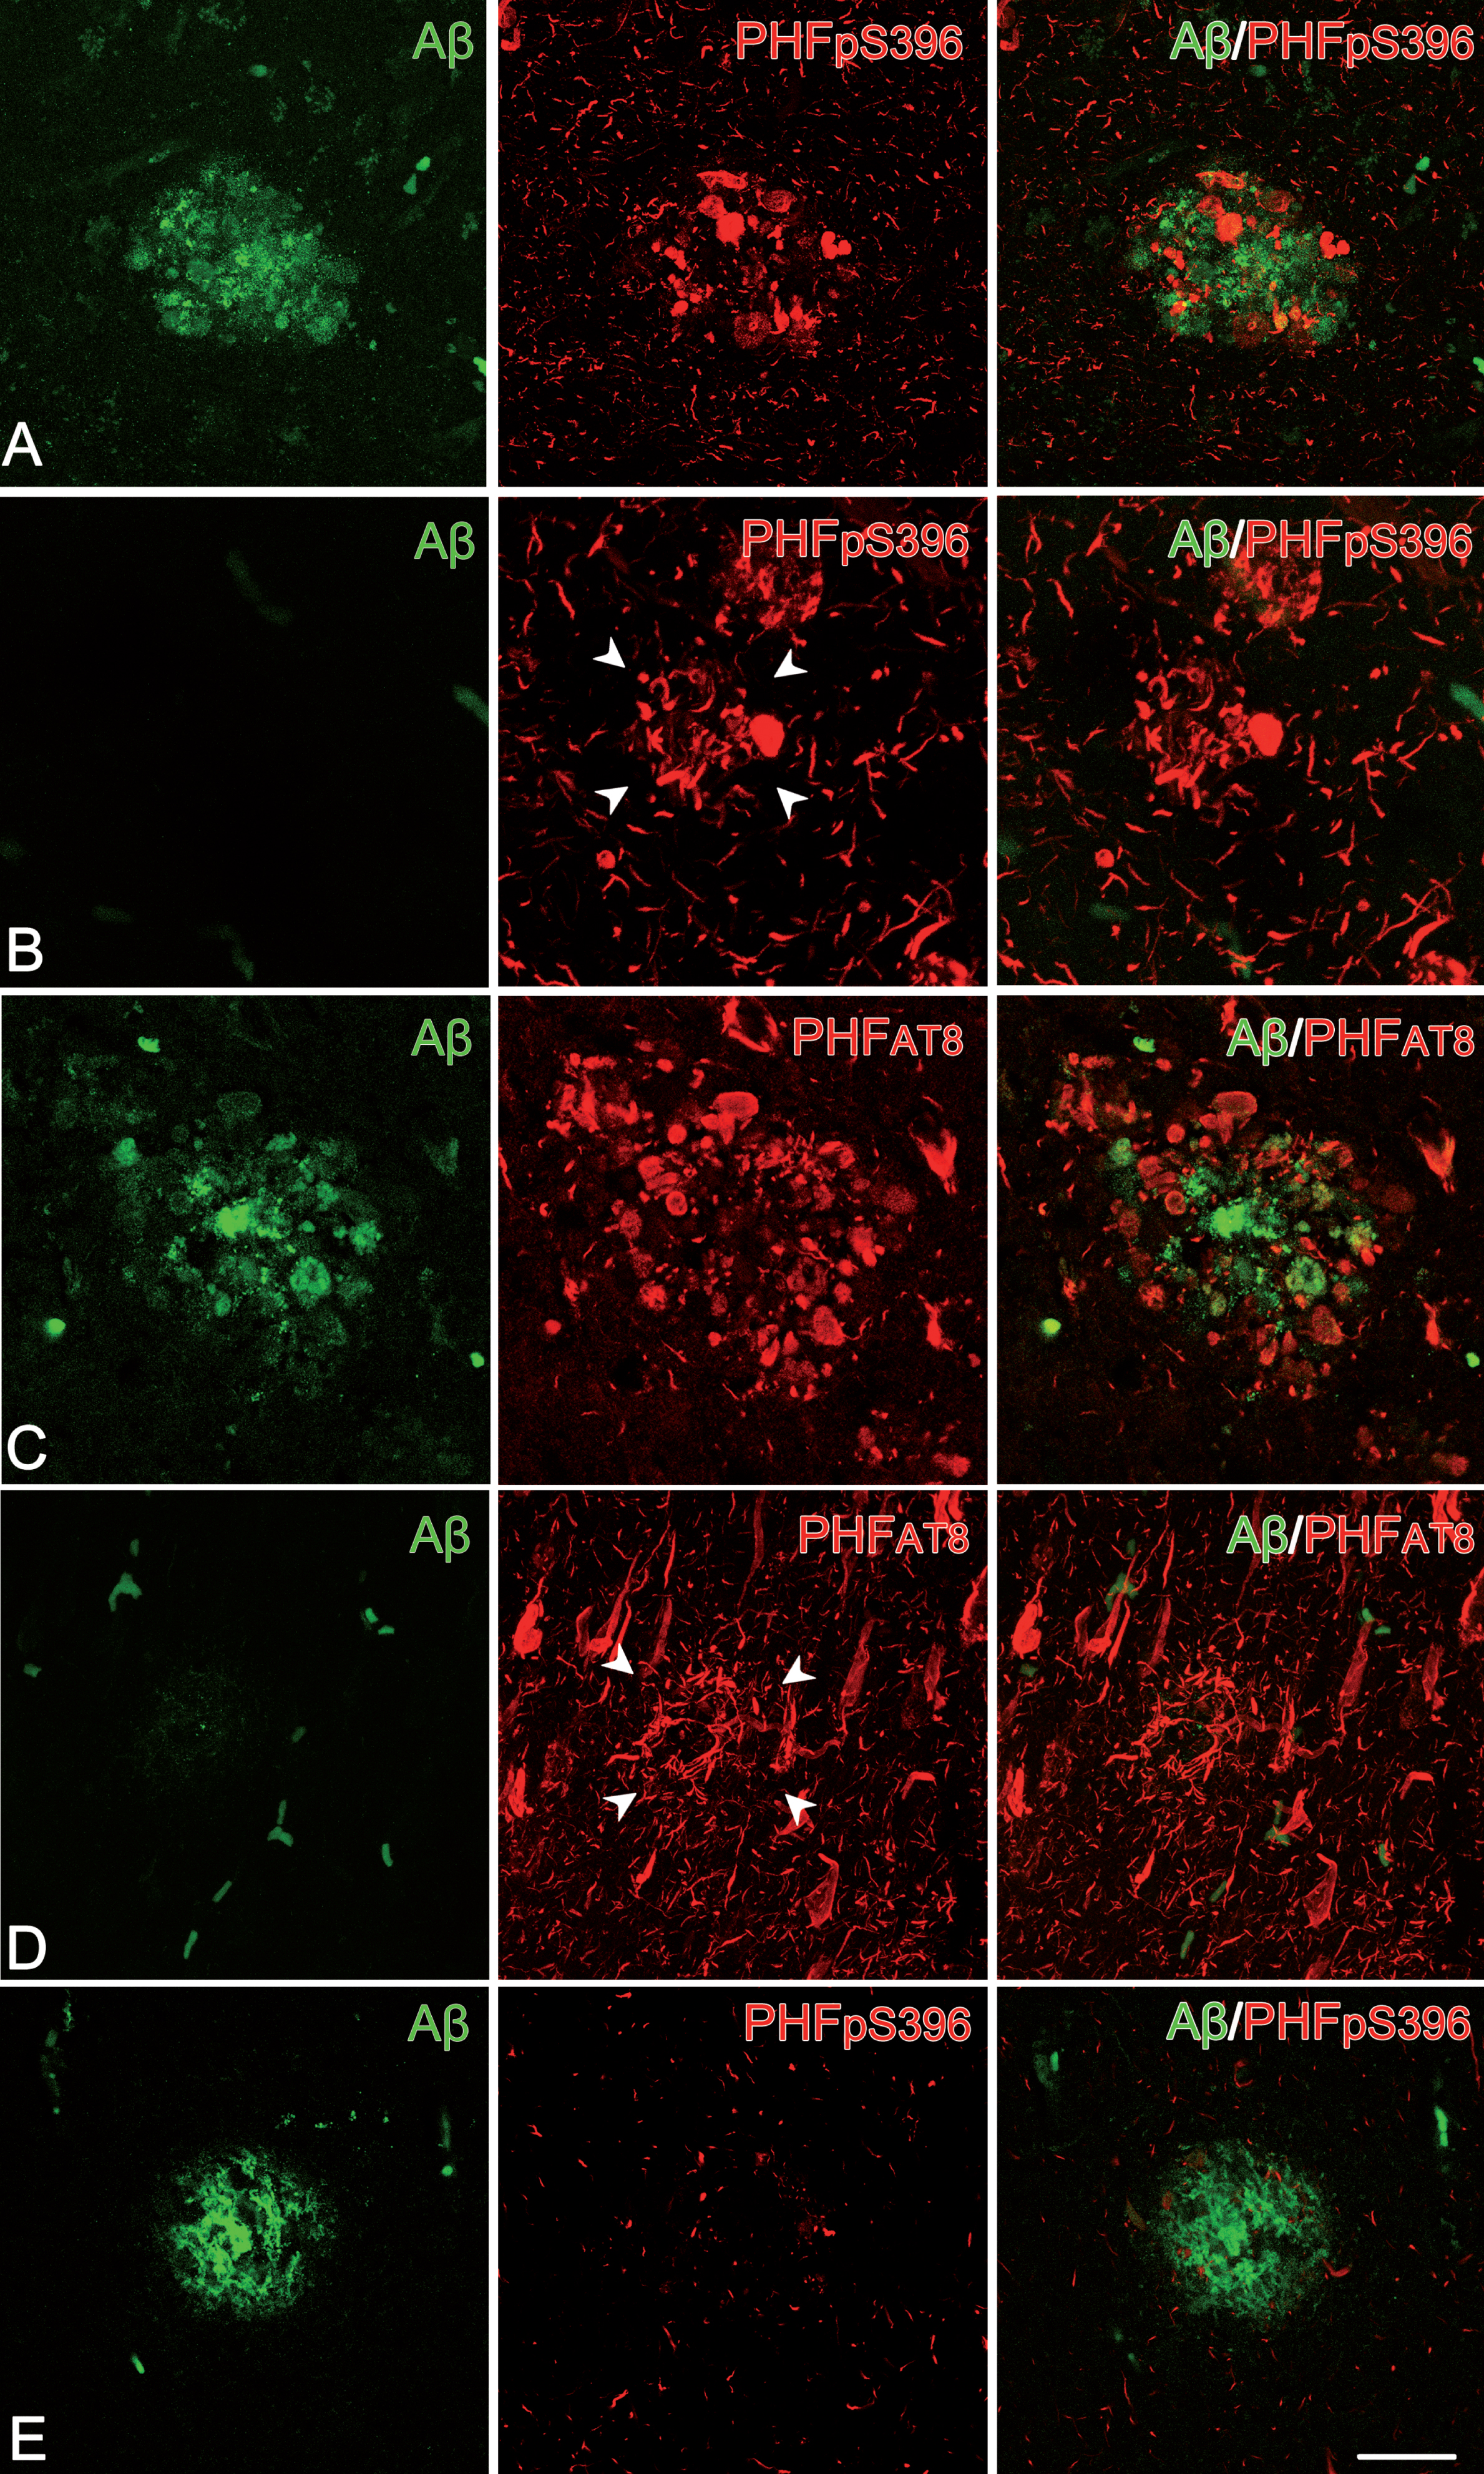
Fig. 5
Pie charts showing the percentages of labeled plaques in double immunostaining studies: Aβ/PHFpS396 (A) and Aβ/PHFAT8 (B) combinations are shown. Both analyses displayed a higher proportion of plaques showing Aβ-ir and a much-reduced portion of negative Aβ plaques.
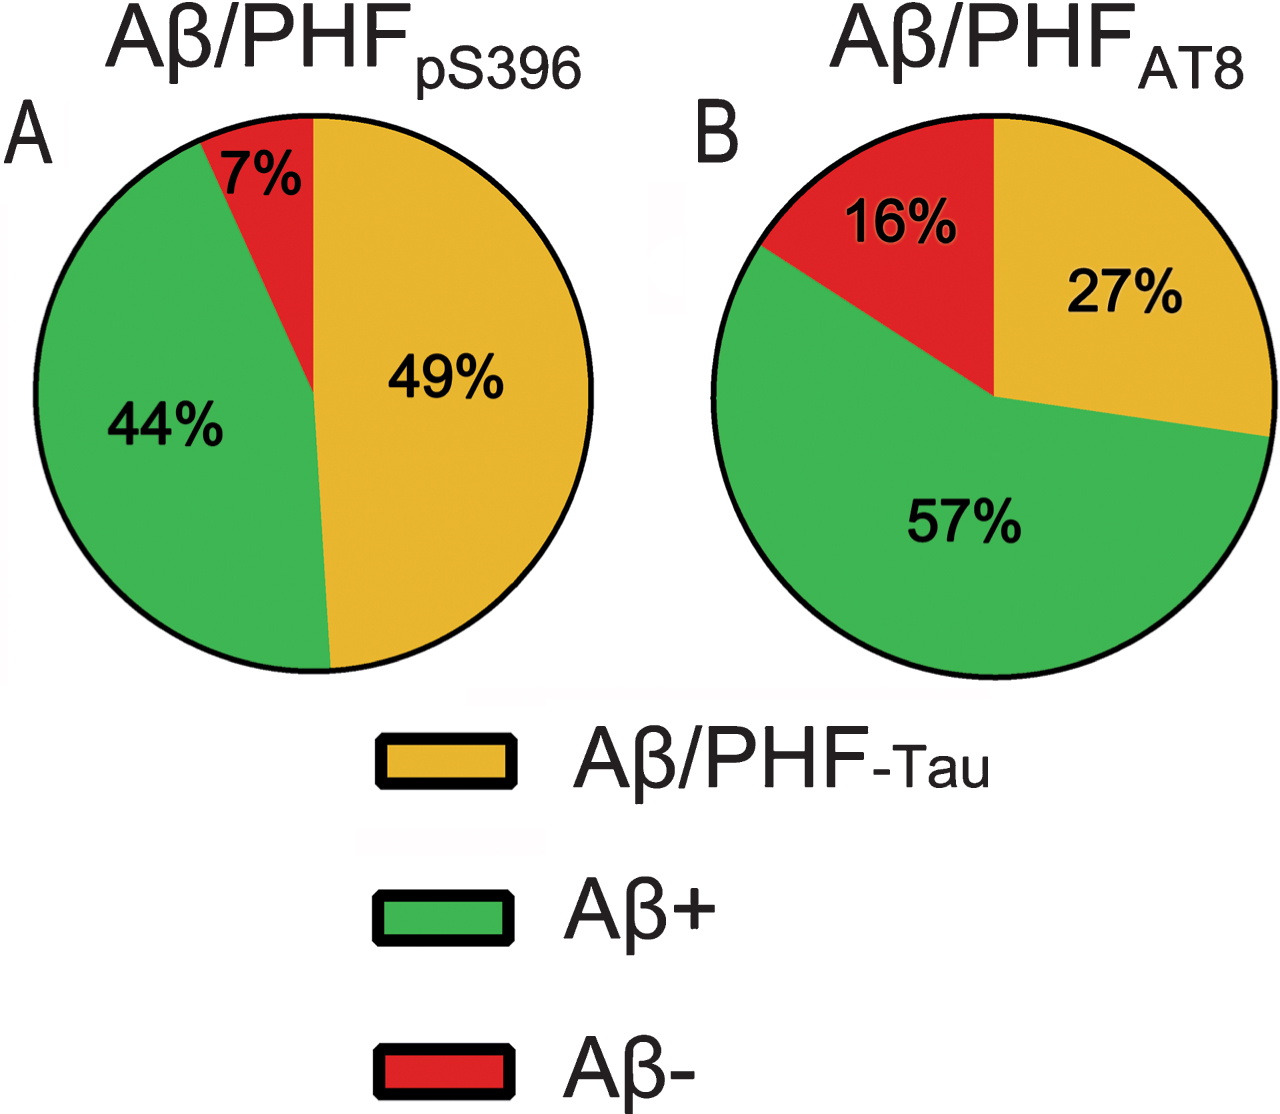
Since we observed plaques that did not show Aβ-ir (Figs. 4B, 4D, 5) the next step was to analyze double-immunostained sections for both isoforms of PHF-Tau: combining PHFpS396 and PHFAT8 antibodies. We identified a total of 189 plaques, all of which (100%) were labeled for both PHF-Tau antibodies (Table 3).
In summary, double staining analysis indicated that most of the CA1 plaques were Aβ-ir (89%), and a low percentage of plaques did not contain Aβ, while anti-PHFpS396 and anti-PHFAT8 antibodies were expressed in 7% and 16% of the plaques, respectively. Since sections marked with PHFpS396/PHFAT8 revealed 100% co-localization, it would appear that plaques visualized with either of the two PHF-Tau isoforms would co-localize with the other.
Co-localization of Aβ and PHF-Tau in triple-labeled sections
In order to confirm our results obtained with double-stained sections, triple-stained sections for Methoxy-X04/anti-PHFpS396/anti-PHFAT8 were analyzed (Fig. 6). As mentioned above, Methoxy-X04 staining is a good tool to visualize plaques in brain sections from AD patients [38].
Fig. 6
Confocal stack projection images from triple-stained (Methoxy-X04/anti- PHFpS396/anti-PHFAT8) hippocampal sections. In A and B, plaques do not express any anti-PHF-Tau isoform but they show staining for Methoxy-X04, which indicates the presence of Aβ. C and D: examples of labeled plaques showing the three markers — Methoxy-X04 / anti-PHFpS396 / anti-PHFAT8. Scale bar (in D): 50μm.
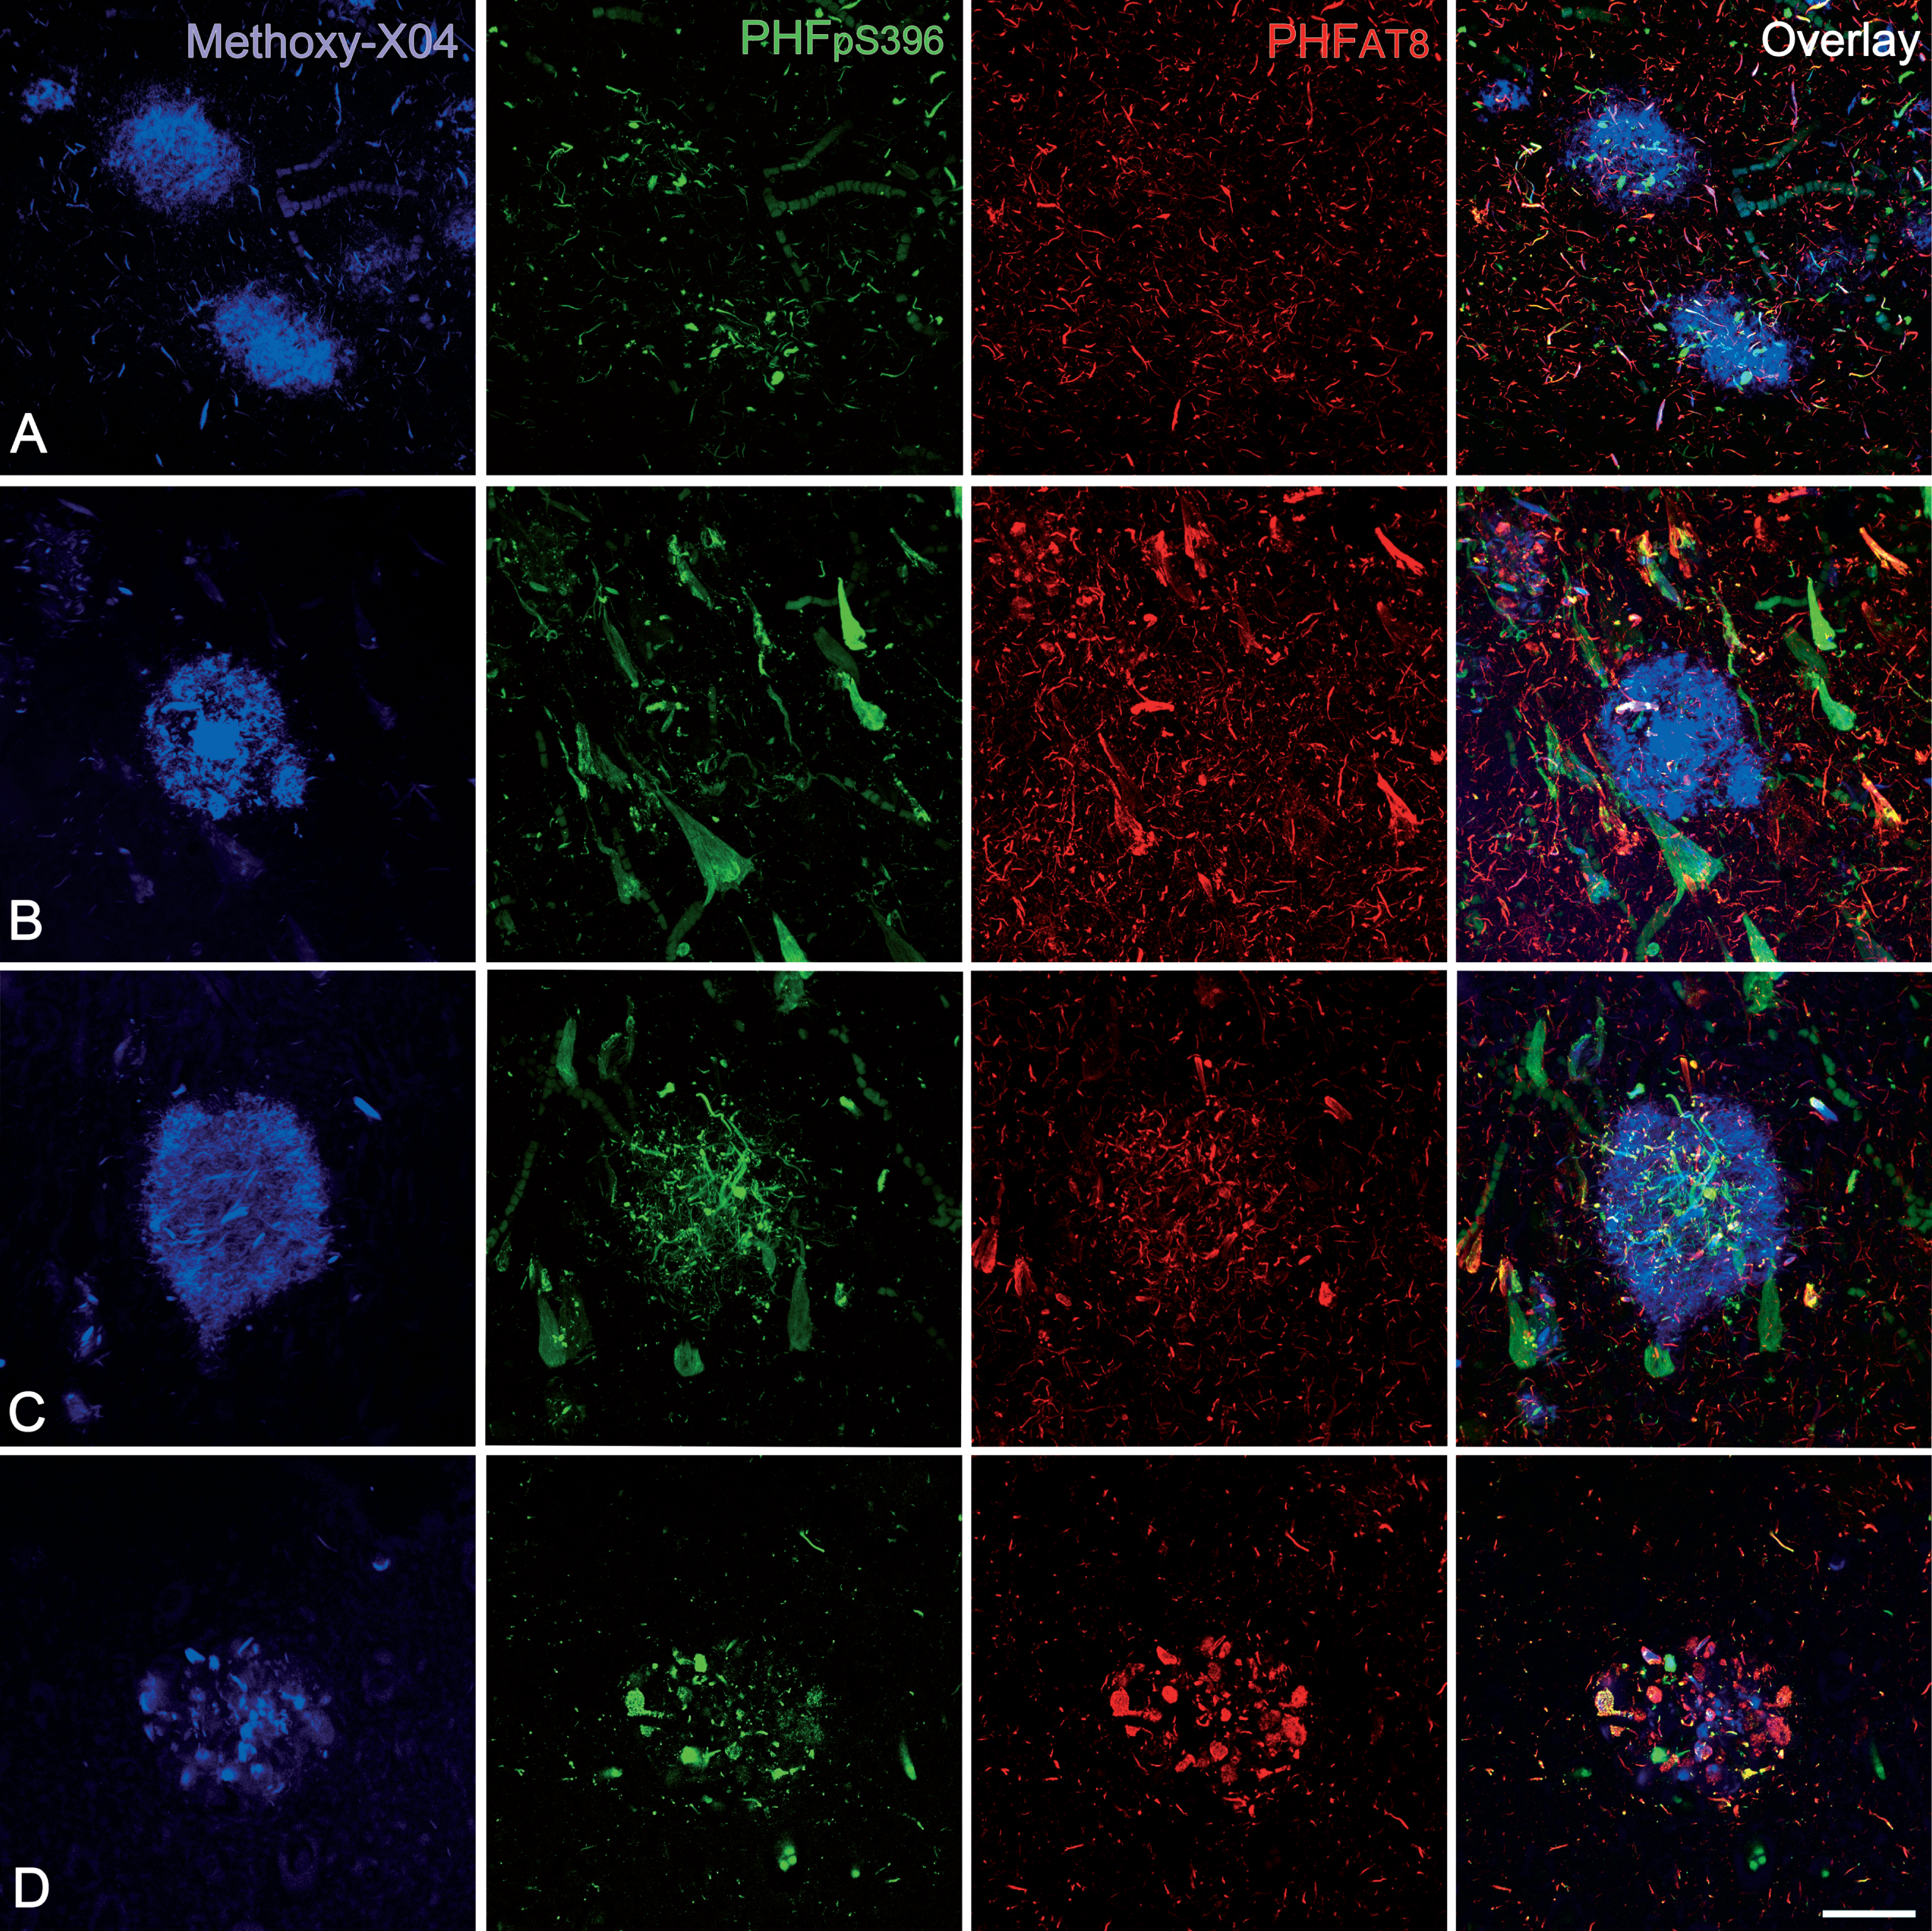
Out of a total of 113 Methoxy-X04 stained plaques (Fig. 6; Table 4), 75% did not express any PHF-Tau isoform. Yet, 25% of Methoxy-X04-labeled plaques showed triple labeling (Methoxy-X04/anti-PHFpS396/anti-PHFAT8), that is, they were labeled for both PHF-Tau isoforms and Aβ. These results are in line with the double labeling experiments described above.
Table 4
Number of CA1 labeled plaques, per case, analyzed in triple-stained sections for Methoxy-X04, anti-PHFpS396, and anti-PHFAT8. Numbers in brackets represent the relative percentages of labeled plaques
| Patient | Methoxy-X04/ PHFpS396-ir/ PHFAT8-ir | Methoxy-X04/ PHFpS396-ir | Methoxy-X04/ PHFAT8-ir | PHFpS396-ir/ PHFAT8-ir | Methoxy X-04 | Total plaques |
| Az1 | 3 | 0 | 0 | 0 | 7 | 10 |
| Az2 | 3 | 0 | 0 | 0 | 4 | 7 |
| Az3 | 4 | 0 | 0 | 0 | 5 | 9 |
| Az4 | 2 | 0 | 0 | 0 | 11 | 13 |
| Az5 | 9 | 0 | 0 | 0 | 3 | 12 |
| Az6 | 1 | 0 | 0 | 0 | 8 | 9 |
| Az7 | 2 | 0 | 0 | 0 | 6 | 8 |
| Az8 | 2 | 0 | 0 | 0 | 8 | 10 |
| Az9 | 0 | 0 | 0 | 0 | 17 | 17 |
| Az10 | 2 | 0 | 0 | 0 | 9 | 11 |
| Az11 | 0 | 0 | 0 | 0 | 7 | 7 |
| Total | 28 (25%) | 0 | 0 | 0 | 85 (75%) | 113 |
Plaque morphology
To determine the morphological features of the stained plaques, a total of 500 plaques were examined in confocal images from double-stained (387 plaques) and triple-stained (113 plaques) sections in all cases. All of them showed labeled Aβ deposits, which could be classified into two basic types accordingly to our previous study [41]: plaques with a round, dense, darkly stained nucleus or central region that was surrounded by a slightly stained halo were classified as “cored neuritic plaques”. Those plaques without a differentiated center were considered as “non-cored neuritic plaques”. In the present study, 13% were identified as cored plaques, and 87% as non-cored plaques. These proportions were similar in plaques labeled only with Aβ or with both Aβ and PHF-Tau markers (χ2 test, p > 0.5; Table 5).
Table 5
Number of CA1 examined plaques according to labelling (in double- and triple-stained sections) and morphology as cored and non-cored neuritic plaques. Numbers in brackets represent the relative percentages of plaques
| Staining | Labeling | Cored | Non-cored |
| Aβ/PHFpS396 | Aβ-ir/PHFpS396-ir | 15 (12.2%) | 108 (87.8%) |
| Aβ-ir | 11 (10%) | 100 (90%) | |
| Aβ/PHFAT8 | Aβ-ir/PHFAT8-ir | 6 (12.2%) | 43 (87.8%) |
| Aβ-ir | 14 (13.5%) | 90 (86.5%) | |
| Methoxy-X04/ | Methoxy-X04/ | ||
| PHFAT8 | PHFpS396-ir/ PHFAT8-ir | 4 (14.3%) | 24 (85.7%) |
| Methoxy-X04 | 11 (12.9%) | 74 (87.1%) | |
| 61 (12.2%) | 439 (87.8%) |
Distribution and co-expression of PHFpS396/PHFAT8 in CA1 neurons
The distribution of CA1 neurons that co-expressed PHFpS396 and PHFAT8 was examined in double-immunostained sections. A total of 5678 PHF-Tau-ir neurons were analyzed and the vast majority of them were identified as pyramidal neurons. A detailed study of every labeled neuron was performed to determine its location within the pyramidal layer of CA1 (Fig. 7). Most neurons (41%) were located in medial portions of CA1 pyramidal layer, followed by the distal (33%), and proximal portions (26%; Table 6). This distribution was similar to the plaque distribution described above. The labeled neurons appeared to be equally distributed in the superficial and deep aspects of the pyramidal cell layer.
Fig. 7
Analysis of the distribution and expression of PHF-Tau-ir neurons using Imaris software. A) Confocal microscopy image showing a double-immunostained section for PHFpS396 (green) and PHFAT8 (red) antibodies, in CA1 region from patient Az4. The entire CA1 region can be visualized. B) Spots are assigned to each neuron, easily visualized when confocal channels are turned off. C) The rectangle is a higher magnification of the region marked by the arrowheads in B. The different spot colors correspond to PHFpS396-ir neurons (green), PHFAT8-ir neurons (red), and coexpressing neurons (yellow). Scale bar: 200μm (in B); 50μm in (C).
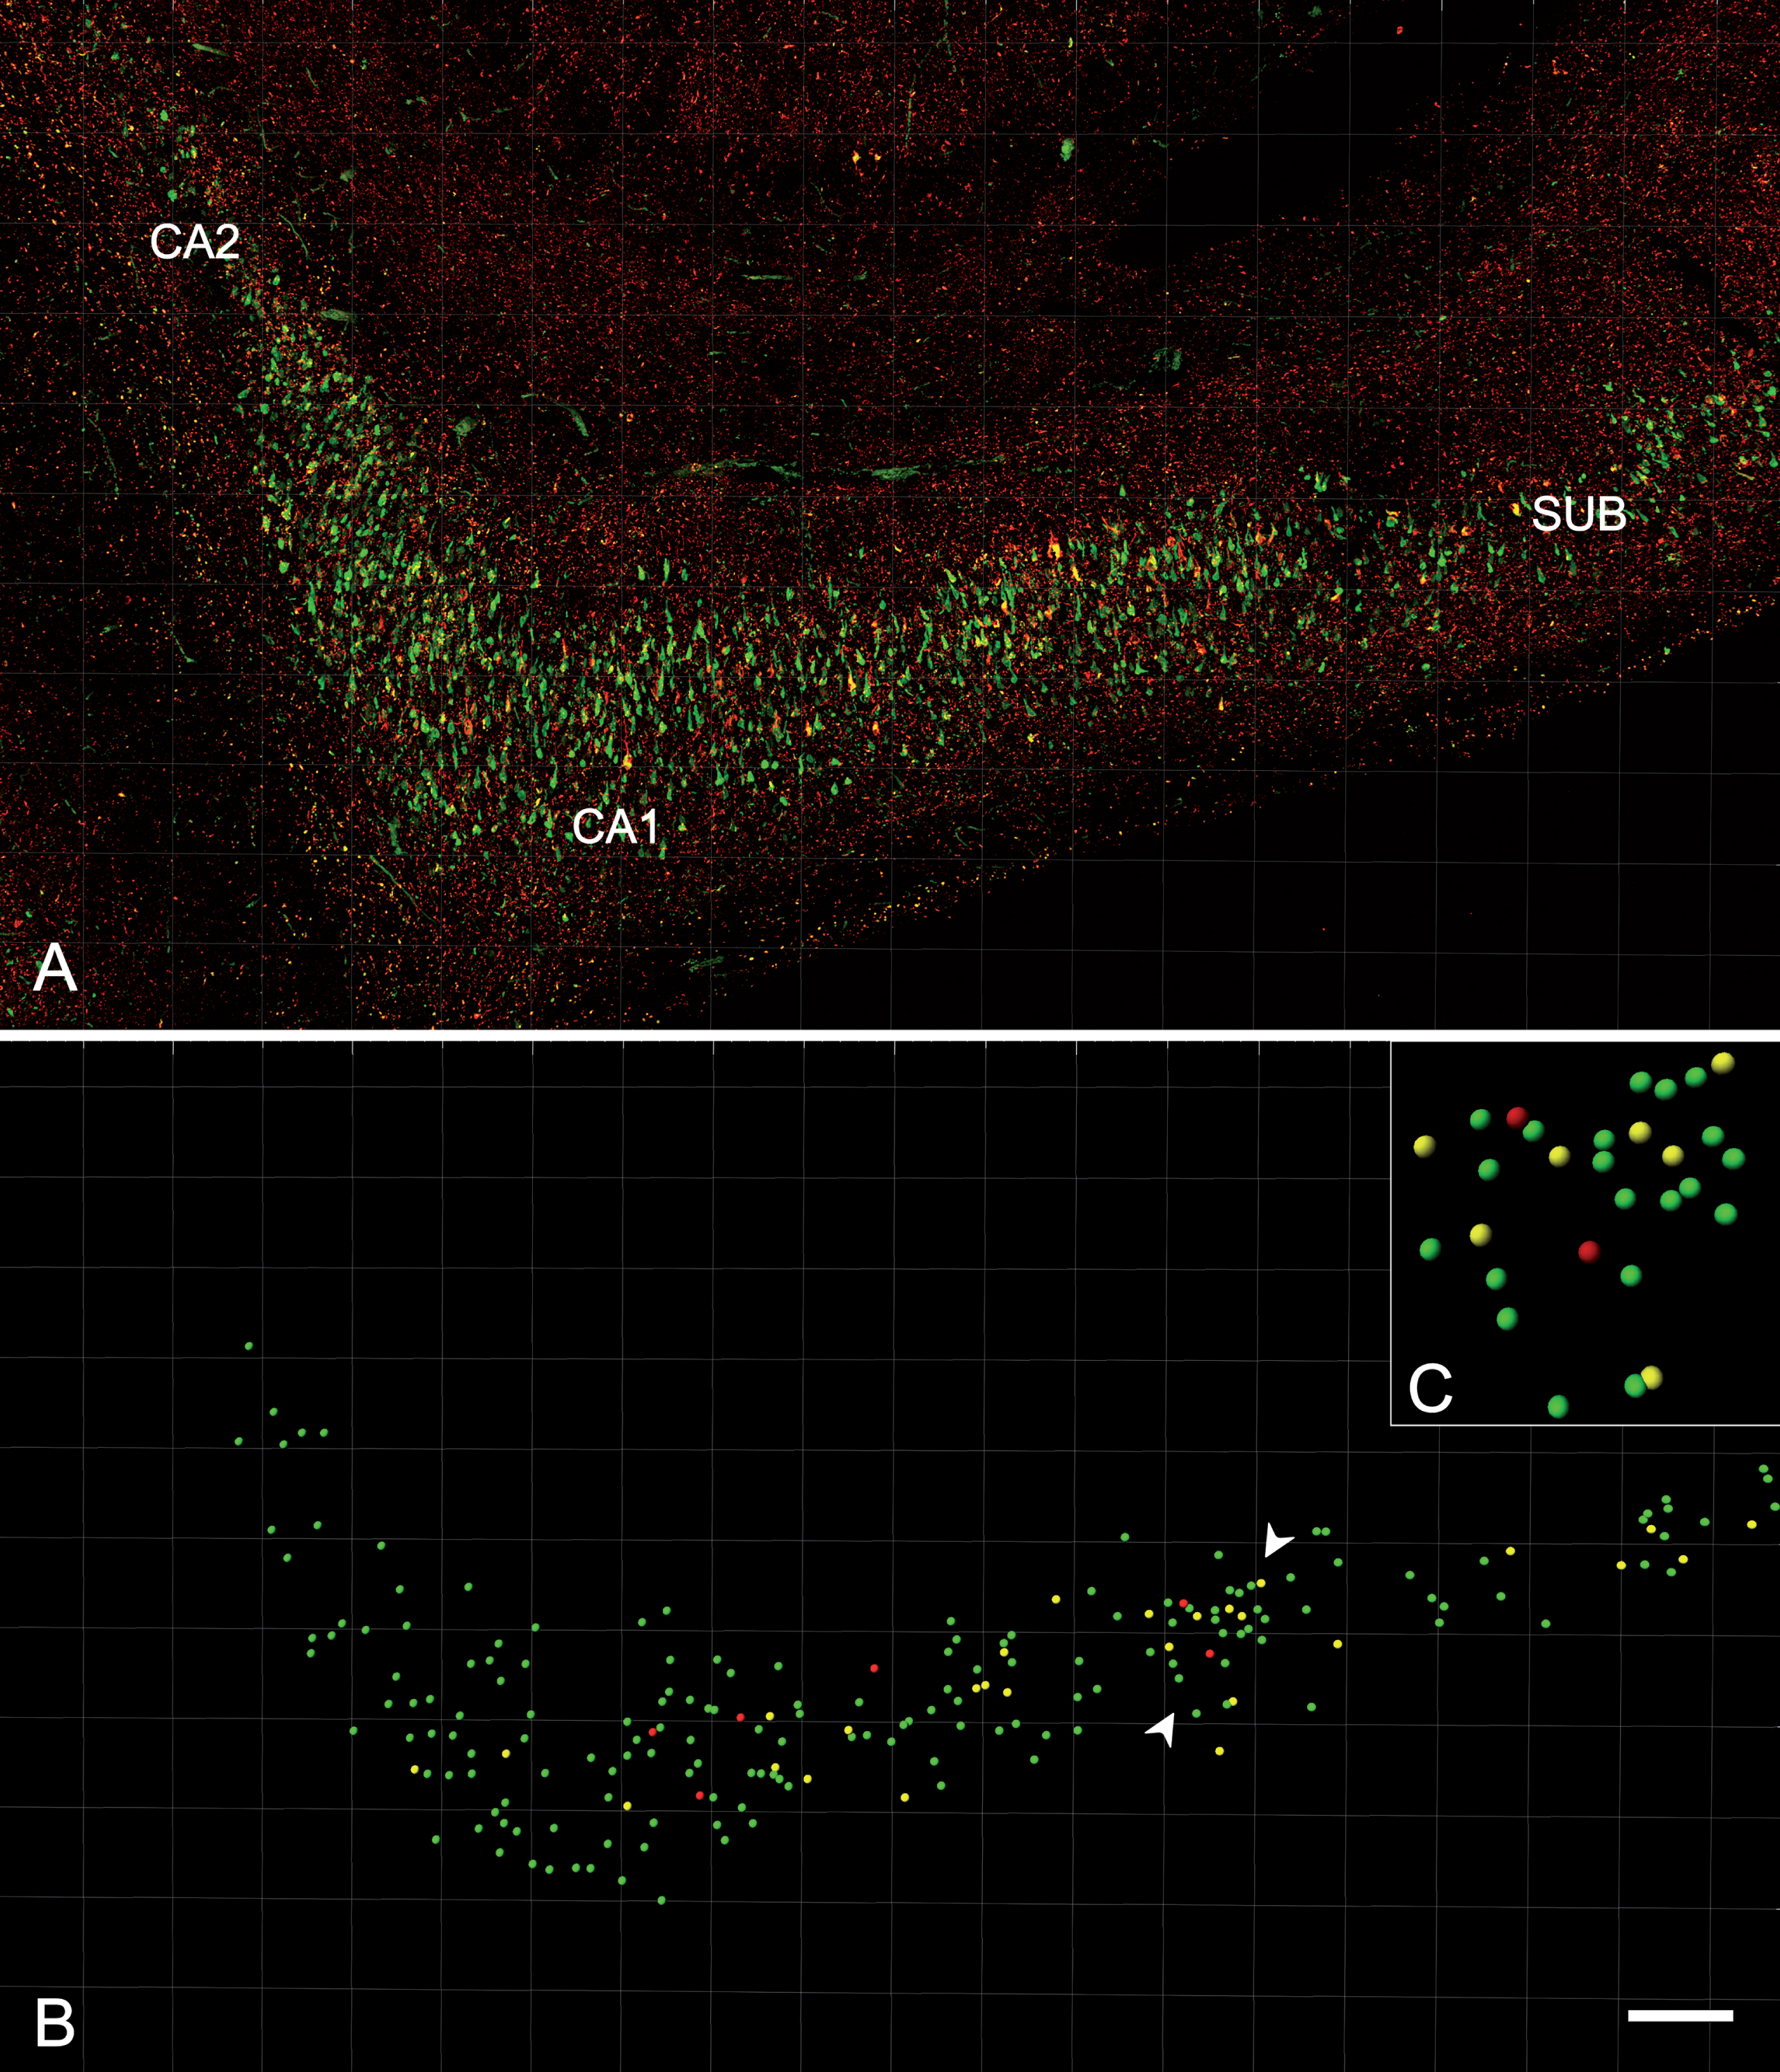
Table 6
Number of PHF-Tau-ir neurons in the pyramidal layer of the CA1 region, according to neuron location per subregion and type of staining (PHFpS396, PHFAT8 or PHFpS396/PHFAT8). Numbers in brackets indicate the relative percentages
| PHFpS396-ir | PHFAT8-ir | PHFpS396-ir/ PHFAT8-ir | Total | |
| Proximal | 843 | 134 | 521 | 1498 (26%) |
| Medial | 1416 | 189 | 715 | 2320 (41%) |
| Distal | 1357 | 108 | 395 | 1860 (33%) |
| 3616 (64%) | 431 (8%) | 1631 (28%) | 5678 (100%) |
The study of co-expression of these two markers revealed that most (64%) of the labeled neurons expressed only PHFpS396, whereas 28% displayed both markers and 8% showed only PHFAT8-ir (Table 6; Fig. 8). However, there was a large variability between patients (Table 7; Fig. 9).
Fig. 8
Confocal stack projection images to illustrate labeling patterns of neurons in double-immunostained sections for PHFpS396 and PHFAT8. Low-power confocal images of the hippocampal formation showing immunostaining for PHFpS396 (A, in green) and PHFAT8 (B, in red). Arrowheads indicate CA1 boundaries. C–H) Trios of confocal stack projection images taken from PHFpS396/PHFAT8 double-immunostained sections. Arrows designate neurons expressing both anti-PHFpS396 and anti-PHFAT8 (C–E). Arrowheads indicate a neuron expressing anti-PHFAT8, and asterisks indicate two neurons expressing only PHFpS396. DG, dentate gyrus; CA1–CA3, cornu ammonis fields; SUB, subiculum. Scale bar (in H): 922μm (in A, B) and 50μm (in C–H).
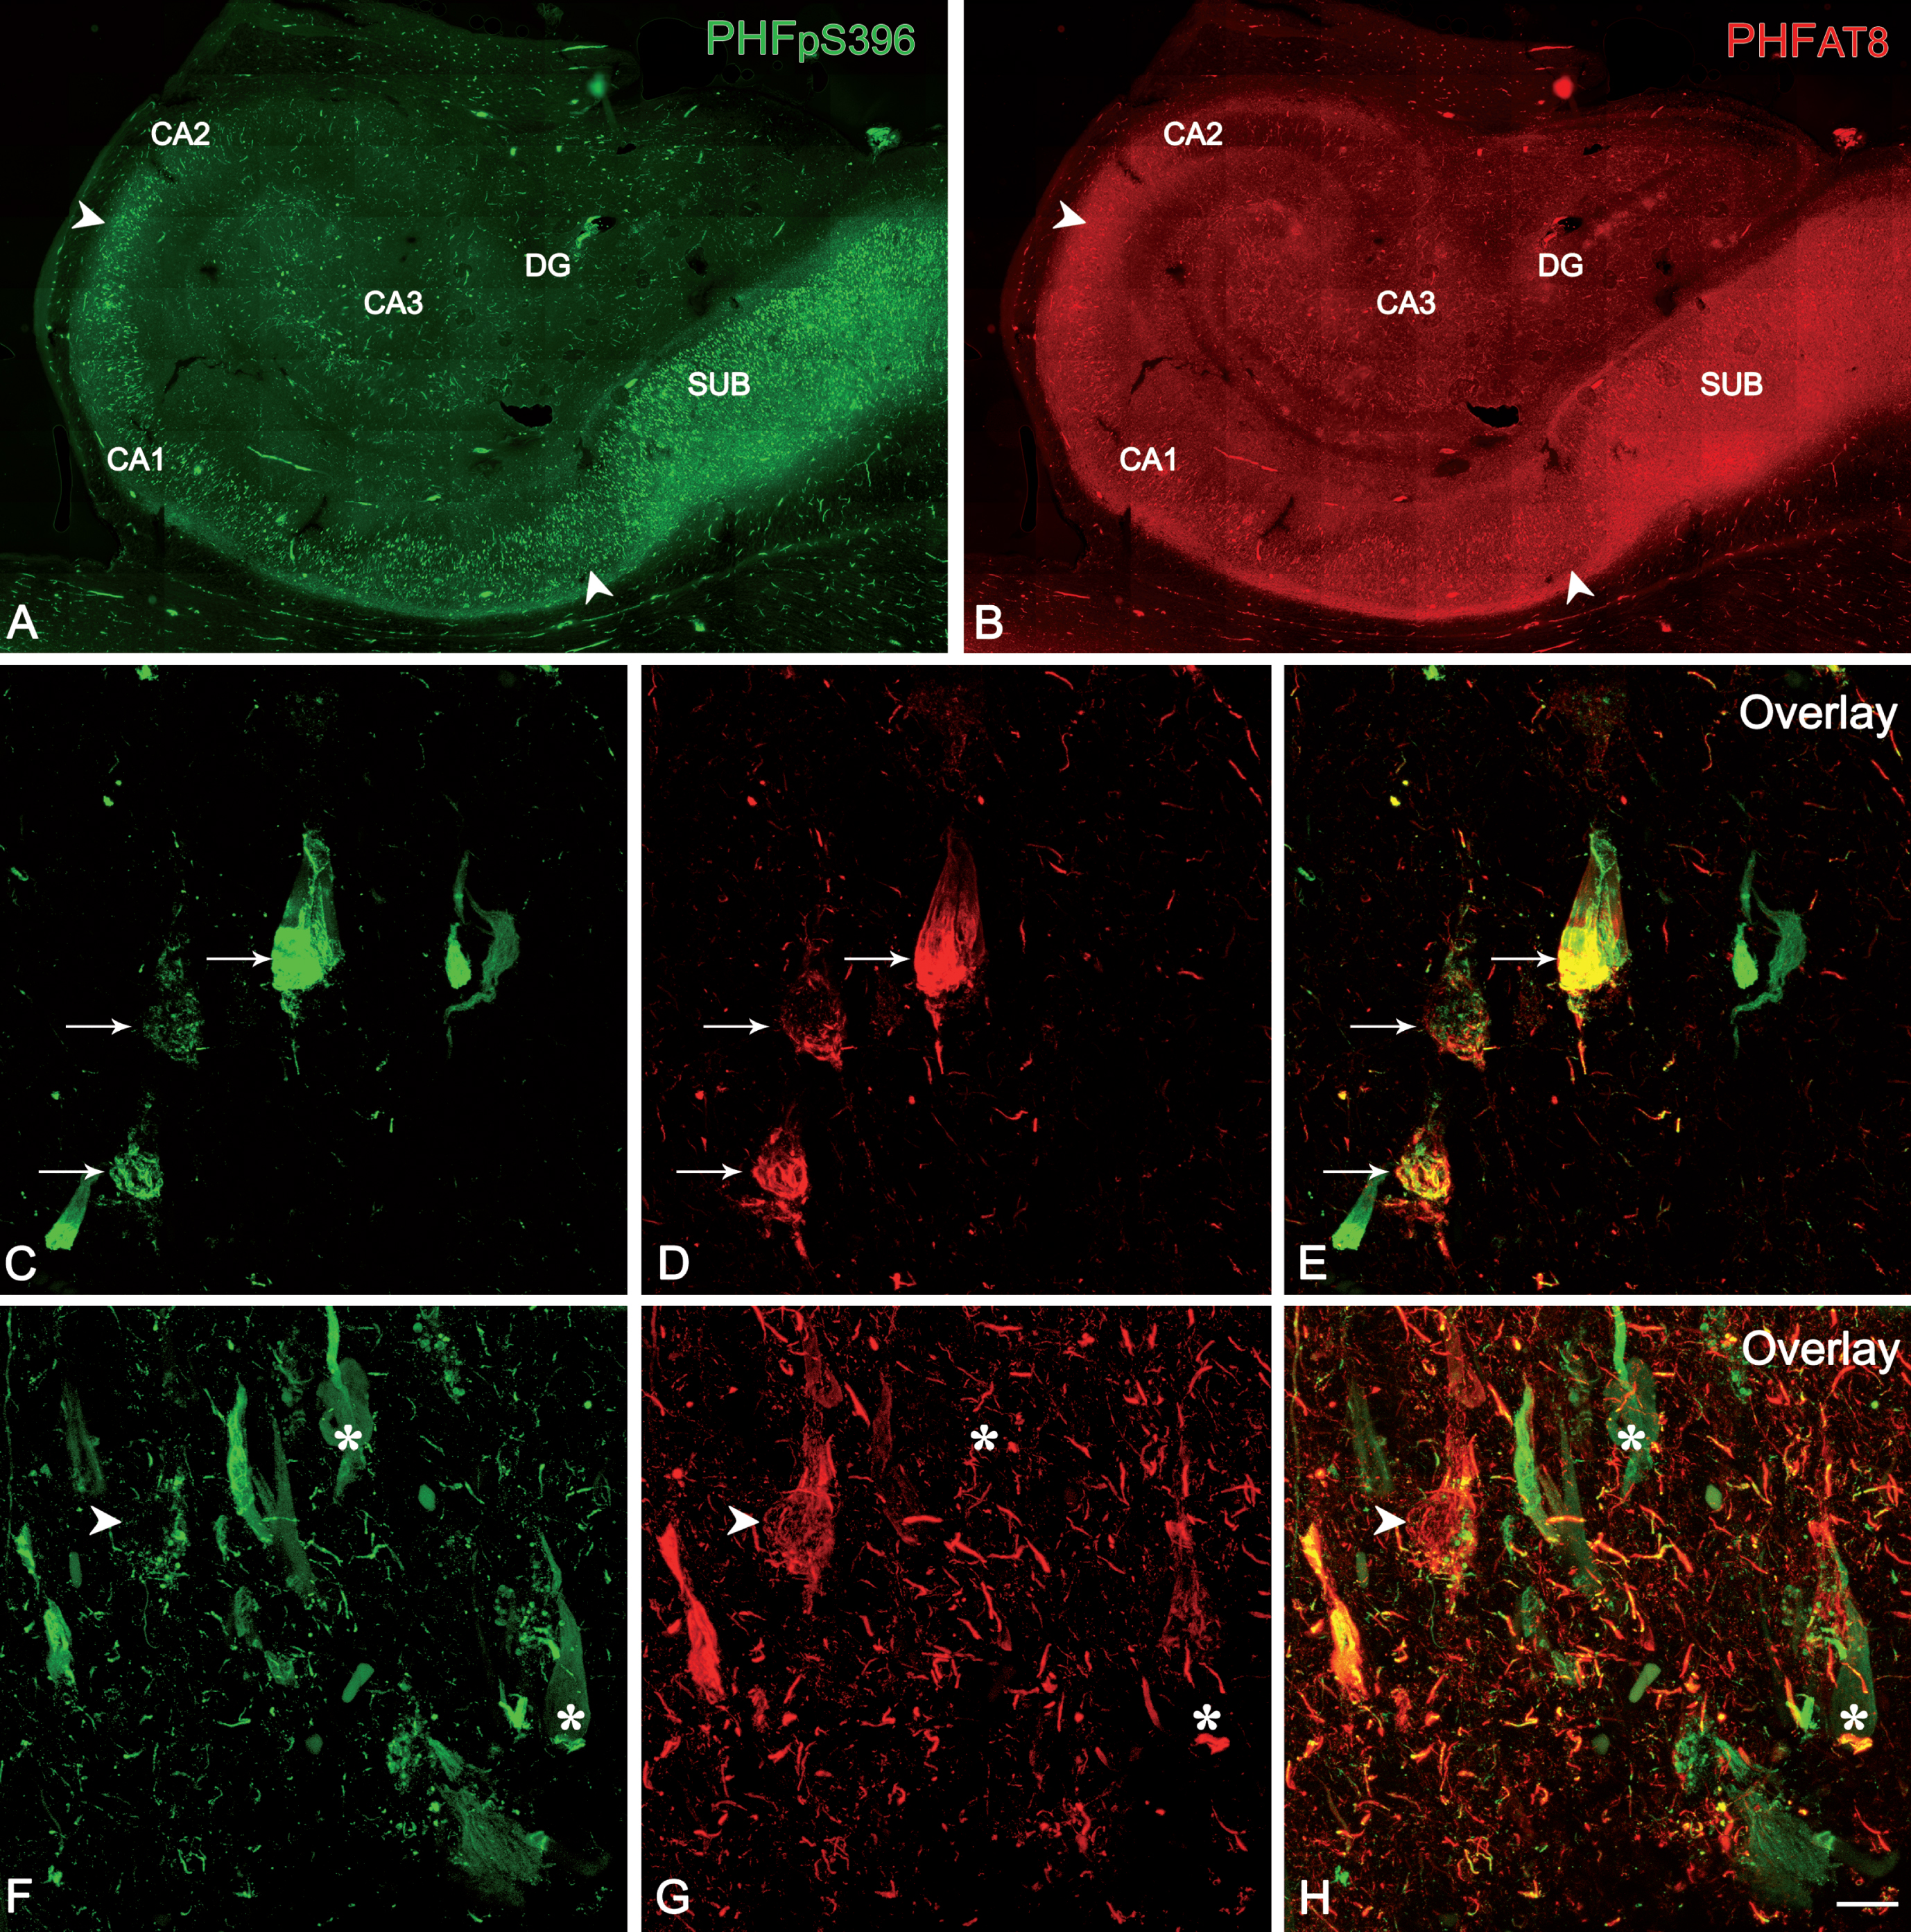
Fig. 9
Pie charts showing the percentages of labeled neurons in double immunostaining studies for PHFpS396 and PHFAT8. Note the high variability of patterns. Average percentages of expression patterns are shown in the “Summary” chart, in which it is clear that there is a higher proportion of PHFpS396-ir neurons.
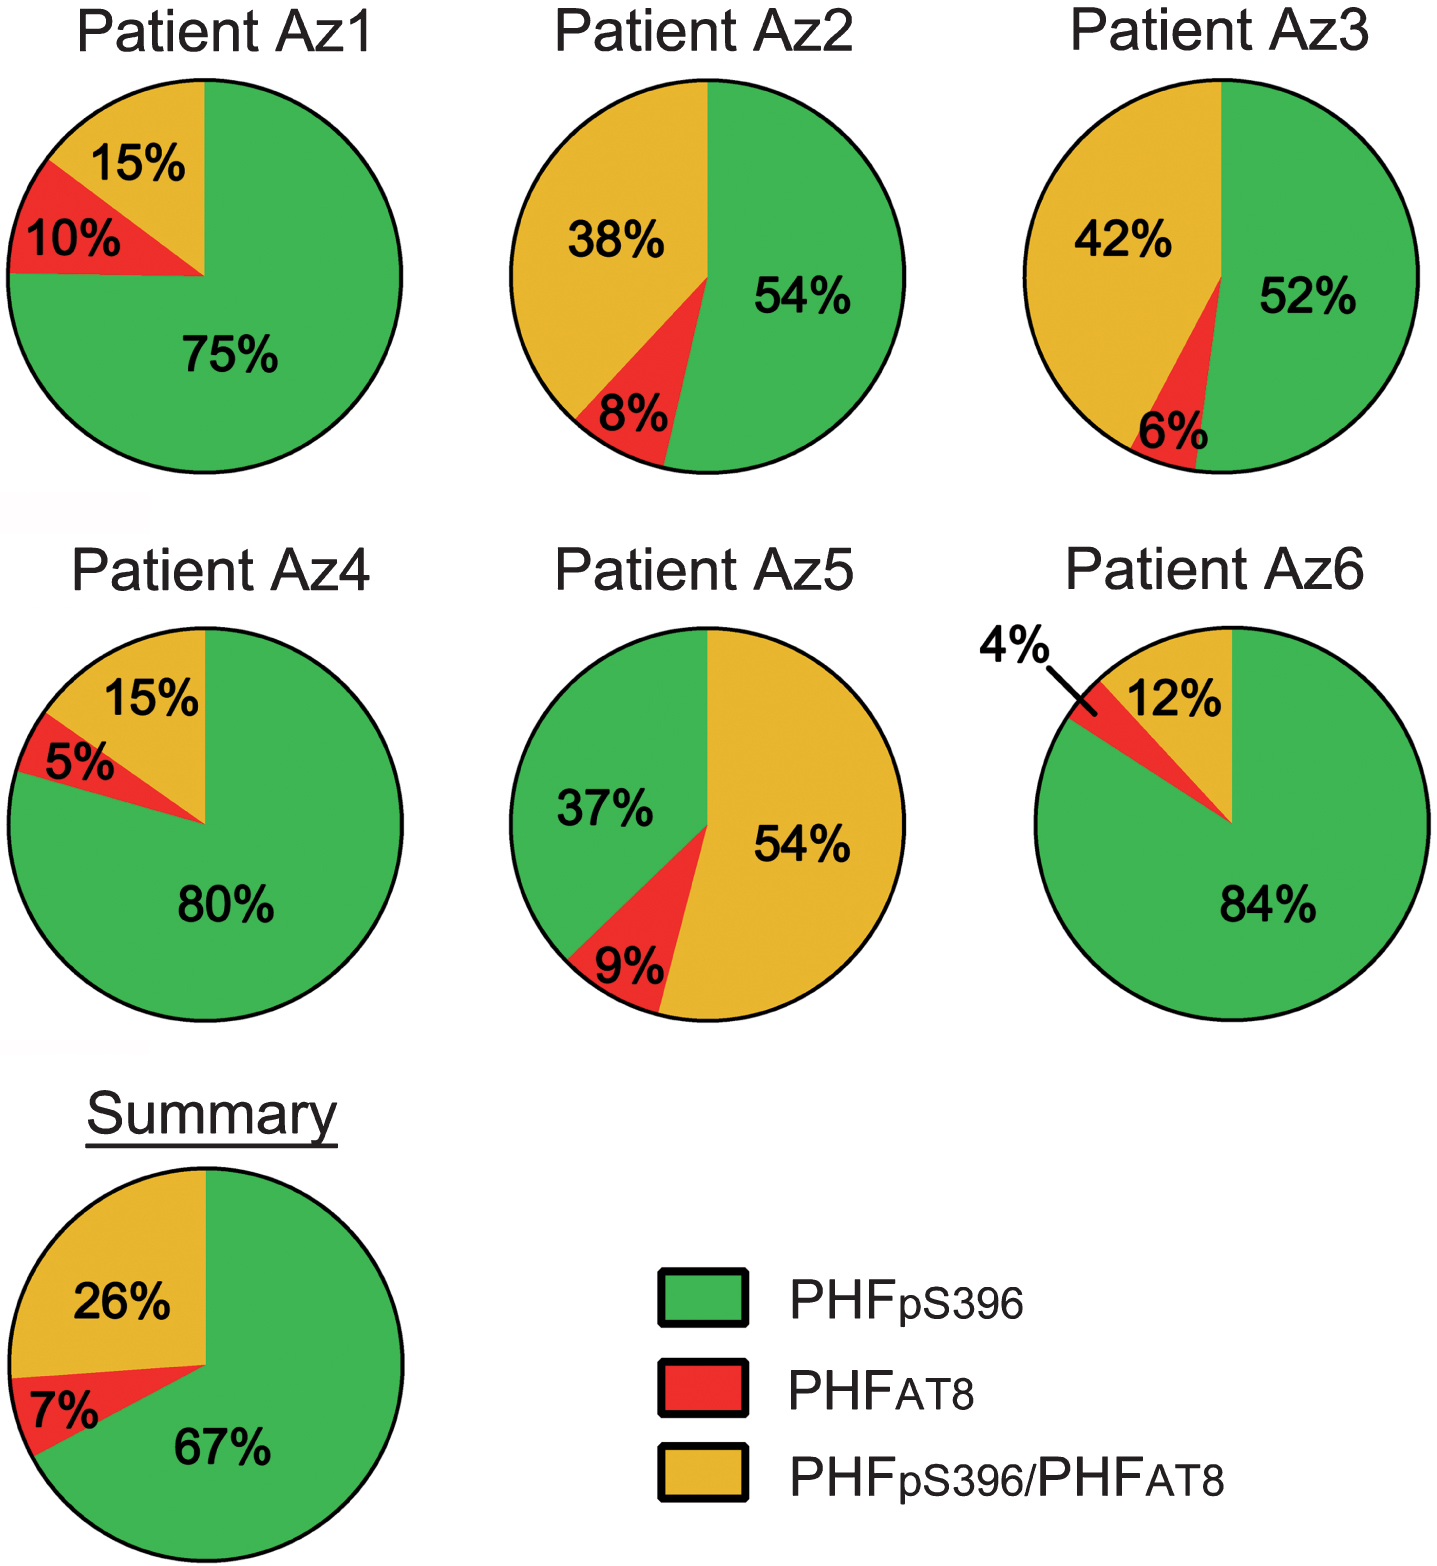
Table 7
Number of CA1 labeled neurons, per case, in double-immunostained sections for anti-PHFpS396 and anti-PHFAT8. Numbers in brackets represent the relative percentages
| Patient | PHFpS396-ir | PHFAT8-ir | PHFpS396-ir/ PHFAT8–ir | Total neurons |
| Az1 | 668 | 119 | 196 | 983 |
| Az2 | 424 | 83 | 322 | 829 |
| Az3 | 646 | 66 | 462 | 1174 |
| Az4 | 492 | 23 | 84 | 599 |
| Az5 | 496 | 101 | 424 | 1021 |
| Az6 | 890 | 39 | 143 | 1072 |
| Total | 3616 (64%) | 431 (8%) | 1631 (28%) | 5678 |
DISCUSSION
There are four main findings in the present study. First, despite the large variety of expression patterns of plaques and PHF-Tau-ir neurons, the pyramidal layer of proximal CA1 (close to CA2) contains the smallest number of both plaques and PHF-Tau-ir neurons. Second, a large proportion of Aβ-ir plaques were also characterized by the presence of PHF-Tau-ir, whereas plaques lacking Aβ-ir (i.e., plaques stained only for PHFpS396 or PHFAT8) were unusual. Third, all plaques containing one of the two PHF-Tau isoforms also express the other isoform, that is, if a plaque contains PHFpS396, it also contains PHFAT8, and vice versa. Fourth, the colocalization study of both PHF-Tau isoforms in CA1 neurons revealed that the majority of the labeled neurons express only PHFpS396. Moreover, the vast majority of PHF-Tau-ir neurons were identified as pyramidal cells.
Distribution and expression patterns of CA1 plaques
The analysis of plaques in CA1 showed that, independently of their labeling with Aβ, PHFpS396 or PHFAT8 antibodies, there were fewer plaques in the proximal portion, that is, closer to CA2. Furthermore, most plaques were localized in the stratum pyramidale, followed by the stratum radiatum, while they were sparse in the stratum oriens and absent in the stratum lacunosum-moleculare.
In both mouse models of AD and in AD patients, dendrites in contact with Aβ-ir plaques have been found to suffer alterations in dendritic spine number and morphology [22, 23, 42–44], indicating specific alterations related to Aβ [45]. Moreover, it has also been reported that Aβ-ir plaque presence alters synaptic transmission [14, 42–44, 46, 47], and impairs both the glutamatergic and the GABAergic systems [41, 48].
Since in the human CA1 the basal and apical dendritic arbors of pyramidal cells are mostly localized in the stratum pyramidale and Aβ-ir plaques are found mainly in the stratum pyramidale (followed by the stratum radiatum), synaptic alterations may affect both the apical and basal dendritic arbors of the CA1 pyramidal cells.
Double-immunostaining (anti-Aβ/anti-PHFpS396 and anti-Aβ/anti-PHFAT8) and triple-immunostaining (Methoxy-X04/anti-PHFpS396/anti-PHFAT8) showed a variety of co-expression patterns: we observed plaques labeled only with Aβ, with both Aβ and PHF-Tau or only with PHF-Tau antibodies. Whether these different types of plaques differentially affect the alterations of synaptic circuits is currently not known.
It has been proposed that plaques pass through different stages [49], from diffuse plaques to neuritic plaques, accumulating fibrillary processes, which would generate toxicity [50]. During this process, Aβ plaques may incorporate PHF-Tau elements through a variety of mechanisms. However, the two morphological types of plaques found in the present study— cored and non-cored plaques (see [41])— were found either labeled only with Aβ, or with both Aβ and PHF-Tau markers.
In AD patients, it has been reported that microglia are activated as a result of the inflammatory response where it is the presence of Aβ that triggers their activation [51–54]. Activated microglia seem to have two functional consequences: initially, Aβ clearance by uptake [55], and later, propagation of Aβ and PHF-Tau via exosomal mechanisms [56–58]. Therefore, microglia internalize not only Aβ, but also PHF-Tau [58]. Moreover, in a model of microglial depletion, the level of PHF-Tau was reduced [58], indicating that the over-activation of microglia may promote tau phosphorylation [53]. It follows that both proteins would be released to the brain parenchyma, facilitating Aβ grouping as well as the incorporation of PHF-Tau elements.
The initial stages of plaque formation have been proposed to involve the appearance of plaques without an associated inflammatory response, since in late phases activated microglia and reactive astrocytes are located close to plaques [51]. Hence, the presence of plaques expressing only Aβ may indicate an initial plaque stage, while plaques expressing also either PHFpS396 or PHFAT8 may be representative of an intermediate stage integrated in a dynamic process [59], which would depend on the presence of NFTs and, perhaps, on the local inflammatory response.
PHF-Tau-ir neurons: expression patterns and relationship with plaques
The most frequent PHF-Tau marker found in the CA1 pyramidal neurons from AD patients was PHFpS396 (over 90%), as previously reported in late stages of AD [45, 60, 61], which matches with the diagnoses of the cases analyzed (IV–VI on the Braak scale). It should be noted that it is still unclear if the specific phosphorylation site of PHF-Tau could indicate a sign of early or late stages of the disease. Expression of PHFAT8 has been proposed to occur in the early stages, while PHFpS396-ir corresponds to later stages (e.g., [60, 61]). Nevertheless, other authors have proposed that expression of PHFpS396 occurs in the early stages and has a dynamic pattern of expression over the course of the disease, while PHFAT8 appears in advanced stages [62].
Moreover, the role of PHF-Tau proteins in dendritic pathology is also open to debate. For example, it has been proposed that PHF-Tau protein— depending on its conformation and its phosphorylation site— may provide neuronal protection mechanisms to maintain the functionality of the neurons [32, 63, 64]. Thus, the presence of PHF-Tau within the somatodendritic compartment of pyramidal neurons does not necessarily induce cell death or even toxicity [45, 64, 65]. In a previous study on the possible alterations of dendritic spines in pyramidal cells from AD patients [23], a remarkable loss of dendritic spines from pyramidal cells containing NFTs was found. Since pyramidal neurons represent the principal building blocks of the cerebral cortex, and dendritic spines are the main postsynaptic elements of cortical excitatory synapses and are fundamental structures in memory, learning, and cognition, these alterations may constitute an important early event in the pathogenesis of AD. Pyramidal cells in the so-called putative ‘pre-tangle’ stage, had unchanged dendritic trees, whereas in the presence of well-developed NFTs, dendritic spine loss was obvious [23]. In cases with an intermediate state of neurofibrillary pathology, the loss of dendritic spines was more variable. Thus, the presence of PHF-Tau in neurons does not necessarily mean that they suffer severe and irreversible effects, but rather the characteristic cognitive impairment in AD is likely to depend on the relative number of neurons that have well-developed tangles. The presence of NFTs has been reported in CA1 hippocampal region (and entorhinal cortex) of non-demented old people, but amyloid-β plaques display a very heterogeneous pattern (reviewed in [66]).
Since we observed substantial variability between patients with regard to their expression patterns of Aβ-ir and PHF-Tau-ir, in plaques and neurons, a possible explanation is that the clearance mediated by microglial cells succeeded in some patients but not in others. If this were the case, patients with successful clearance would present a lower density of plaque Aβ-ir/PHF-Tau-ir, fewer PHFpS396-ir/PHFAT8-ir neurons and a higher number of plaques expressing only Aβ, which could indicate the formation of new plaques (see patients Az1, Az4 and Az6; Table 4; Fig. 9). By contrast, microglial clearance may have failed in those cases with a lower proportion of Aβ-ir plaques (negative for PHF-Tau-ir) and, hence, there would be more abundant PHF-Tau-ir neurons and Aβ-ir/PHF-Tau-ir plaques (see patients Az2, Az3 and Az5; Table 4; Fig. 9).
Recently it has been reported that there is an overlap between expression of Aβ and PHF-Tau proteins in different cortical regions [67]. That is, regardless of the Braak stage of each patient, there must be mechanisms, either compensatory or inflammatory that could modify the levels of pathological proteins in the brain, which would explain the observed variability (in patients which, initially, were clinically similar), suggesting a dynamic expression pattern of both proteins in AD. Therefore, our data is in line with the hypothesis that both proteins act together, as previously proposed [29, 67–70], even in late stages of the disease.
Possible functional implications of CA1 alterations
It is well established that normal CA1 function is critical for the processing of spatial information, new environment activity, learning and memory [8, 10, 13, 14, 71, 72].
The CA1 region is highly connected to other hippocampal regions, as well as to numerous cortical and subcortical areas. In particular, CA1 is strongly connected with the entorhinal cortex (EC), which is related to memory functions [11, 13, 14, 73]. CA1 projects to deep EC layers [74] and it receives afferents from layer II through the performant pathway (or trisynaptic circuit) and from layer III of the EC by a direct monosynaptic pathway.
Proximal and distal CA1 regions have been related to spatial and context representation [75] and they establish multiple connections, both with cortico-subcortical regions and specific hippocampal regions, as well as within CA1 itself [76]. Lesions in proximal CA1 produce impairment in memory recovery tasks [77], which would be in line with clinical symptoms of early stages of AD where episodic memory is affected [78]. We found that the pyramidal layer of proximal CA1 (close to CA2) contains the smallest number of both plaques and PHF-Tau-ir neurons, but the whole CA1 of these patients and other hippocampal fields and brain regions showed numerous plaques and NFTs.
In the cerebral cortex of AD patients, it has been found that there is a reduction in the number of perisomatic GABAergic terminals in neurons in contact with Aβ plaques [41], as well as a decrease in the number of synapses (both excitatory and inhibitory) within plaques (see [79] and references contained therein). Thus, it seems clear that the presence of plaques leads to a local loss of synapses. In addition, the phosphotau labelling dystrophic neurites around plaques is normally formed in axons [80]. These plaques are present mainly in the pyramidal cell layer of CA1, which receives axons from multiple regions, as well as from classical CA3 pyramidal cells (via Shaeffer collaterals), including entorhinal cortex, submammilary body, nucleus reuniens of the thalamus, and septum among others (reviewed in [81]). It is therefore likely that these phosphotau labeled axons were originated from these regions. However, whether axons of different anatomical origin are more affected than others is not known. Therefore, multiple neuronal circuits are affected and, due to the variability of the pathological features of each patient (see below), it is not possible to draw up a general pattern of functional alterations.
Finally, superficial CA1 pyramidal neurons are activated during tasks where the environment needs to be related to stored information and other features of the surroundings, while deep CA1 pyramidal neurons provide information about the environment in terms of mapping [72]. Our data show that most plaques are located in the CA1 pyramidal layer, as well as the PHF-Tau-ir neurons are found in both the superficial and deep CA1 pyramidal cell layer. Thus, both plaques and NFTs occupy critical regions in terms of functionality, affecting the synaptic connectivity which supports spatial skills. Since the first symptoms of patients in the early stages of AD are loss of context and spatial orientation, deep CA1 could be one of the first affected areas of the hippocampus during the onset of the disease, whereas— in the late stages— both superficial and deep CA1 pyramidal cells are affected as shown in the present study.
Inter-individual variability
Our results indicate a huge variability in AD patients regarding the content and chemical characteristics of plaques and NFTs. Since all the AD patients analyzed in the present study correspond to late stages of the disease (Braak stages IV–VI; see Table 1) and they suffer from severe cognitive deficits, the high variability in the neurochemical types and distribution of plaques that we observed indicates a high degree of inter-individual differences. Thus, our findings further support the idea that AD is not a unique entity even within the same neuropathological stage, since the microanatomical/neurochemical changes that occur in the hippocampus greatly vary from one patient to another (see also [45]).
It has been reported that symptoms may differ between AD patients despite their neuropathological findings being similar [27]. Given that plaque load and cognitive functions are poorly correlated, together with the fact that the expression of PHF-Tau has been strongly linked to cognitive impairment [82], it may be that dementia is primarily related to the presence of PHF-Tau [21, 23], and secondly to its interaction with Aβ protein. Thus, it seems that when these proteins act together, the symptoms become apparent due to severe neuronal damage. Variability found between patients cannot be attributed to their AD stages, since all of them were diagnosed as Braak stages IV–VI.
We would like to point out that the morphological alterations observed in human pathological brain tissue are difficult to interpret, due to the high interindividual variability (regarding factors such as sex, age, medical treatment, etc.) that can affect brain structure. In addition, the disease course of AD is highly variable, and neuropathological changes are not homogenous. This is the case both among patients and in different brain regions of the same patient [41, 45]. Since we have analyzed the hippocampus of few patients with different pathological and clinical characteristics, the data obtained in the present study cannot be generalized to all AD patients or other cortical areas. Thus, the present study represents a further step towards addressing the topic of heterogeneity in tau and Aβ pathology, but it would be necessary to confirm our observations, both in a larger number of individuals and in additional cortical areas. The observed differences could be linked to structural variances associated with cognitive reserve [83–85] or related to the number of years since disease diagnosis. It has been proposed that cognitive reserve allows the brain to tolerate pathological elements without visible clinical symptoms, by using compensatory mechanisms of protection or via pre-existing cognitive approaches (so called ‘cognitive scheme’; [86, 87]), which could serve as protection against neuronal degeneration [85]. Hence, this could be related to the observed differences in the expression pattern of plaques and PHF-Tau-ir neurons between patients. Five of the analyzed cases showed TDP-43 (a pathological condition of a DNA binding protein), which has been shown to be a comorbidity factor that may also contribute to dementia in AD [88, 89]. Moreover, α-synuclein (a misfolded protein which forms pathological aggregations in neurodegenerative disorders such as Parkinson’s disease) was found in two cases. Since different proteinopathies coexist in some patients, it is uncertain whether AD is an independent pathological process or the concurrent pathological proteins influence each other [90]. This coexistence of proteinopathies can therefore also contribute to the diversity of plaque types found in the present study. For example, one of the cases (Az9) displayed markers for both TDP-43 and α-synuclein, and in this particular case, plaques were identified by Aβ markers (Methoxy-X04 staining) but not by anti-PHF-Tau markers.
ACKNOWLEDGMENTS
We would like to thank Isabel Fernaud, Lorena Valdes, Carmen Alvarez and Miriam Marin for their helpful technical assistance, and Gonzalo León-Espinosa for critically reading the manuscript. This work was supported by a grant from the Alzheimer’s Association (ZEN-15-321663) and by grants from the Spanish Ministry of Economy, Industry and Competitiveness (SAF 2015-66603-P), the Cajal Blue Brain Project (Spanish partner of the Blue Brain Project initiative from EPFL) and Centro de Investigación Biomédica en Red sobre Enfermedades Neurodegenerativas (CIBERNED, Spain, CB06/05/0066).
Authors’ disclosures available online (https://www.j-alz.com/manuscript-disclosures/18-0173r1).
REFERENCES
[1] | Alzheimer’s Association ((2017) ) Alzheimer’s disease: Facts and figures. Alzheimers Dement 13: , 325-373. |
[2] | Grundke-Iqbal I , Iqbal K , Tung YC , Quinlan M , Wisniewski HM , Binder LI ((1986) ) Abnormal phosphorylation of the microtubule-associated protein tau (tau) in Alzheimer cytoskeletal pathology. Proc Natl Acad Sci U S A 83: , 4913-4917. |
[3] | Goedert M , Wischik CM , Crowther RA , Walker JE , Klug A ((1988) ) Cloning and sequencing of the cDNA encoding a core protein of the paired helical filament of Alzheimer disease: Identification as the microtubule-associated protein tau. Proc Natl Acad Sci U S A 85: , 4051-4055. |
[4] | Avila J ((2004) ) The influence of aging in one tauopathy: Alzheimer ’s disease. Arch Immunol Ther Exp 52: , 410-413. |
[5] | Wilson RS , Arnold SE , Schneider JA , Kelly JF , Tang Y , Bennett DA ((2006) ) Chronic psychological distress and risk of Alzheimer’s disease in old age. Neuroepidemiology 27: , 143-153. |
[6] | Dickerson BC , Eichenbaum H ((2010) ) The episodic memory system: Neurocircuitry and disorders. Neuropsychopharmacology 35: , 86-104. |
[7] | Hyman BT , Van Hoesen GW , Kromer LJ , Damasio AR ((1986) ) Perforant pathway changes and the memory impairment of Alzheimer’s disease. Ann Neurol 20: , 427-481. |
[8] | Amaral D , Lavenex P ((2007) ) Hippocampal neuroanatomy. In The Hippocampus Book, Andersen P, Morris R, Amaral D, BT, O’Keefe J, eds. Oxford University Press, New York, pp. 37-114. |
[9] | Cohen N , Squire L ((1980) ) Preserved learning and retention of pattern-analyzing skill in amnesia: Dissociation of knowing how and knowing that. Science 210: , 207-210. |
[10] | Zola-Morgan S , Squire Larry R , Amaral DG ((1986) ) Human amnesia and the medial temporal region: Enduring memory impairment following a bilateral lesion limited to field CA1 of the hippocampus. Neurocase 2: , 259-298. |
[11] | Amaral DG , Dolorfo C , Alvarez-Royo P ((1991) ) Organization of CA1 projections to the subiculum: A PHA-L analysis in the rat. Hippocampus 1: , 415-435. |
[12] | Bartsch T , Dohring J , Rohr A , Jansen O , Deuschl G ((2011) ) CA1 neurons in the human hippocampus are critical for autobiographical memory, mental time travel, and autonoetic consciousness. Proc Natl Acad Sci U S A 108: , 17562-17567. |
[13] | Fouquet M , Desgranges B , La Joie R , Rivière D , Mangin JF , Landeau B , Mézenge F , Pélerin A , de La Sayette V , Viader F , Baron JC , Eustache F , Chételat G ((2012) ) Role of hippocampal CA1 atrophy in memory encoding deficits in amnestic Mild Cognitive Impairment. Neuroimage 59: , 3309-3315. |
[14] | Llorens-Martín M , Blazquez-Llorca L , Benavides-Piccione R , Rabano A , Hernandez F , Avila J , DeFelipe J ((2014) ) Selective alterations of neurons and circuits related to early memory loss in Alzheimer’s disease. Front Neuroanat 8: , 1-12. |
[15] | Gomez-Isla T , Hollister R , West H , Mui S , Growdon JH , Petersen RC , Parisi JE , Hyman BT ((1997) ) Neurond loss correlates with but exceeds neurofibrilary tangles in Alzheimer’s Disease. Ann Neurol 41: , 17-24. |
[16] | Simic GŠ , Kostovic I , Winblad B , Bogdanovic N ((1997) ) Volume and number of neurons of the human hippocampal formation in normal aging and Alzheimer’s disease. J Comp Neurol 379: , 482-494. |
[17] | West MJ , Gundersen HJG ((1990) ) Unbiassed stereological estimation of the number of neurons in the human hippocampus. J Comp Neurol 296: , 1-22. |
[18] | Yang X , Yao C , Tian T , Li X , Yan H , Wu J , Li H , Pei L , Liu D , Tian Q , Zhu L-Q , Lu Y ((2018) ) A novel mechanism of memory loss in Alzheimer’s disease mice via the degeneration of entorhinal-CA1 synapses. Mol Psychiatry 23: , 199-210. |
[19] | Hyman BT , Vanhoesen GW , Damasio AR ((1990) ) Memory-related neural systems in Alzheimer’s disease - an anatomic study. Neurology 40: , 1721-1730. |
[20] | West MJ , Kawas CH , Stewart WF , Rudow GL , Troncoso JC ((2004) ) Hippocampal neurons in pre-clinical Alzheimer’s disease. Neurobiol Aging 25: , 1205-1212. |
[21] | Andrade-Moraes CH , Oliveira-Pinto AV , Castro-Fonseca E , da Silva CG , Guimaraes DM , Szczupak D , Parente-Bruno DR , Carvalho LRB , Polichiso L , Gomes BV , Oliveira LM , Rodriguez RD , Leite REP , Ferretti-Rebustini REL , Jacob-Filho W , Pasqualucci CA , Grinberg LT , Lent R ((2013) ) Cell number changes in Alzheimer’s disease relate to dementia, not to plaques and tangles. Brain 136: , 3738-3752. |
[22] | Merino-Serrais P , Knafo S , Alonso-Nanclares L , Fernaud-Espinosa I , DeFelipe J ((2011) ) Layer-specific alterations to CA1 dendritic spines in a mouse model of Alzheimer’s disease. Hippocampus 21: , 1037-1044. |
[23] | Merino-Serrais P , Benavides-Piccione R , Blazquez-Llorca L , Kastanauskaite A , Rábano A , Avila J , DeFelipe J ((2013) ) The influence of phospho-tau on dendritic spines of cortical pyramidal neurons in patients with Alzheimer’s disease. Brain 136: , 1913-1928. |
[24] | Giannakopoulos P , Herrmann FR , Bussiere T , Bouras C , Kovari E , Perl DP , Morrison JH , Gold G , Hof PR ((2003) ) Tangle and neuron numbers, but not amyloid load, predict cognitive status in Alzheimer’s disease. Neurology 60: , 1495-1500. |
[25] | Ingelsson M , Fukumoto H , Newell KL , Growdon JH , Hedley-Whyte ET , Frosch MP , Albert MS , Hyman BT , Irizarry MC ((2004) ) Early Abeta accumulation and progressive synaptic loss, gliosis, and tangle formation in AD brain. Neurology 62: , 925-931. |
[26] | Perez-Nievas BG , Stein TD , Tai HC , Dols-Icardo O , Scotton TC , Barroeta-Espar I , Fernandez-Carballo L , De Munain EL , Perez J , Marquie M , Serrano-Pozo A , Frosch MP , Lowe V , Parisi JE , Petersen RC , Ikonomovic MD , López OL , Klunk W , Hyman BT , Gómez-Isla T ((2013) ) Dissecting phenotypic traits linked to human resilience to Alzheimer’s pathology. Brain 136: , 2510-2526. |
[27] | Nelson PT , Alafuzoff I , Bigio EH , Bouras C , Braak H , Cairns NJ , Castellani RJ , Crain BJ , Davies P , Del Tredici K , Duyckaerts C , Frosch MP , Haroutunian V , Hof PR , Hulette CM , Hyman BT , Iwatsubo T , Jellinger KA , Mackenzie G , Mann DM , Masliah E , McKee AC , Montine TJ , Morris JC , Schneider JA , Sonnen JA , Thal DR , Trojanowski JQ , Troncoso JC , Wisniewski T , Woltjer RL , Beach TG ((2012) ) Correlation of Alzheimer disease neuropathologic changes with cognitive status: A review of the literature. J Neuropathol Exp Neurol 71: , 362-381. |
[28] | Spires-Jones TL , Hyman BT ((2014) ) The intersection of amyloid beta and tau at synapses in Alzheimer’s disease. Neuron 82: , 756-771. |
[29] | Ittner LM , Götz J ((2011) ) Amyloid-β and tau — a toxic pas de deux in Alzheimer’s disease. Nat Rev Neurosci 12: , 65-72. |
[30] | Bloom GS ((2014) ) Amyloid-β and tau: The trigger and bullet in Alzheimer disease pathogenesis. JAMA Neurol 71: , 505-508. |
[31] | Price JL , Morris JC ((2004) ) So what if tangles precede plaques? Neurobiol Aging 25: , 721-723. |
[32] | Polanco JC , Li C , Bodea L-G , Martinez-Marmol R , Meunier FA , Götz J ((2017) ) Amyloid-β and tau complexity — towards improved biomarkers and targeted therapies. Nat Rev Neurol 14: , 22-39. |
[33] | Braak H , Braak E ((1991) ) Neuropathological stageing of Alzheimer-related changes. Acta Neuropathol 82: , 239-259. |
[34] | Fillenbaum GG , Belle G Van , Morris JC , Richard C , Mirra SS , Davis PC , Tariot PN , Silverman M , Clark CM , Welsh-Bohmer KA , Heyman A ((2008) ) CERAD (Consortium to Establish a Registry for Alzheimer’s Disease): The first 20 years. Alzheimers Dement 4: , 96-109. |
[35] | Goedert M , Jakes R , Vanmechelen E ((1995) ) Monoclonal antibody AT8 recognises tau protein phosphorylated at both serine 202 and threonine 205. Neurosci Lett 189: , 167-170. |
[36] | Duyckaerts C , Delatour B , Potier MC ((2009) ) Classification and pathology of Alzheimer disease. Acta Neuropathol 118: , 5-36 basic. |
[37] | Blazquez-Llorca L , Garcia-Marin V , Merino-Serrais P , Ávila J , DeFelipe J ((2011) ) Abnormal tau phosphorylation in the thorny excrescences of CA3 hippocampal neurons in patients with Alzheimer’s disease. J Alzheimers Dis 26: , 683-698. |
[38] | Klunk WE , Bacskai BJ , Mathis CA , Kajdasz ST , McLellan ME , Frosch MP , Debnath ML , Holt DP , Wang Y , Hyman BT ((2002) ) Imaging Abeta plaques in living transgenic mice with multiphoton microscopy and methoxy-X04, a systemically administered Congo red derivative. J Neuropathol Exp Neurol 61: , 797-805. |
[39] | Andrioli A , Alonso-Nanclares L , Arellano JI , DeFelipe J ((2007) ) Quantitative analysis of parvalbumin-immunoreactive cells in the human epileptic hippocampus. Neuroscience 149: , 131-143. |
[40] | Heggland I , Storkaas IS , Soligard HT , Kobro-Flatmoen A , Witter MP ((2015) ) Stereological estimation of neuron number and plaque load in the hippocampal region of a transgenic rat model of Alzheimer’s disease. Eur J Neurosci 41: , 1245-1262. |
[41] | Garcia-Marin V , Blazquez-Llorca L , Rodriguez J-R , Boluda S , Muntane G , Ferrer I , Defelipe J ((2009) ) Diminished perisomatic GABAergic terminals on cortical neurons adjacent to amyloid plaques. Front Neuroanat 3: , 1-18. |
[42] | Spires TL , Meyer-luehmann M , Stern EA , Mclean PJ , Nguyen PT , Bacskai BJ , Hyman BT ((2005) ) Dendritic spine abnormalities in APP transgenic mice demonstrated by gene transfer and intravital multiphoton microscopy. J Neurosci 25: , 7278-7287. |
[43] | Knafo S , Venero C , Merino-Serrais P , Fernaud-Espinosa I , Gonzales-Soriano J , Ferrer I , Santpere G , DeFelipe J ((2009) ) Morphological alterations to neurons of the amygdala and impaired fear conditioning in a transgenic mouse model of Alzheimer’s disease. J Pathol 220: , 41-51. |
[44] | Knafo S , Alonso-Nanclares L , Gonzalez-Soriano J , Merino-Serrais P , Fernaud-Espinosa I , Ferrer I , DeFelipe J ((2009) ) Widespread changes in dendritic spines in a model of Alzheimer’s disease. Cereb Cortex 19: , 586-592. |
[45] | Blazquez-Llorca L , Garcia-Marin V , DeFelipe J ((2010) ) Pericellular innervation of neurons expressing abnormally hyperphosphorylated tau in the hippocampal formation of Alzheimer’s disease patients. Front Neuroanat 4: , 1-23. |
[46] | Terry RD , Masliah E , Salmon DP , Butters N , Deteresa R , Hill R , Hansen LA , Katzman R ((1991) ) Physical basis of cognitive alterations in Alzheimer’s disease: Synapse loss is the major correlate of cognitive impairment. Ann Neurol 30: , 572-580. |
[47] | Guo JL , Lee VMY ((2014) ) Cell-to-cell transmission of pathogenic proteins in neurodegenerative diseases. Nat Med 20: , 130-138. |
[48] | Revett TJ , Baker GB , Jhamandas J , Kar S ((2013) ) Glutamate system, amyloid β peptides and tau prote, Functional interrelationshis and relevance to Alzheimer disease pathology. J Psychiatry Neurosci 38: , 6-23 |
[49] | Dickson TC , King CE , McCormack GH , Vickers JC ((1999) ) Neurochemical diversity of dystrophic neurites in the early and late stages of Alzheimer’s disease. Exp Neurol 156: , 100-110. |
[50] | Ikeda SI , Yanagisawa N , Allsop D , Glenner GG ((1990) ) Early senile plaques in Alzheimer’s disease demonstrated by histochemistry, immunocytochemistry, and electron microscopy. Hum Pathol 21: , 1221-1226. |
[51] | D’Andrea MR , Reiser PA , Gumula NA , Hertzog BM , Andrade-Gordon P ((2001) ) Application of triple immunohistochemistry to characterize amyloid plaque-associated inflammation in brains with Alzheimer’s disease. Biotech Histochem 76: , 97-106. |
[52] | Jung CKE , Keppler K , Steinbach S , Blazquez-Llorca L , Herms J ((2015) ) Fibrillar amyloid plaque formation precedes microglial activation. PLoS One 10: , 1-10. |
[53] | Chen W , Abud EA , Yeung ST , Lakatos A , Nassi T , Wang J , Blum D , Buée L , Poon WW , Blurton-Jones M ((2016) ) Increased tauopathy drives microglia-mediated clearance of beta-amyloid. Acta Neuropathol Commun 4: , 1-15. |
[54] | Parbo P , Ismail R , Hansen KV , Amidi A , Mårup FH , Gottrup H , Brændgaard H , Eriksson BO , Eskildsen SF , Lund TE , Tietze A , Edison P , Pavese N , Stokholm MG , Borghammer P , Hinz R , Aanerud J , Brooks DJ ((2017) ) Brain inflammation accompanies amyloid in the majority of mild cognitive impairment cases due to Alzheimer’s disease. Brain 140: , 2002-2011. |
[55] | Lee CYD , Landreth GE ((2010) ) The role of microglia in amyloid clearance from the AD brain. J Neural Transm 117: , 949-960. |
[56] | Rajendran L , Honsho M , Zahn TR , Keller P , Geiger KD , Verkade P , Simons K ((2006) ) Alzheimer’s disease beta-amyloid peptides are released in association with exosomes. Proc Natl Acad Sci U S A 103: , 11172-11177. |
[57] | Rajendran L , Bali J , Barr MM , Court FA , Kramer-Albers E-M , Picou F , Raposo G , van der Vos KE , van Niel G , Wang J , Breakefield XO ((2014) ) Emerging roles of extracellular vesicles in the nervous system. J Neurosci 34: , 15482-15489. |
[58] | Asai H , Ikezu S , Tsunoda S , Medalla M , Luebke J , Wolozin B , Butovsky O , Ikezu T , Therapeutics E ((2015) ) Depletion of microglia and inhibition of exosome synthesis halt tau propagation. Nat Neurosci 18: , 1584-1593. |
[59] | Condello C , Schain A , Grutzendler J ((2011) ) Multicolor time-stamp reveals the dynamics and toxicity of amyloid deposition. Sci Rep 1: , 1-12. |
[60] | Su JH , Cummings BJ , Cotman CW ((1994) ) Early phosphorylation of tau in Alzheimer’s disease occurs at Ser-202 and is preferentially located within neurites. Neuroreport 5: , 2358-2362. |
[61] | Su JH , Cummings BJ , Cotman CW ((1996) ) Plaque biogenesis in brain aging and Alzheimer’s disease. I. Progressive changes in phosphorylation states of paired helical filaments and neurofilaments. Brain Res 739: , 79-87. |
[62] | Mondragón-Rodríguez S , Perry G , Luna-Muñoz J , Acevedo-Aquino MC , Williams S ((2014) ) Phosphorylation of tau protein at sites Ser396-404 is one of the earliest events in Alzheimer’s disease and Down syndrome. Neuropathol Appl Neurobiol 40: , 121-135. |
[63] | Gong C-X , Iqbal K ((2008) ) Hyperphosphorylation of microtubule-associated protein tau: A promising therapeutic target for Alzheimer disease. Curr Med Chem 15: , 2321-2328. |
[64] | Avila J , León-Espinosa G , García E , García-Escudero V , Hernández F , DeFelipe J ((2012) ) Tau phosphorylation by GSK3 in different conditions. Int J Alzheimers Dis 2012: , 578373. |
[65] | Morsch R , Simon WCP ((1999) ) Neurons may live for decades with neurofibrillary tangles. J Neuropathol Exp Neurol 58: , 188-197. |
[66] | Ferrer I ((2012) ) Defining Alzheimer as a common age-related neurodegenerative process not inevitably leading to dementia. Prog Neurobiol 97: , 38-51. |
[67] | Sepulcre J , Grothe MJ , Sabuncu M , Chhatwal J , Schultz AP , Hanseeuw B , El Fakhri G , Sperling R , Johnson KA ((2017) ) Hierarchical organization of tau and amyloid deposits in the cerebral cortex. JAMA Neurol 74: , 813-820. |
[68] | Guo J-P , Arai T , Miklossy J , McGeer PL ((2006) ) Abeta and tau form soluble complexes that may promote self aggregation of both into the insoluble forms observed in Alzheimer’s disease. Proc Natl Acad Sci U S A 103: , 1953-1958. |
[69] | Harris JA , Koyama A , Maeda S , Ho K , Devidze N , Dubal DB , Yu GQ , Masliah E , Mucke L ((2012) ) Human P301L-mutant tau expression in mouse entorhinal-hippocampal network causes tau aggregation and presynaptic pathology but no cognitive deficits.. PLoS One 7: , e45881. |
[70] | Vemuri P , Schöll M ((2017) ) Linking amyloid-β and tau deposition in Alzheimer disease. JAMA Neurol 74: , 766-768. |
[71] | O’Keefe J , Dostrovsky J ((1971) ) The hippocampus as a spatial map. Preliminary evidence from unit activity in the freely-moving rat. Brain Res 34: , 171-175. |
[72] | Overington DWU , Jeffery KJ ((2016) ) Hidden depths in the hippocampal circuitry. Neuron 91: , 499-501. |
[73] | Van Strien N, Cappaert N, Witter M ((2009) ) The anatomy of memory: An interactive overview of the parahippocampal-hippocampal network. Nat Rev Neurosci 10: , 272–282. |
[74] | Naber PA , Lopes Da Silva FH , Witter MP ((2001) ) Reciprocal connections between the entorhinal cortex and hippocampal fields CA1 and the subiculum are in register with the projections from CA1 to the subiculum. Hippocampus 11: , 99-104. |
[75] | Henriksen EJ , Colgin LL , Barnes CA , Witter MP , Moser MB , Moser EI ((2010) ) Spatial representation along the proximodistal axis of CA1. Neuron 68: , 127-137. |
[76] | Fanselow M , Dong H-W ((2010) ) Are the dorsal and ventral hippocampus functionally distinct structures. Neuron 65: , 1-25. |
[77] | Nakazawa Y , Pevzner A , Kazumasa TZ , Wiltgen BJ ((2016) ) Memory retrieval along the proximodistal axis of CA1. Hippocampus 26: , 367-402. |
[78] | Walker M , Kublin JG , Zunt JR ((2009) ) Soluble pathological tau in the entorhinal cortex leads to presynaptic deficits in an early Alzheimer’s disease model. Acta Neuropathol 42: , 115-125. |
[79] | Dorostkar MM , Zou C , Blazquez-Llorca L , Herms J ((2015) ) Analyzing dendritic spine pathology in Alzheimer’s disease: Problems and opportunities. Acta Neuropathol 130: , 1-19. |
[80] | Blazquez-Llorca L , Valero-Freitag S , Rodrigues EF , Merchán-Pérez Á , Rodríguez JR , Dorostkar MM , DeFelipe J , Herms J ((2017) ) High plasticity of axonal pathology in Alzheimer’s disease mouse models. Acta Neuropathol Commun 5: , 14. |
[81] | Buhl E , Whittington M ((2009) ) Local circuits. In Hippocampus Book Andersen P, Morris R, Amaral D, Bliss T, O’Keefe J, eds. Oxford University Press, New York pp. 297-315. |
[82] | Arriagada PV , Growdon JH , Hedleywhyte ET , Hyman BT ((1992) ) Neurofibrillary tangles but not senile plaques parallel duration and severity of Alzheimer’s disease. Neurology 42: , 631-639. |
[83] | Tucker AM , Stern Y ((2011) ) Cognitive reserve in aging. Curr Alzheimer Res 8: , 354-360. |
[84] | Meng X , D’Arcy C ((2012) ) Education and dementia in the context of the cognitive reserve hypothesis: A systematic review with meta-analyses and qualitative analyses.. PLoS One 7: , e38268. |
[85] | Steffener J , Stern Y ((2012) ) Exploring the neural basis of cognitive reserve in aging. Biochim Biophys Acta 1822: , 467-473. |
[86] | Lazarczyk MJ , Hof PR , Bouras C , Giannakopoulos P ((2012) ) Preclinical Alzheimer disease: Identification of cases at risk among cognitively intact older individuals. BMC Med 10: , 127. |
[87] | Stern Y ((2012) ) Cognitive reserve in ageing and Alzheimer’s disease. Lancet Neurol 11: , 1006-1012. |
[88] | Robinson JL , Geser F , Corrada MM , Berlau DJ , Arnold SE , Lee VMY , Kawas CH , Trojanowski JQ ((2011) ) Neocortical and hippocampal amyloid-β and tau measures associate with dementia in the oldest-old. Brain 134: , 3705-3712. |
[89] | Uryu K , Nakashima-Yasuda H , Forman MS , Kwong LK , Clark CM , Grossman M , Miller L.B , Kretzschmar HA , Lee VMY , Trojanowski JW , Neumann M ((2008) ) Concomitant TAR-DNA-binding protein 43 pathology is present in Alzheimer disease and corticobasal degeneration but not in other tauopathies. J Neuropathol Exp Neurol 67: , 555-564. |
[90] | Jucker M , Walker L ((2013) ) Self-propagation of pathogenic aggregates in neurodegenerative diseases. Nature 501: , 45-51. |


