
The Montreal Cognitive Assessment: Normative Data from a German-Speaking Cohort and Comparison with International Normative Samples
Abstract
Background:
The Montreal Cognitive Assessment (MoCA) is used to evaluate multiple cognitive domains in elderly individuals. However, it is influenced by demographic characteristics that have yet to be adequately considered.
Objective:
The aim of our study was to investigate the effects of age, education, and sex on the MoCA total score and to provide demographically adjusted normative values for a German-speaking population.
Methods:
Subjects were recruited from a registry of healthy volunteers. Cognitive health was defined using the Mini-Mental State Examination (score ≥27/30 points) and the Consortium to Establish a Registry for Alzheimer’s Disease-Neuropsychological Assessment Battery (total score ≥85.9 points). Participants were assessed with the German version of the MoCA. Normative values were developed based on regression analysis. Covariates were chosen using the Predicted Residual Sums of Squares approach.
Results:
The final sample consisted of 283 participants (155 women, 128 men; mean (SD) age = 73.8 (5.2) years; education = 13.6 (2.9) years). Thirty-one percent of participants scored below the original cut-off (<26/30 points). The MoCA total score was best predicted by a regression model with age, education, and sex as covariates. Older age, lower education, and male sex were associated with a lower MoCA total score (p < 0.001).
Conclusion:
We developed a formula to provide demographically adjusted standard scores for the MoCA in a German-speaking population. A comparison with other MoCA normative studies revealed considerable differences with respect to selection of volunteers and methods used to establish normative data.
INTRODUCTION
Due to the demographical development, age-related diseases will drastically increase over the next decades. Today, 46.7 million people are suffering from dementia worldwide—a number that is estimated to nearly triple by 2050 and reach 131.5 million cases [1]. To face this healthcare challenge, early and accurate identification of cognitive impairment is crucial. Mild cognitive impairment (MCI) may represent a stage along the clinical continuum of Alzheimer’s disease (AD), and currently there are no drugs proven effective for this disease stage [2]. However, implementing off-label pharmacological treatment might be beneficial in certain patients; non-pharmacological interventions should be initiated; behavioral or psychiatric symptoms common in MCI may be treated; and there is time to consider important life choices when a patient is still able to do so [2]. Additionally, future pharmacological interventions against AD mainly target patients in an incipient disease stage [3], and about 10% of the causes of cognitive impairment are reversible [4].
The early detection of cognitive decline requires a tool that is short, easy to administer and interpret, and has high diagnostic accuracy. Currently, a widely used instrument is the Mini-Mental State Examination (MMSE) [5]. However, the MMSE sensitivity is poor when identifying individuals with MCI [6–8], and it lacks meaningful assessment of executive functions [9]. The Montreal Cognitive Assessment (MoCA) [6] has been developed to address these weaknesses. It has demonstrated better diagnostic accuracy in patients with MCI [10, 11], has less ceiling effect [11], and a higher test-retest-reliability [10]. In addition, the MoCA better captures the cognitive domains proposed in the Diagnostic and Statistical Manual of Mental Disorders (DSM-5) [12]. Accordingly, previous research has demonstrated good practical utility of the MoCA as a diagnostic tool in various diseases affecting cognition [13].
Yet, the implementation of the MoCA has some limitations. First, the proposed cut-off score of 26 out of 30 points [6] has been criticized for being too conservative. A recent review found that MoCA specificity was 60% or lower when applying this cut-off score [14], thus, bearing a high risk of false-positive classifications. Second, possible demographic effects on cognitive performance are not well addressed in the original MoCA, which only includes a basic correction for education (+1 point forindividuals with ≤12 years of education). However, it has been shown that age and—less consistently—sex may influence MoCA scores [13, 15–28]. Finally, the MoCA performance may vary across different cultures and languages [25]. Accordingly, normative values for the MoCA have been established in several countries [13, 15–28]. The results show great variability; most importantly there are substantial differences regarding the empirically derived MoCA cut-off scores [13, 15–28]. Consequently, a general cut-off for all populations might not be suitable, and diagnostic accuracy may be improved when a cut-off score is based on culture-specific and demographically adjusted normative values.
To our knowledge, normative values for the German version of the MoCA have not yet been established. The aim of our study was to evaluate the effects of age, education, and sex on the MoCA and to create demographically adjusted norms for the German version. This report also provides a comparison of normative data from other international samples.
MATERIALS AND METHODS
Participants
Ethical approval for the study (N° EKNZ 2016-00393) was provided by the Ethikkommission Nordwest- und Zentralschweiz (EKNZ) on April 26, 2016. The study was performed in respect of the most recent version of the Declaration of Helsinki and was registered on ClinicalTrials.gov (NCT03246269).
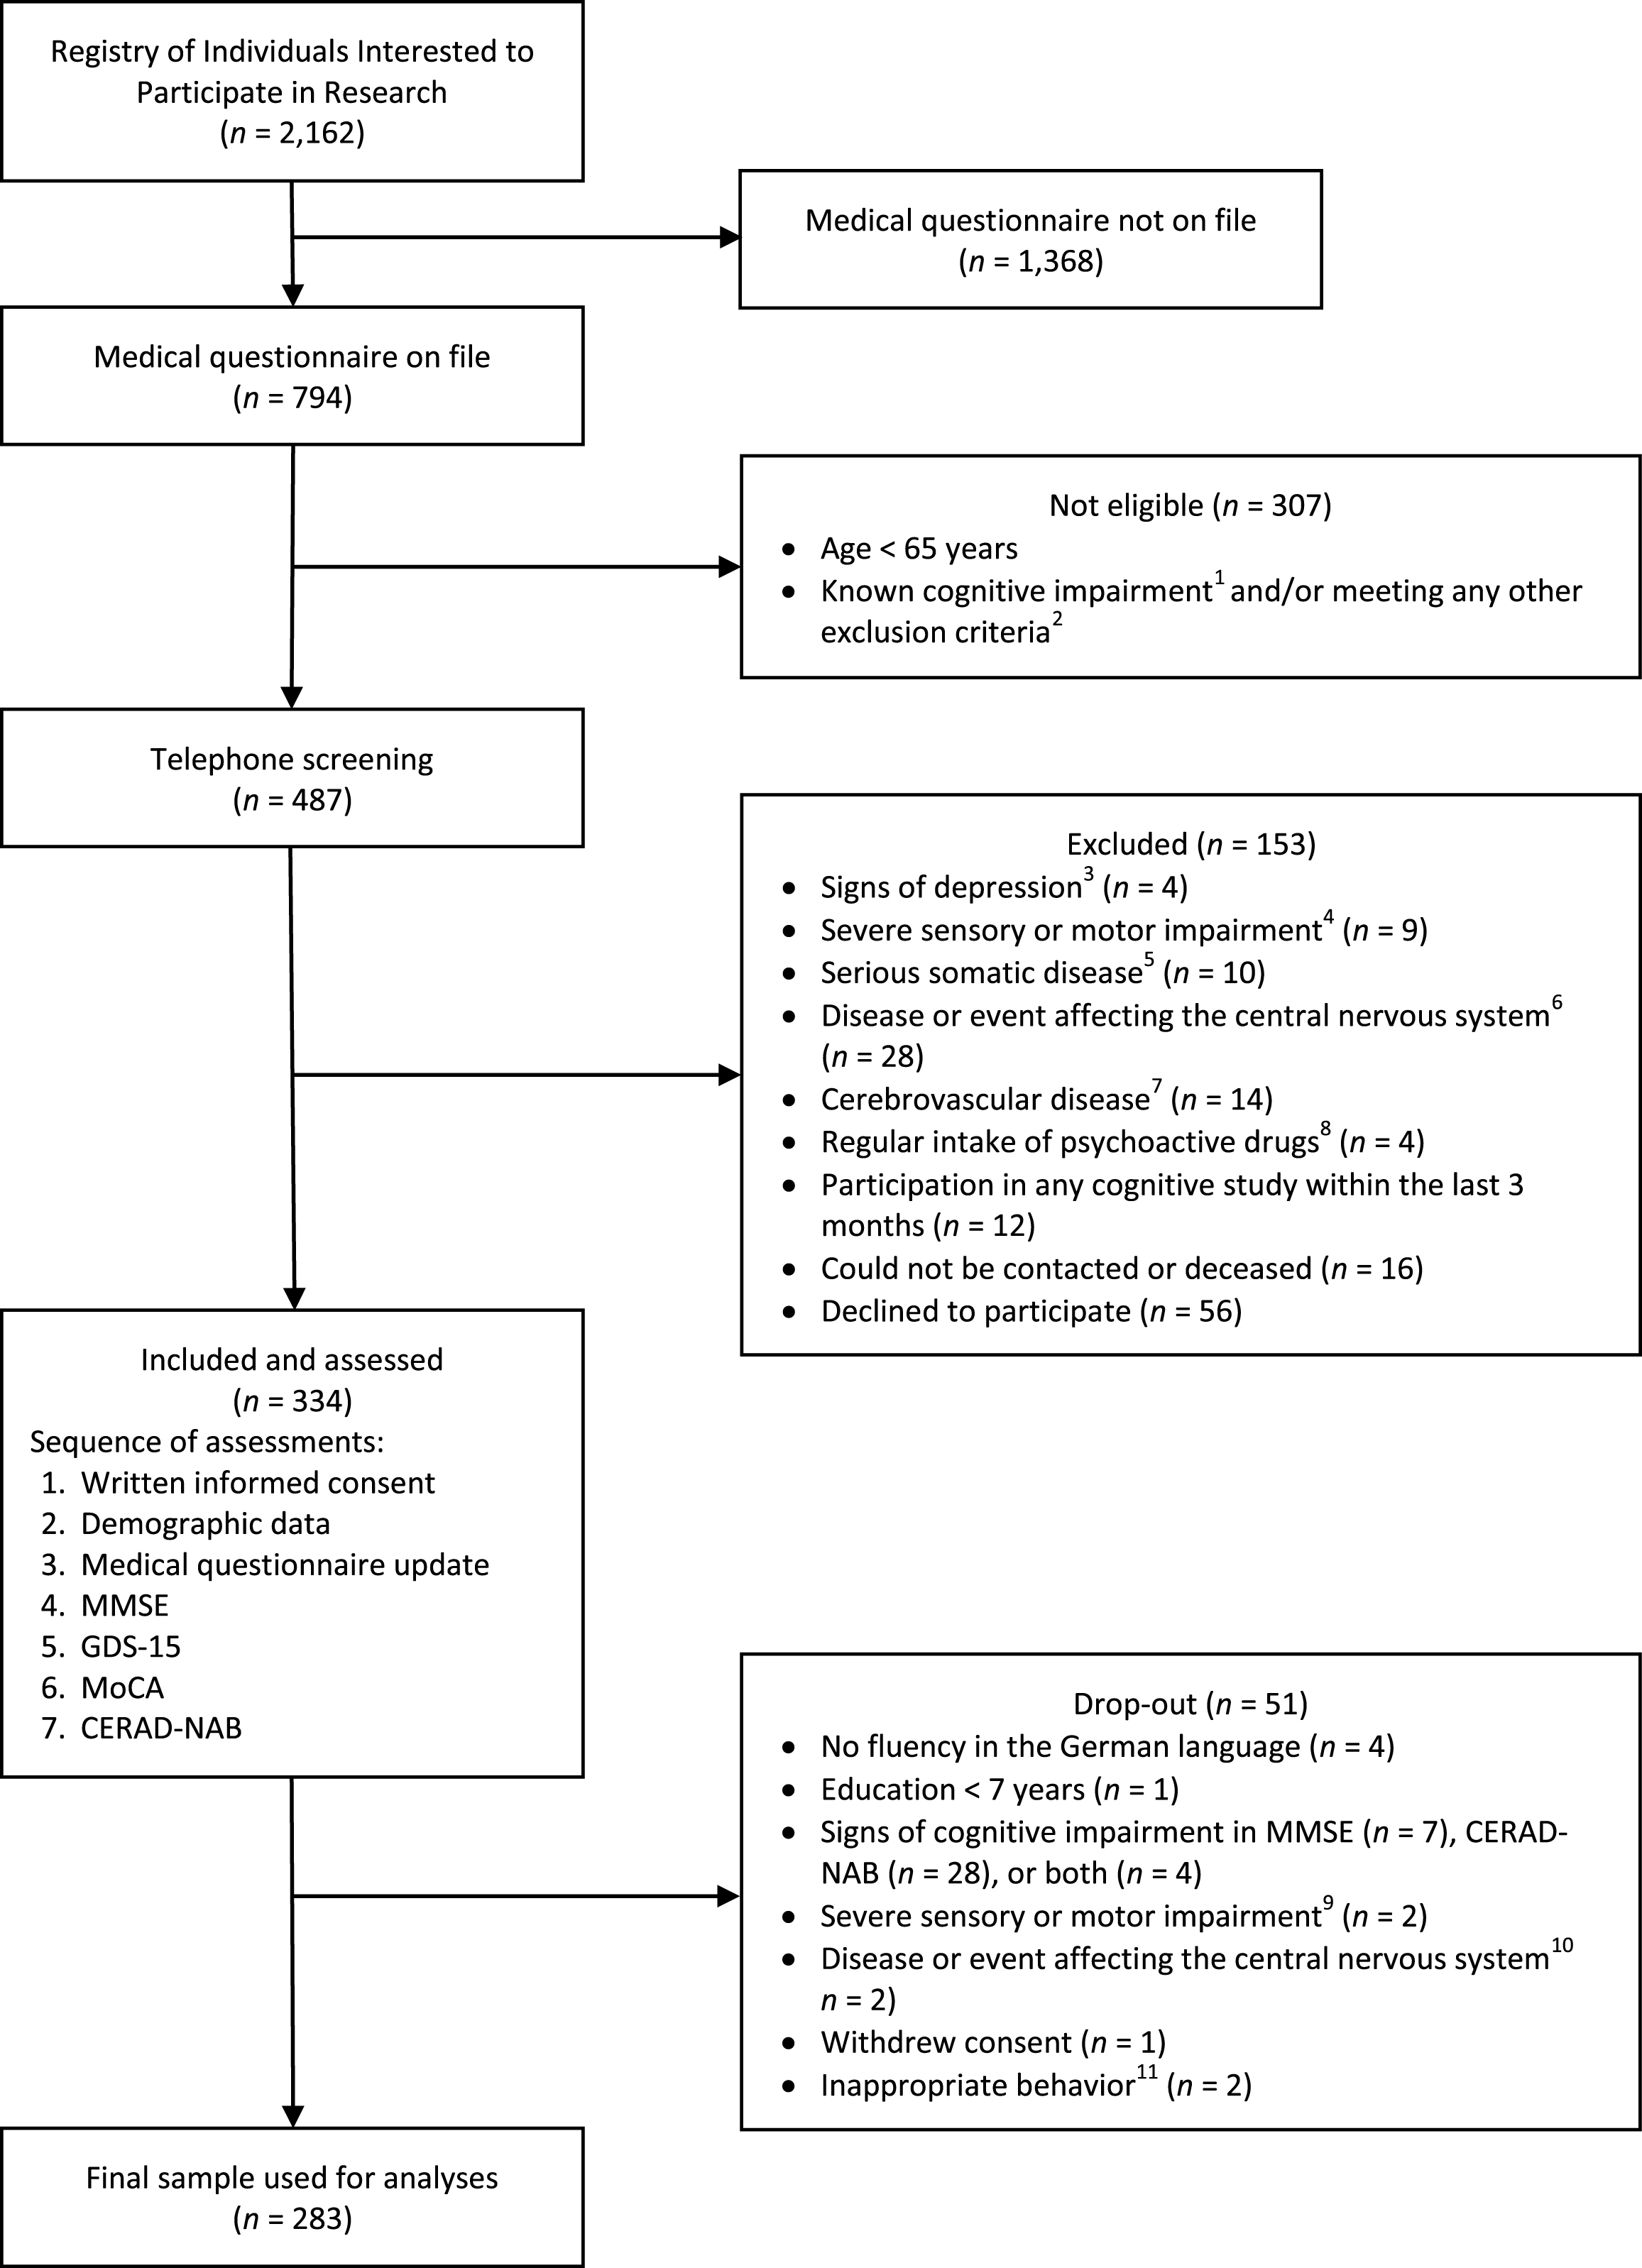
Participants were recruited from an existing Registry of Individuals Interested to Participate in Research established by the Memory Clinic, University Center for Medicine of Aging, Felix Platter Hospital in Basel, Switzerland. The detailed study flow chart is shown in Fig. 1. The registry was established in 2013 with approval from the local ethics committee (N° EKBB 280/12). Individuals were informed about the registry and the possibility to sign-up by means of newspaper advertisements, television interviews, and public scientific lectures. Each time a study with normal control subjects was initiated at the Memory Clinic, potential participants with the required demographic characteristics (age, education, sex) were identified from the registry and invited to provide information about their medical history by completing a detailed medical questionnaire (see Supplementary Figure 1 for an English translation of the medical questionnaire). At the beginning of the current study in December 2016, the registry consisted of 2,162 individuals. Seven-hundred and ninety-four had previously provided their medical history and were considered during the recruitment process of this study. Four-hundred and eighty-seven individuals remained eligible for telephone screening after applying inclusion and exclusion criteria (see below). During the telephone screening, a further assessment of exclusion criteria was performed, and 153 subjects were excluded. Thus, 334 individuals were assessed between December 2016 and April 2017, and the data of 283 subjects were included in the final analysis (see study flow chart for details).
Fig.1
Study flow chart. 1Based on neuropsychological test results in previous studies and/or individuals with any diagnosis of cognitive impairment. 2Based on information provided in the medical questionnaire. 3Signs of depression: reported symptoms of depression and/or current diagnosis of depression and/or current psychotherapy for depression. 4Severe sensory or motor impairment: any visual or auditory impairment not correctable with (reading) glasses or hearing aids; motor impairment of the upper extremity (e.g., essential tremor, paresis, dyskinesia). 5Serious somatic disease (i.e., current chemo- or radiotherapy; severe cardiac, pulmonary, renal, gastrointestinal, or endocrine disease interfering with everyday functioning). 6Disease or event affecting the central nervous system (i.e., meningitis, encephalitis, severe traumatic brain injury with loss of consciousness >5 minutes, intoxication with neurotoxic substances, prior intracranial neurosurgery, general anesthesia within the last three months, previous or current substance addiction (drugs, alcohol, medication)). 7Cerebrovascular disease (i.e., stroke, transient ischemic attack). 8Regular intake of psychoactive drugs (i.e., for treatment of schizophrenia, bipolar disorder, obsessive compulsive disorder, personality disorder; substance-induced mental disorder). 9Macular degeneration (n = 1), hearing impairment interfering with cognitive testing (n = 1). 10Suspected Parkinson’s disease (n = 1), general anesthesia within the last three months (n = 1). 11Subject was verbally offensive towards test administrator (n = 1); subject deliberately made mistakes during cognitive testing (n = 1). CERAD-NAB, Consortium to Establish a Registry for Alzheimer’s Disease-Neuropsychological Assessment Battery; GDS-15, Geriatric Depression Scale (15 items; no subject scored >5/15 points); MMSE, Mini-Mental State Examination; MoCA, Montreal Cognitive Assessment.
During the recruitment process, a stratification of sex (female and male) and age (groups: 65–69, 70–74, 75–79, and >79 years) was applied to obtain age groups with at least 20 women and 20 men each. The aim was to include only cognitively healthy individuals by applying the following criteria. Inclusion criteria were: 1) age ≥65 years, 2) education ≥7 years, 3) fluent German-speaking, and 4) provided written informed consent. Subjects who met one of the following criteria were excluded: 1) cognitive impairment (i.e., MMSE <27/30 and/or Consortium to Establish a Registry for Alzheimer’s Disease-Neuropsychological Assessment Battery (CERAD-NAB) <85.89 [29], any diagnosis of cognitive impairment), 2) diagnosis and/or symptoms of depression (i.e., Geriatric Depression Scale (GDS; [30]) >5/15), 3) severe sensory or motor impairment interfering with cognitive testing, 4) serious somatic disease, 5) any disease or events affecting the central nervous system, 6) cerebrovascular disease, 7) current medication with psychoactive drugs except for benzodiazepines, and 8) participation in a cognitive study within the last 3 months (to avoid practice effects).
Procedures
After obtaining written informed consent, the medical history provided in the medical questionnaire was updated. Then, study eligibility was further assessed with the German versions of the MMSE [5] and the 15-item GDS questionnaire [30]. After completing these screening procedures, all subjects were assessed with the MoCA. The German version of the CERAD-NAB was administered at the end of the assessment to avoid possible interference effects with the MoCA. The MMSE was neither included in this CERAD-NAB version nor used to calculate the CERAD-NAB total score [29]. Subjects meeting any exclusion criteria were omitted from the mainstatistical analysis only after all assessments took place. One out of four psychology master students who were specifically trained for the study examinations carried out the assessments. All assessments took place on one day during 1-2 hours and were held in a quiet room with subjects seated at a table.
We used the official German translation of the MoCA (Version 7, November 2004; http://www.mocatest.org). The cognitive domains assessed are: 1) “Visuospatial/Executive”, 2) “Naming”, 3) “Memory”, 4) “Attention”, 5) “Language”, 6) “Abstraction”, 7) “Delayed Recall”, and 8) “Orientation”. The original version provides an extra point for individuals with lower education (i.e., ≤12 years). Since we aimed at diligently correcting for education, we used the uncorrected MoCA total score in our calculations.
Statistical analysis
The effect of age, education, and sex on the MoCA total score was calculated using regression analysis. Twenty different general linear models were tested to adjust for the covariates age, education, and sex. A complete model search between a minimal and a maximal model was performed [31]. The models included the quantitative covariates, the quantitative covariates’ squares, and their interactions with sex (see Supplementary Table 1 for details).
Table 1
Demographic characteristics
| Age group | n | Age, y | Women, % | Education1, y | GDS-15 total score | CERAD-NAB total score | MMSE total score | MoCA total score |
| 65–69 | 68 | 67.6 (1.4) | 61.8 | 13.2 (2.7) | 0.3 (0.8) | 97.9 (5.5) | 29.4 (0.9) | 26.6 (2.6) |
| 70–74 | 102 | 72.2 (1.3) | 56.9 | 14.0 (2.9) | 0.4 (0.7) | 98.6 (5.2) | 29.4 (0.7) | 26.4 (2.4) |
| 75–79 | 68 | 76.5 (1.4) | 50.0 | 13.7 (3.2) | 0.3 (0.6) | 99.5 (5.9) | 29.3 (0.9) | 25.8 (2.5) |
| >79 | 45 | 82.6 (2.4) | 46.7 | 13.3 (2.8) | 0.4 (0.7) | 99.0 (6.5) | 28.9 (1.0) | 25.1 (2.4) |
| Total | 283 | 73.8 (5.2) | 54.8 | 13.6 (2.9) | 0.4 (0.7) | 98.7 (5.7) | 29.2 (0.9) | 26.1 (2.5) |
Data are presented as mean (SD). 1Years of education was defined as the total number of years in school plus any professional education (not counting years needed to repeat). The maximum education was set at 20 years. In case of multiple specialized educations, only the longest one was counted. CERAD-NAB, Consortium to Establish a Registry for Alzheimer’s Disease-Neuropsychological Assessment Battery; GDS-15, Geriatric Depression Scale (15 items); MMSE, Mini-Mental State Examination; MoCA, Montreal Cognitive Assessment; y = years.
The MoCA total score was transformed using a cubic transformation to achieve normality and homoscedasticity of the residuals. The initial 20 regression models were then recalculated with the transformed score, and the best model was selected. The best model was defined as the model with the minimum Predicted Residual Sum of Squares (PRESS) statistic. This is a leave-one-out cross-validation with PRESS =
Sex differences in the MoCA total score were analyzed using the Mann-Whitney U-Test. Spearman’s rank correlation for non-parametric data was used to investigate the associations between the MoCA, the CERAD-NAB, and the MMSE total scores. Kendall’s Tau for non-parametric data was used to test the associations between the demographic variables and the MoCA subdomains. Raw scores (i.e., not demographically corrected) were used in allanalyses.
The required sample size was 171 participants. This allows the estimation of the 5th and the 95th percentile with no more than 2% deviation. Ten additional subjects were included per predictor variable (age, sex, education, and three expected interactions) to account for adjustments in the regression models. Thus, the minimum required sample size was 231 to account for all the predictor variables in the regression model [32].
All statistical analyses were performed using R, version 3.4.1 (R Foundation, Vienna, Austria) and RStudio Desktop (RStudio, Boston, MA, USA). Data are presented as mean (SD), unless stated otherwise.
RESULTS
Descriptive analysis
Two hundred and eighty-three cognitively healthy individuals (155 women, 128 men) were included in the final analysis. Participants’ mean age was 73.8 (5.2) years, ranging from 65 to 91 years. Education was 13.6 (2.9) years, ranging from 7 to 20 years. The MoCA total score was 26.1 (2.5) points, and the MMSE total score was 29.2 (0.9) points. Detailed demographics are shown in Table 1. Medical history and current medications of all subjects were assessed based on the medical questionnaire and are displayed in Table 2.
Table 2
Medical history and current medications
| Age group | n | History of head trauma1 | Prior general anesthesia2 | Prior diagnosis of major depression3 | Prior psychiatric hospita-lization4 | Regular alcohol consum-ption5 | Oral anticoagulants/ antiplatelet drugs | Anti-hypertensive drugs | Statins | Oral antidiabetic drugs |
| 65–69 | 68 | 5 (7.4) | 59 (86.8) | 3 (4.4) | 1 (1.5) | 45 (66.2) | 5 (7.4) | 20 (29.4) | 14 (20.6) | 4 (5.9) |
| 70–74 | 102 | 11 (10.8) | 85 (83.3) | 7 (6.9) | 3 (2.9) | 61 (59.8) | 13 (12.7) | 36 (35.3) | 14 (13.7) | 6 (5.9) |
| 75–79 | 68 | 5 (7.4) | 56 (82.4) | 0 (0) | 1 (1.5) | 49 (72.1) | 17 (25.0) | 31 (45.6) | 18 (26.5) | 1 (1.5) |
| >79 | 45 | 4 (8.9) | 39 (86.7) | 1 (2.2) | 0 (0) | 26 (57.8) | 19 (42.2) | 25 (55.6) | 14 (31.1) | 3 (6.7) |
| Total | 283 | 25 (8.8) | 239 (84.5) | 11 (3.9) | 5 (1.7) | 181 (64.0) | 54 (19.1) | 112 (39.6) | 60 (21.2) | 14 (4.9) |
Data are presented as n (%). 1Mild head trauma with or without loss of consciousness <5 minutes. 2General anesthesia at least three months prior to study participation. 3No current diagnosis of major depression and/or current psychotherapy for major depression. 4Due to psychiatric diseases that occurred in the past (e.g., major depression). 5Participants answering the question: “Do you drink alcohol regularly?” with: “yes”.
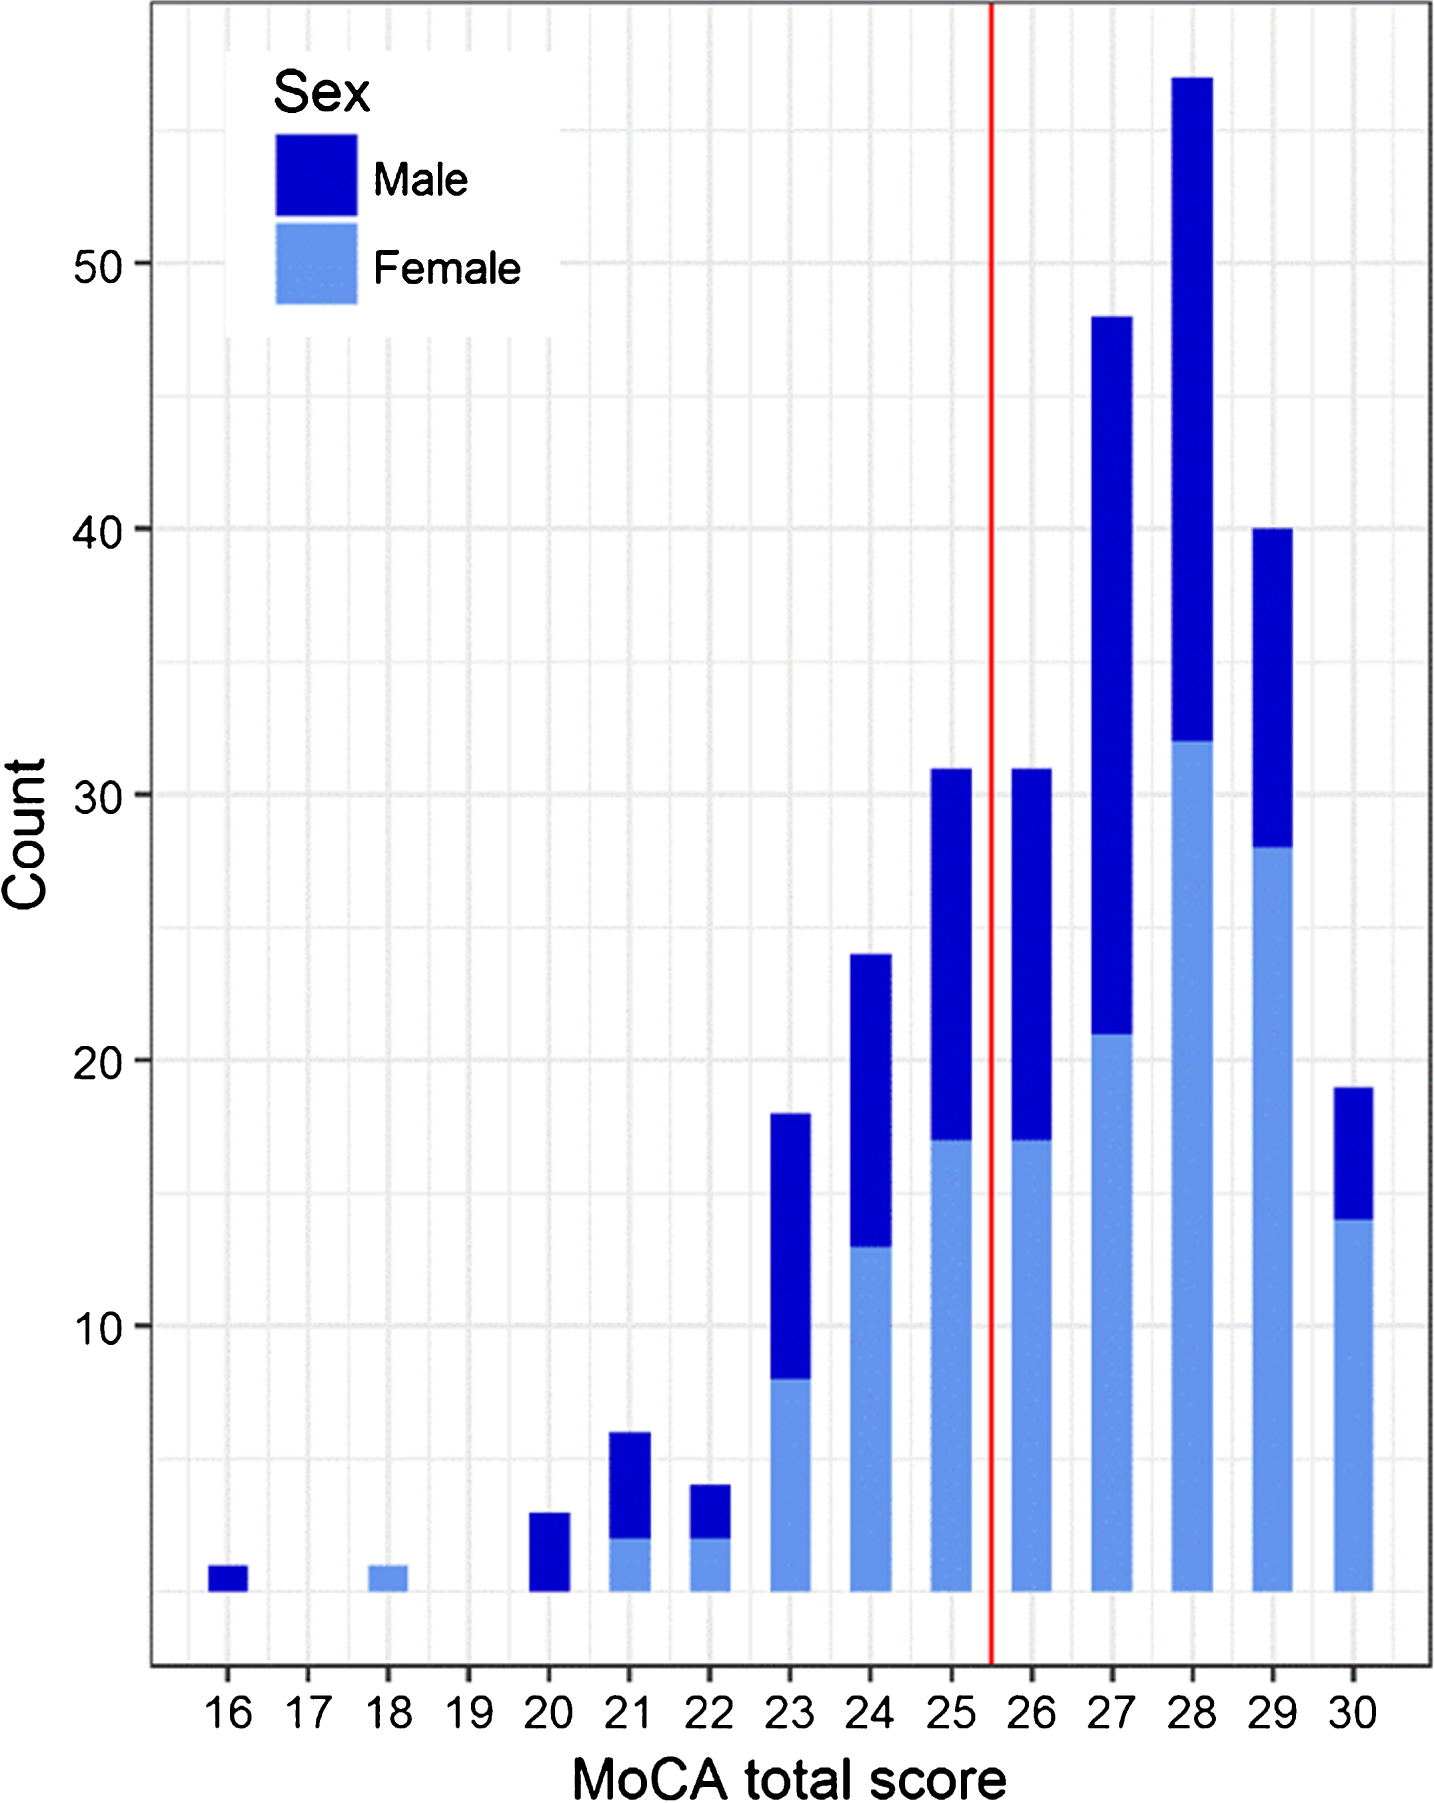
The MoCA total scores ranged from 15 to 30 points when corrected for education [6]. Their distribution is shown in Fig. 2. Eighty-eight of the 283 subjects (31.1%) scored below the cut-off score of <26/30 points. The mean MoCA total score was higher for women than for men (26.3 (2.4) versus 25.7 (2.6) points, p = 0.042). The rates of subjects with the maximum scores in subdomains were: “Visuospatial/Executive” = 50.2%, “Naming” = 99.3%, “Attention” = 76.0%, “Language” = 52.7%, “Abstraction” = 56.9%, “Delayed Recall” = 29.7%, and “Orientation” = 93.3%. The MoCA total score showed a moderate positive correlation with the CERAD-NAB total score (rs = 0.45, p < 0.001) and a weak positive correlation with the MMSE total score (rs = 0.20 p < 0.001). A weak positive correlation was also observed between MMSE and CERAD-NAB total scores (rs = 0.23, p < 0.001). There were no missing values in any of the analyses.
Fig.2
Distribution of corrected MoCA total scores. The line indicates the originally proposed MoCA cut-off (26/30 points). In our study, 88 subjects (31.1%) scored below this cut-off.
Demographic influences on the MoCA total score
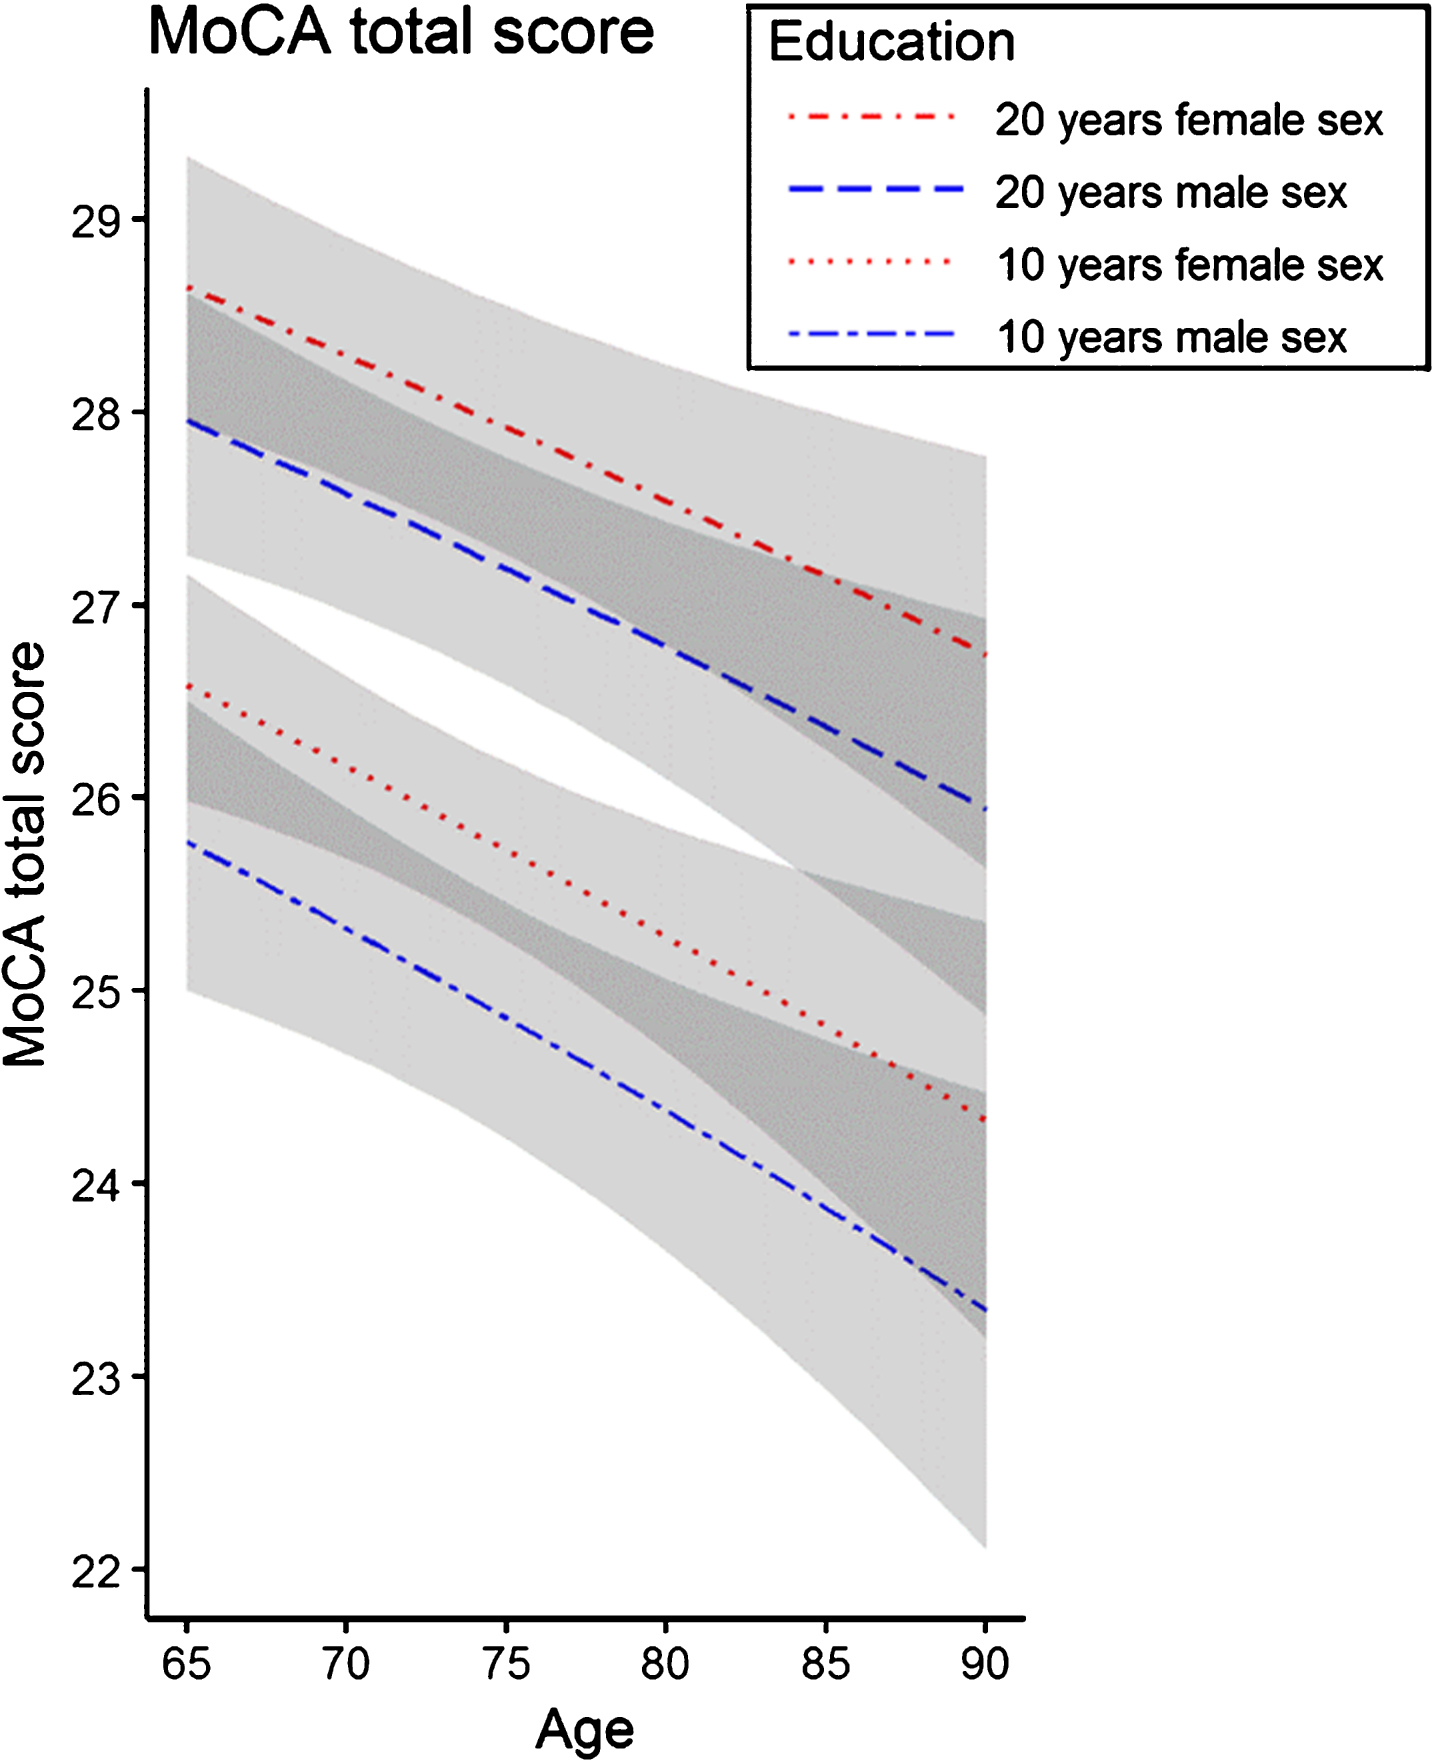
The MoCA total score was best predicted by a regression model with age, education, and sex (adjusted R2 = 0.12, F = 14.2, p < 0.001), explaining 12% of the variance. In the regression analysis, increasing age (p < 0.001), less education (p < 0.001), and male sex (p = 0.003) were associated with a lower MoCA total score. The t-values indicate that this effect is strongest for education (t = 4.99), followed by age (t = – 3.41), and sex (t = 3.02). The associations between the MoCA total score and demographic characteristics are shown in Fig. 3. An analysis of the influence of demographic variables on the MoCA subdomains is presented in Supplementary Table 2.
Fig.3
Association of the MoCA total score with age, education, and sex. Exemplary regression lines are shown for 10 and 20 years of education, respectively. The regression model indicates that the MoCA total score is lower with increasing age and fewer years of education. Overall, female sex was associated with a higher MoCA total score than male sex. The areas in grey represent the 95% confidence intervals.
Z-score calculation
The z-scores are based on the formula: z = (transformed score - expected score) / residual standard deviation. A nearly normal distribution of the residuals was achieved using a cubic transformation of the raw MoCA total score. The formula for the demographically corrected z-score was derived from the final regression model. The z-score can be calculated as follows: z = MoCA total score3 - (23816.36 + (– 175.821 * age) + (472.9053 * education) + (1672.542 * sex)) / 4470.258. Sex is coded as male = 0 and female = 1. Age and education are entered in integer values (years). We followed the example of Weintraub and colleagues (2017) [33] and will provide a web-based calculation tool (http://www.mocatest.ch) to automatically determine the z-score by entering the individual demographic data and MoCA total score.
Cut-off scores
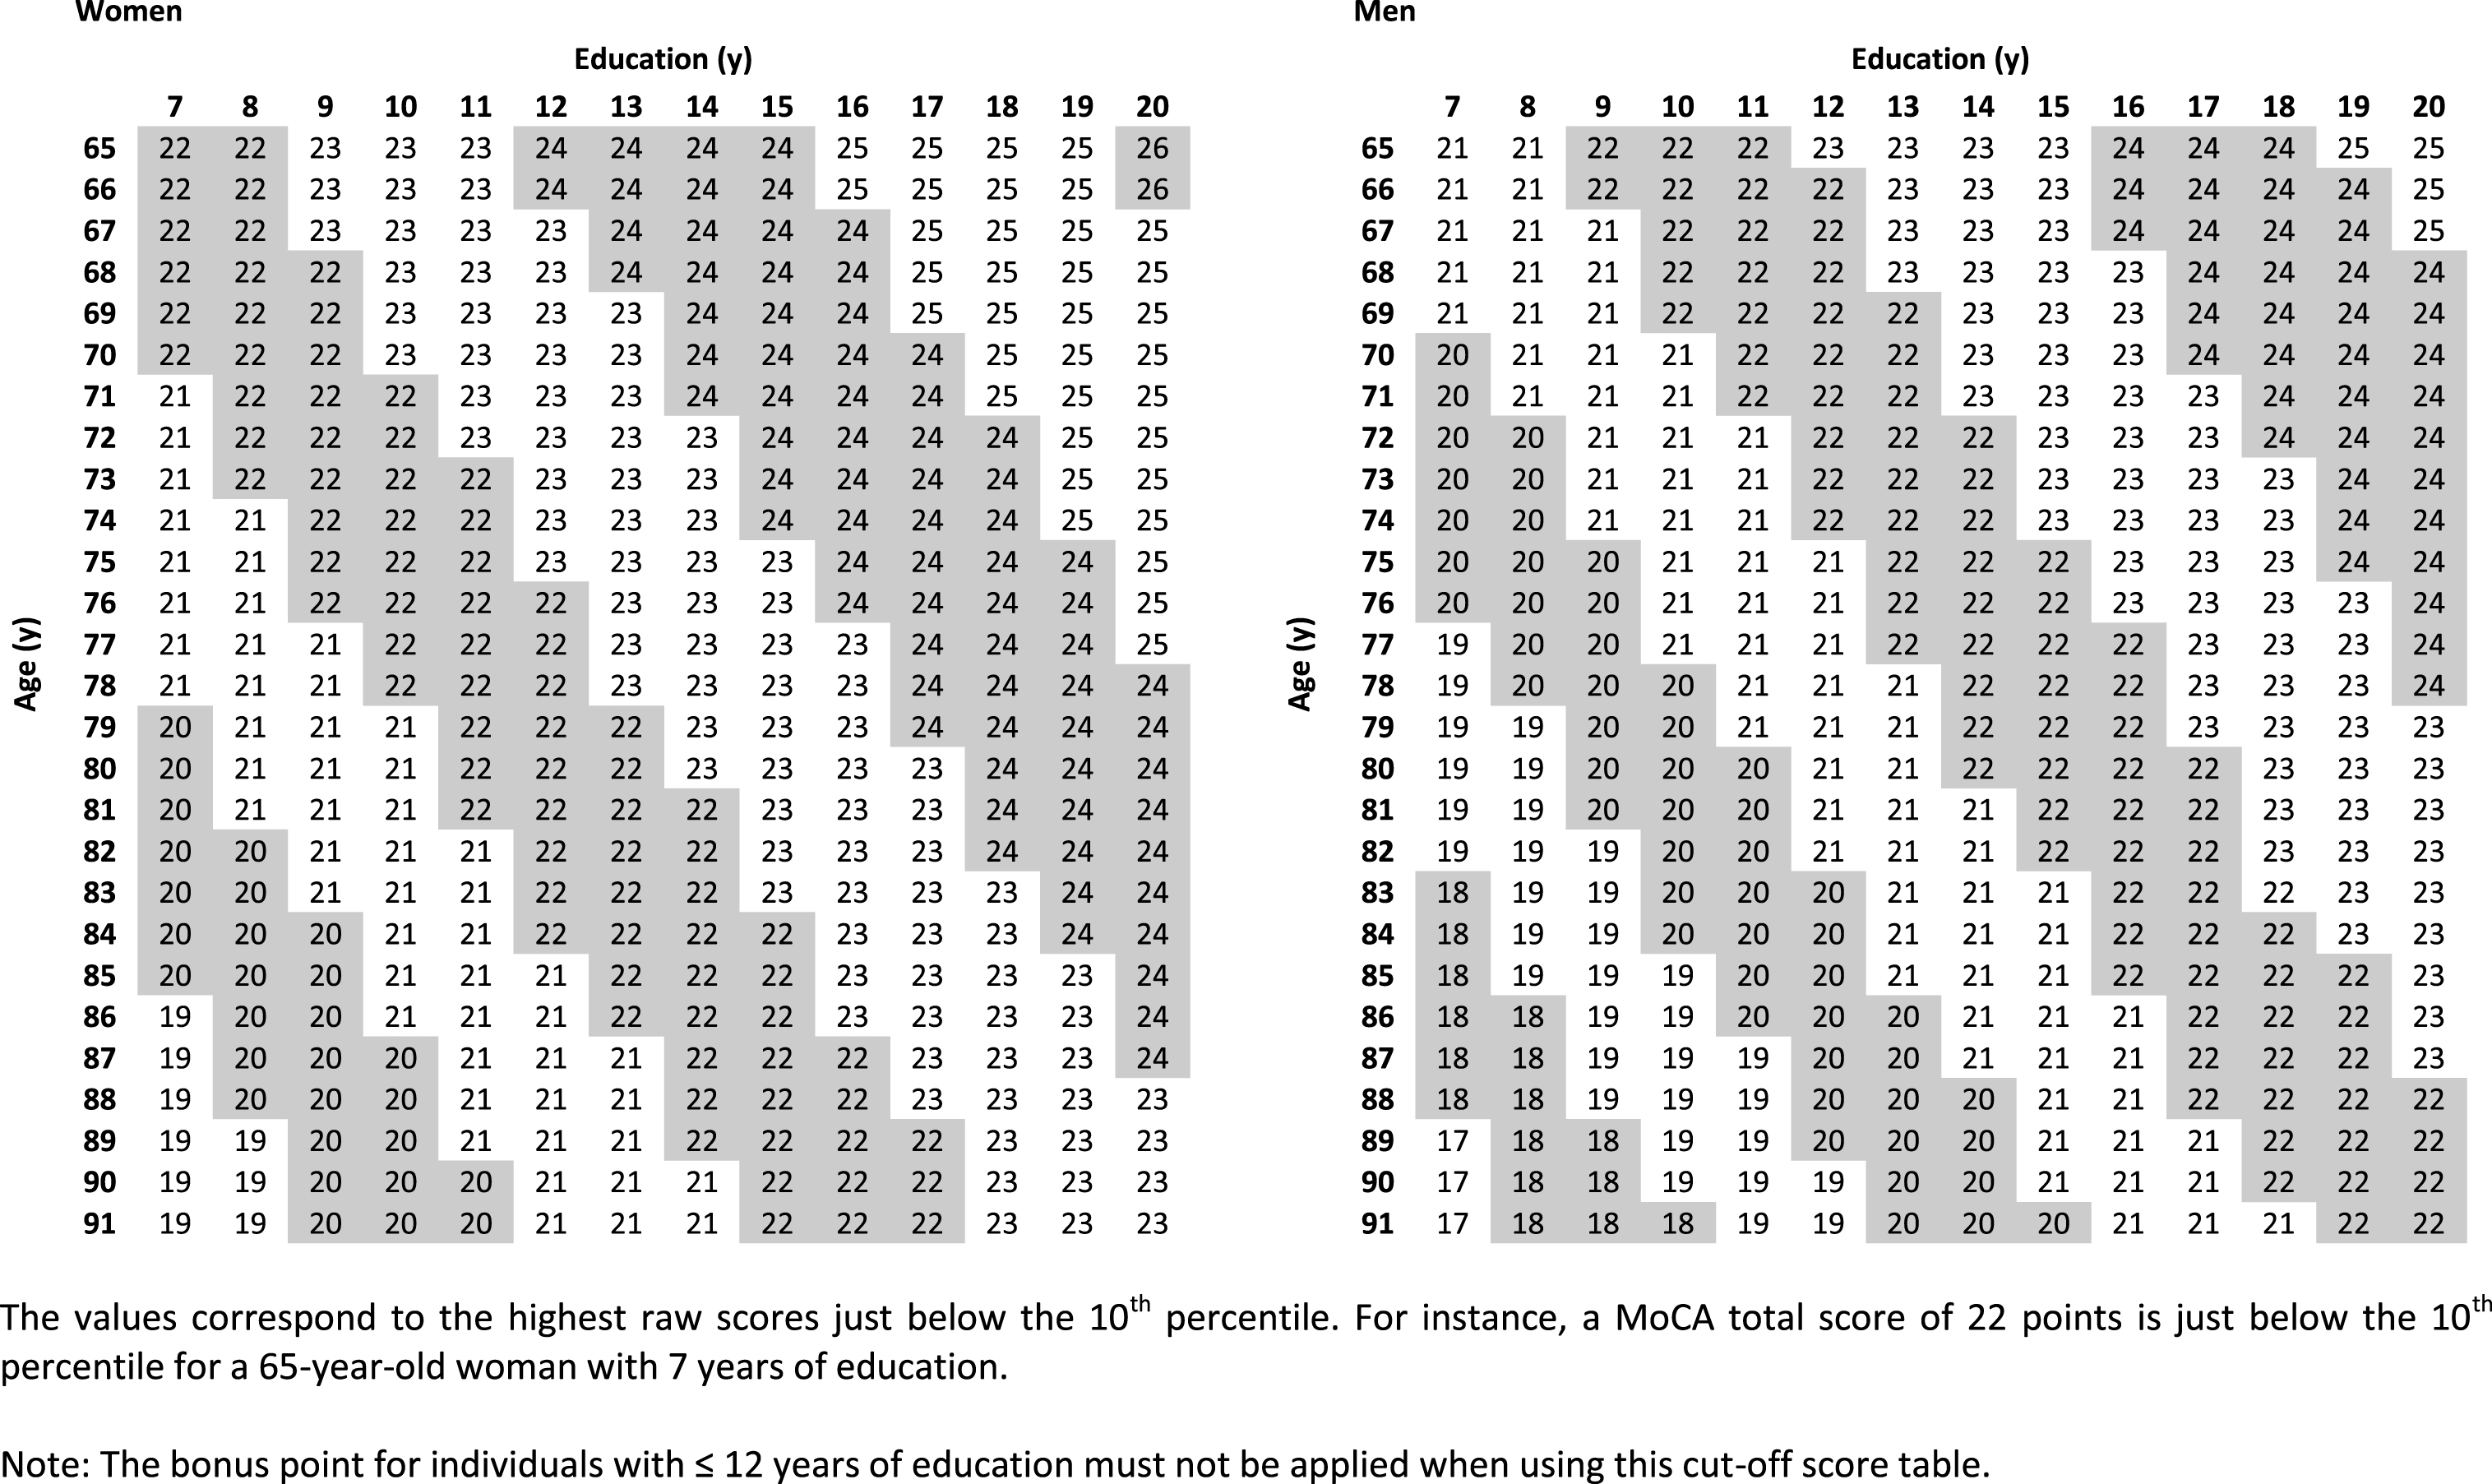
Cut-off values were calculated based on the z-score formula (Table 3). The calculation was done separately for women and men for each year of age (65–91) and year of education (7–20). The cut-off was set at a z-score of ≤– 1.28 (10th percentile) to achieve 90% specificity. The applied percentiles may vary depending on the specific setting (e.g., screening in research or case-finding). We, therefore, chose to establish normative tables for the most common percentiles used. All cut-off score tables (i.e., – 1.64 SD (5th percentile), – 1 SD (16th percentile), – 1.5 SD (7th percentile), and – 2 SD (2.5th percentile)) are provided in Supplementary Tables 3–6.
Table 3
Highest MoCA total scores located just below the 10th percentile (z-score ≤ –1.28)
 |
DISCUSSION
Our study provides demographically corrected normative values (z-scores) for the German version of the MoCA. The MoCA total score was influenced by age, education, and sex, which is in line with previous normative studies of the MoCA [13, 19, 28]. Other studies found significant effects of age and education, but not for sex [16–18, 20–27]. While there is a basic adjustment for education in the original version (+1 point for education ≤12 years), our analyses provide a more precise correction for this important influencing factor. Moreover, we made necessary adjustments for age and sex, which are lacking in the original version.
Considering these demographic influences will likely improve the diagnostic accuracy of the MoCA. For instance, in our sample of cognitively healthy participants, 88 subjects (31.1%) scored below the originally proposed cut-off score of 26 points [6], even when the bonus point was given for individuals with ≤12 years of education. The demographically corrected cut-off values provided in our study may reduce this false-positive rate. For example, a MoCA total score of 23 in an 85-year-old man (hypothetical patient 1) with 8 years of education is considered to be pathological according to the originally recommended cut-off score, even if one point would be added due to education ≤12 years. However, his demographically corrected z-score (based on our study) is – 0.11, which is still considered to be within normal limits. In contrast, a MoCA total score of 26 points in a 65-year-old woman (hypothetical patient 2) with 20 years of education is considered to be within normal limits. Yet, her demographically corrected z-score (based on our study) is – 1.33, which is below the 10th percentile and, therefore, pathological. These two examples illustrate that using demographically adjusted normative values lead to a decrease of false-positive (hypothetical patient 1) and false-negative results (hypothetical patient 2), respectively.
In our analysis, 12% of the variance in the MoCA total score was explained by demographic characteristics, while other authors reported an explained variance up to 49% [17]. This discrepancy is likely due to the much larger age range in some studies. Because both age and education influence cognitive performance, the variance increases when age or education ranges are broad. Consequently, including these variables in a regression model will explain more of the variance. When paralleling our findings to a study with a smaller age range [13], results are very comparable (R2 = 0.11).
In our study, the correlation between the MoCA and CERAD-NAB total scores was much higher than the correlation between the MMSE and CERAD-NAB total scores. This suggests that the MoCA assesses cognition in a more comprehensive way compared to the MMSE. Twenty-eight excluded subjects scored below the cut-off on the CERAD-NAB, but still had an MMSE score ≥27 points, supporting the notion that the MMSE lacks sensitivity for detection of MCI. In this context, a recent report by Chapman and colleagues [34] indicates that the MMSE might be unsuitable to define eligibility for AD clinical trials. There is a clear need for a cognitive screening tool with high diagnostic accuracy for subject enrollment in AD studies. Future studies may verify whether the MoCA (used with appropriate norms) is more suitable to determine subjectselection.
Comparison with international normative samples
In recent years, several research groups conducted normative studies for the MoCA in different languages. An overview of the existing literature is provided in Table 4. The majority of these reports suggest that the originally proposed MoCA cut-off score of 26 points is too conservative. Nine out of 14 normative studies reported a mean MoCA total score <26 points in their sample [15–17, 20, 22, 23, 25–27]. In general, studies reported the mean MoCA total score without the one-point correction for education; one study did not mention whether the correction was applied [17]. When applying the bonus point for education, nearly one-third of our sample scored below the cut-off of 26 points. Previous normative studies using the original cut-off score reported false-positive rates of 46% [22] up to76% [26].
Table 4
Overview of international normative data for the MoCA
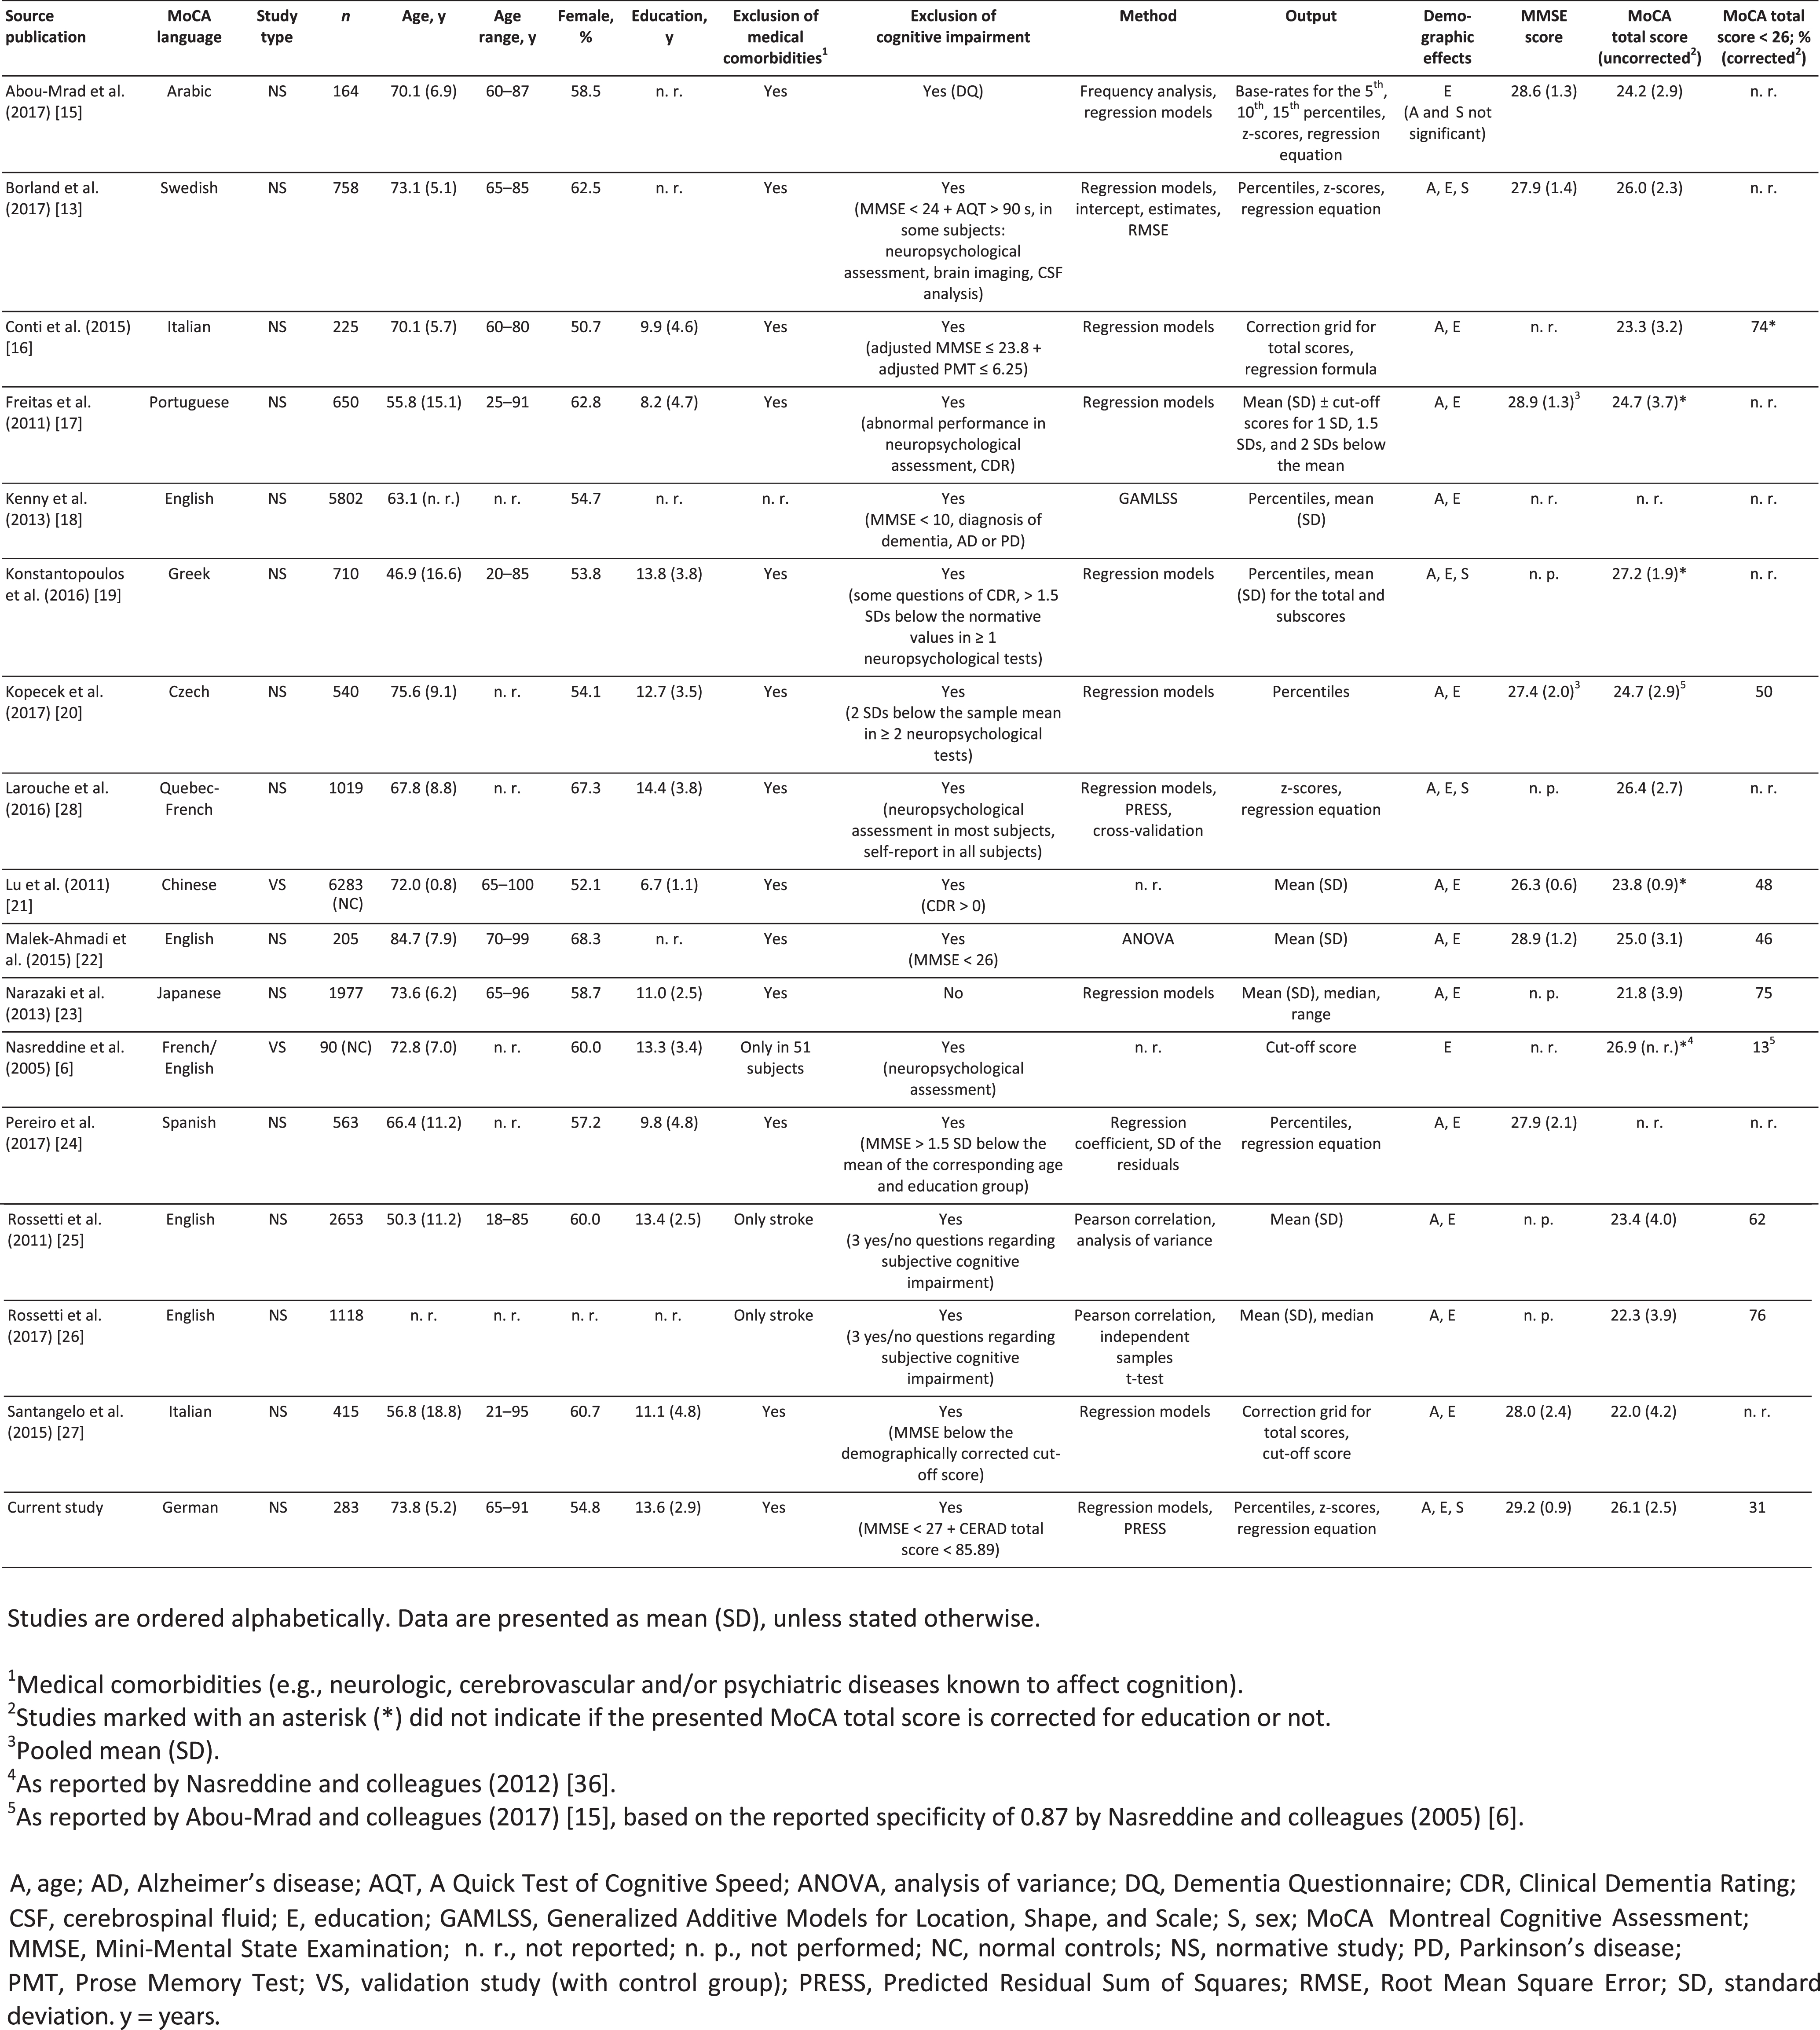 |
There are several explanations for these high false-positive rates and their substantial variation between studies. First, the MoCA total score might be influenced by intercultural and language differences (e.g., socioeconomic or sociodemographic factors, different word lengths originating from translations [20, 21, 26, 35]). One study suggests that ethnicity may influence the MoCA total score [26]. However, this may be explained by disparities in socioeconomic factors (e.g., quality of education) rather than ethnicity itself [35]. Second, there are important differences in sample sizes, ranging from n = 90 [6] to n = 6,283 [21]. Larger samples may better represent the general population and decrease the risk of sampling errors [35]. Yet, even large studies may have small cell sizes, when distinct subgroups (e.g., age categories) are defined to create norms. Third, not all studies were intended as normative studies, and data may have been collected for other purposes [13, 22–26, 28]. These “samples of convenience” may lack appropriate inclusion/exclusion criteria and standard procedures in MoCA administration, leading to increased variability within samples, especially if data are gathered from multiple centers [35]. Fourth, there are substantial dissimilarities in the demographic characteristics of study participants. Mean age differs by almost 40 years between the youngest [19] and the oldest sample [22]. Large variances can also be seen in mean education, ranging from 8.2 (4.7) [17] to 14.4 (3.8) [28] years. Considering the effects of these demographic characteristics on the MoCA performance, differences in mean age or education possibly lead to variances in the mean MoCA total score among studies. Finally, normative studies diverge regarding inclusion/exclusion criteria [13, 23, 36]. Cognitive health of participants is of utmost importance in normative studies, particularly if subtle cognitive changes should be detected. In some normative studies, cognition was assessed using methods that might not be sensitive enough to detect subtle cognitive impairment [18, 25, 26]. Other investigators did not screen for cognitive impairment at all [23].
Cognitive health in normative samples
There are two different methodological approaches to normative studies. One is to rely on a population-based sample to create norms; for the other, a sample of indisputably healthy volunteers is chosen. Both methods bear the risk of inducing bias: while the former is prone to false-negative errors, the latter is prone to false-positive ones [35]. In our study, we chose the latter approach and applied stringent criteria to assure cognitive health of the participants. One might argue that such rigorous exclusion criteria may lead to a sample of “supernormal” individuals. However, the population-based approach does not seem appropriate when normative data are collected for an elderly population. Since the incidence and prevalence of MCI increases with age [2], the probability of erroneously including individuals suffering from a cognitive disorder increases as well. Including cognitively impaired individuals in a normative group lowers the reference range for cognitive health, and the distinction between the two groups (MCI versus healthy individuals) will be less clear. Consequently, it is very likely that the sensitivity for the detection of MCI decreases when relying on a population-based approach. Thus, we consider the criteria of indisputable cognitive health as a mandatory prerequisite for normative data.
Strengths and limitations
A regression-based approach yields some important advantages over the traditional norming method (i.e., reference ranges for cells of age and/or education groups). First, in traditional norming the sample is divided into subgroups. This leads to relatively small sample sizes per group, even if the overall sample size is quite large [31]. In contrast, regression-based norming considers the whole sample, and the continuous variables (i.e., age and education) are analyzed in their full range. Second, relying on age and/or education groups to create norms may misrepresent individuals who are situated close to the boundary of a subgroup [28]. Moreover, due to the more or less arbitrarily chosen subgroup boundaries, traditional norming may not properly reflect the natural development of cognitive performance [35]. The regression-based approach, however, considers the overall trend in the data. Third, the regression-based approach allows to simultaneously study multiple covariates and their potential interactions.
We acknowledge some limitations of our study. First, there may be a selection bias as our participants were recruited from an existing registry of individuals interested in taking part in research projects. These individuals may potentially show a greater motivation to perform well in cognitive testing than the average population. Individuals who participated in this study completed the Swiss educational system. Although the educational system in Switzerland is not 100% equal to the educational systems in other German-speaking countries [37], we believe that the acquired normative data are suitable for German-speaking populations in general. Our norms are intended for the elderly population and cannot be applied to individuals younger than 65 years. Second, cognitive test performance is commonly adjusted for demographic influences. Yet, some authors question if demographic adjustments are appropriate in dementia diagnostics, because age and education are known risk factors for cognitive impairment [23, 35]. O’Connell and Tuokko (2010) found that the overall diagnostic accuracy is comparable for raw versus adjusted scores [38]. While having lower sensitivity, the adjusted scores were shown to have better specificity. As our results show, MoCA performance declines with older age and/or lower education (Table 3). Therefore, when using a simple cut-off, the rate of false-positives may be higher with increasing age and/or lower education. Thus, adjusted scores may be more appropriate if the MoCA is used for diagnostic purposes in elderly individuals.
Our aim was to enhance the sensitivity of the MoCA by excluding any individuals with signs of cognitive impairment. In addition, specificity likely increases when applying a demographic adjustment of the obtained total score. However, the current normative data are not suitable to determine the exact diagnostic accuracy of the German MoCA. This version of the MoCA must first be validated in cognitively impaired patients, which is a follow-up project.
Conclusions
This study provides normative values for the German version of the MoCA. Our findings support the frequent statement that the originally proposed cut-off score may be too conservative. The MoCA performance was influenced by age, education, and—less consistently—by sex in all available studies, including ours. Thus, using demographically adjusted norms will improve the diagnostic accuracy of the MoCA. In addition, we observed a high level of heterogeneity in the methodology of existing normative studies. Therefore, we strongly suggest an international harmonization of guidelines for normative studies to enhance comparability in the future.
ACKNOWLEDGMENTS
We gratefully acknowledge the help of all participating volunteers, as well as the staff of the Memory Clinic, University Center for Medicine of Aging Basel, Felix Platter Hospital, Basel, Switzerland. In particular, we thank Panagiota Mistridis, PhD, and Sabine Krumm, PhD, for providing advice during study conduction, and Ursi Kunze, MSc, for her support in database management. We thank Andrina Baitella, BSc, Sarah Roesiger, BSc, Jael Fasnacht, BSc, and Antonino Cusano, BSc, for their help in conducting the study interviews and Allison Dwileski, BSc, for proof-reading the manuscript.
Financial support for this research was provided from internal sources from the Memory Clinic, University Center for Medicine of Aging, Felix Platter Hospital, Basel, Switzerland and from the Department of Anesthesia, Surgical Intensive Care, Prehospital Emergency Medicine and Pain Therapy, University Hospital Basel, Basel, Switzerland. There was no external financial and material support.
Authors’ disclosures available online (https://www.j-alz.com/manuscript-disclosures/18-0080r2).
SUPPLEMENTARY MATERIAL
[1] The supplementary material is available in the electronic version of this article: http://dx.doi.org/10.3233/JAD-180080.
REFERENCES
[1] | Prince M , Comas-Herrera A , Knapp M , Guerchet M , Karagiannidou M ((2016) ) World Alzheimer Report 2016. Improving healthcare for people living with dementia: Coverage, quality and costs now and in the future. https://www.alz.co.uk/research/world-report-2016. Accessed March 28, (2018) . |
[2] | Petersen RC , Lopez O , Armstrong MJ , Getchius TSD , Ganguli M , Gloss D , Gronseth GS , Marson D , Pringsheim T , Day GS , Sager M , Stevens J , Rae-Grant A ((2018) ) Practice guideline update summary: Mild cognitive impairment: Report of the Guideline Development, Dissemination, and Implementation Subcommittee of the American Academy of Neurology. Neurology 90: , 126–135. |
[3] | Scheltens P , Blennow K , Breteler MM , de Strooper B , Frisoni GB , Salloway S , Van der Flier WM ((2016) ) Alzheimer’s disease. Lancet 388: , 505–517. |
[4] | Clarfield AM ((2003) ) The decreasing prevalence of reversible dementias: An updated meta-analysis. Arch Intern Med 163: , 2219–2229. |
[5] | Folstein MF , Folstein SE , McHugh PR ((1975) ) “Mini-mental state". A practical method for grading the cognitive state of patients for the clinician. J Psychiatr Res 12: , 189–198. |
[6] | Nasreddine ZS , Phillips NA , Bédirian V , Charbonneau S , Whitehead V , Collin I , Cummings JL , Chertkow H ((2005) ) The Montreal Cognitive Assessment, MoCA: A brief screening tool for mild cognitive impairment. J Am Geriatr Soc 53: , 695–699. |
[7] | Roalf DR , Moberg PJ , Xie SX , Wolk DA , Moelter ST , Arnold SE ((2013) ) Comparative accuracies of two common screening instruments for classification of Alzheimer’s disease, mild cognitive impairment, and healthy aging. Alzheimers Dement 9: , 529–537. |
[8] | Ciesielska N , Sokolowski R , Mazur E , Podhorecka M , Polak-Szabela A , Kedziora-Kornatowska K ((2016) ) Is the Montreal Cognitive Assessment (MoCA) test better suited than the Mini-Mental State Examination (MMSE) in mild cognitive impairment (MCI) detection among people aged over 60? Meta-analysis. Psychiatr Pol 50: , 1039–1052. |
[9] | Fu C , Jin X , Chen B , Xue F , Niu H , Guo R , Chen Z , Zheng H , Wang L , Zhang Y ((2017) ) Comparison of the Mini-Mental State Examination and Montreal Cognitive Assessment executive subtests in detecting post-stroke cognitive impairment. Geriatr Gerontol Int 17: , 2329–2335. |
[10] | Ozer S , Young J , Champ C , Burke M ((2016) ) A systematic review of the diagnostic test accuracy of brief cognitive tests to detect amnestic mild cognitive impairment. Int J Geriatr Psychiatry 31: , 1139–1150. |
[11] | Trzepacz PT , Hochstetler H , Wang S , Walker B , Saykin AJ ((2015) ) Relationship between the Montreal Cognitive Assessment and Mini-mental State Examination for assessment of mild cognitive impairment in older adults. BMC Geriatr 15: , 107. |
[12] | American Psychiatric Association ((2013) ). Diagnostic and Statistical Manual of Mental Disorders (DSM-5). American Psychiatric Association, Arlington, VA. |
[13] | Borland E , Nagga K , Nilsson PM , Minthon L , Nilsson ED , Palmqvist S ((2017) ) The Montreal Cognitive Assessment: Normative data from a large Swedish population-based cohort. J Alzheimers Dis 59: , 893–901. |
[14] | Davis DH , Creavin ST , Yip JL , Noel-Storr AH , Brayne C , Cullum S ((2015) ) Montreal Cognitive Assessment for the diagnosis of Alzheimer’s disease and other dementias. Cochrane Database Syst Rev, CD010775. |
[15] | Abou-Mrad F , Chelune G , Zamrini E , Tarabey L , Hayek M , Fadel P ((2017) ) Screening for dementia in Arabic: Normative data from an elderly Lebanese sample. Clin Neuropsychol 31: , 1–19. |
[16] | Conti S , Bonazzi S , Laiacona M , Masina M , Coralli MV ((2015) ) Montreal Cognitive Assessment (MoCA) - Italian version: Regression based norms and equivalent scores. Neurol Sci 36: , 209–214. |
[17] | Freitas S , Simoes MR , Alves L , Santana I ((2011) ) Montreal Cognitive Assessment (MoCA): Normative study for the Portuguese population. J Clin Exp Neuropsychol 33: , 989–996. |
[18] | Kenny RA , Coen RF , Frewen J , Donoghue OA , Cronin H , Savva GM ((2013) ) Normative values of cognitive and physical function in older adults: Findings from the Irish Longitudinal Study on Ageing. J Am Geriatr Soc 61: , 279–290. |
[19] | Konstantopoulos K , Vogazianos P , Doskas T ((2016) ) Normative data of the Montreal Cognitive Assessment in the Greek population and parkinsonian dementia. Arch Clin Neuropsychol 31: , 246–253. |
[20] | Kopecek M , Stepankova H , Lukavsky J , Ripova D , Nikolai T , Bezdicek O ((2017) ) Montreal cognitive assessment (MoCA): Normative data for old and very old Czech adults. Appl Neuropsychol Adult 24: , 23–29. |
[21] | Lu J , Li D , Li F , Zhou A , Wang F , Zuo X , Jia X-F , Song H , Jia J ((2011) ) Montreal Cognitive Assessment in detecting cognitive impairment in Chinese elderly individuals: A population-based study. J Geriatr Psychiatry Neurol 24: , 184–190. |
[22] | Malek-Ahmadi M , Powell JJ , Belden CM , O’Connor K , Evans L , Coon DW , Nieri W ((2015) ) Age- and education-adjusted normative data for the Montreal Cognitive Assessment (MoCA) in older adults age 70-99. Neuropsychol Dev Cogn B Aging Neuropsychol Cogn 22: , 755–761. |
[23] | Narazaki K , Nofuji Y , Honda T , Matsuo E , Yonemoto K , Kumagai S ((2013) ) Normative data for the montreal cognitive assessment in a Japanese community-dwelling older population. Neuroepidemiology 40: , 23–29. |
[24] | Pereiro AX , Ramos-Lema S , Lojo-Seoane C , Guárdia-Olmos J , Facal-Mayo D , Juncos-Rabadán O ((2017) ) Normative data for the Montreal Cognitive Assessment (MOCA) in a Spanish sample of community-dweller adults. Eur Geriatr Med 8: , 240–244. |
[25] | Rossetti HC , Lacritz LH , Cullum CM , Weiner MF ((2011) ) Normative data for the Montreal Cognitive Assessment (MoCA) in a population-based sample. Neurology 77: , 1272–1275. |
[26] | Rossetti HC , Lacritz LH , Hynan LS , Cullum CM , Van Wright A , Weiner MF ((2017) ) Montreal Cognitive Assessment performance among community-dwelling African Americans. Arch Clin Neuropsychol 32: , 238–244. |
[27] | Santangelo G , Siciliano M , Pedone R , Vitale C , Falco F , Bisogno R , Siano P , Barone P , Grossi D , Santangelo F , Trojano L ((2015) ) Normative data for the Montreal Cognitive Assessment in an Italian population sample. Neurol Sci 36: , 585–591. |
[28] | Larouche E , Tremblay MP , Potvin O , Laforest S , Bergeron D , Laforce R , Monetta L , Boucher L , Tremblay P , Belleville S , Lorrain D , Gagnon JF , Gosselin N , Castellano CA , Cunnane SC , Macoir J , Hudon C ((2016) ) Normative data for the Montreal Cognitive Assessment in middle-aged and elderly Quebec-French people. Arch Clin Neuropsychol 31: , 819–826. |
[29] | Ehrensperger MM , Berres M , Taylor KI , Monsch AU ((2010) ) Early detection of Alzheimer’s disease with a total score of the German CERAD. J Int Neuropsychol Soc 16: , 910–920. |
[30] | Yesavage JA , Sheikh JI ((1986) ) Geriatric Depression Scale (GDS). Clin Gerontol 5: , 165–173. |
[31] | Berres M , Zehnder A , Blasi S , Monsch AU ((2008) ) Evaluation of diagnostic scores with adjustment for covariates. Stat Med 27: , 1777–1790. |
[32] | Jennen-Steinmetz C , Wellek S ((2005) ) A new approach to sample size calculation for reference interval studies. Stat Med 24: , 3199–3212. |
[33] | Weintraub S , Besser L , Dodge HH , Teylan M , Ferris S , Goldstein FC , Giordani B , Kramer J , Loewenstein D , Marson D , Mungas D , Salmon D , Welsh-Bohmer K , Zhou XH , Shirk SD , Atri A , Kukull WA , Phelps C , Morris JC ((2018) ) Version 3 of the Alzheimer Disease Centers’ Neuropsychological Test Battery in the Uniform Data Set (UDS). Alzheimer Dis Assoc Disord 32: , 10–17. |
[34] | Chapman KR , Bing-Canar H , Alosco ML , Steinberg EG , Martin B , Chaisson C , Kowall N , Tripodis Y , Stern RA ((2016) ) Mini Mental State Examination and logical memory scores for entry into Alzheimer’s disease trials. Alzheimers Res Ther 8: , 9. |
[35] | Strauss E , Sherman EMS , Spreen O ((2006) ) A Compendium of Neuropsychological Tests. Administration, Norms, and Commentary. Oxford University Press, Oxford, UK. |
[36] | Nasreddine ZS , Phillips N , Chertkow H ((2012) ) Normative data for the Montreal Cognitive Assessment (MoCA) in a population-based sample. Neurology 78: , 765–766; author reply 766. |
[37] | UNESCO Institute of Statistics. ISCED Mappings. http://uis.unesco.org/en/isced-mappings Accessed March 28, 2018. |
[38] | O’Connell ME , Tuokko H ((2010) ) Age corrections and dementia classification accuracy. Arch Clin Neuropsychol 25: , 126–138. |


