
Erythromyeloid-Derived TREM2: A Major Determinant of Alzheimer’s Disease Pathology in Down Syndrome
Abstract
Background:
Down syndrome (DS; trisomy 21) individuals have a spectrum of hematopoietic and neuronal dysfunctions and by the time they reach the age of 40 years, almost all develop Alzheimer’s disease (AD) neuropathology which includes senile plaques and neurofibrillary tangles. Inflammation and innate immunity are key players in AD and DS. Triggering receptor expressed in myeloid cells-2 (TREM2) variants have been identified as risk factors for AD and other neurodegenerative diseases.
Objective:
To investigate the effects of TREM2 and the AD-associated R47H mutation on brain pathology and hematopoietic state in AD and DS.
Methods:
We analyzed peripheral blood, bone marrow, and brain tissue from DS, AD, and age-matched control subjects by immunohistochemistry and western blotting. TREM2-related phagocytosis was investigated using a human myeloid cell line.
Results:
TREM2 protein levels in brain and sera declined with age and disease progression in DS. We observed soluble TREM2 in brain parenchyma that may be carried by a subset of microglia, macrophages, or exosomes. Two DS cases had the AD-associated TREM2-R47H mutation, which manifested a morphologically extreme phenotype of megakaryocytes and erythrocytes in addition to impaired trafficking of TREM2 to the erythroid membrane. TREM2 was shown to be involved in phagocytosis of red blood cells. TREM2 was seen in early and late endosomes. Silencing TREM2 using siRNA in THP1 cells resulted in significant cell death.
Conclusion:
We provide evidence that peripheral TREM2 originating from erythromyeloid cells significantly determines AD neuropathology in DS subjects. Understanding the molecular signaling pathways mediated by TREM2 may reveal novel therapeutic targets.
INTRODUCTION
Down syndrome (DS) is an aneuploidy due to trisomy 21, where genes such as amyloid precursor protein (APP) are encoded in triplicate and play key roles in the pathogenesis of Alzheimer’s disease (AD). By the time individuals with DS reach the age of 40 years, most develop the neuropathological features of AD, including senile (amyloid) plaques and neurofibrillary tangles [1–5].
Although dysfunction of amyloid-β protein precursor (AβPP) processing is believed to be the key upstream factor in the pathogenesis of AD [6], neuroinflammation and activation of innate immunity are considered early events in the genesis of a variety of neurodegenerative diseases [7, 8]. Younger DS subjects experience higher rates of infections, hematopoietic dysregulation, and hematological malignancies, including acute myeloid leukemia, which are evidence for a spectrum of immunological and inflammatory disturbances [9–11]. During adulthood, DS individuals are also at increased risk of developing numerous hematological abnormalities including leucopenia, macrocytosis, platelet defects, and persistent abnormal erythrocytosis; some of these diseases are characterized by an abundance of blasts cells in the peripheral blood [12]. Such hematological and immunological peripheral factors could influence the onset or development of AD pathology in DS.
Triggering receptor expressed on myeloid cells 2 (TREM2), a gene expressed in myeloid progenitors, encodes a type I transmembrane glycoprotein with an extracellular immunoglobulin (Ig) domain. TREM2 signaling is facilitated by association to tyrosine kinase-binding protein (TYROBP, or “DAP12”), involved in a variety of receptor signaling pathways. Mature TREM2 protein is approximately 40 kDa in weight. Cleaved forms of TREM2 generated through alternate splicing are found in various tissue macrophages and monocyte-derived dendritic cells [13, 14]. Genome-wide association studies have shown that a rare mutation of TREM2 (R47H) correlates with a heightened risk of developing AD [15–17]. Homozygosity of other mutations in TREM2 or DAP12 cause a rare form of dementia with bone abnormalities called Nasu-Hakola disease (or polycystic lipomembranous osteodysplasia with sclerosing leukoencephalopathy) [18, 19]. The role of TREM2 in DS and its relationship to dementia in DS has not been fully elucidated. In vitro studies indicate that TREM2 deficiency reduces the efficacy of amyloid clearance [20] and thus can contribute to AD pathogenesis. We recently reported that TREM2 plays a critical role in inflammation and is essential for neuroplasticity and myelination in an AD transgenic mouse model [21]. TREM2 deficiency has also been demonstrated to augment amyloid-β (Aβ) accumulation and neuronal loss in a different mouse model of AD [22]. Previous reports have described haplodeficiency of microglia-specific TREM2 markedly impairing the ability of microglia to compact and insulate amyloid deposits [23–25]. However, there are still important questions regarding the origin of TREM2 detected in the brain and the possible link between peripheral TREM2 and resident microglia in the brain. The aim of this study was to investigate whether soluble TREM2 can be transported across the blood-brain barrier by peripheral cells. We also aimed to understand the role of TREM2 and its association with hemopoietic cells in DS and AD patients. To investigate the neuropathology and involvement of TREM2 protein in AD and DS, serum samples, blood smears from living DS subjects, and postmortem brain sections of individuals with AD, DS, and age-matched controls (from Cambridge Brain bank, see Table 1) were analyzed for TREM2 protein levels. Additionally, we report the phenotypic expression of TREM2 and other AD-relevant proteins: Aβ42 and apolipoprotein E (APOE) in hemopoietic cells and braintissue.
Table 1
Human brain samples from Down’s syndrome (DS), Alzheimer’s disease (AD), and age-matched controls analyzed in this study
| Case number | Category | Age | Gender | Postmortem delay (h) | Braak stage | Cause of death |
| DS | ||||||
| DS1 | DS | 56 | F | 6 | 6 | Not known |
| DS2 | DS | 76 | F | 18 | 6 | Septicemia |
| DS3 | DS | 46 | F | 8 | 2 | Not known |
| DS4 | DS | 52 | M | 24 | 6 | Bronchopneumonia |
| DS5 | DS | 64 | M | 31 | 6 | Not known |
| DS6 | DS | 66 | F | 26 | 5 | Not known |
| AD | ||||||
| AD1 | AD | 86 | F | 86 | 6 | Urinary tract infection/advanced Dementia |
| AD2 | AD | 88 | M | 81 | 6 | Urinary tract infection/Addison’s disease and poor immunity/vascular dementia/AD |
| AD3 | AD | 83 | M | 46 | 6 | Bowel ischemia/hypothyroid/hypertension/AD/atrial fibrillation/chronic kidney disease/vascular dementia |
| AD4 | AD | 88 | M | 22.3 | 5 | Pneumonia/aortic stenosis/mixed dementia/left cerebellar hemisphere hemorrhage |
| AD5 | AD | 70 | M | 71 | 6 | Pneumonia/AD |
| AD6 | AD | 79 | F | 45.3 | 6 | Cerebrovascular accident/dementia |
| Controls | ||||||
| C1 | Control | 45 | F | 43.3 | 0 | End stage renal failure/diabetic nephropathy |
| C2 | Control | 66 | M | 10.3 | 5 | Cerebrovascular disease/dementia |
| C3 | Control | 54 | F | 10.3 | 0 | Metastatic myxoid liposacroma/bronchopneumonia |
| C4 | Control | 52 | F | 30.3 | 1 | Bronchogenic cancer |
| C5 | Control | 75 | F | 24 | 2 | Cancer of the ovary |
| C6 | Control | 66 | F | 29.3 | 2 | Metastatic breast cancer |
We show for the first time that soluble TREM2 originating from bone marrow is transported to the brain parenchyma by a subset of macrophages via exosomes.
We demonstrate impaired trafficking of TREM2 to the plasma membrane of erythrocytes in DS, which may influence both peripheral and central amyloid clearance pathways thought to be important in AD pathogenesis.
To characterize the presence of any TREM2 R47H mutations, DS and age-matched controls were genotyped. We observed gross morphological changes in megakaryocytes and erythrocytes in the DS subjects carrying the TREM2 R47H variant.
We also investigated the role of TREM2 in phagocytosis using a human myeloid cell line (THP1) and showed its presence in early and late endosomes. Following silencing with an anti-sense oligo-RNA, we observed significantly increased celldeath.
These findings have major implications for the development of immunological or inflammatory cell or drug-based therapeutic approaches to AD in DS, which we discuss below.
MATERIALS AND METHODS
Subjects
Human brain tissues from controls (age 60±15 years), DS (age 60±15 years), and AD (age 82.0±8.0 years) (n = 6 in each group) were provided by the Cambridge Brain Bank (Table 1). For use of human brain tissue and serum samples, The Cambridge Health Authorities Joint Ethics Committee granted ethical approval. Whole blood and serum samples from human controls (n = 50), DS (n = 50), and AD (n = 50) were collected for DNA and protein analysis. Written consents were obtained from typically developing controls and all adults with DS with capacity to consent. Verbal assent was obtained from participants with DS lacking capacity and a written assent was provided by an appointed consultee, in accordance with the UK Mental Capacity Act (2005). Ethics and research and development approvals were granted by the National Research Ethics Committee of East of England –Norfolk and Cambridgeshire and Peterborough NHS Foundation Trust, respectively.
Blood collection and blood and bone marrow slide preparation
We analyzed 50 cases of DS diagnosed at our center during a three-year period from July 2012 to June 2015. Blood samples were collected into serum blood collection tubes and serum immediately separated by centrifugation at 2,465 g for 6 min at 4°C, aliquoted, and stored at –80°C until analysis.
A drop of blood or bone marrow placed on a slide was spread using a spreader as described in Dacie and Lewis [26]. The slide was air-dried and fixed in 100% methanol and stored at 4°C. Further investigations, including immunohistochemistry (IHC), were performed on stored fixed slides as described later.
Biochemical and hematological profiles were analyzed by pathology laboratories at Addenbrooke’s Hospital, Cambridge University Hospitals NHS Foundation Trust, Cambridge.
Genotyping
Single nucleotide polymorphism (SNP) genotyping for TREM2 SNP, rs75932628, C-T encoding the R47H variant was performed using the TaqMan® allelic discrimination assay on a HT7900 sequence detection system (Applied Biosystems), according to the manufacturer’s instructions. Genotyping success rates were >96%. There were no inconsistencies amongst 92 samples genotyped in duplicate. APOE (ɛ2,/ɛ3 and ɛ4) genotype was analyzed by Genotype Facilities, East Anglia Medical Genetics Service, Addenbrooke’s Hospital, Cambridge UniversityHospitals NHS Foundation Trust, Cambridge.
Cell culture
THP-1 cell line
Human monocytic leukemia cell line THP1 (from ATCC) was plated on PDL coated glass cover slips in 24-wells plate at a density of 1.0×10⁵ cells/mL with Dulbecco’s modified Eagle’s medium (DMEM, Gibco), 10% fetal calf serum (FBS) and 1% penicillin–streptomycin–fungizone. After 1–3 days in vitro, cells were fixed with 80% ice-cold methanol and analyzed by immunofluorescence or further functional analysis was performed as described below.
THP1 cells and phagocytosis of rat red blood cells
THP1 cells (passage 3–5) were seeded at a density of 1.0×10⁵ cells/ml in complete media (DMEM plus 10% FBS) in 6-well plates or on PDL coated glass cover slips in 24-wells plate and allowed to adhere for 24 h. Antibody-coated rat red blood cells (RBCs) were added (10μl containing 10×106 RBCs) to each well; a slightly modified method was used previously [27]. 24 h after the complete media and cells were collected for western blotting (WB). PDL coated coverslips were treated with (10μl containing 1×10⁵ rat RBCs) for 24 h, similarly as above and cells were washed and fixed with 80% ice-cold methanol and analyzed by immunofluorescence.
Transient transfection of THP1 cells with TREM2 siRNA
THP1 cells (passage 3–5) were seeded at a density of 1.0×10⁶ cells/ml in DMEM plus 10% FBS in 6-well plates and allowed to adhere for 24 h before transfection with TREM2 anti-sense RNA (siRNA from Abmgood, Catalogue number: i525410). One tube of TREM2 (2.5 nmol) siRNA oligo was dissolved in 125μl of DEPC water to obtain final concentration of 20 pM. 24 h following seeding, the media was aspirated from each well, and the cells were washed once with pre-warmed Dulbecco’s Phosphate Buffered Saline (DPBS). The cells were supplemented with OptiMEM (Life Technologies, Paisley, UK) without any added FBS or antibiotics.2 h following the addition of OptiMEM, the THP1 cells were transfected with 10 pmol of siRNA-TREM2 or scramble siRNA against a non-targeting control sequence (referred to as control cells), using Lipofectamine 2000 (Life Technologies, Paisley, UK) according to manufacturer’s protocol. The 10 pmol TREM2 siRNA concentration was chosen after siRNA dose-response studies were performed (data not shown). 24-h post-transfection, the media was aspirated from each well, the cells were washed once with pre-warmed DPBS, and complete media was added to the wells. The cells were maintained in complete media for a further 24–48 h. The extent of siRNA-mediated silencing of the genes was assessed and confirmed by IHC and WB.
Antibodies
The following primary antibodies were used mouse monoclonal (MAB) anti-TREM2 (ab201621, MM0942-42E14) and rabbit monoclonal (ab209814) and other antibodies (Supplementary Table 1) from Abcam (Cambridge, UK). The monoclonal anti-Aβ42 antibodies (6E10) (Signet laboratory) have been described previously [21, 28] and other antibodies used in this study are shown in Supplementary Table 1. The following secondary antibodies were used: biotinylated goat anti-rabbit and biotinylated horse anti-mouse (both from Vector Laboratories, 1 : 250 for IHC); Alexa Fluor 568-labeled donkey anti-mouse, Alexa Fluor 488-labeled donkey anti-rabbit, and Alexa Fluor 568-labeled donkey anti-goat (all from Invitrogen, 1 : 1000 for immunofluorescence).
SDS-PAGE and western blotting
The HEK293T cell line was transfected with human TREM2 cDNA (Human cDNA ORF clone, NM_018965). Cell lysates from wild type HEK293 cells and TREM2 transfected HEK293 cells were prepared. Similarly, protein lysates were prepared from the temporal cortex and hippocampus of human brains (n = 6), and human serum (n = 50 in each group). 20μg protein samples were separated on 4–12% Nu-PAGE® Bis-Tris (Bis (2-hydroxyethyl)-amino-tris (hydroxymethyl)-methane) gradient gels (1.25 M Bis-Tris pH 6.4, 30% acrylamide/bis), run with NuPAGE® MES SDS running buffer (Lifetechnologies), and transferred to 0.45μm pore size polyvinylidene difluoride (PVDF) membranes (Invitrogen). Membranes were incubated with the appropriate primary antibody in blocking buffer (1% milk in 0.1 M tris saline buffer containing 0.1% Tween 20) for 24 h at 4°C and then washed three times with 0.1 M tris saline buffer containing 1% Tween 20 (TBST) followed by incubation for 1 h at room temperature with HRP-conjugated secondary antibodies (anti mouse IgG 1 : 3000, DAKO) or anti-rabbit IgG (1 : 3000; DAKO) antibodies). Binding was detected with ECL Plus chemiluminescence reagents and Hyperfilm ECL (both from GE Healthcare). Immunoblot controls consisted of pre-adsorption of the antibody with an excess of the immunogenic peptides (Abcam Ab174422), that blocks the anti TREM2 antibody used in the study (Abcam 201621), resulting in the absence of immunoreactive bands in the membrane.
Immunofluorescence
Brain sections, blood smears, or cells were blocked using blocking buffer (0.1 M PBS, 0.3% Triton X100, 10% normal donkey serum) for 1 h at room temperature, then incubated overnight at 4°C with primary antibody diluted in blocking buffer. Alexa Fluor-conjugated secondary antibodies were used for detection and samples counterstained with4′6-diamidino-2-phenylindole (DAPI, Sigma). Sections were then mounted on glass slides with coverslips using FluorSave (Calbiochem).
Microscopy
Bright field images were taken and quantified using Leica imaging software and a Leica FW 4000 upright microscope equipped with a SPOT digital camera. Fluorescence images were obtained using a Leica DM6000 wide field fluorescence microscope equipped with a Leica FX350 camera with x20 and x40 objectives. Images were taken through several z-sections and de-convolved using Leica software. A Leica TCS SP2 confocal laser-scanning microscope was used with x40 and x63 objectives to acquirehigh-resolution images.
Image and statistics analysis
All sections for (IHC and WB) were performed in triplicate. WB images were quantified using ImageJ software (US National Institute of Health), normalizing all samples to loading controls. Values in the figures are expressed as mean±SEM. To determine statistical significance, values were analyzed by Student’s t-test. A probability value of p < 0.05 was considered to be statistically significant.
RESULTS
Soluble TREM2 protein level declined in DS serum with disease progression
As a first step towards determining possible roles of TREM2 in DS, we investigated TREM2 protein levels in human brain tissue and serum by WB using anti-TREM2 mouse monoclonal antibody (MAB) (ab201621, Supplementary Table 1).
To validate that TREM2 protein was recognized by TREM2 antibody (ab201621), cell lysates obtained from the HEK293 cell line transfected with Human TREM2 cDNA was analyzed by WB. The antibody recognized bands of 25 kDa and ∼18 kDa, respectively, in the cell lysates of these TREM2 overexpressing HEK293 cells, and in control HEK293 cell lysates no bands were seen, as expected (Fig. 1a). To investigate TREM2 protein expression in human brain, tissue from the superior frontal cortex of AD, DS, and age-matched controls brains (n = 6 in each group), TREM2 protein was detected as non-glycosylated 25 kDa and ∼18 kDa truncated bands. There was an additional ∼50 kDa band visible which may potentially be a TREM2 dimer (Fig. 1b). The TREM2 levels (i.e., the 25 kDa bands) were highest in control, lower in DS and lowest in AD brains (Fig. 1b, 1c; p < 0.001).
Fig.1
TREM2 protein levels declined with Alzheimer’s diseases progression in Down syndrome. To validate the TREM2 antibody (ab201621), the HEK293 cell line was transfected to overexpress human TREM2, cell lysates were analyzed by WB. The antibody recognized a band of 25 kDa and ∼18 kDa in the TREM2 overexpressing HEK293 cell lysate, whereas in control HEK293 cell lysate no band was seen (a). The WB analyses performed on postmortem human brain tissue (superior frontal cortex) showed that TREM2 levels were highest in controls, significantly decreased in DS and lowest in AD brains (b & c, p < 0.0005). TREM2 serum levels were significantly increased in young DS, lower in middle age, and lowest in the older subjects (e & f, p < 0.001 between older versus younger DS). Similarly, serum TREM2 levels were lower in AD (n = 25), compared with age-matched controls (n = 25) and lowest in DS (h & i, p < 0.001). β-actin and human serum albumin were used as positive controls for brain tissue and serum samples, respectively (d, g, & j). Bonferroni-corrected Student’s t-tests shown; (n = 8–25 per group). Error bars indicate SEM. *p < 0.05, **p < 0.01, ***p < 0.001, one-way ANOVA.
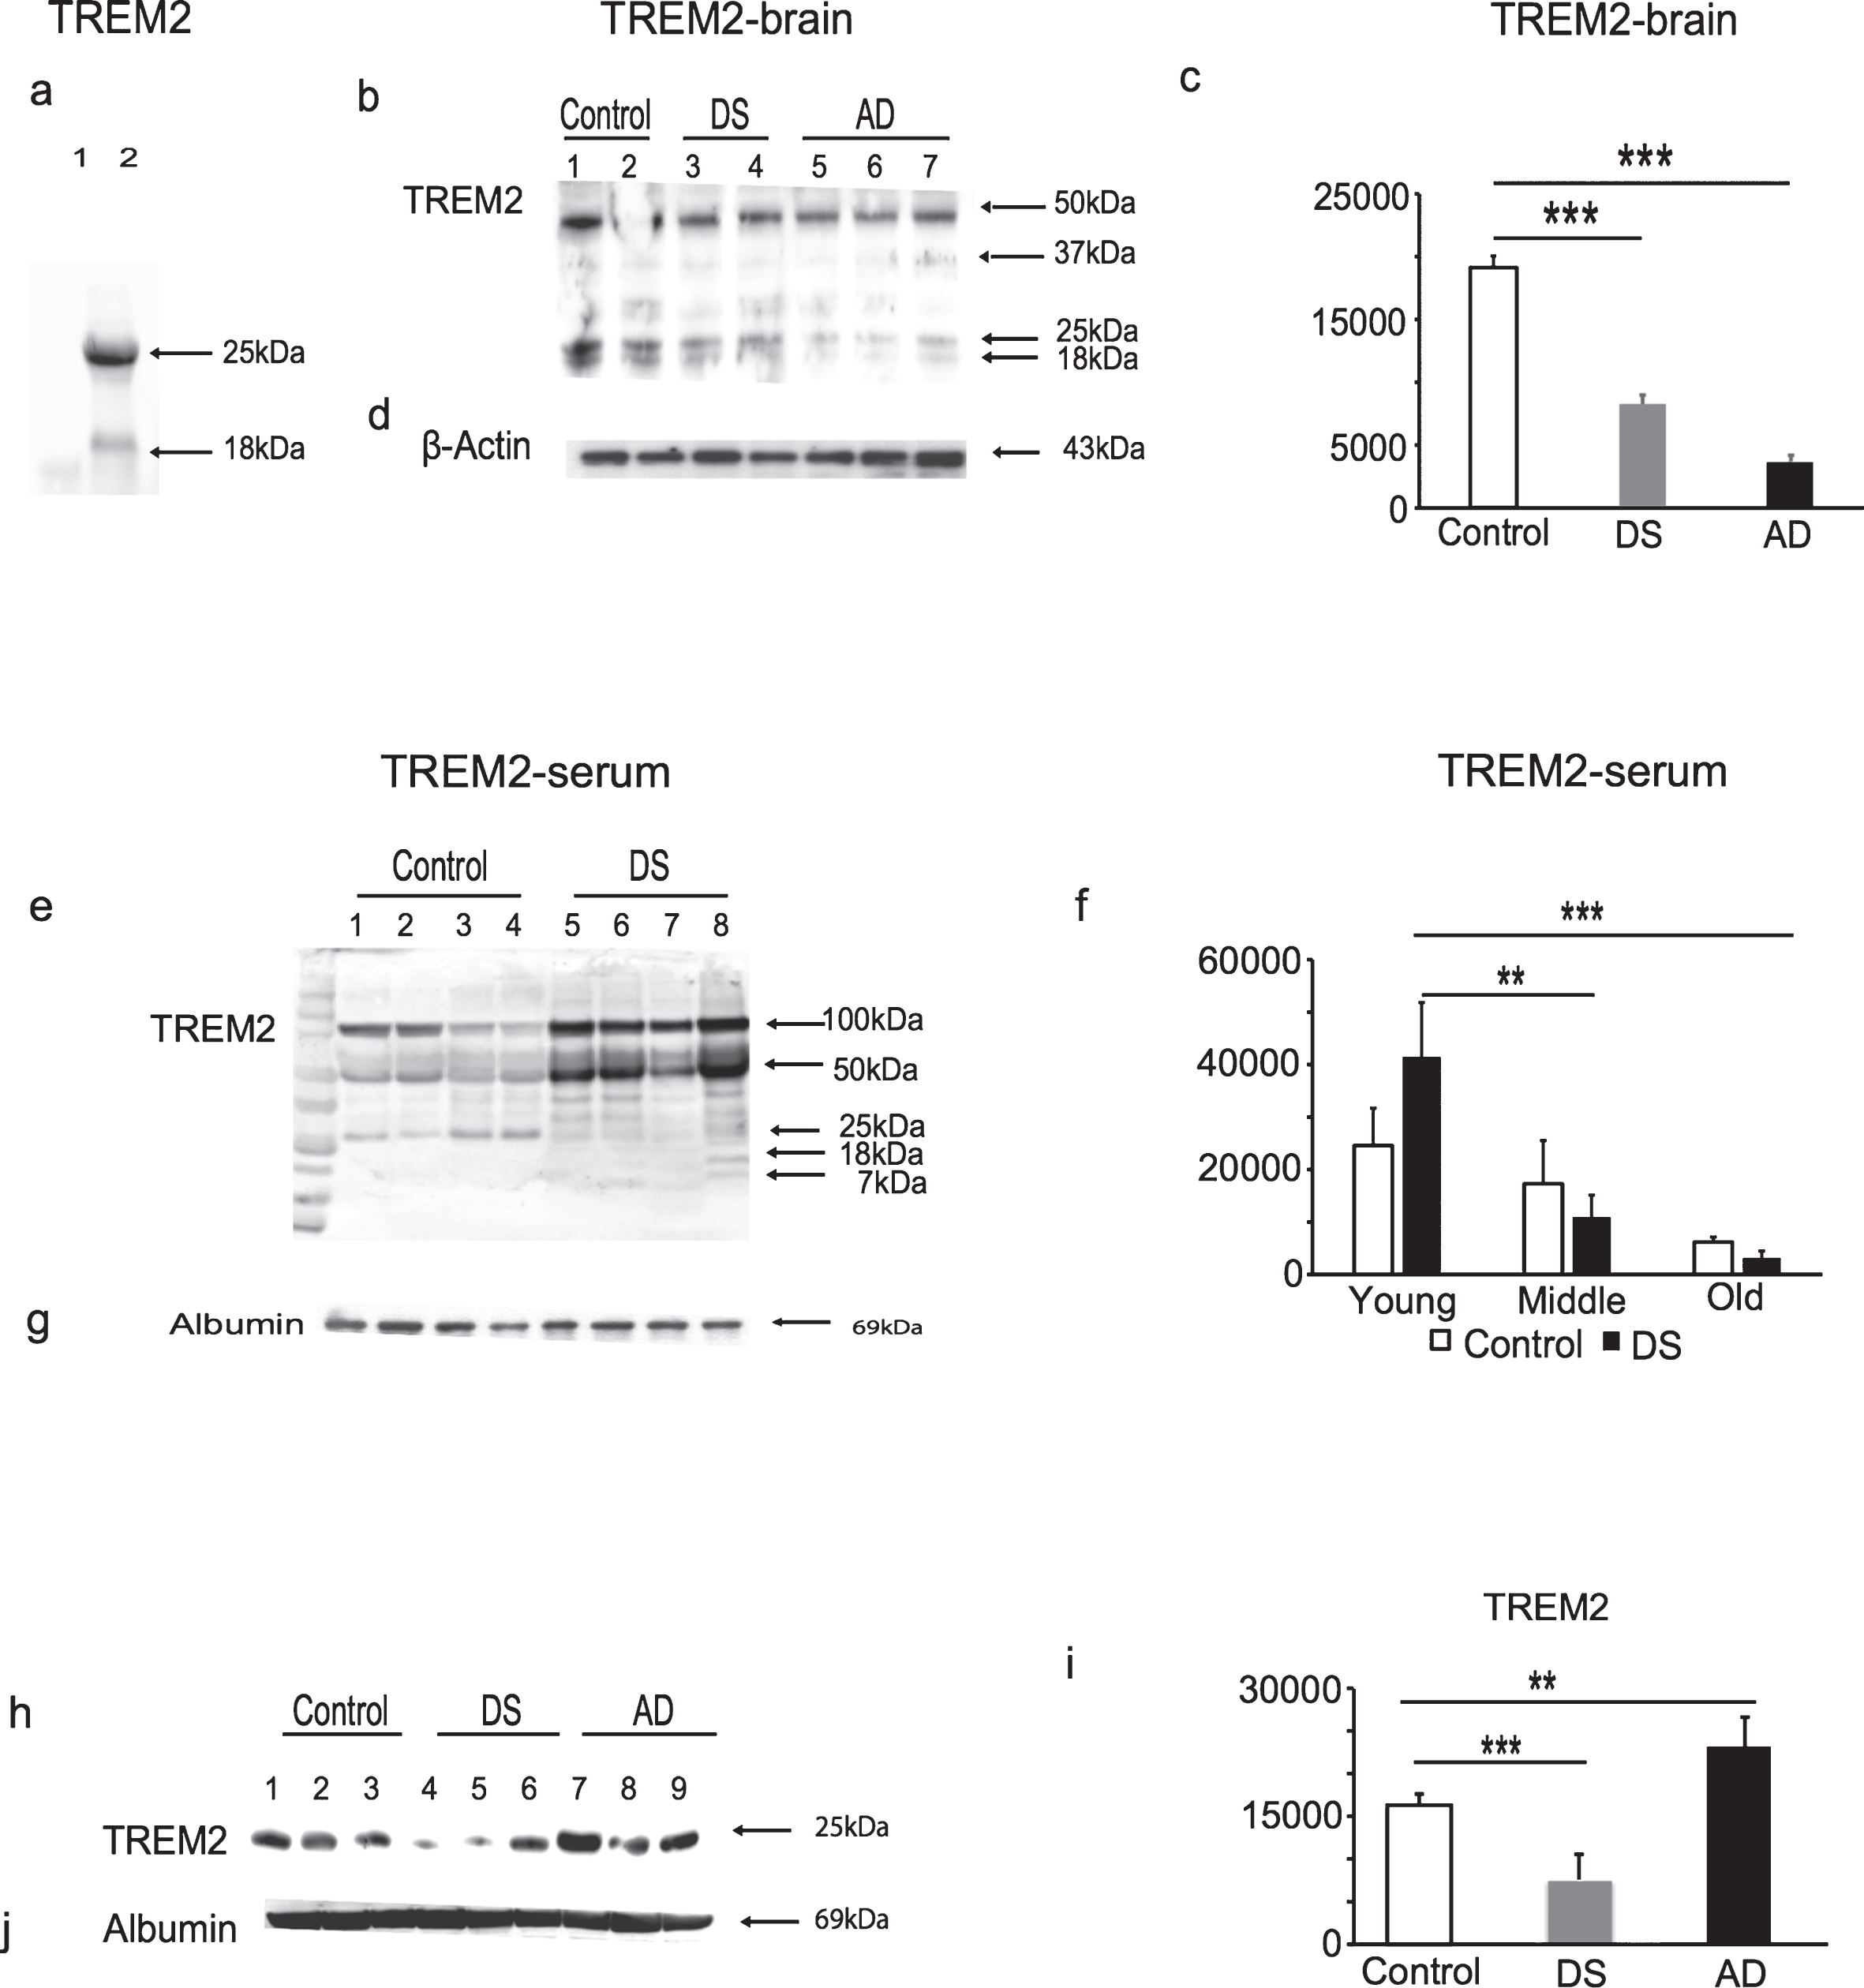
Serum samples obtained from DS, AD, and controls (living subjects) were analyzed by WB. We divided DS subjects into three age groups (younger DS, n = 16, 30–39 years; middle aged DS, n = 20, 40–49 years; and older DS subjects, n = 8, 50–65 years— none of the younger DS subjects up to age 45 had developed clinical dementia). WB showed that samples from younger DS subjects had ∼50 kD and 25 kDa bands and a multiple banding pattern between ∼7–18 kDa weights, which were possibly due to truncation of the protein as a result of ectodomain shedding, as described previously [29] (Fig. 1e). More truncated TREM2 bands were detected in DS serum compared to controls. Serum TREM2 levels were significantly higher in younger DS, lower in middle aged DS and lowest in the older subjects (Fig. 1e, f; p < 0.001 when comparing older versus younger DS). Similarly, serum TREM2 levels were lower in AD (n = 25, p < 0.001) when compared with age-matched controls (n = 25) but lowest in DS (Fig. 1h, i; p < 0.001). Anti-β-actin for brain tissues and human anti-serum albumin antibody for serum were used as protein loading controls(Fig. 1d, g, j).
These data indicate that further truncation of serum TREM2 following ectodomain shedding may be age or disease related. Furthermore, in DS and AD brain tissue, our results show that TREM2 protein levels decrease in AD brain with age and diseaseprogression.
TREM2 protein is absent in senile plaques in DS brain
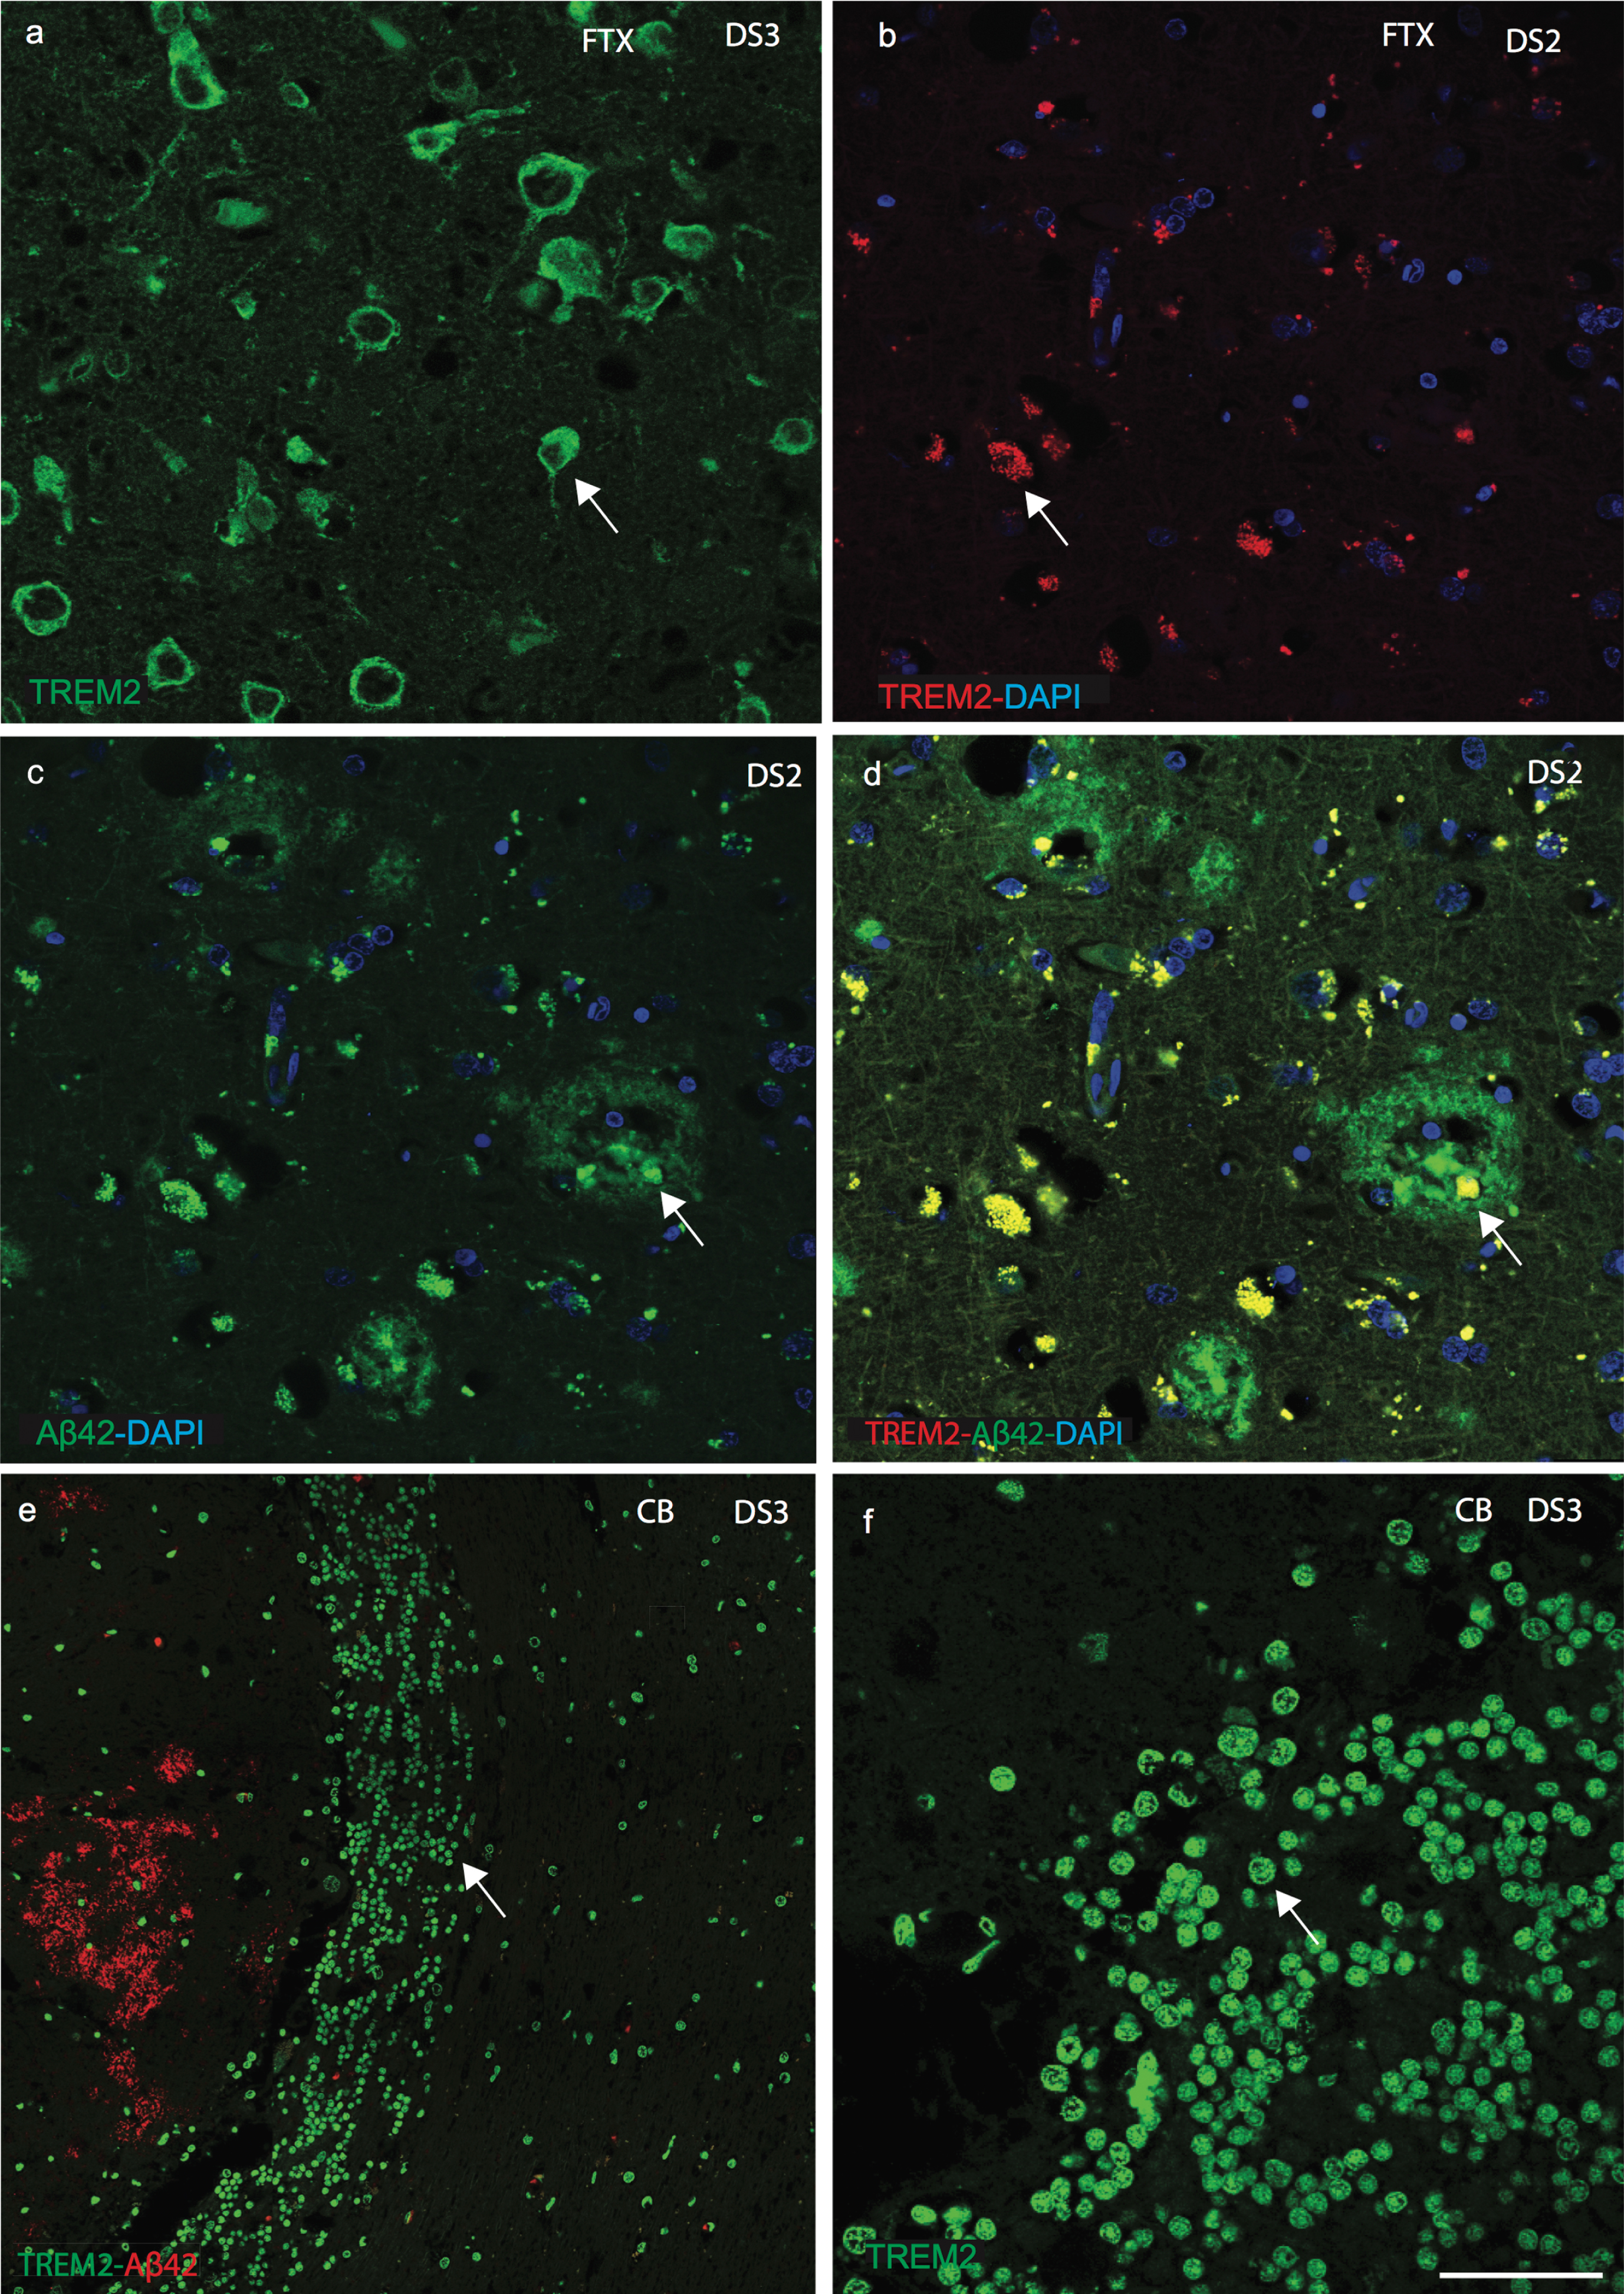
We next attempted to visualize TREM2 expression using immunofluorescent staining on sections of postmortem brains superior frontal cortex and temporal cortex from AD, DS, and age-matched controls (n = 6 in each group: 46 to 76 years, Table 1). Extensive variation of TREM2 expression was observed in different brain regions as well as between DS cases. In the superior frontal cortex of control brain, anti-TREM2 and anti-amyloid-β (Aβ40) co-localized in pyramidal neurons and in small vesicles (Fig. 2a-c). In DS brain sections, although many mature senile plaques (SPs) with well-defined cores of amyloid-β-42 (using Aβ42, 6E10 antibody) protein were observed, only small numbers of cells in thecenter of the SPs were positive for TREM2 (Fig. 2d-g). In one DS case (DS6, 66 years old), only a very limited amount of TREM2 protein was present in the hippocampus (molecular grey matter) adjacent to the dentate gyrus, and there was increased signal intensity around the cortical neuron (Fig. 2f). Whereas in another sample from a subject (DS2, 76 years old) showed Aβ42 positive plaques but there was no TREM2 expression visible (Fig. 2g). Similarly, in AD brain sections stained with TREM2 and Aβ42, TREM2 protein was not detected in SPs and only found peripheral to the plaques (Fig. 2h-j). TREM2 protein expression was higher in control brains, lower in AD and lowest in DS brains (Fig. 2k; p≤0.001). High power DS brain images were captured with confocal microscopy. In a young DS subject (DS3, 46 years old), TREM2 protein was visible in the layer V pyramidal neurons of the frontal cortex (Fig. 3a), and in the periphery of SP (Fig. 3b-d). We have previously reported that TREM2 protein is expressed in dentate gyrus granule cells of wild type mice [21]. TREM2 protein was also observed in the cerebellar granule cell layer in DS brain (Fig. 3e, f). These data suggest that TREM2 occurs in young healthy pyramidal neurons and in granule cells, but there is only very limited expression in damaged (diseased) neurons and it does not co-localize withAβ42-positive SPs.
Fig.2
TREM2 protein is absent in senile plaques in DS brain. Double immunofluorescence staining was performed in the temporal cortex of normal control brain tissue by using the rabbit polyclonal anti-Aβ40 (green), mouse monoclonal anti-TREM2 (red), and DAPI for nuclei (Blue). Aβ40 immunoreactivity was visible in pyramidal neurons (a), TREM2 in the cell body (b), and both proteins co-localized in the perinuclear location in pyramidal neurons (c). In DS (DS6), layer III temporal cortex sections stained for Aβ42 (green) and TREM2 (red) showed many mature plaques (d & e). TREM2 was rarely present in the core of the plaques (d) and in neurons (f). Further staining on a different case (DS2) showed that Aβ42 did not co-localize with TREM2 (g). In AD brain, TREM2 protein was visible around the plaques (h-j). Aβ42 level was highest in AD brain (k, p < 0.0001) and TREM2 level was lower in surviving neurons compared to control and AD brain (K, p < 0.01). The scale bar in a-e = 50μm, f = 25μm, and g = 40μm. These data represent the mean±S.E from three independent experiments. Error bars indicate SEM. *p < 0.01, **p < 0.001, ***p < 0.0001.
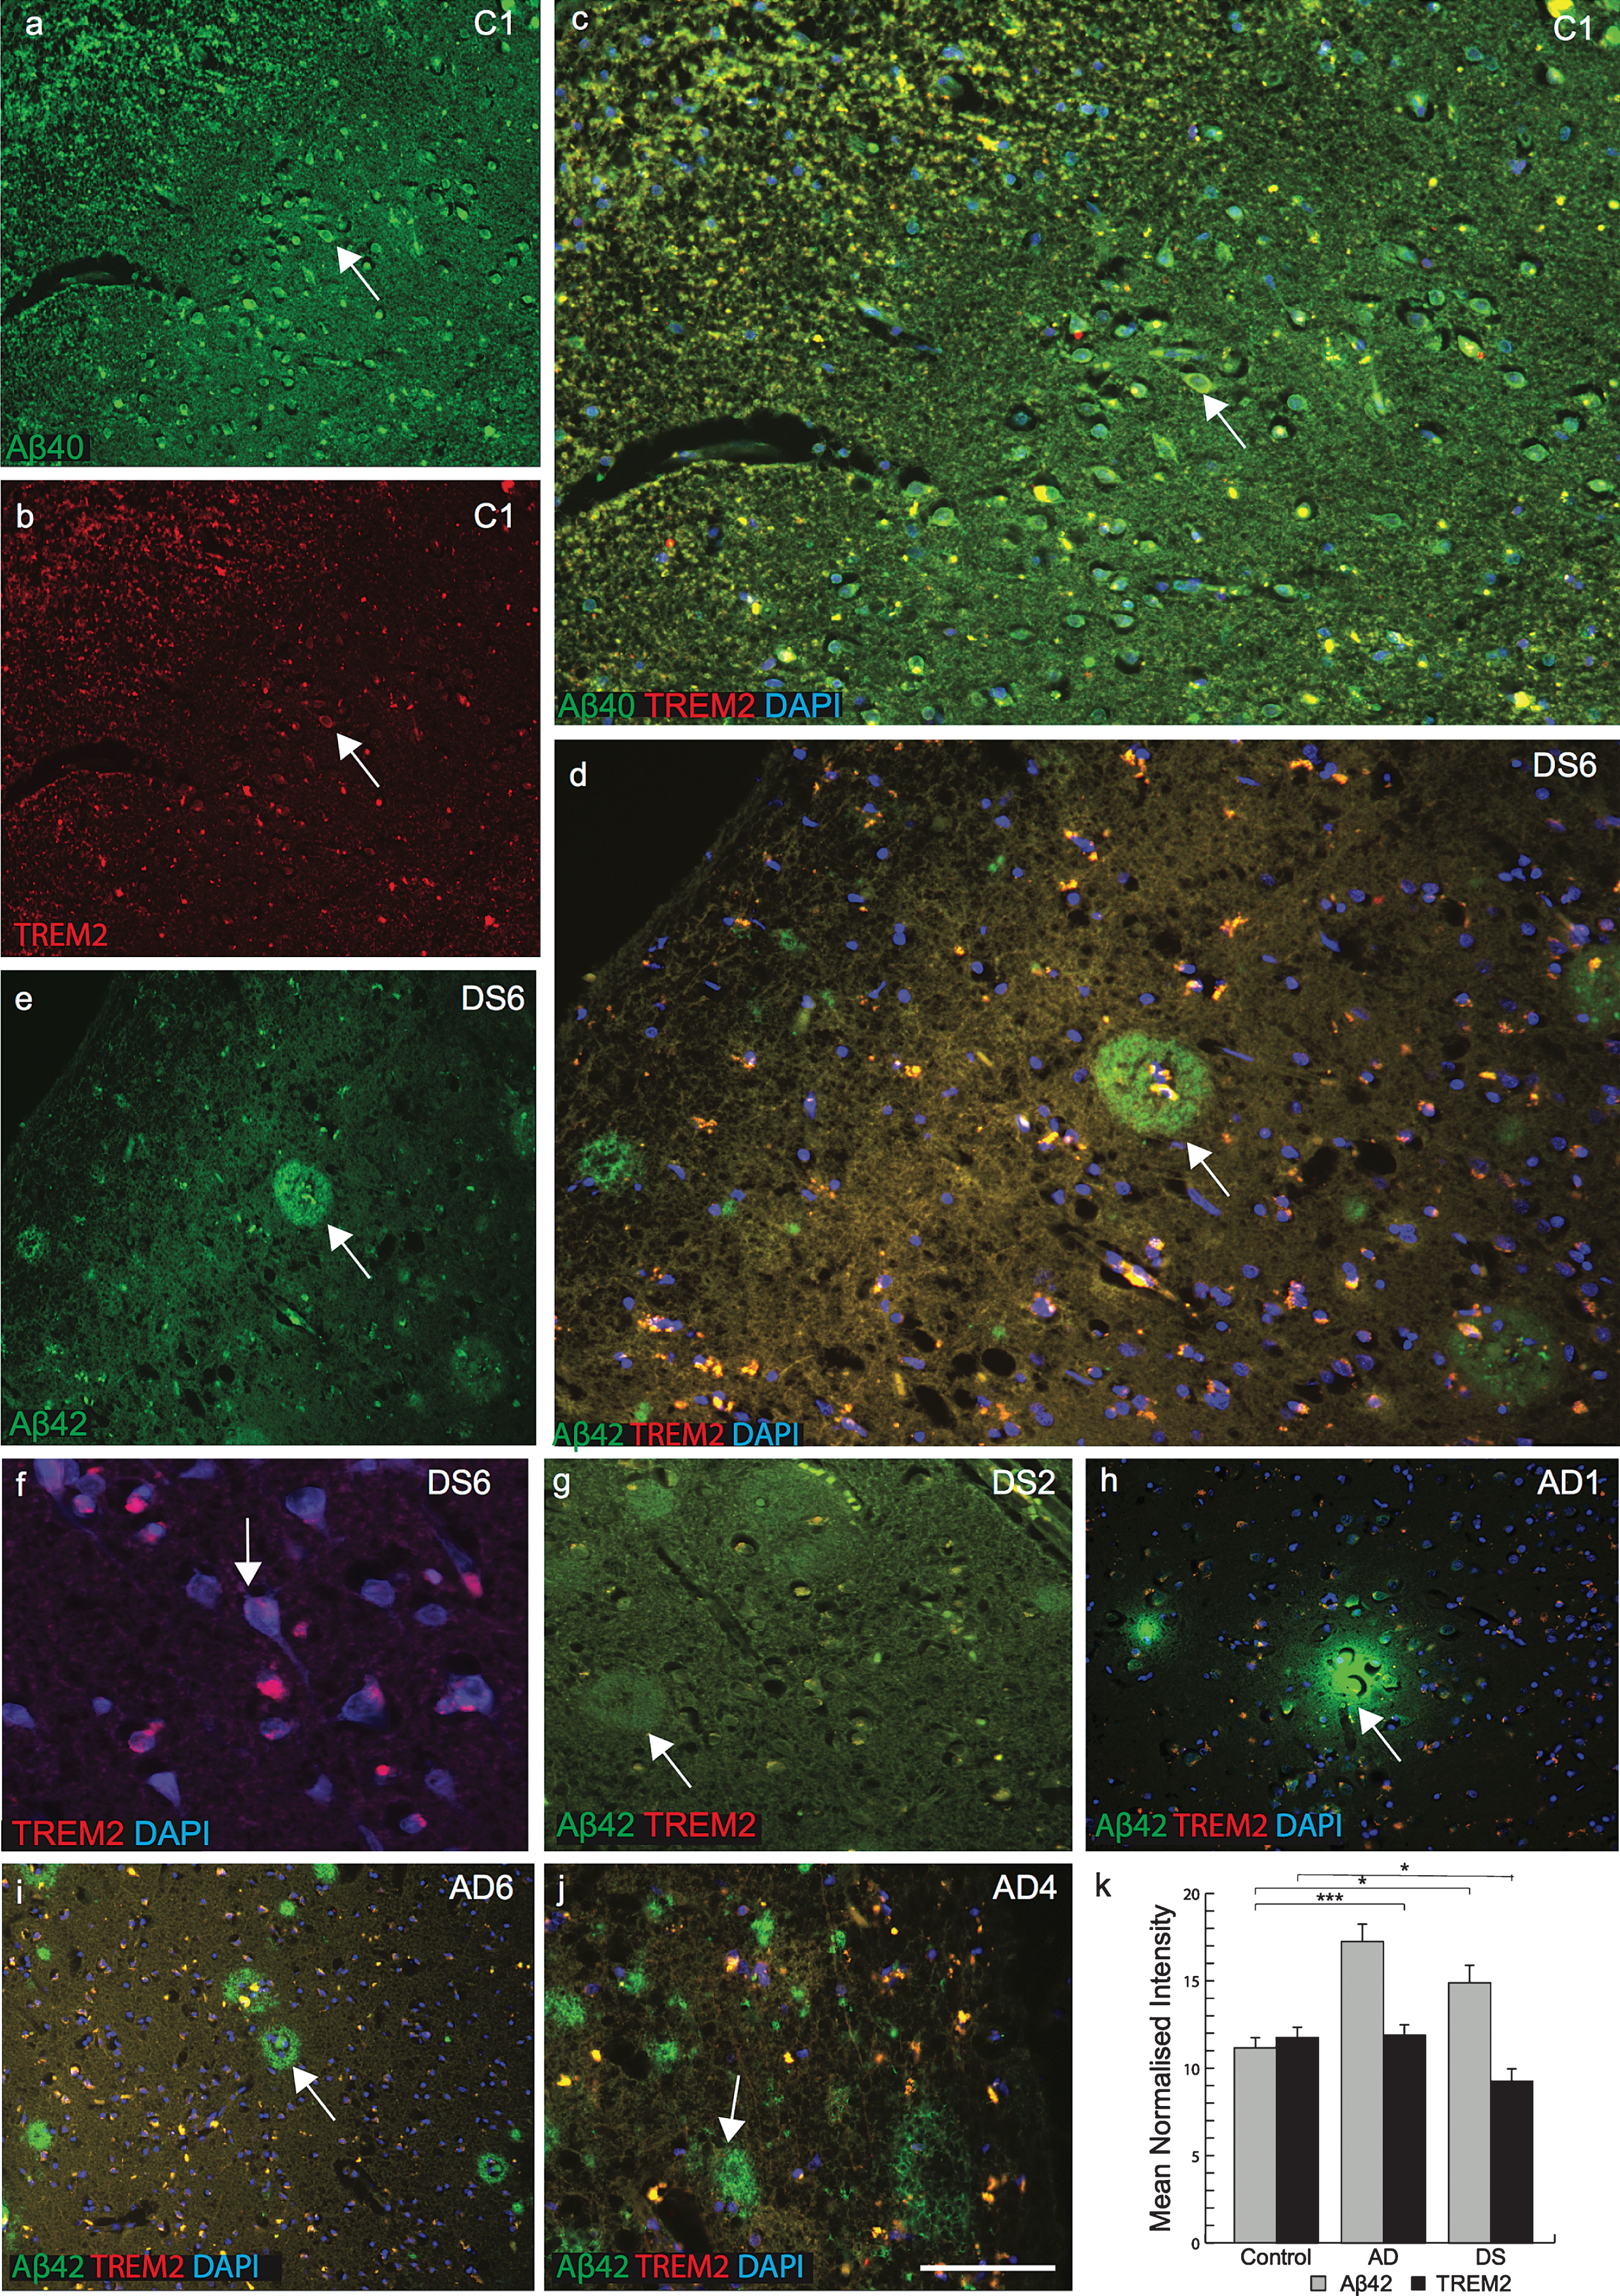
Fig.3
Confocal images of senile plaques and cerebellar granule cells in DS brain. Confocal microscopy analysis was performed on DS brains sections, using anti-Aβ42, anti-TREM2 and counterstained with DAPI (blue). DS brain sections from frontal cortex revealed TREM2 protein was visible in the layer V pyramidal neurons (a), characteristic neuritic plaques stained with Aβ42 (b-d), and limited TREM2 expression was seen in the SP (c, d). A high-power image showed TREM2 (green) appeared to be expressed in the cerebellar granule cells (e, f). Scale bar in a-d = 25μm, e = 50μm, f = 15μm.
TREM2 expression in a selective population of phagocytotic microglia and macrophages in DS and AD brains
Recent work has shown TREM2 to be involved in microglial activity [30, 31] and the amyloid clearance process. We therefore investigated TREM2 expression in microglia, macrophages and astrocytes in control, AD and DS brains. In control brains, we found no TREM2 co-localization with the astrocytic marker GFAP (Fig. 4a). However, in AD brain sections GFAP positive astrocytes were present around SPs and they appeared very granular and damaged (Fig. 4b). In DS brain sections, activated astrocytes were visible close to the SPs but no co-localization with TREM2 was observed (Fig. 4c, individual panel was shown in Supplementary Fig. 1a-c). We measured the relative intensity of TREM2 and GFAP and although there was no difference in total TREM2 levels around astrocytes, there were higher numbers of activated astrocytes in AD brains compared to DS and controls (Fig. 4d; p≤0.001).
Fig.4
TREM2 expression in a selective population of phagocytotic microglia and macrophages in DS and AD brains. Brain sections were stained with the astrocytes marker GFAP (green, indicated with arrow in astrocytes) and TREM2 (red, with arrow head) (a-c). In control brain section, TREM2 was seen in the in the neurons surrounded by GFAP positive astrocytes (a), in AD brain sections astrocytes were granular, fragile and seen close to the plaques (b), whereas in DS brain activated astrocytes were present in the vicinity of the amyloid plaques (c). Highest expression of GFAP positive astrocytes was found in AD brain (d, p < 0.001). Iba1 positive ramified microglia were seen in control brain (e-g), while activated Iba1 (green) positive microglia were visible in DS brain (h) and a TREM2 positive macrophage was visible on pial surface and small vesicular particle (i), co-localized with TREM2 and Iba, showed with arrow head (j). In AD brains, a small number of Iba1 positive microglia co-localized with TREM2 close to senile plaques (k, l), and in hippocampus (m), indicated with arrow in microglia and arrow head in neurons. There were more microglia positive for Iba1 in control brain compared to DS and AD (n, p < 0.0001). In the pial surface and in blood vessels, TREM2 (green) was visible in peripheral macrophages where it co-localized with the macrophage marker CD68 (red) (o-q). In DS brain, strings of blood cells were visible in the brain parenchyma that co-localized with TREM2 (q) and highly significantly (r, p < 0.0001). Scale bar in a-c = 25μm, e-g & q-U = 50μm, h-j = 20μm. Image intensity measured by Image J (d, n, and r). Error bars indicate SEM. *p < 0.01, **p < 0.001, ***p < 0.0001.
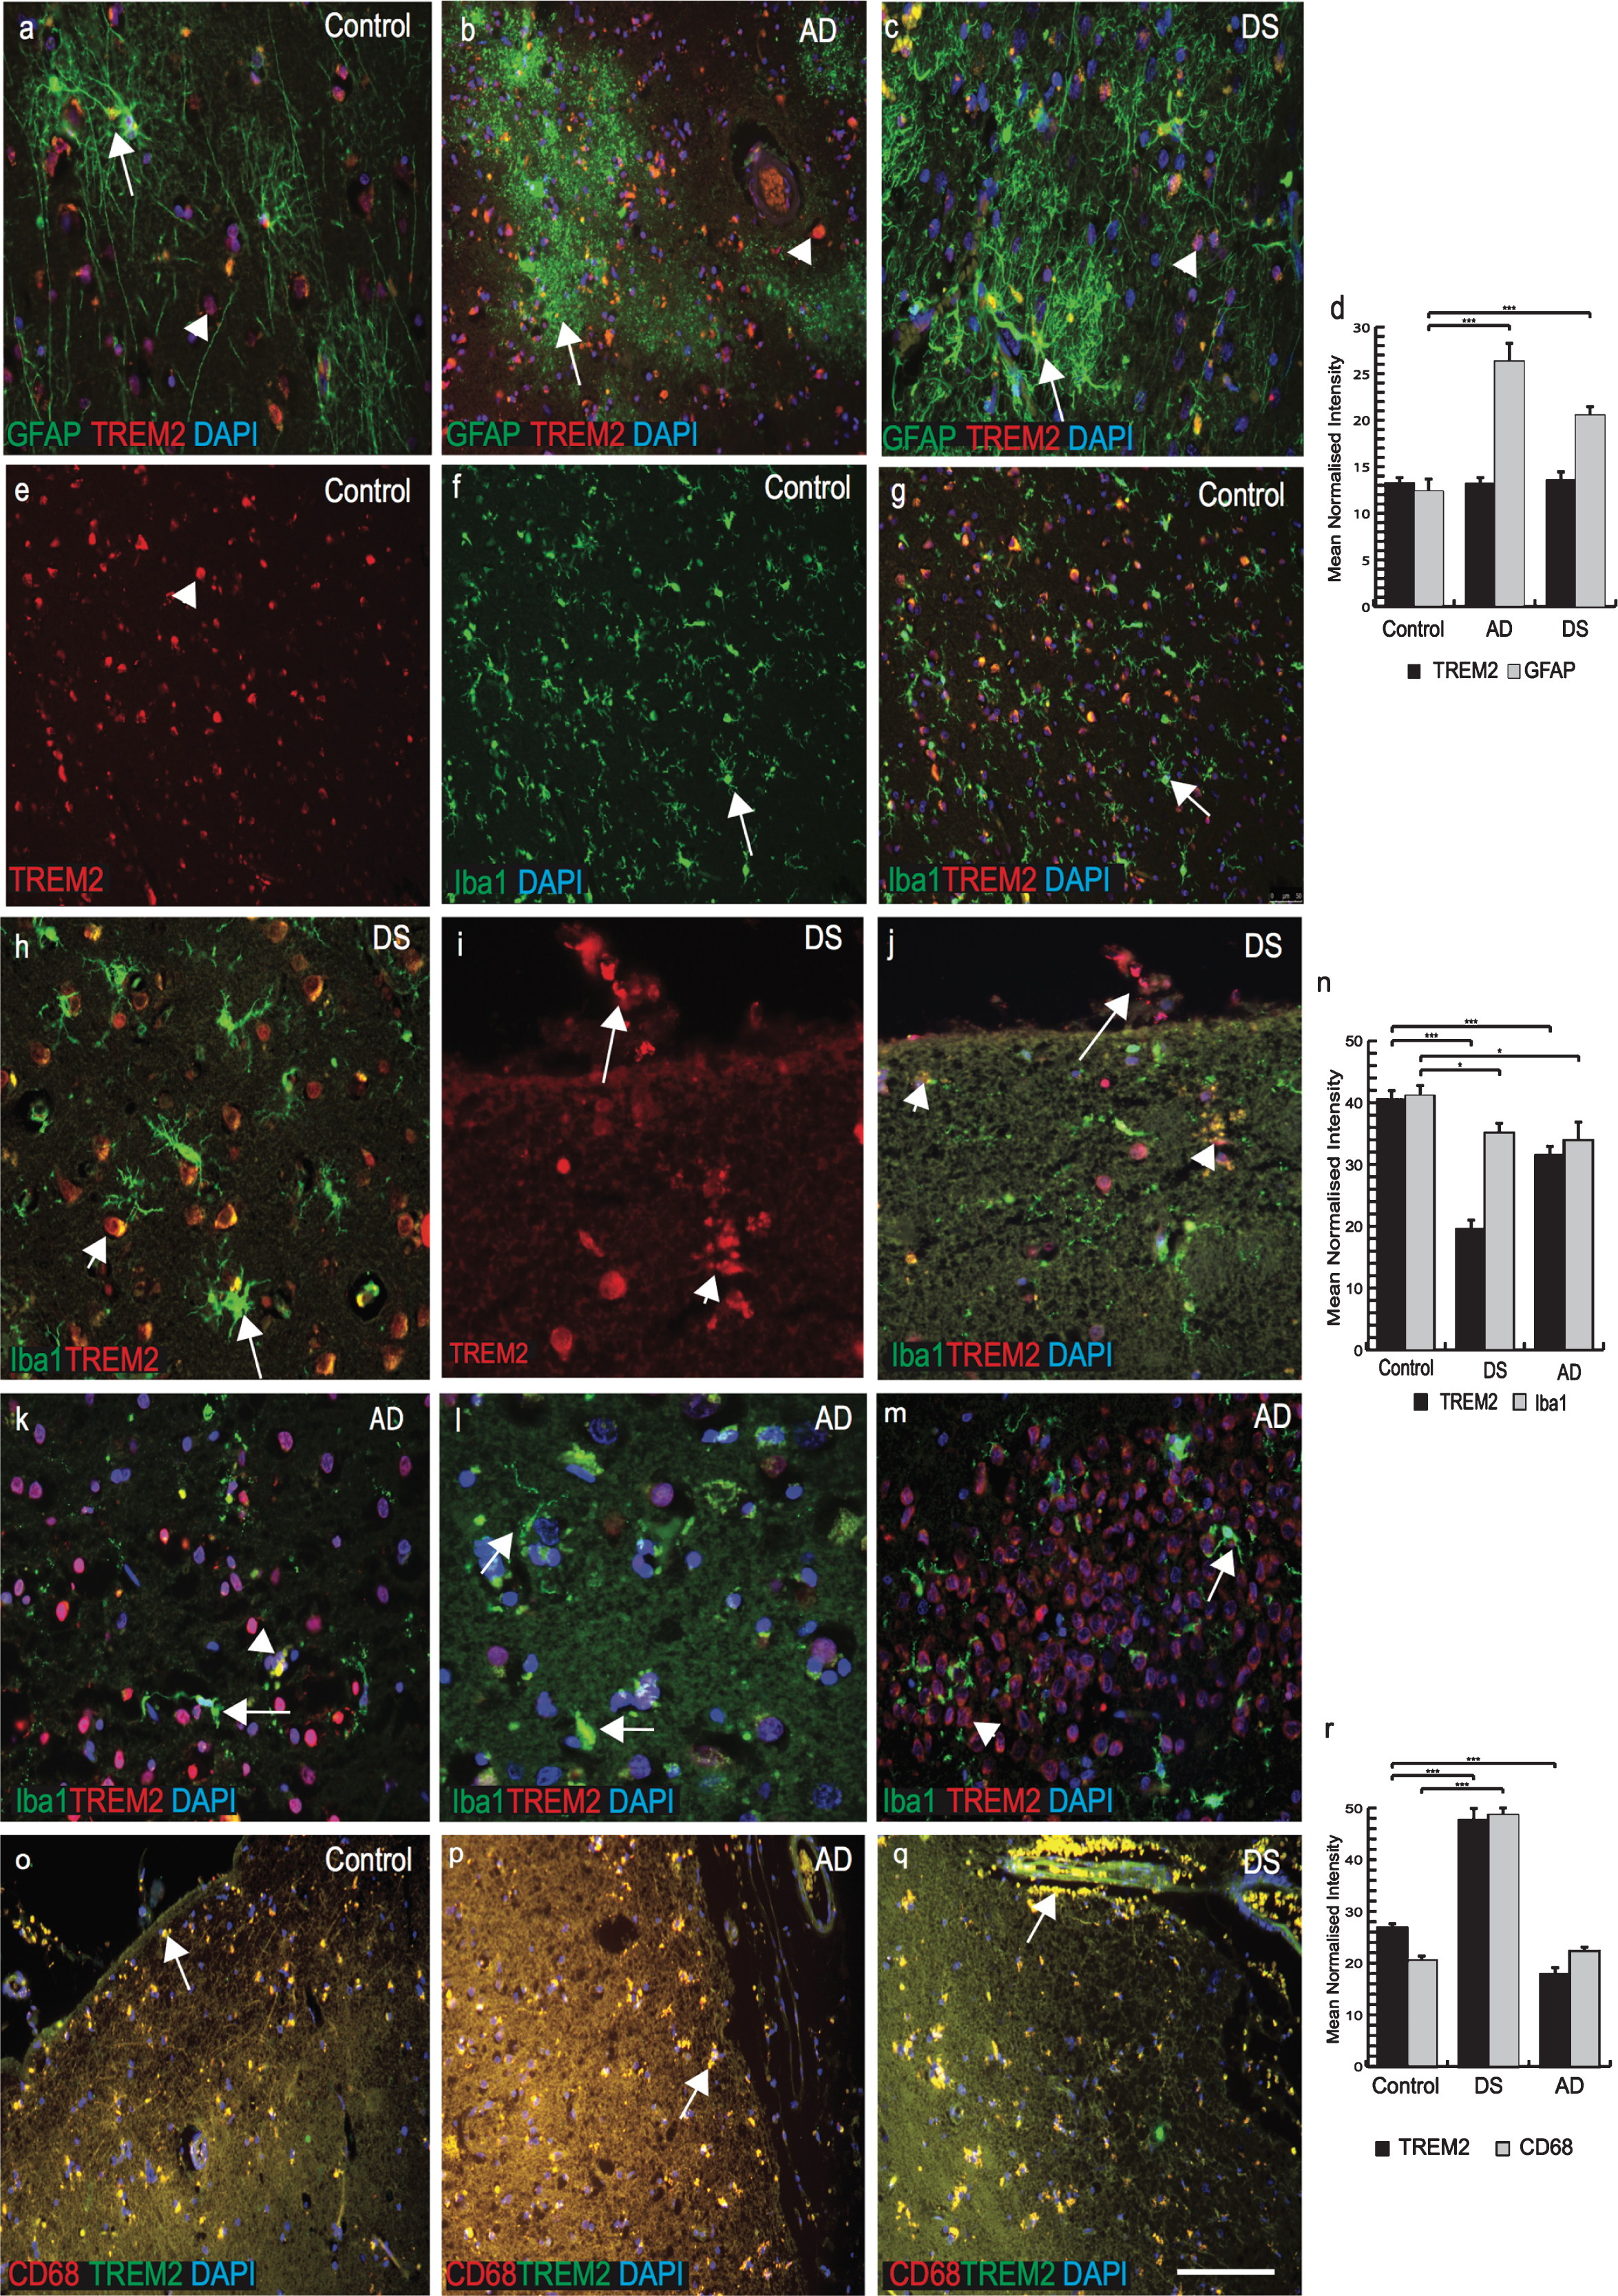
We then stained brain sections with microglial marker (Iba1) and TREM2. In control brains, Iba1 positive microglia were visible in the cortex(Fig. 4e-g; Supplementary Fig. 2a-c). TREM2 was present in some cells close to blood vessels but there was limited TREM2 expression in the ramified microglia (Fig. 4f, g; Supplementary Fig. 2a-c). In DS brains, TREM2 protein was found in surviving cells around the SP (Fig. 4h; Supplementary Fig. 1d-f). Iba1 positive activated microglia were present in the brain parenchyma but there was limited co-localization with TREM2 (Fig. 4h; Supplementary Figure 1d, f). In DS brain, soluble TREM2 was observed to be present in a cell on the pial surface of a macrophage phenotype in addition to a subset of microglia within the cortex (Fig. 4i, j; note also small vesicles shown by arrow head). In AD brain, activated microglia were present near SPs in the cortex (Fig. 4k-m; Supplementary Figure 2d-f) and limited numbers of damaged microglia co-localized with TREM2 in the periphery of SP (Supplementary Figure 2f) and in the hippocampus (Fig. 4m; p≤0.01). The highest number of TREM2 positive cells was seen in control brains and the lowest in DS brains (Fig. 4n; p≤0.001).
As TREM2 protein was visible in peripheral macrophages in post mortem brain tissue, we therefore extended our search using anti-CD68 (phagocytotic macrophage/microglia marker), and anti-TREM2 antibodies. In all brain sections, TREM2 showed very strong co-localization with CD68 (Fig. 4o-q, r; p≤0.001). In DS brain, red blood cells (RBCs) were visible on the pial surface of the cortex and TREM2 protein was found inside the brain parenchyma (Fig. 4q). These data support the notion that macrophages and red blood cells from blood vessels can transport soluble TREM2 protein into the brain parenchyma.
TREM2 protein observed in the brain parenchyma close to blood vessels
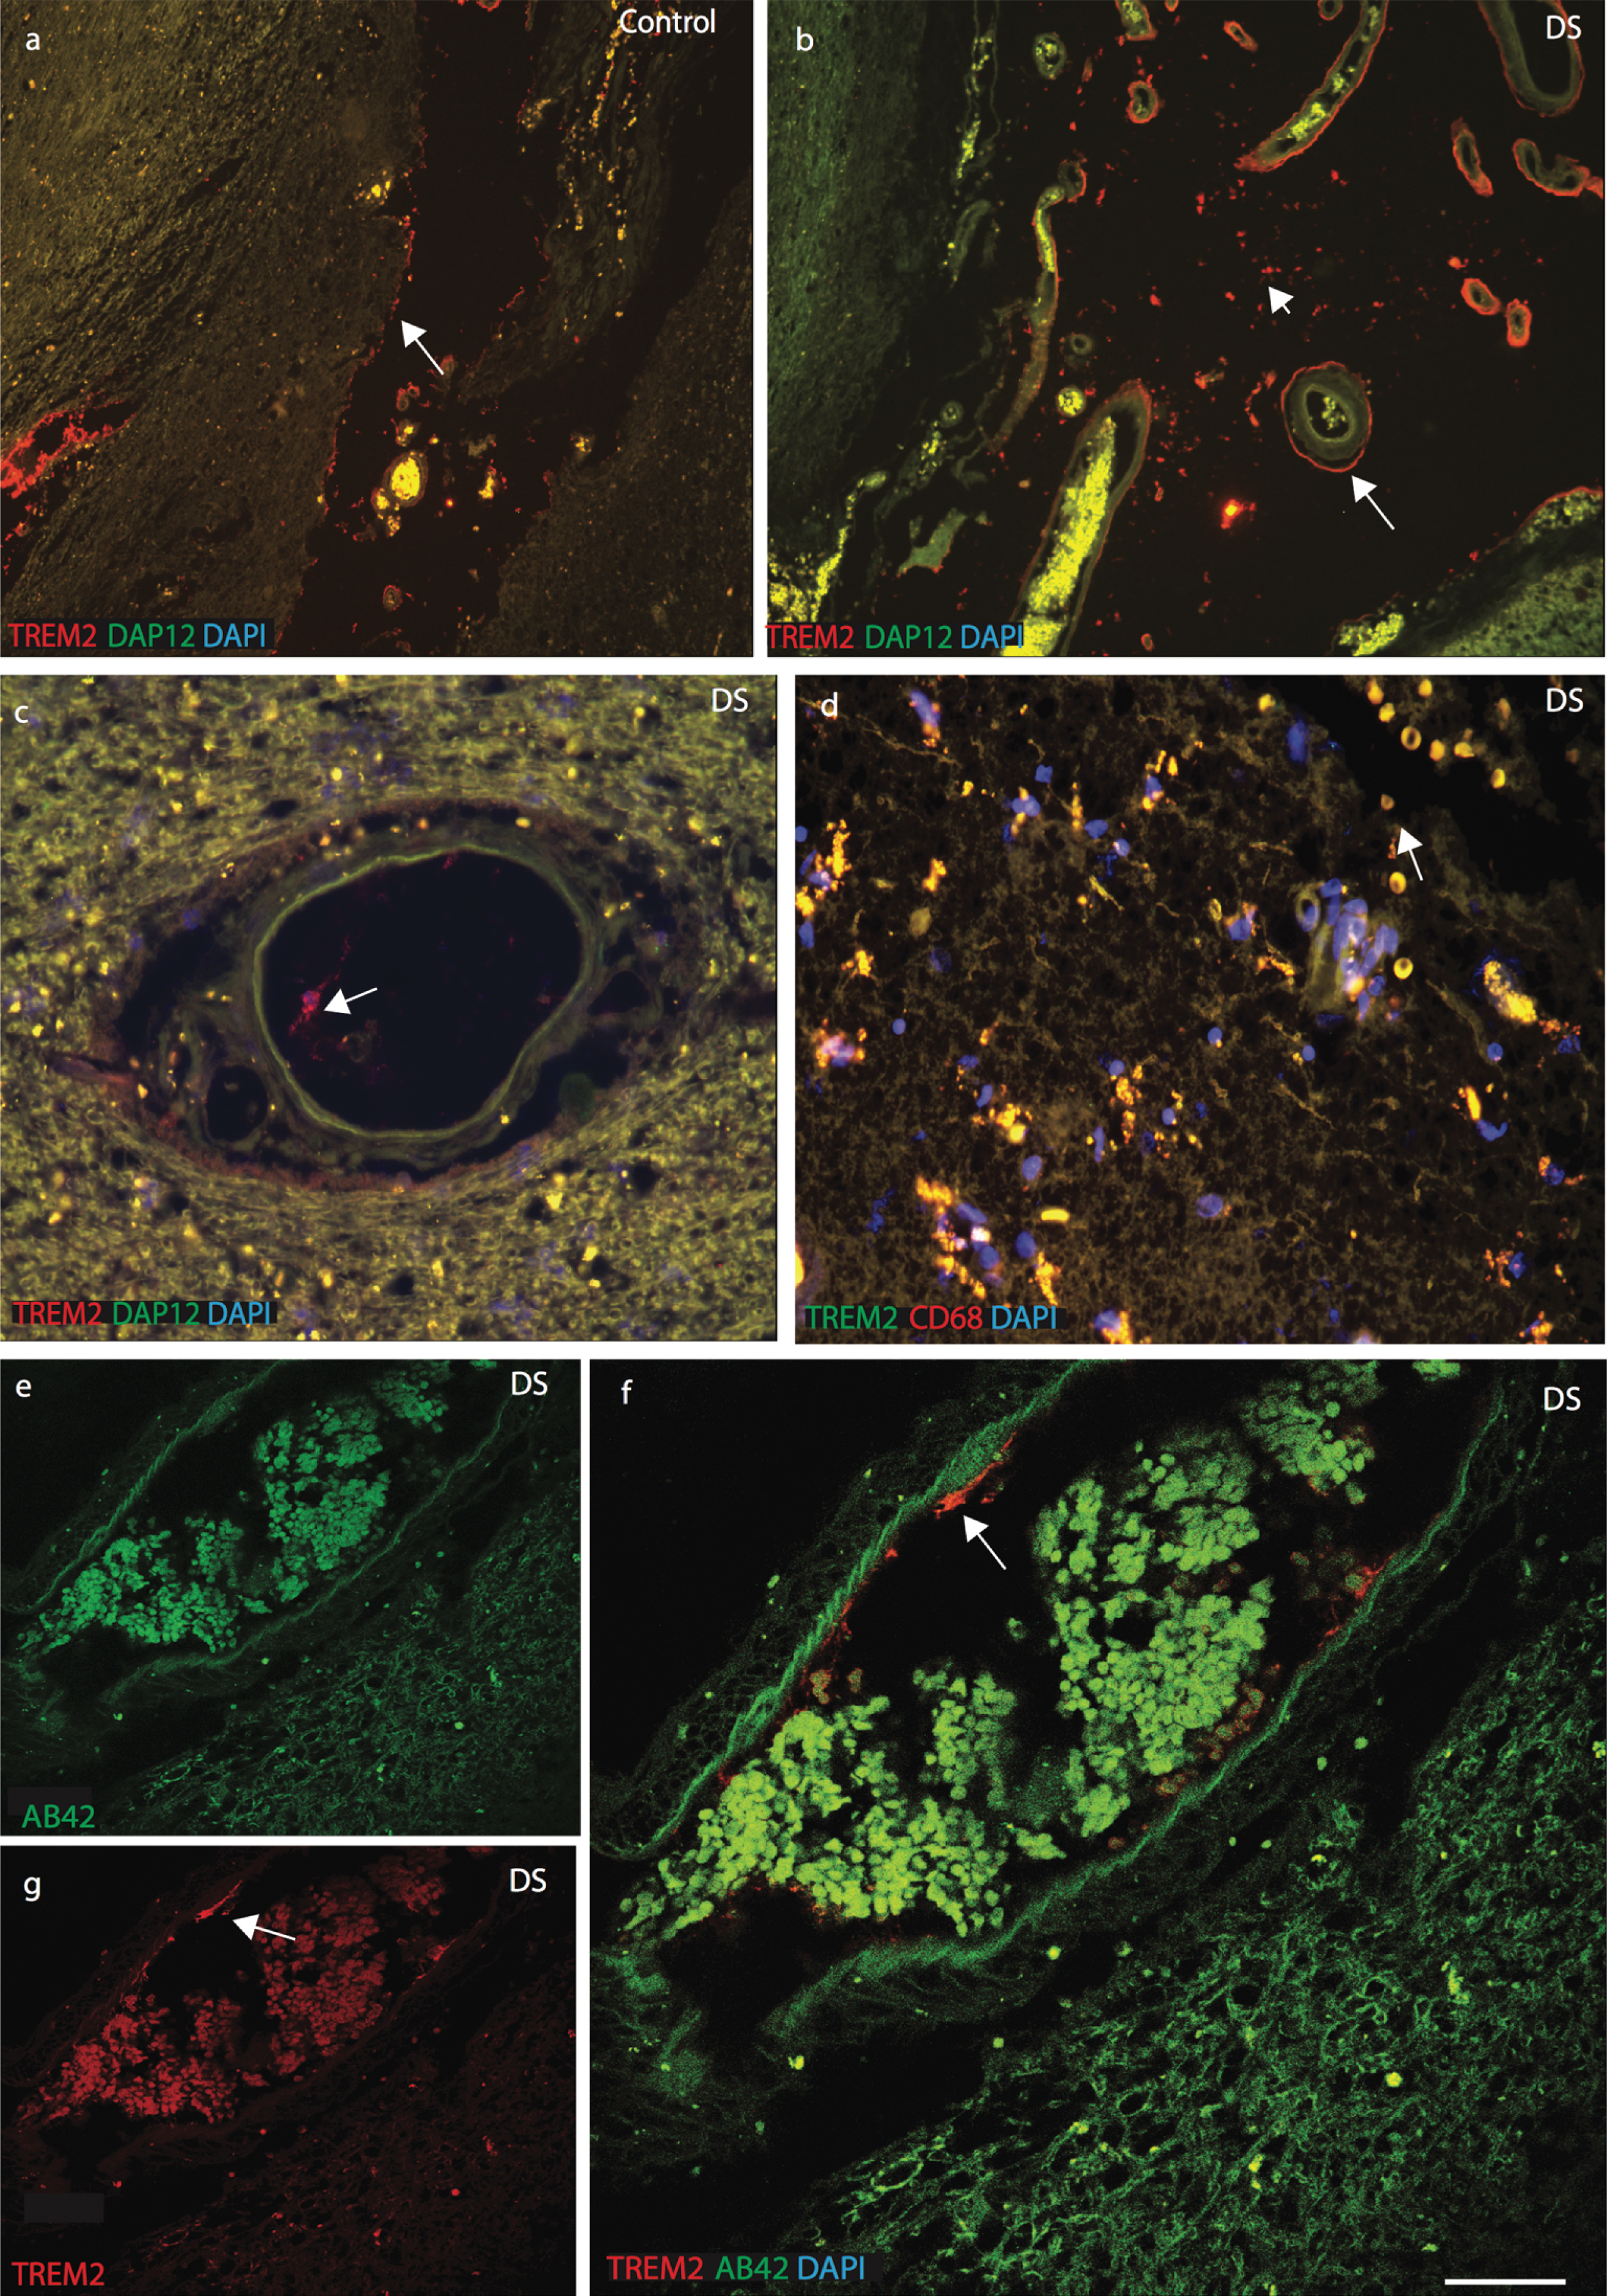
To confirm the location of TREM2 in cells related to peripheral blood vessels in the brain parenchyma, we investigated the expression of DAP12 and the macrophage marker CD68. DAP12 is a type-I transmembrane adapter protein that forms a molecular complex with various receptors, including TREM2 [32]. In control brain sections, TREM2 and DAP12 were visible in neurons in the brain parenchyma (Supplementary Figure 3a-c). To confirm neuronal expression, brain sections were stained with TREM2 and a neuronal marker (NeuN), which were found to co-localize (Supplementary Figure 3d). In DS and control brain sections, TREM2 was found in perivascular macrophages close to blood vessels (Fig. 5a-c). DS brain sections were stained with anti-TREM2 and anti-CD68, and were found to co-localize (Fig. 5d). TREM2 positive cells were observed to be in direct contact with the pial surface and only a small subset co-localized with Iba1 positive cells (Supplementary Figure 3e-f). DS brain sections close to the blood vessels were stained with anti-Aβ42 and anti-TREM2 and imaged with confocal microscopy. Aβ42 was visible in the brain parenchyma and blood cells whereas TREM2 was seen in cells in close proximity to blood vessel walls (Fig. 5e-g).
Fig.5
TREM2 protein enters in the brain from blood vessels via macrophages. Immunofluorescence staining was performed with polyclonal rabbit anti-DAP12 (green), monoclonal anti-TREM2 (red) antibodies, and DAPI (Blue). In control brain sections, DAP12 was visible in the brain parenchyma (a), whereas TREM2 was found in the perivascular macrophages and close to the blood vessels in DS brain (b). In DS brain a TREM2 positive macrophage was seen in blood vessels (c). DS brain sections were stained with TREM2 and CD68, showed that TREM2 protein carried by RBCs (d). A confocal micrograph showed Aβ42 (green) was visible in the parenchyma and in the blood cells whereas TREM2 (red) was seen in the macrophages close to the blood vessels (e-g). Scale bar in a-b = 70μm, c-d = 50μm, and e-g = 20μm.
Haplotype co-relation between TREM2 and APOE in DS
We performed single nucleotide polymorphisms (SNPs) analysis for the TREM2 (R47H, C/T) mutation and APOE genotype (ɛ2, ɛ3, and ɛ4 alleles) in our DS DNA from blood samples (n = 50). The frequency of the TREM2 R47H (T allele) mutation was 0.046-only two subjects out of 44 carried the mutation; a similar frequency was previously reported in AD and older population [16]. The frequency of APOE alleles ɛ2 (0.11) and ɛ4 (0.15) were greater in DS, whereas ɛ3 (0.74) was lower compared to previously published studies on AD (ɛ2, 0.066; ɛ3, 0.85; and ɛ4, 0.08) [33]. None of DS subjects were homozygous for the APOE4 allele. One DS subject (DS55, 39 years old) with TREM2 R47H (T allele) was heterozygous for APOE (ɛ3/ɛ4) and another DS subject (DS18, 32 years old) was homozygous for APOE (ɛ3/ɛ3). Both of them did not have clinical dementia, and may have been too young to show clinical symptoms. There was a positive co-relation between the TREM2-C allele and APOE ɛ2 allele as a protective haplotype, but the number of DS samples available to study were too limited to infer any statistical significance.
TREM2 was observed in erythromegakaryocytes and in platelets, suggesting a myeloid origin
There is an increased risk of leukemia in adults with DS in addition to a variety of other hematological abnormalities that have been reported [9]. Therefore, we analyzed TREM2 expression in blood smears from DS subjects (n = 50, from different age groups 30–65 years) and imaged with confocal microscopy. DS and control blood smears were co-labeled with TREM2 and an erythrocyte plasma membrane marker glycophorin. Both proteins were found to co-localize in RBCs membranes suggesting that TREM2 was expressed on surface of RBCs (Fig. 6a-f). There was stronger TREM2 expression around the RBC plasma membranes, in platelets and in neutrophil plasma membrane in the control samples (Fig. 6a-c) compared to DS samples (Fig. 6d-f, o; p≤0.001). Additionally, TREM2 was observed scattered and extra-corporally to RBCs and within the cell bodies of mononucleated cells (MNC) in DS samples (Fig. 6d-f). A classic dysmorphology (bi-lobed neutrophils) with significantly higher TREM2 protein around the MNC was frequently observed in young DS blood smears (Fig. 6h-j), whereas normal neutrophils positive for TREM2 were found in controls (Fig. 6 g). The blood smear from a young DS subject (DS1, 30 years old) showed more TREM2 protein expression within RBCs (but not around the erythrocyte plasma membrane) and around the neutrophils (Fig. 6d, h). Two young DS participants’ blood sample smears (DS18, aged 32 years and DS55, aged 39 years, with the TREM2 R47H, T mutation) showed abnormally shaped RBCs in their smears (Fig. 6e, f; and see below), with abnormal accumulation of TREM2 around the MNCs (Fig. 6i, j). DS55 was heterozygous for APOE genotype (E3/E4) and displayed an abnormal erythrocyte phenotype compared to DS18 (ɛ3/ɛ3 genotype) (Fig. 6i). Another blood smear of a young DS participant (DS2, 30 years old negative for R47H mutation and carrying APOE (ɛ3/ɛ4 genotype) when stained with TREM2 and APOE or Aβ42, showed that both proteins were co-localized in platelets and around the MNC (Fig. 6k, m, p, q; p≤0.001). A confocal micrograph of blood smear from DS2 showed large numbers of small particle (like vesicles or exosomes) around the platelets and MNCs. To confirm this, we stained some other slides with exosome markers CD9 or CD63 and TREM2, and both co-localized, indicating that TREM2 could be transport by plasma exosomes particles (Fig. 6n).
Fig.6
TREM2 was observed in erythromegakaryocytes and in the platelets suggesting a myeloid origin. Confocal micrograph images taken of DS and control blood smears, were stained with anti-TREM2 (green) and anti-glycophorin (red), a red blood cell (RBC) membrane marker. TREM2 protein (green) was present around the erythrocytes membrane (a-c). There was a stronger TREM2 (green) expression around the RBCs in the control blood smear (a) than in DS (d-f). Additionally, analyses on the DS blood smears revealed the presence of scattered TREM2 (green) outside mononucleated cells (g-j). In two young DS subjects that were carrying TREM2 C/T variant (R47H mutation, DS18, and DS55), blood smears contained abnormal shape of the (i-j) and soluble TREM2 and APOE around the neutrophil (k). In mutant carrier DS 55 (mutant carrier) showed abnormal shape RBCs and a very faint TREM2 expression was seen in the center of RBCs and membrane bound Aβ42 (green) was visible (l). In young DS2 (APOE4 carrier) carried fragmented platelets surrounded by vesicles positive for TREM2 (m) and co-localized with exosome marker CD9 (n). Bar diagrams: TREM2 level was lower in mutant DS (o), Aβ42 and APOE levels was higher in older DS (p & q, ***p < 0.0001) Scale bar in a-f, k&l = 20μm, g-j = 10μm, m&n = 5μm.
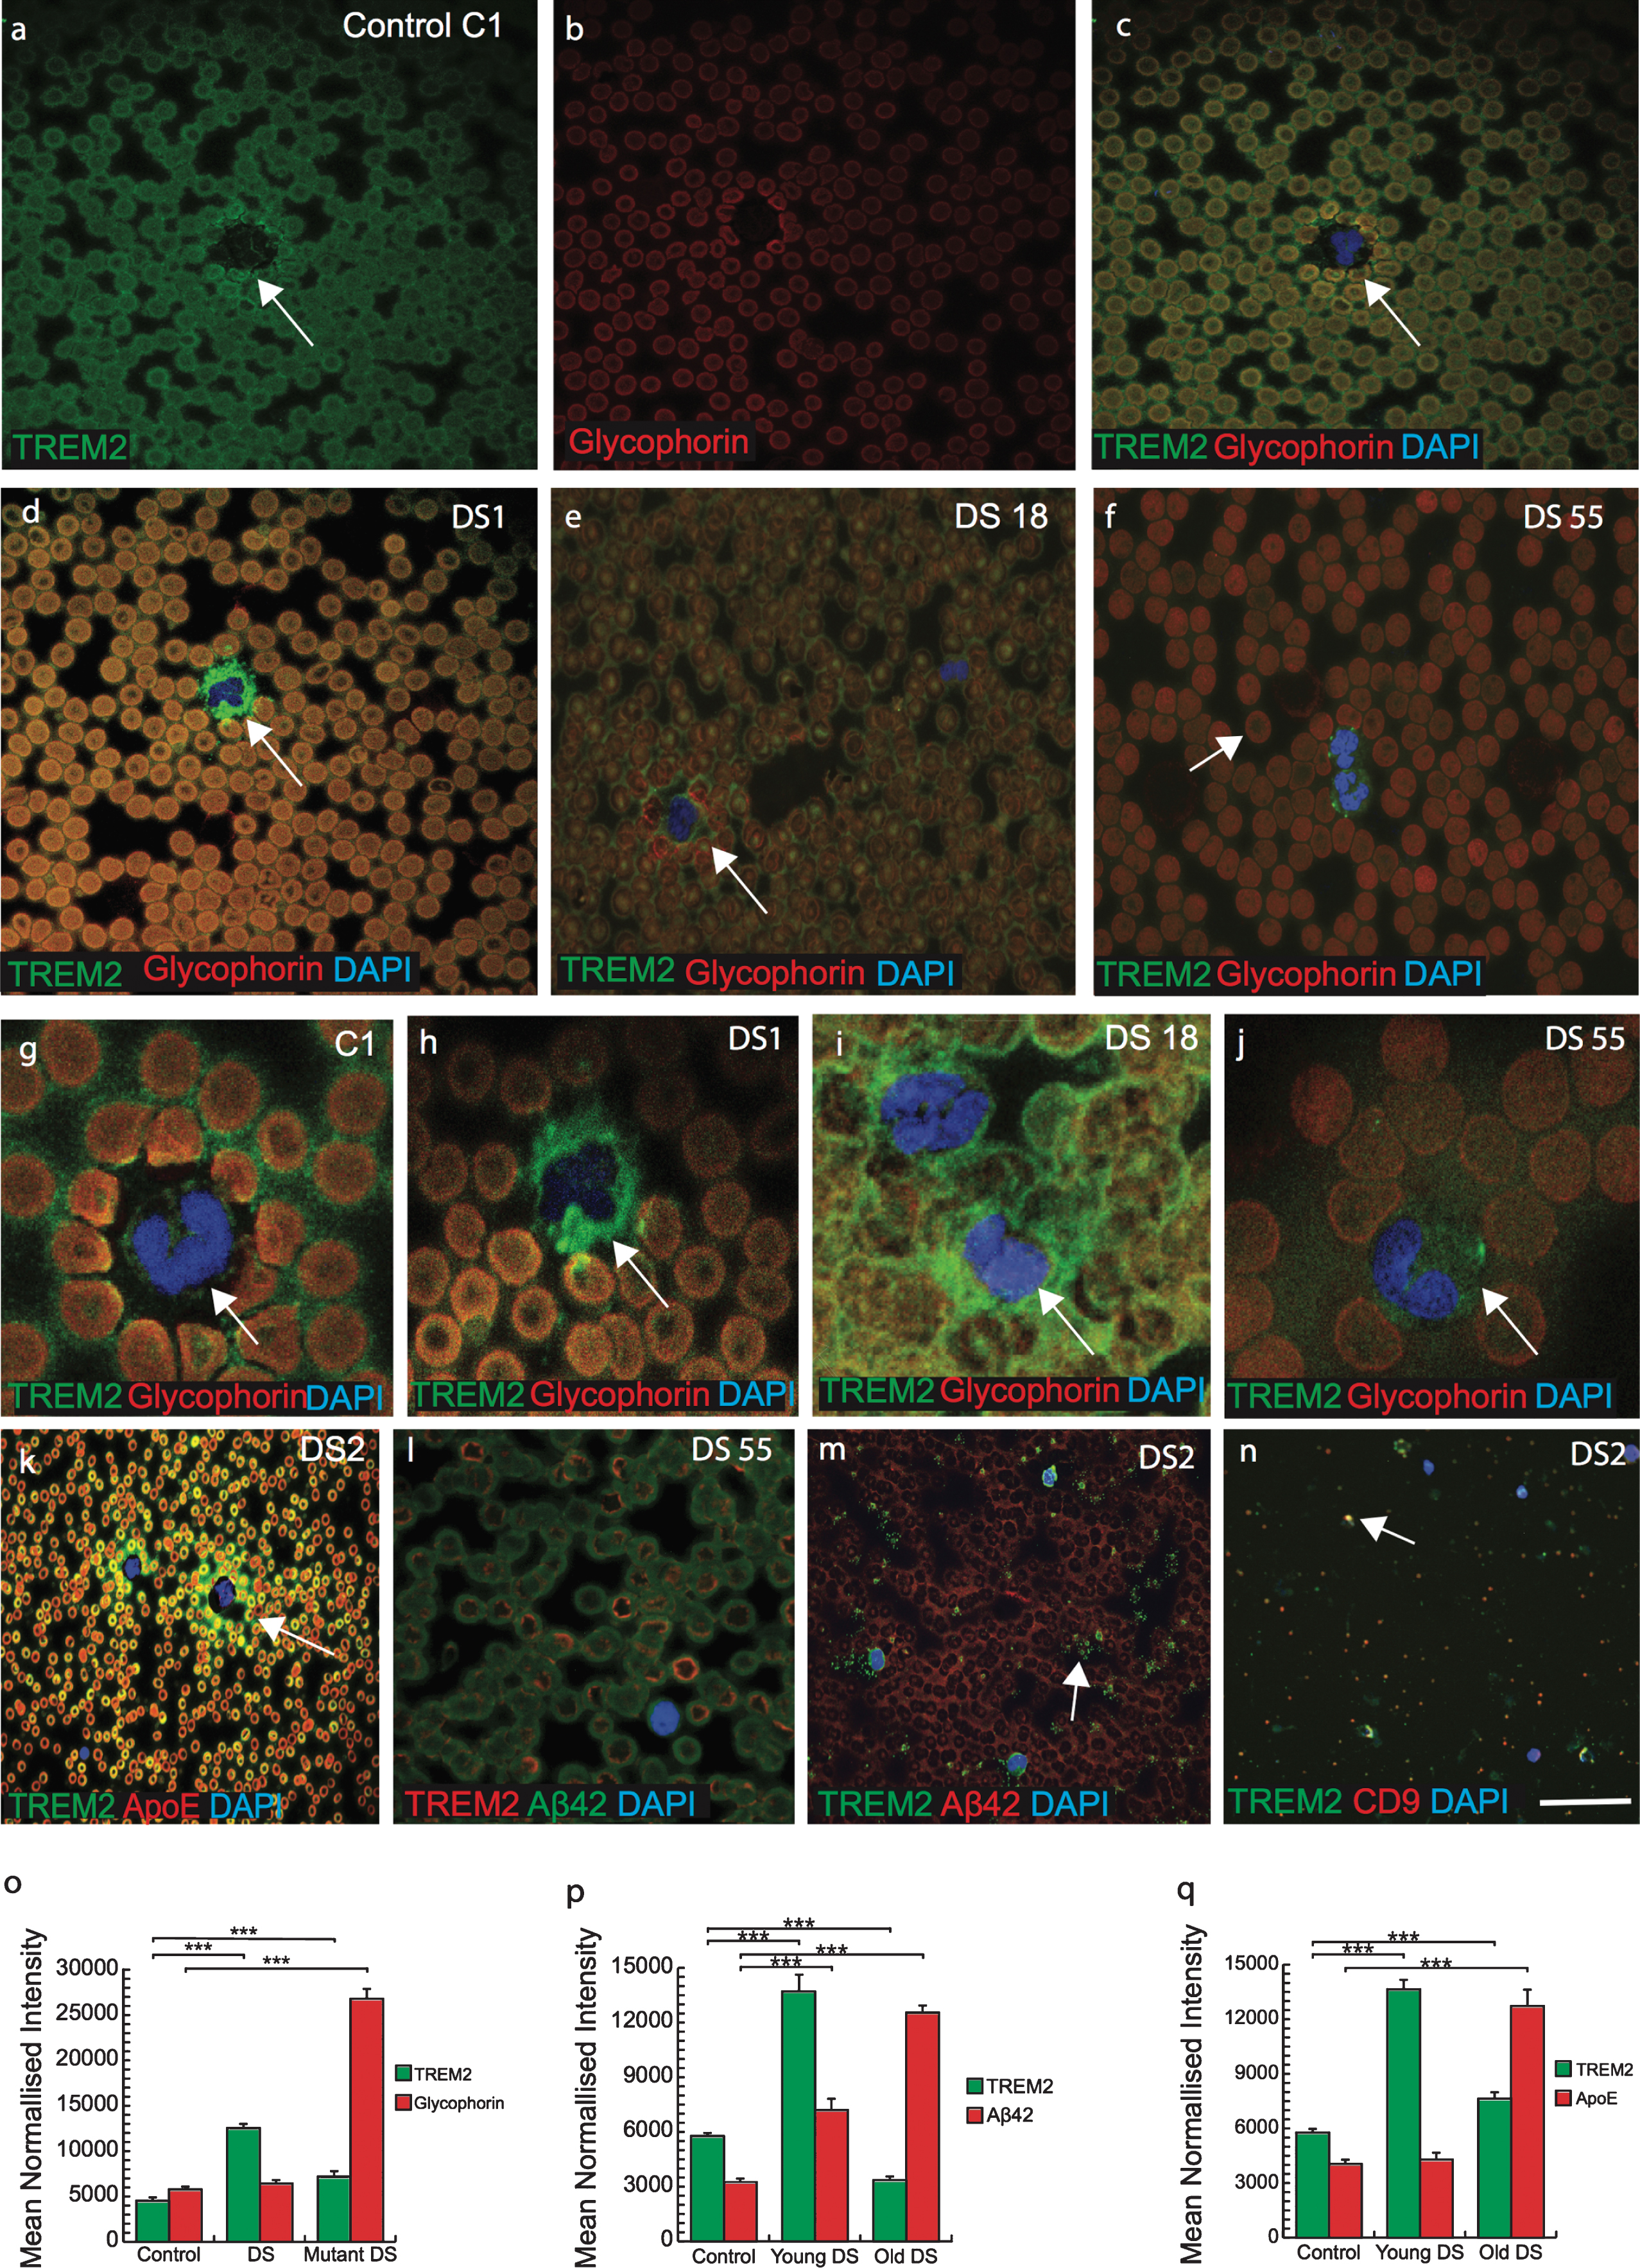
RBCs appeared macrocytic and both of the DS participants (DS18 and DS55) who were positive for the TREM2 variant (R47H mutation, C/T variation), had significantly higher mean red-cell volumes and low hemoglobin, white cell (3.6×10³/L) and platelet counts (50×109/L), and showed abnormal shape RBCs (Fig. 6l, p≤0.001). These findings indicated that TREM2 protein may be essential for normal development of RBCs and for transporting soluble proteins.
TREM2 is expressed in the human bone marrow myeloid cells and mesenchymal stem cells and it participates in erythro-phagocytosis
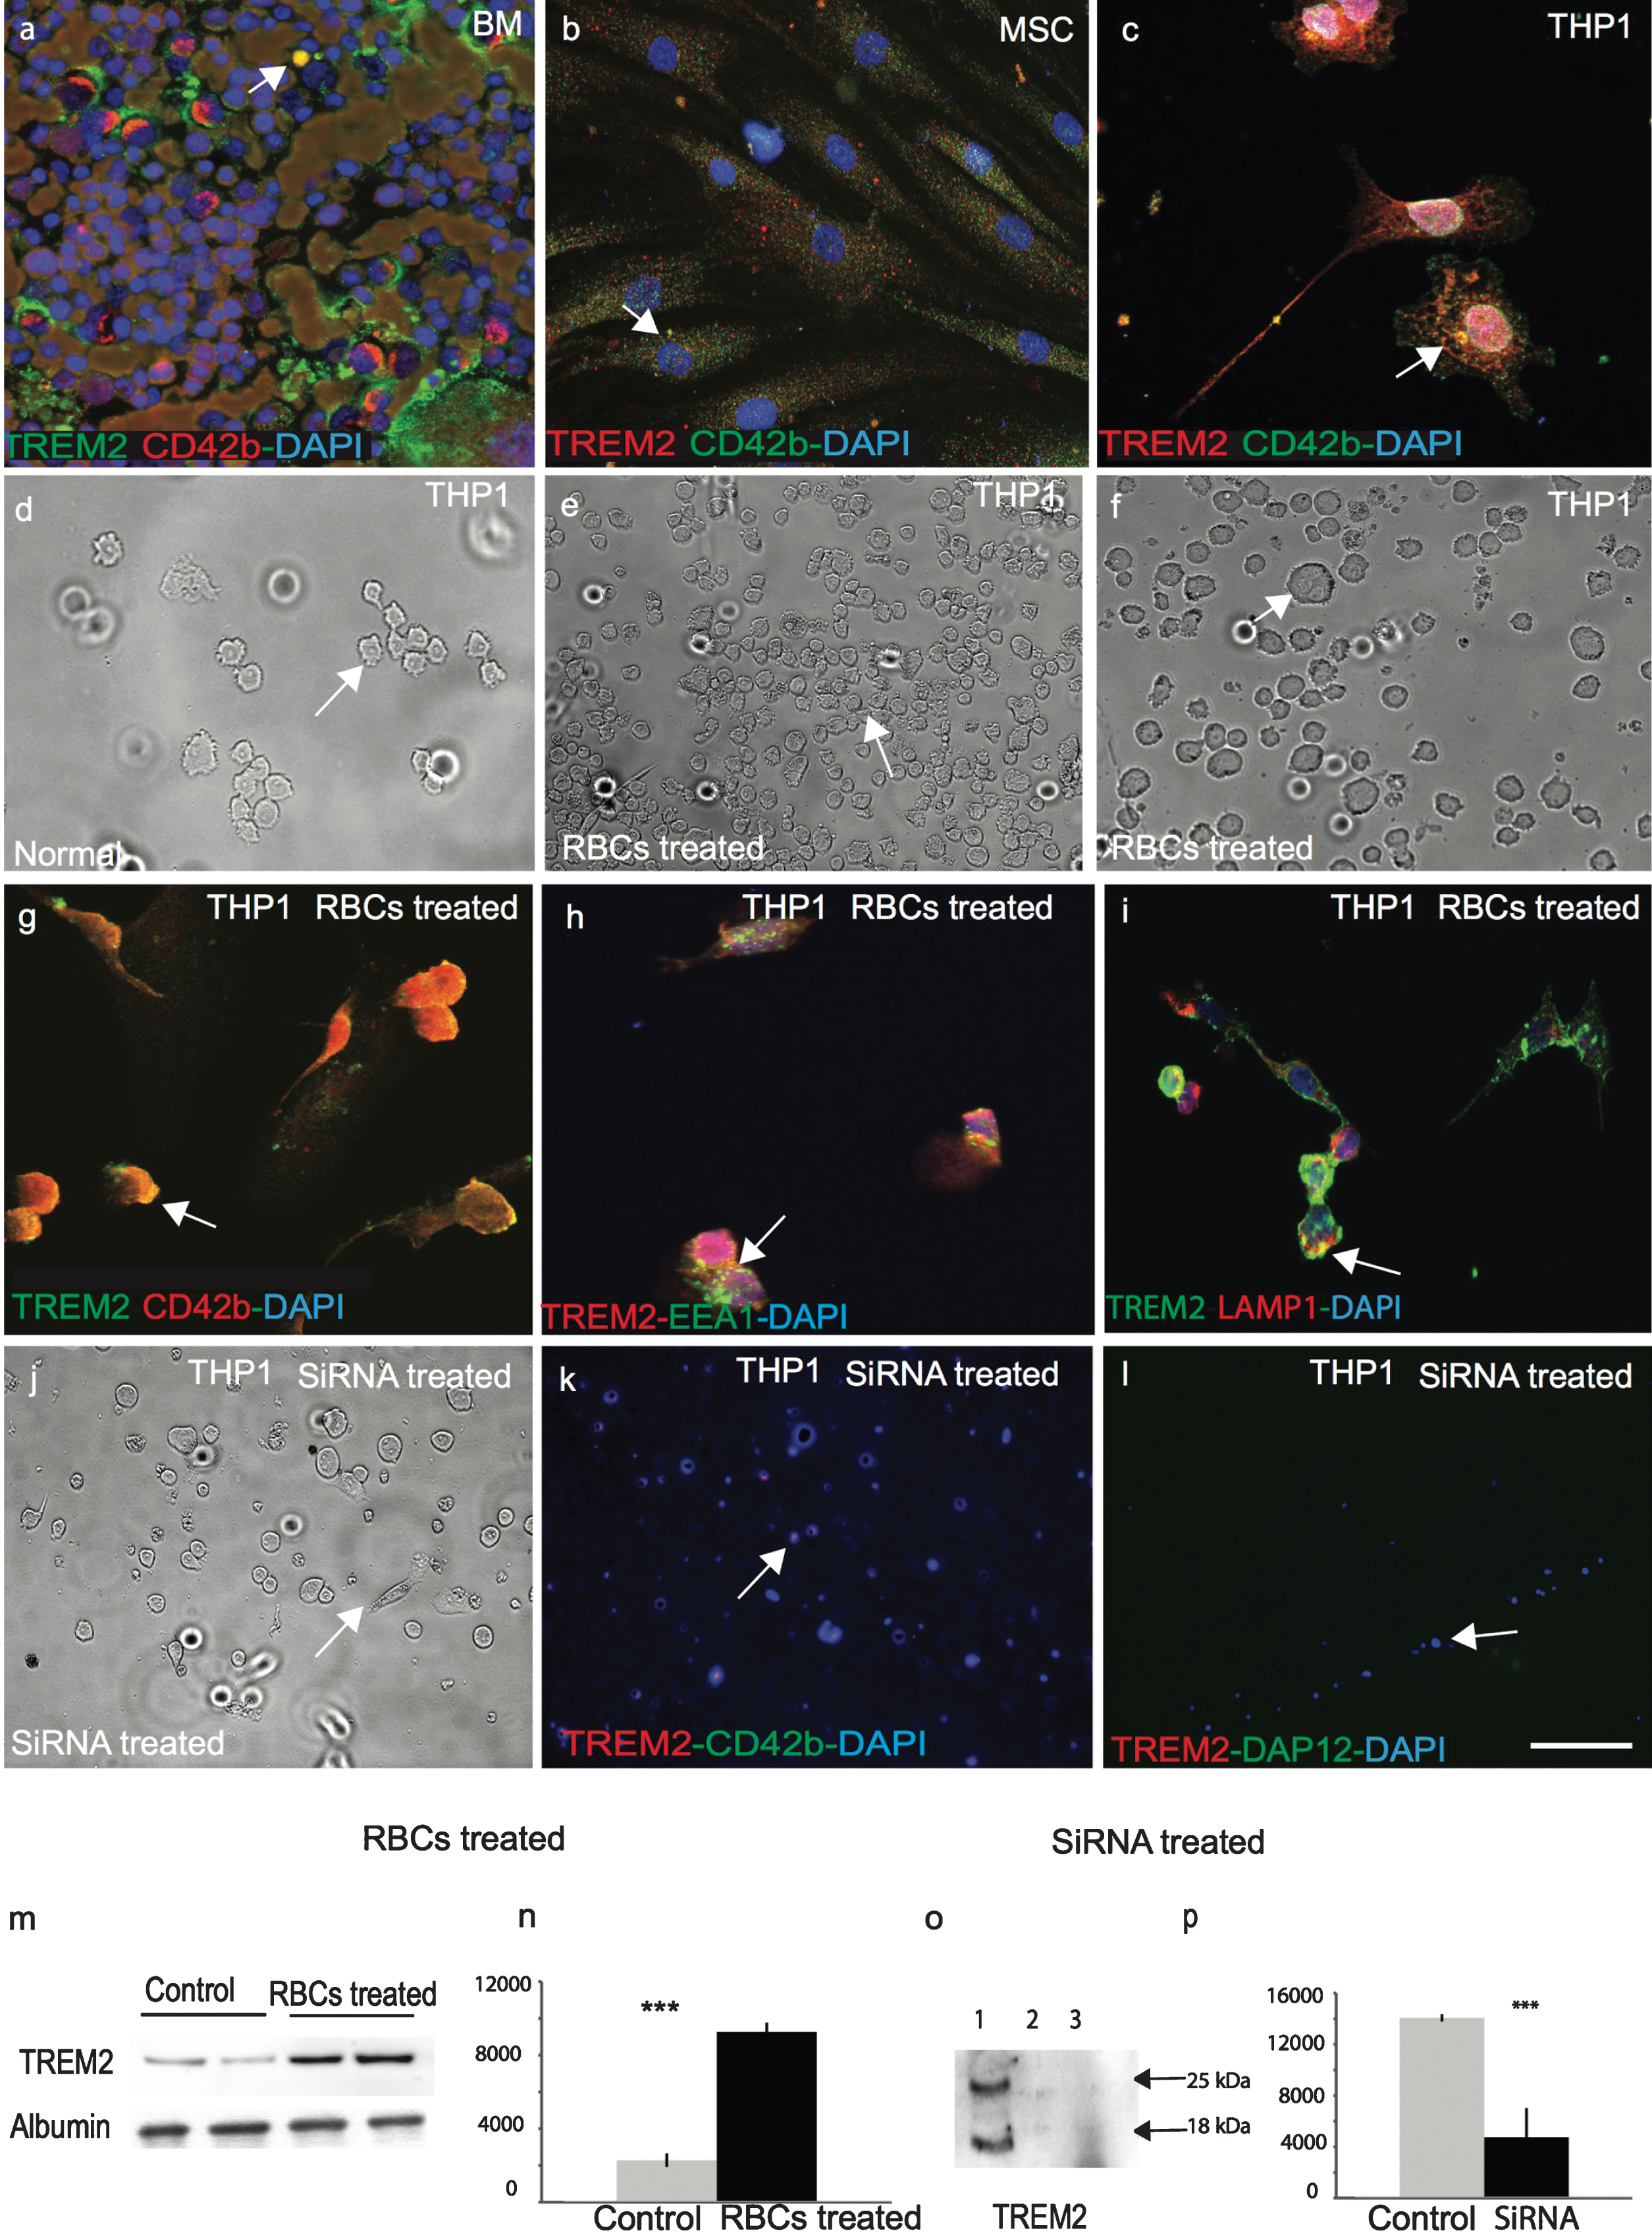
To confirm that TREM2 is expressed in human bone marrow megakaryocytes, a DS bone marrow slide was stained with TREM2 and a well-known megakaryocyte marker CD42b. TREM2 was expressed in bone marrow megakaryocytes (Fig. 7a). Human primary mesenchymal stem cells (MSC) were stained with TREM2 and CD42b, which showed that TREM2 was present in human MSC (Fig. 7b), and both proteins co-localized in a human monocyte/myeloid cell line, THP1 (Fig. 7c). As RBCs were engulfed by microglia/macrophages in human brain sections as seen in Fig. 4p and q, we investigated whether TREM2 was involved in erythrocyte phagocytosis using the THP1 cell line (Fig. 7c, d). THP1 cells were treated with freshly harvested IgG coated rat RBCs (Fig. 7e-g), which was previously described method used to investigate RBC phagocytosis [27]. We confirmed that TREM2 protein was present in RBCs, which then participated in phagocytosis and endocytosis. RBCs were engulfed by the THP1 cells within 4 h and membrane bound TREM2 was visible (Fig. 7e-g) and TREM2 co-localized with EEA1 (an early endosome marker) and LAMP1, (a late endosomal marker) (Fig. 7h, i). Cells were harvested and TREM2 protein analyzed by WB showed that the TREM2 levels increased at least four-fold after RBCs treatment suggesting that TREM2 protein was present in RBCs (Fig. 7m, n; p≤0.001).
Fig.7
TREM2 protein is involved in phagocytosis and is required for myeloid cells survival. In human bone marrow, TREM2 (green) protein was expressed in myeloid progenitor cells and co-localized with mesenchymal cell markers anti-CD42b (a). Similarly, to human mesenchymal stem cells (MSC), both TREM2 (red) and CD42b (green) were present (b), and showed some co-localization in monocytic cell line THP1 (c). A bright field image of normal THP1 cells (d) and after 24-h post-treatment with rat RBCs showed total phagocytosis of RBCs inside the THP1 cells (e-f) and co-localization with CD42b (g). RBC-treated THP1 cells were stained with TREM2 and found to be co-localized with EEA1 (green) (an early endosome marker) (h) and LAMP1 (a late endosomal marker) (i), suggesting that TREM2 protein participates in endocytosis and phagocytosis. WB analysis was performed with rat-RBC treated and untreated THP1 cell lysate. TREM2 protein levels increased at least four-fold post-RBC treatment (m & n, p < 0.0001). THP1 cells were transfected with human TREM2 anti-sense oligonucleotides, cells were stained with anti-TREM2 and anti-DAP12 antibodies. Very faint TREM2 expression was visible (j-l). Cells were collected and a WB analysis was performed with an anti-TREM2 antibody. TREM2 expression was visible in the control cells but not in the siRNA treated cells (o & p, p < 0.0001). Error bars indicate SEM. ***p < 0.0001. The scale bar in a-c and g-i = 25μm, d-f and j-l = 50μm.
Knock down of TREM2 using siRNA in THP1 cells
We have previously reported that TREM2 protein is important for cellular proliferation [21]. To further investigate the role of TREM2 in cellular proliferation, THP1 cells were transfected with human TREM2 anti-sense oligonucleotides for 24–48 h, which resulted in an increase in cell death. After 48 h, cells were stained with TREM2, CD42b, and DAP12 antibodies and only very faint TREM2 expression was visible (Fig. 7j-l). Cells were harvested and a WB analysis performed using mouse anti-TREM2 MAB (ab201621) which showed TREM2 expression in control cells (treated with scrambled SiRNA) but not in TREM2-siRNA treated cells (Fig. 7o, p; p≤0.001).
DISCUSSION
People with DS have intellectual disability, premature aging, and have a high risk for developing AD dementia pathology [34–39]. The mechanism of the early onset of AD pathology is not fully understood but the over-expression of certain genes on chromosome 21 including APP and oxidative stress-related genes including Cu/Zn superoxide dismutase (SOD1), Ets-2 transcription factors, and S100 play crucial roles [40, 41]. Abnormalities in the immune system are also seen in people with DS and may also participate in the pathogenesis of AD. Various immunological and hematological abnormities are more common in DS and suggest that inflammation and activation of innate immunity are early events in DS [42]. These include susceptibility to autoimmune diseases, recurrent infections, mild to moderate T andB-cell lymphopenia, defective neutrophil chemotaxis. Adults with DS are prone to myeloid leukemia but also have a variety of blood abnormalities including leukopenia, macrocytosis, elevated mean red-cell volume, and persistent abnormal erythrocytosis [43]. We investigated the role of TREM2 in DS and its relationship to AD to understand the contribution of innate immunity to the pathogenesis of dementia.
TREM2 is primarily expressed in various tissue macrophages, monocyte-derived dendritic cells and osteoclasts [13]. The R47H mutation in the TREM2 gene correlates with a substantial increase in the risk of developing AD [15, 16, 44]. The identification of this novel variant in the gene encoding TREM2 has refocused attention onto myeloid defects and their potential as a contributory factor in AD and dementia in DS [45–47].
Using human brain sections from AD and DS we provide evidence for the first time that soluble TREM2 originates in bone marrow, is transported to the brain by a subset of macrophages (possibly transported via exosomes), before being taken up by microglia. We also demonstrated impaired trafficking of TREM2 to the plasma membrane of erythrocytes, which may ultimately impair amyloid clearance mechanisms and result in an increased rate of plaque deposition.
It was reported that soluble TREM2 is increased in the cerebrospinal fluid in AD in a disease progression dependent manner [48]. We discovered that TREM2 protein levels were significantly higher in serum compared to brain lysate and which correlated with disease progression in DS. These characteristics could make soluble TREM2 an ideal serum biomarker to assess disease progression in AD [49]. We have shown for the first time that there was a significant reduction of serum TREM2 levels in older DS subjects (who were affected by AD dementia pathology) compared with younger ones, and in addition, it was even lower than in sera of AD patients.
Although many published papers have reported TREM2 protein expression in microglia [50–53], we showed for the first time that soluble TREM2 protein was present in neurons in human DS (and control) brains, particularly in the cerebellar granule cells and in hippocampal neurons. We hypothesis that this is soluble TREM2 that has entered neurons and is involved in neuroplasticity and neuroprotection [21]. In postmortem brain sections of DS and AD, we showed minimal TREM2 expression near senile plaques in frontal and entorhinal cortices. With disease progression, large swollen dystrophic neurites and Aβ42 positive SP were seen but TREM2 protein was absent in SP.
In AD brain, however, some microglia were positive for TREM2 protein, but they displayed less microglial activation and they had not engulfed Aβ plaques. This may have impacted on the density of Aβ plaques and thus promoted diffuse Aβ structures that are thought to be more neurotoxic and thus contributing to the accumulation of classic AD pathology [23, 31, 50]. These findings highlight a crucial role of TREM2 in maintaining central nervous system homeostasis [47].
The presence of TREM2 in oligodendrocytes, the white matter tract of the olfactory bulb, corpus callosum, and striatal bundles indicates that TREM2 protein may have a role in myelination [21], implying that the lack of functioning TREM2 could be a contributing mechanism in demyelination deficits seen in DS which would increase the susceptibility for neuronal loss. TREM2 protein has been found to be dysregulated in other demyelinating disorders such as Nasu–Hakola disease, multiple sclerosis, and amyotrophic lateral sclerosis [54, 55]. Myelination defects are one of the features of DS children [56] that may continue into adulthood, with the potential to accelerate neuronal loss and premature aging and contributing to cognitive impairment.
There is a highly organized innate immune response during the early stages of inflammation characterized by the expression of various immunological proteins in the circumventricular organs, choroid plexus, and other structures lacking the protection conferred by the blood-brain barrier [57, 58].The response extends progressively, affecting microglia and macrophages across the brain parenchyma, and it has the potential to lead to the onset of an adaptive immune response [59, 60]. Macrophages are key cells in driving the innate immune response and form a heterogeneous population that possesses tissue-specific roles [47]. These cells display remarkable plasticity with functions that include the SP clearance response mediated by innate immune cells [61]. TREM2 protein was highly expressed in peripheral macrophages that were close to the ventricles and subarachnoid space. Although microglia/macrophages were clearly visible in DS and AD brain tissue and they may be involved in phagocytosis and clearance of Aβ protein, TREM2 more abundantly co-localized with CD68 (macrophage marker), supporting the notion that macrophages have the ability to transport soluble TREM2 into brain parenchyma and be involved in phagocytosis.
The expression of TREM2 in myeloid cells, even in erythromegakaryocyte progenitors, strongly supports an intrinsic immune factor involvement in aging and abnormal cellular processes in aging in DS. Soluble TREM2 protein carried by platelets and erythrocytes from the periphery enters brain parenchyma via a subset of phagocytic microglia/macrophages and/or exosomes. We confirmed that TREM2 protein was carried by plasma exosomes (small vesicles) by staining blood smears with known exosome markers (CD9 and CD63), as both markers co-localized. Recently when we were preparing this manuscript a paper published showed a very elegant transcriptional single cell sorting of immune cells and identified novel microglia associated with neurodegenerative diseases (DAM) [62]. We may have identified same subset of microglia/macrophages (DAM); however, our data did not suggest that this subset of microglias were disease associated, but instead could be diseaseprotective.
In addition, the TREM2 (R47H) mutation (which has been strongly linked with an increased risk of AD) was found in two DS subjects and in both we observed gross morphological changes in megakaryocytes and erythrocytes. In erythrocytes, we also discovered impairment of TREM2 trafficking to the erythrocyte plasma membrane that could influence the amyloid clearance mechanism thought to be important in AD pathogenesis. These two subjects, positive for the TREM2 R47H mutation, also manifested a significantly higher mean red-cell volume that may reflect enhanced erythropoiesis in response to impaired oxidative metabolism.
Another key protein involved in AD and DS is apolipoprotein E (APOE), which imposes a major genetic risk factor with 60–80% of AD affected individual having at least one APOE ɛ4 allele [63, 64]. APOE ɛ4 carriers develop Aβ plaques earlier than non-carriers, and APOE ɛ4 protein appears to influence Aβ aggregation and the rate of Aβ clearance from the brain. We found young DS subjects heterozygous for the APOE ɛ4 haplotype carried more TREM2 and APOE protein around neutrophils than in older DS subjects. In DS subjects (n = 47), 31% of DS were heterozygous for the APOE ɛ4 allele and none were homozygous. The APOE ɛ2 allele is associated with a decreased risk of AD [65, 66]. The frequency of ɛ2 alleles in DS was higher (20%), and interestingly nearly all DS subjects above 50 years of age of were either carrying ɛ3/ɛ3 or ɛ3/ɛ2; there was one exception of a DS subject above 50 years of age (55 years old) with a ɛ3/ɛ4 genotype and who had clinical dementia. As we have shown that younger DS have higher serum TREM2 protein levels than older DS, this finding suggests that TREM2 protein is neuroprotective and may act as a trophic factor.
To our knowledge, this study is the first to show evidence that peripheral TREM2 originates from bone marrow derived stem cells. We also confirmed (as we had previously reported) a phagocytotic role of monocytes [21] by using a myeloid/monocyte cell line (THP1) treated with rat RBCs and where both an early endosome marker (EEA1) and a late endosome marker (LAMP1) co-localized with TREM2 in the process. We also showed significantly increased TREM2 protein levels after erythrophagocytosis using immunofluorescence and WB. These data confirmed that TREM2 protein is carried by RBCs.
Conclusion
In this paper, we have confirmed that TREM2 protein originates in megakaryocytes, it is a serum protein transported in blood vessels by erythrocytes, and it migrates across the wall of ventricles to enter brain parenchyma. Individuals with DS show myeloid cell abnormalities from birth that are likely to affect their bone density (osteoclast dysfunction) and myelination, and later in life the lack of functioning TREM2 protein may accelerate neuronal cell loss, contributing to the aging process and neuroinflammation. As first proposed by Hardy and Selkoe, the “amyloid cascade” hypothesis purports that mis-metabolism and subsequent deposition of Aβ peptides as amyloid-β plaques are principle etiopathological events in AD [67, 68]. We propose the “myeloid hypothesis”, an additional conflating mechanism unique to DS where myeloid cell defects due to aneuploidy (impairment of protein transport, myelination and innate immunity) accelerate disease-related processes that lead to earlier onset of the pathology of AD. We have shown that TREM2 plays a critical role in this aging process. This hypothesis would explain why AD pathology occurs some 15 to 20 years earlier in the DS population. Understanding the molecular mechanisms and identifying critically important of TREM2 proteins involved in neuroprotection may reveal novel therapeutictargets.
ACKNOWLEDGMENTS
This research was funded by Medical Research Council (MRC grant number RNAG/254), National Institute of Health Research (NIHR), the Down’s Syndrome Association, The John Van Geest Foundation and Cambridgeshire and Peterborough Foundation NHS Trust, Cambridge, UK. We would like to thank to Dr. Andrew Osborne for human mesenchymal stem cells, Miss Sandra Siedlak for serum samples and Miss Isabel Wilson for statistical analysis, Cambridge brain bank (supported by NIHR) for human brain sections, and to Abcam, Cambridge for TREM2 antibodies. Our sincere gratitude toward DS participants and support from their family members.
Authors’ disclosures available online (https://www.j-alz.com/manuscript-disclosures/17-0814r1).
SUPPLEMENTARY MATERIAL
[1] The supplementary material is available in the electronic version of this article: http://dx.doi.org/10.3233/JAD-170814.
REFERENCES
[1] | Mann DM ((1988) ) Alzheimer’s disease and Down’s syndrome. Histopathology 13: , 125–137. |
[2] | Head E , Powell D , Gold BT , Schmitt FA ((2012) ) Alzheimer’s disease in Down syndrome. Eur J Neurodegener Dis 1: , 353–364. |
[3] | Sparks LD , Kryscio RJ , Hunsaker JC 3rd ((2013) ) Early age-related progression of AD-like neuropathology in Down’s syndrome. Am J Neurodegener Dis 2: , 121–128. |
[4] | Holland AJ , Oliver C ((1995) ) Down’s syndrome and the links with Alzheimer’s disease. J Neurol Neurosurg Psychiatry 59: , 111–114. |
[5] | Mann DM ((1988) ) The pathological association between Down syndrome and Alzheimer disease. Mech Ageing Dev 43: , 99–136. |
[6] | Hardy JA , Higgins GA ((1992) ) Alzheimer’s disease: The amyloid cascade hypothesis. Science 256: , 184–185. |
[7] | Neumann H , Takahashi K ((2007) ) Essential role of the microglial triggering receptor expressed on myeloid cells-2 (TREM2) for central nervous tissue immune homeostasis. J Neuroimmunol 184: , 92–99. |
[8] | Ransohoff RM ((2016) ) How neuroinflammation contributes to neurodegeneration. Science 353: , 777–783. |
[9] | Roy A , Roberts I , Norton A , Vyas P ((2009) ) Acute megakaryoblastic leukaemia (AMKL) and transient myeloproliferative disorder (TMD) in Down syndrome: A multi-step model of myeloid leukaemogenesis. Br J Haematol 147: , 3–12. |
[10] | Zipursky A , Thorner P , De Harven E , Christensen H , Doyle J ((1994) ) Myelodysplasia and acute megakaryoblastic leukemia in Down’s syndrome. Leuk Res 18: , 163–171. |
[11] | Slordahl SH , Smeland EB , Holte H , Gronn M , Lie SO , Seip M ((1993) ) Leukemic blasts with markers of four cell lineages in Down’s syndrome (“megakaryoblastic leukemia”). Med Pediatr Oncol 21: , 254–258. |
[12] | James R , Lightfoot T , Simpson J , Moorman AV , Roman E , Kinsey S , Investigators UKCCS ((2008) ) Acute leukemia in children with Down’s syndrome: The importance of population based study. Haematologica 93: , 1262–1263. |
[13] | Bouchon A , Hernandez-Munain C , Cella M , Colonna M ((2001) ) A DAP12-mediated pathway regulates expression of CC chemokine receptor 7 and maturation of human dendritic cells. J Exp Med 194: , 1111–1122. |
[14] | Colonna M ((2003) ) TREMs in the immune system and beyond. Nat Rev Immunol 3: , 445–453. |
[15] | Guerreiro R , Hardy J ((2013) ) TREM2 and neurodegenerative disease. N Engl J Med 369: , 1569–1570. |
[16] | Jonsson T , Stefansson H , Steinberg S , Jonsdottir I , Jonsson PV , Snaedal J , Bjornsson S , Huttenlocher J , Levey AI , Lah JJ , Rujescu D , Hampel H , Giegling I , Andreassen OA , Engedal K , Ulstein I , Djurovic S , Ibrahim-Verbaas C , Hofman A , Ikram MA , van Duijn CM , Thorsteinsdottir U , Kong A , Stefansson K ((2013) ) Variant of TREM2 associated with the risk of Alzheimer’s disease. N Engl J Med 368: , 107–116. |
[17] | Jonsson T , Stefansson K ((2013) ) TREM2 and neurodegenerative disease. N Engl J Med 369: , 1568–1569. |
[18] | Nasu T , Tsukahara Y , Terayama K ((1973) ) A lipid metabolic disease-“membranous lipodystrophy”-an autopsy case demonstrating numerous peculiar membrane-structures composed of compound lipid in bone and bone marrow and various adipose tissues. Acta Pathol Jpn 23: , 539–558. |
[19] | Paloneva J , Manninen T , Christman G , Hovanes K , Mandelin J , Adolfsson R , Bianchin M , Bird T , Miranda R , Salmaggi A , Tranebjaerg L , Konttinen Y , Peltonen L ((2002) ) Mutations in two genes encoding different subunits of a receptor signaling complex result in an identical disease phenotype. Am J Hum Genet 71: , 656–662. |
[20] | Xiang X , Werner G , Bohrmann B , Liesz A , Mazaheri F , Capell A , Feederle R , Knuesel I , Kleinberger G , Haass C ((2016) ) TREM2 deficiency reduces the efficacy of immunotherapeutic amyloid clearance. EMBO Mol Med 8: , 992–1004. |
[21] | Raha AA , Henderson JW , Stott SR , Vuono R , Foscarin S , Friedland RP , Zaman SH , Raha-Chowdhury R ((2016) ) Neuroprotective effect of TREM-2 in aging and Alzheimer’s disease model. J Alzheimers Dis 55: , 199–217. |
[22] | Wang Y , Cella M , Mallinson K , Ulrich JD , Young KL , Robinette ML , Gilfillan S , Krishnan GM , Sudhakar S , Zinselmeyer BH , Holtzman DM , Cirrito JR , Colonna M ((2015) ) TREM2 lipid sensing sustains the microglial response in an Alzheimer’s disease model. Cell 160: , 1061–1071. |
[23] | Yuan P , Condello C , Keene CD , Wang Y , Bird TD , Paul SM , Luo W , Colonna M , Baddeley D , Grutzendler J ((2016) ) TREM2 haplodeficiency in mice and humans impairs the microglia barrier function leading to decreased amyloid compaction and severe axonal dystrophy. Neuron 90: , 724–739. |
[24] | Jay TR , Miller CM , Cheng PJ , Graham LC , Bemiller S , Broihier ML , Xu G , Margevicius D , Karlo JC , Sousa GL , Cotleur AC , Butovsky O , Bekris L , Staugaitis SM , Leverenz JB , Pimplikar SW , Landreth GE , Howell GR , Ransohoff RM , Lamb BT ((2015) ) TREM2 deficiency eliminates TREM2+ inflammatory macrophages and ameliorates pathology in Alzheimer’s disease mouse models. J Exp Med 212: , 287–295. |
[25] | Jay TR , Hirsch AM , Broihier ML , Miller CM , Neilson LE , Ransohoff RM , Lamb BT , Landreth GE ((2017) ) Disease progression-dependent effects of TREM2 deficiency in a mouse model of Alzheimer’s disease. J Neurosci 37: , 637–647. |
[26] | Bain BJ , Lewis SM ((2011) ) Chapter 4. Preparation and staining methods for blood and bone marrow films. In Dacie and Lewis: Practical Haematology, 11th edition, Bain BJ , Bates I , Laffan MA , Lewis SM , eds. Elsevier, pp. 47–59. |
[27] | Raha-Chowdhury R , Williams BJ , Worwood M ((1993) ) Red cell destruction by human monocytes–changes in intracellular ferritin concentration and phenotype. Eur J Haematol 50: , 26–31. |
[28] | Raha AA , Vaishnav RA , Friedland RP , Bomford A , Raha-Chowdhury R ((2013) ) The systemic iron-regulatory proteins hepcidin and ferroportin are reduced in the brain in Alzheimer’s disease. Acta Neuropathol Commun 1: , 55. |
[29] | Wunderlich P , Glebov K , Kemmerling N , Tien NT , Neumann H , Walter J ((2013) ) Sequential proteolytic processing of the triggering receptor expressed on myeloid cells-2 (TREM2) protein by ectodomain shedding and gamma-secretase-dependent intramembranous cleavage. J Biol Chem 288: , 33027–33036. |
[30] | Cantoni C , Bollman B , Licastro D , Xie M , Mikesell R , Schmidt R , Yuede CM , Galimberti D , Olivecrona G , Klein RS , Cross AH , Otero K , Piccio L ((2015) ) TREM2 regulates microglial cell activation in response to demyelination in vivo. Acta Neuropathol 129: , 429–447. |
[31] | Wang Y , Ulland TK , Ulrich JD , Song W , Tzaferis JA , Hole JT , Yuan P , Mahan TE , Shi Y , Gilfillan S , Cella M , Grutzendler J , DeMattos RB , Cirrito JR , Holtzman DM , Colonna M ((2016) ) TREM2-mediated early microglial response limits diffusion and toxicity of amyloid plaques. J Exp Med 213: , 667–675. |
[32] | Humphrey MB , Daws MR , Spusta SC , Niemi EC , Torchia JA , Lanier LL , Seaman WE , Nakamura MC ((2006) ) TREM 2, a DAP12-associated receptor, regulates osteoclast differentiation and function. J Bone Miner Res 21: , 237–245. |
[33] | Corbo RM , Scacchi R , Mureddu L , Mulas G , Alfano G ((1995) ) Apolipoprotein E polymorphism in Italy investigated in native plasma by a simple polyacrylamide gel isoelectric focusing technique. Comparison with frequency data of other European populations. Ann Hum Genet 59: , 197–209. |
[34] | Holland AJ , Hon J , Huppert FA , Stevens F , Watson P ((1998) ) Population-based study of the prevalence and presentation of dementia in adults with Down’s syndrome. Br J Psychiatry 172: , 493–498. |
[35] | Annus T , Wilson LR , Hong YT , Acosta-Cabronero J , Fryer TD , Cardenas-Blanco A , Smith R , Boros I , Coles JP , Aigbirhio FI , Menon DK , Zaman SH , Nestor PJ , Holland AJ ((2016) ) The pattern of amyloid accumulation in the brains of adults with Down syndrome. Alzheimers Dement 12: , 538–545. |
[36] | Haier RJ , Head K , Head E , Lott IT ((2008) ) Neuroimaging of individuals with Down’s syndrome at-risk for dementia: Evidence for possible compensatory events. Neuroimage 39: , 1324–1332. |
[37] | Zigman WB , Lott IT ((2007) ) Alzheimer’s disease in Down syndrome: Neurobiology and risk. Ment Retard Dev Disabil Res Rev 13: , 237–246. |
[38] | Cole JH , Annus T , Wilson LR , Remtulla R , Hong YT , Fryer TD , Acosta-Cabronero J , Cardenas-Blanco A , Smith R , Menon DK , Zaman SH , Nestor PJ , Holland AJ ((2017) ) Brain-predicted age in Down syndrome is associated with beta amyloid deposition and cognitive decline. Neurobiol Aging 56: , 41–49. |
[39] | Annus T , Wilson LR , Acosta-Cabronero J , Cardenas-Blanco A , Hong YT , Fryer TD , Coles JP , Menon DK , Zaman SH , Holland AJ , Nestor PJ ((2017) ) The Down syndrome brain in the presence and absence of fibrillar beta-amyloidosis. Neurobiol Aging 53: , 11–19. |
[40] | Goldgaber D , Lerman MI , McBride OW , Saffiotti U , Gajdusek DC ((1987) ) Characterization and chromosomal localization of a cDNA encoding brain amyloid of Alzheimer’s disease. Science 235: , 877–880. |
[41] | Tanzi RE , Bird ED , Latt SA , Neve RL ((1987) ) The amyloid beta protein gene is not duplicated in brains from patients with Alzheimer’s disease. Science 238: , 666–669. |
[42] | Cuadrado E , Barrena MJ ((1996) ) Immune dysfunction in Down’s syndrome: Primary immune deficiency or early senescence of the immune system? Clin Immunol Immunopathol 78: , 209–214. |
[43] | McLean S , McHale C , Enright H ((2009) ) Hematological abnormalities in adult patients with Down’s syndrome. Ir J Med Sci 178: , 35–38. |
[44] | Tanzi RE ((2015) ) TREM2 and risk of Alzheimer’s disease–friend or foe? N Engl J Med 372: , 2564–2565. |
[45] | Frank S , Burbach GJ , Bonin M , Walter M , Streit W , Bechmann I , Deller T ((2008) ) TREM2 is upregulated in amyloid plaque-associated microglia in aged APP23 transgenic mice. Glia 56: , 1438–1447. |
[46] | Kiialainen A , Hovanes K , Paloneva J , Kopra O , Peltonen L ((2005) ) Dap12 and Trem2, molecules involved in innate immunity and neurodegeneration, are co-expressed in the CNS. Neurobiol Dis 18: , 314–322. |
[47] | Jay TR , von Saucken VE , Landreth GE ((2017) ) TREM2 in neurodegenerative diseases. Mol Neurodegener 12: , 56. |
[48] | Suarez-Calvet M , Araque Caballero MA , Kleinberger G , Bateman RJ , Fagan AM , Morris JC , Levin J , Danek A , Ewers M , Haass C , Dominantly Inherited Alzheimer Network ((2016) ) Early changes in CSF sTREM2 in dominantly inherited Alzheimer’s disease occur after amyloid deposition and neuronal injury. Sci Transl Med 8: , 369ra178. |
[49] | Suarez-Calvet M , Kleinberger G , Araque Caballero MA , Brendel M , Rominger A , Alcolea D , Fortea J , Lleo A , Blesa R , Gispert JD , Sanchez-Valle R , Antonell A , Rami L , Molinuevo JL , Brosseron F , Traschutz A , Heneka MT , Struyfs H , Engelborghs S , Sleegers K , Van Broeckhoven C , Zetterberg H , Nellgard B , Blennow K , Crispin A , Ewers M , Haass C ((2016) ) sTREM2 cerebrospinal fluid levels are a potential biomarker for microglia activity in early-stage Alzheimer’s disease and associate with neuronal injury markers. EMBO Mol Med 8: , 466–476. |
[50] | Ulrich JD , Ulland TK , Colonna M , Holtzman DM ((2017) ) Elucidating the role of TREM2 in Alzheimer’s disease. Neuron 94: , 237–248. |
[51] | Colonna M , Wang Y ((2016) ) TREM2 variants: New keys to decipher Alzheimer disease pathogenesis. Nat Rev Neurosci 17: , 201–207. |
[52] | Jiang T , Zhang YD , Chen Q , Gao Q , Zhu XC , Zhou JS , Shi JQ , Lu H , Tan L , Yu JT ((2016) ) TREM2 modifies microglial phenotype and provides neuroprotection in P301S tau transgenic mice. Neuropharmacology 105: , 196–206. |
[53] | Ulrich JD , Finn MB , Wang Y , Shen A , Mahan TE , Jiang H , Stewart FR , Piccio L , Colonna M , Holtzman DM ((2014) ) Altered microglial response to Abeta plaques in APPPS1-21 mice heterozygous for TREM2. Mol Neurodegener 9: , 20. |
[54] | Sasaki A , Kakita A , Yoshida K , Konno T , Ikeuchi T , Hayashi S , Matsuo H , Shioda K ((2015) ) Variable expression of microglial DAP12 and TREM2 genes in Nasu-Hakola disease. Neurogenetics 16: , 265–276. |
[55] | Bianchin MM , Capella HM , Chaves DL , Steindel M , Grisard EC , Ganev GG , da Silva Junior JP , Neto Evaldo S , Poffo MA , Walz R , Carlotti Junior CG , Sakamoto AC ((2004) ) Nasu-Hakola disease (polycystic lipomembranous osteodysplasia with sclerosing leukoencephalopathy–PLOSL): A dementia associated with bone cystic lesions. From clinical to genetic and molecular aspects. Cell Mol Neurobiol 24: , 1–24. |
[56] | Wisniewski KE , Schmidt-Sidor B ((1989) ) Postnatal delay of myelin formation in brains from Down syndrome infants and children. Clin Neuropathol 8: , 55–62. |
[57] | Engelhardt B ((2008) ) The blood-central nervous system barriers actively control immune cell entry into the central nervous system. Curr Pharm Des 14: , 1555–1565. |
[58] | Raha AA , Bomford A , Raha-Chowdhury R ((2013) ) Hepcidin and ferroportin participate in iron clearance from brain endothelium: Failure of this process leads to iron accumulation in Alzheimer’s disease. Am J Hematol 88: , E156–E156. |
[59] | Town T , Nikolic V , Tan J ((2005) ) The microglial “activation” continuum: From innate to adaptive responses. J Neuroinflammation 2: , 24. |
[60] | Schwartz M , Kipnis J ((2005) ) Protective autoimmunity and neuroprotection in inflammatory and noninflammatory neurodegenerative diseases. J Neurol Sci 233: , 163–166. |
[61] | Guillot-Sestier MV , Doty KR , Town T ((2015) ) Innate immunity fights Alzheimer’s disease. Trends Neurosci 38: , 674–681. |
[62] | Keren-Shaul H , Spinrad A , Weiner A , Matcovitch-Natan O , Dvir-Szternfeld R , Ulland TK , David E , Baruch K , Lara-Astaiso D , Toth B , Itzkovitz S , Colonna M , Schwartz M , Amit I ((2017) ) A unique microglia type associated with restricting development of Alzheimer’s disease. Cell 169: , 1276–1290 e1217. |
[63] | Atagi Y , Liu CC , Painter MM , Chen XF , Verbeeck C , Zheng H , Li X , Rademakers R , Kang SS , Xu H , Younkin S , Das P , Fryer JD , Bu G ((2015) ) Apolipoprotein E is a ligand for triggering receptor expressed on myeloid cells 2 (TREM2). J Biol Chem 290: , 26043–26050. |
[64] | Corder EH , Saunders AM , Strittmatter WJ , Schmechel DE , Gaskell PC , Small GW , Roses AD , Haines JL , Pericak-Vance MA ((1993) ) Gene dose of apolipoprotein E type 4 allele and the risk of Alzheimer’s disease in late onset families. Science 261: , 921–923. |
[65] | Royston MC , Mann D , Pickering-Brown S , Owen F , Perry R , Raghavan R , Khin-Nu C , Tyrer S , Day K , Crook R , et al. ((1994) ) Apolipoprotein E epsilon 2 allele promotes longevity and protects patients with Down’s syndrome from dementia. Neuroreport 5: , 2583–2585. |
[66] | Rubinsztein DC , Hon J , Stevens F , Pyrah I , Tysoe C , Huppert FA , Easton DF , Holland AJ ((1999) ) Apo E genotypes and risk of dementia in Down syndrome. Am J Med Genet 88: , 344–347. |
[67] | Hardy J , Allsop D ((1991) ) Amyloid deposition as the central event in the aetiology of Alzheimer’s disease. Trends Pharmacol Sci 12: , 383–388. |
[68] | Hardy J , Selkoe DJ ((2002) ) The amyloid hypothesis of Alzheimer’s disease: Progress and problems on the road to therapeutics. Science 297: , 353–356. |


