
A Selection of Important Genes and Their Correlated Behavior in Alzheimer’s Disease
Abstract
In 2017, approximately 5 million Americans were living with Alzheimer’s disease (AD), and it is estimated that by 2050 this number could increase to 16 million. In this study, we apply mathematical optimization to approach microarray analysis to detect differentially expressed genes and determine the most correlated structure among their expression changes. The analysis of GSE4757 microarray dataset, which compares expression between AD neurons without neurofibrillary tangles (controls) and with neurofibrillary tangles (cases), was casted as a multiple criteria optimization (MCO) problem. Through the analysis it was possible to determine a series of Pareto efficient frontiers to find the most differentially expressed genes, which are here proposed as potential AD biomarkers. The Traveling Sales Problem (TSP) model was used to find the cyclical path of maximal correlation between the expression changes among the genes deemed important from the previous stage. This leads to a structure capable of guiding biological exploration with enhanced precision and repeatability. Ten genes were selected (FTL, GFAP, HNRNPA3, COX1, ND2, ND3, ND4, NUCKS1, RPL41, and RPS10) and their most correlated cyclic structure was found in our analyses. The biological functions of their products were found to be linked to inflammation and neurodegenerative diseases and some of them had not been reported for AD before. The TSP path connects genes coding for mitochondrial electron transfer proteins. Some of these proteins are closely related to other electron transport proteins already reported as important for AD.
INTRODUCTION
Alzheimer’s disease (AD) is a degenerative brain disease which commonly causes dementia [1]. Age is the greatest risk factor for AD, with most patients being 65 years old or older. AD is characterized by pathological aggregates of amyloid-β protein (Aβ) and neurofibrillary tangles (NFTs) form by aggregates of hyperphosphorylated tau protein [2]. Aβ is believed to contribute to cell death by interfering with the neuron-neuron communication, while NFTs block the transport of nutrients inside the neurons. It is estimated that by 2050, 16 million people will suffer from AD in the United States [1]. Thus, there is a need to establish new biomarkers and understand how they interact to help in the characterization, diagnosis of disease progression, and identification of new drug targets.
To search for new genes that change their expression in the presence of NFTs, we advocate the use of mathematical optimization methods to analyze available microarray data, as we have done in previous works related to the study of cancer [3–5]. High throughput biological experiments, like microarrays, have been used to detect potential AD biomarkers maintaining the issue of selecting genes for normalization and parameters for the analysis as reviewed in Cooper-Knock et al. [6]. The optimization-driven method presented here differs from many of the commonly used informatics-based and statistics-based analysis methods in that it does not require any parameter adjustment by the user nor any normalization procedure, as described in Camacho-Caceres et al. and Lorenzo et al. [5, 7].
This work discusses the detection of genes that change their expression the most in the presence of NFTs in AD, using publicly available microarray data first reported by Dunckley et al. [8] and proposes a possible signaling path among them. The identification of potential AD biomarkers from microarray data is casted as a multiple criteria optimization (MCO) problem. The aim of an MCO problem is to find the best compromises between two or more conflicting criteria. Formally, the solutions with the best compromises are located in the Pareto efficient frontier of the set of candidates evaluated in all criteria of interest (also called performance measures in this work). We propose that the genes of the efficient frontier in the present analyses, built with performance measures related to changes in gene expression, are potential AD biomarkers. It is our premise that the changes in expression of these important genes are correlated, that is, that there is a signal among them. We have proposed that this signal can be modeled as a cyclical correlation path, the elicitation of which constitutes a highly combinatorial optimization problem. In Mathematics, and particularly in the field of Operations Research, this problem is called the Traveling Salesman Problem (TSP). This study attempts the characterization of the signaling path in AD using the well-known TSP combinatorial optimization formulation [9] as was first used in our paper by Lorenzo et al. [7], in the context of cervix cancer.
In this work, the analysis of the AD microarray dataset first reported by Dunckley et al. [8] was modeled as an MCO problem and the correlation between the expression changes was modeled using the TSP formulation. The results from the MCO problem were validated through scientific literature and were used as the input for the TSP. The TSP path provides correlations that have not been reported yet, but that are biological plausible thereby offering new research opportunities.
METHODS
Alzheimer’s disease dataset
The microarray dataset GSE4757 reported by Dunckley et al. [8] was used for the analysis. The dataset consists of samples from ten patients, taken from the entorhinal cortex. From each patient, there was a sample of neurons with NFTs (cases) and one of neurons without NFTs (controls). The microarray platform, GPL570, has a total of 54,675 probes.
Identification of potential AD biomarkers from microarray data is casted as an MCO problem, and their correlation modeled through the TSP
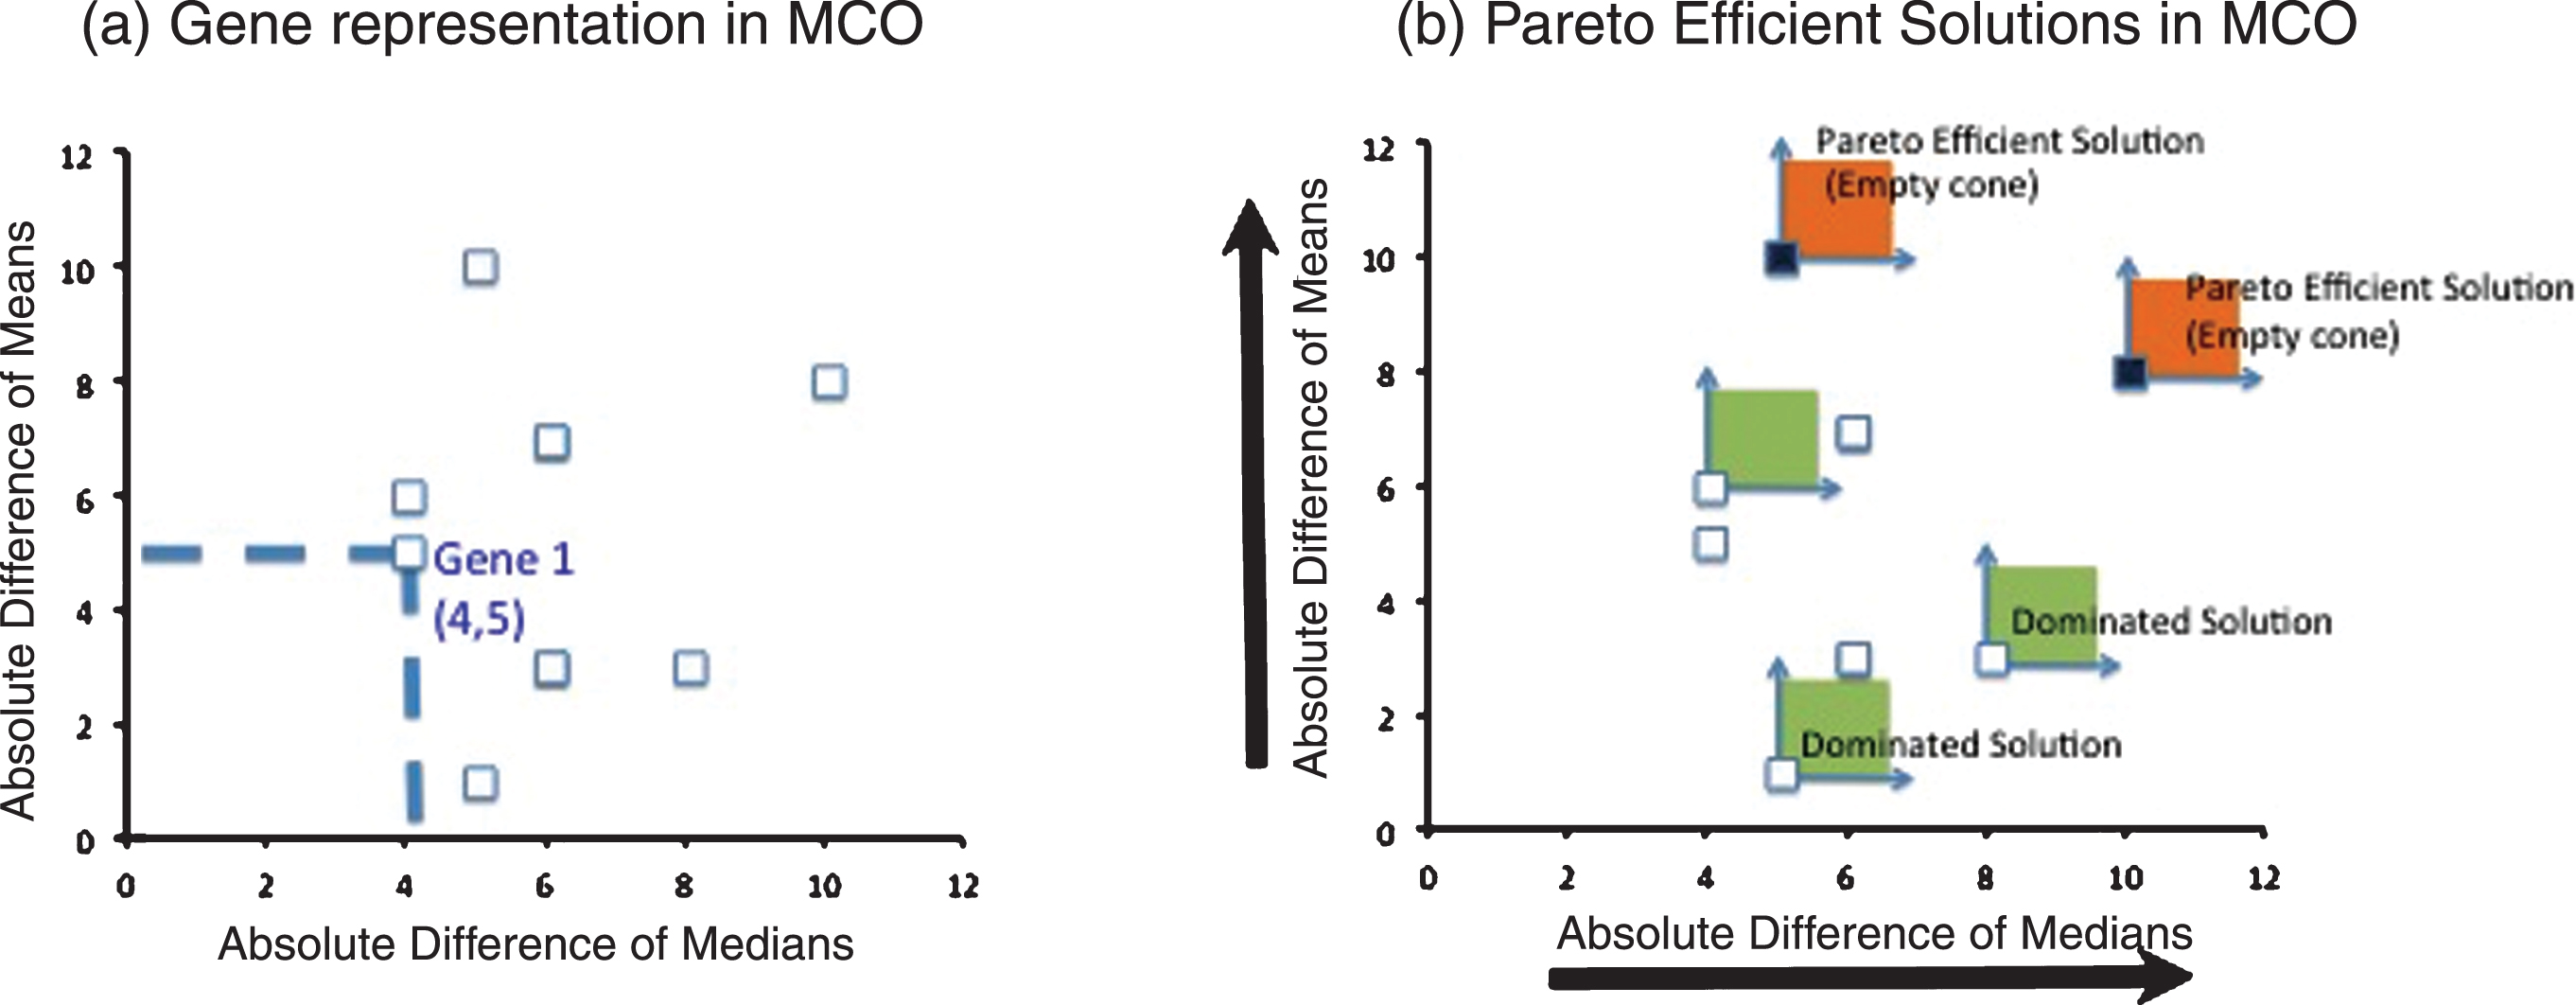
The procedure to select the genes of interest through MCO is explained in detail Camacho-Caceres et al. [5]. In brief, MCO will select a family of solutions (genes in this case) that have the best compromises between the performances measures considered in the analysis. The performance measures that were considered in this case were: 1) the absolute value of the difference in gene expression of the group medians and 2) the absolute value of the difference in gene expression of the group means. The solution to the MCO problem is called the Pareto– efficient frontier, which in turn contains efficient solutions, as depicted in Fig. 1. The reader interested in MCO is referred to [5] for a detailed and illustrated explanation of the procedure.
Fig.1
(a) MCO representation: Each gene under analysis is represented by two performance measures to be maximized, in this case, the absolute difference of medians and the absolute difference of means (b) MCO Solution: the maximization directions help to form a cone that originates on a particular gene to be evaluated. If this cone is empty (it does not contain another gene), then the gene is a Pareto Efficient solution. Otherwise, the gene is a dominated solution and therefore not Pareto Efficient.
In order to find how the gene expression changes were related in the genes identified through MCO, the relationship between each pair of genes was modeled as linear statistical correlation. The basic correlation formula denoted as ρXY and between random variables X and Y is [10]:
The correlation between X and Y could be zero, positive or negative and is bounded as follows:
Because correlation values range from – 1 to 1, stronger correlations occur when their absolutevalues are closer to 1. If each gene is represented through a node in a graph, then the undirected arc joining a pair of genes can contain their absolute correlation value. This representation is shown in Fig. 2. Finding the most correlated cyclic path is a combinatorial optimization endeavor best described through the TSP formulation. In Fig. 2, the optimal solution to the TSP is the cyclic tour that visits each gene (node) just once to result in the largest sum of absolute pairwise correlations. Enumerating all possible cyclic tours would entail listing (n-1)! solutions, which is an instance of exponential growth. For example, for as little as 10 genes, there would be (10-1)! = 362,880 possible solutions. With only one more gene, this amounts to more than 3.6 million possible solutions. In our method, we solve the TSP to optimality capitalizing in the shortlist provided by the first part of the analysis, the MCO procedure. A Matlab code aided by the branch-and-bound exact method was used to this end, and can be found in [5] with the Matlab functions detailed in [11]. The MCO procedure in our case identified 10 genes shown in Table 1, and the most correlated cyclical path between the changes in their expression was approached as a TSP, as presented in Fig. 4.
Fig.2
(a) TSP Initial Setup: in this graph, the nodes represent genes and the undirected arcs represent correlation between each pair of nodes. Each arc contains the absolute value of the correlation between the gene expression changes of the genes at its extremes (b) TSP Solution: the cyclic correlation path with the largest sum of absolute correlations, in this case those assigned to pairs (1,2)-(2,5)-(5,3)-(3,4)-(4,1).
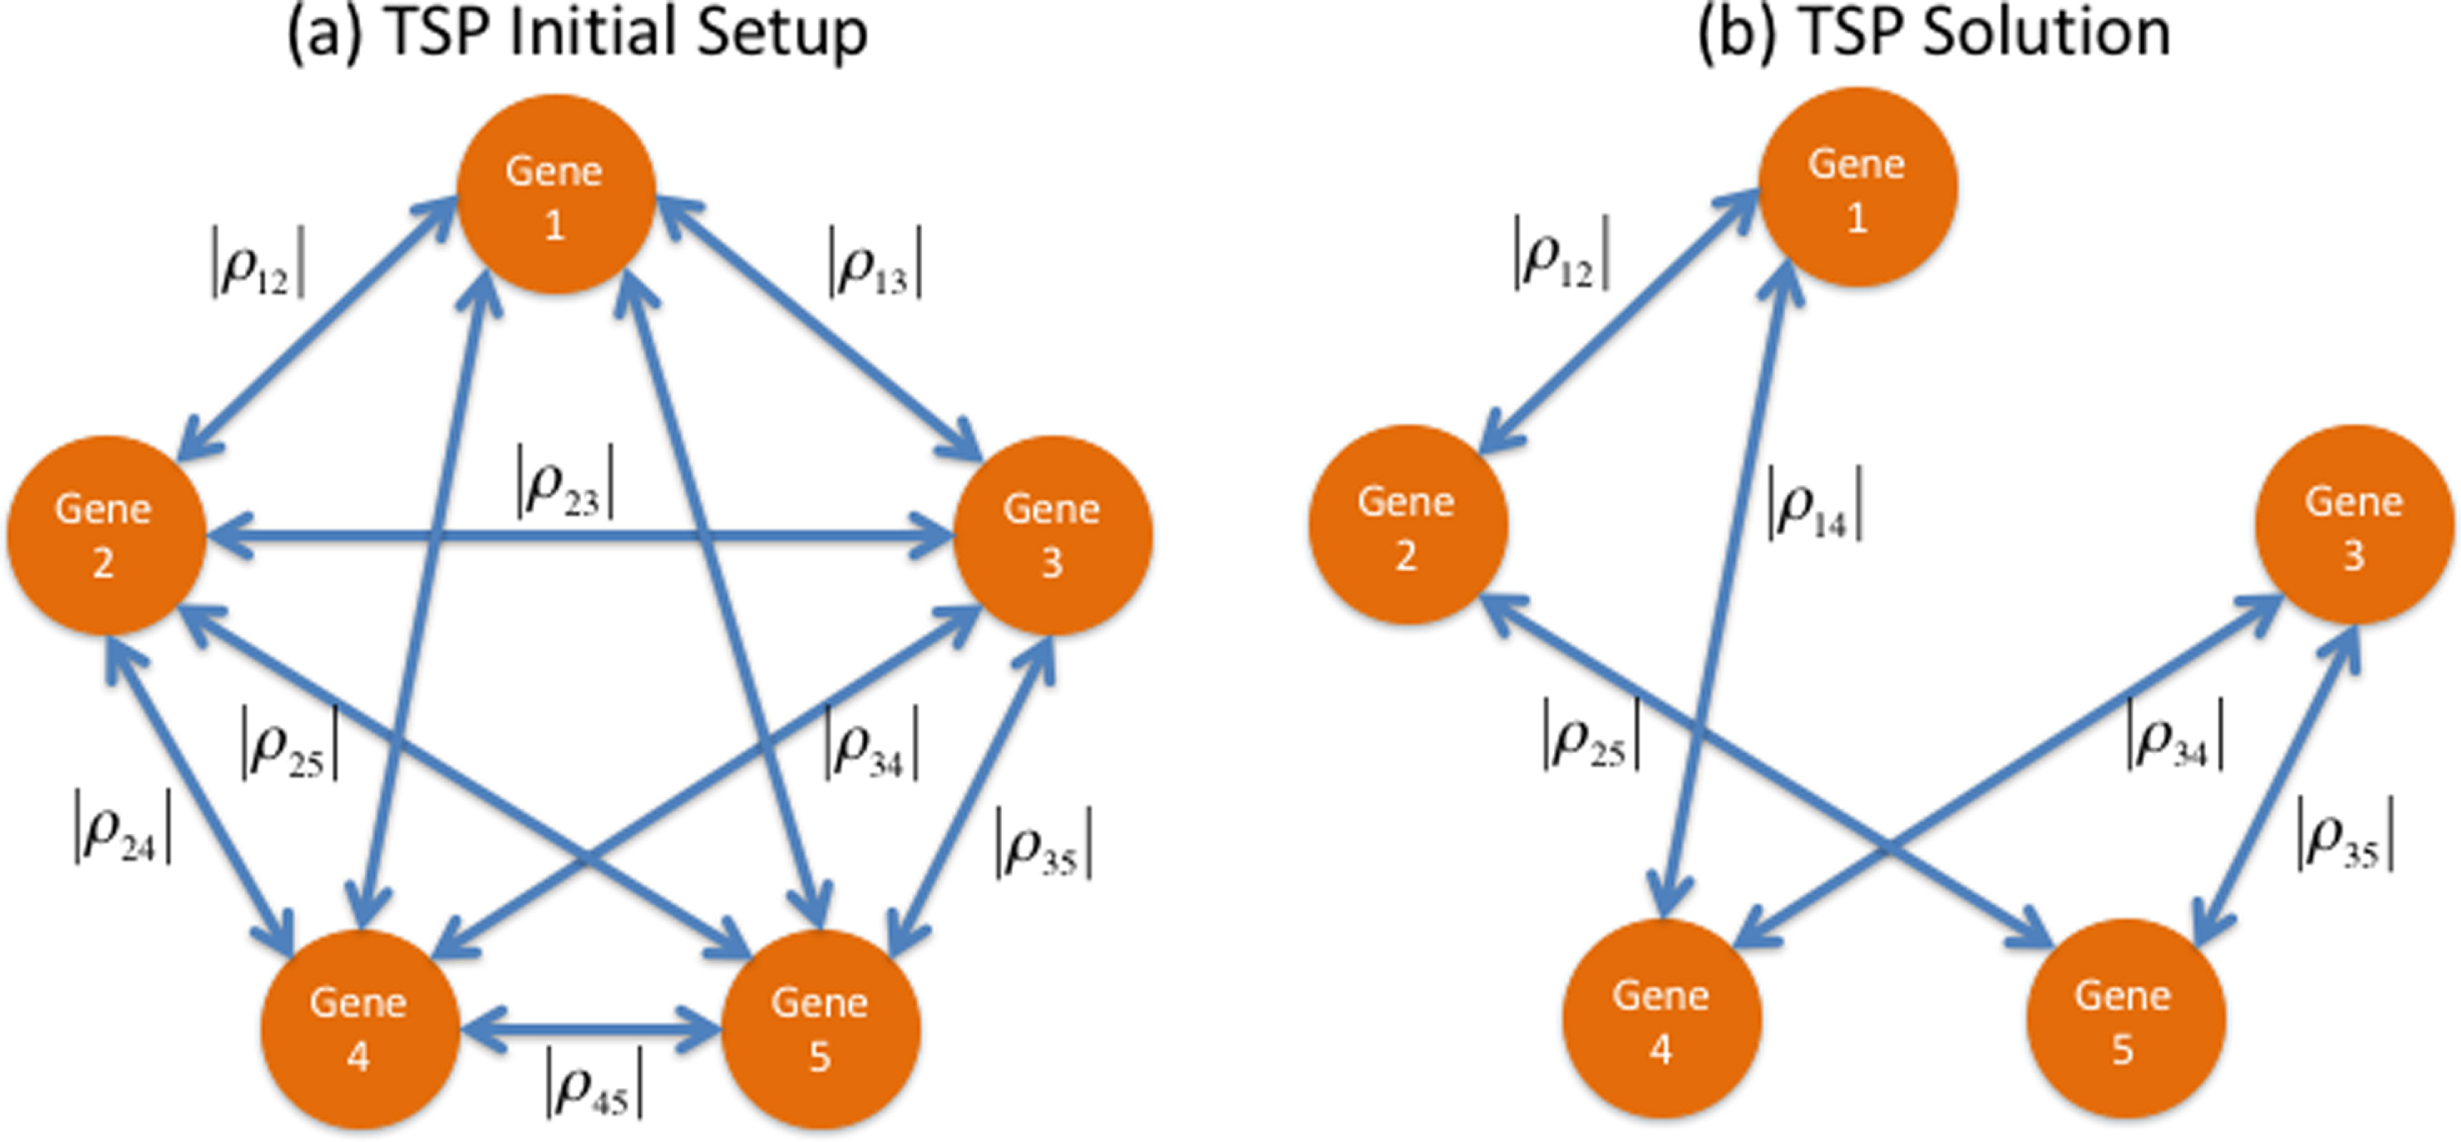
Table 1
List of 10 potential biomarkers identified in the first 3 frontiers through the MCO problem
| Accession Number | Identifier |
|---|---|
| 1553551_s_at | ND2 |
| 1553538_s_at | COX1 |
| 224373_s_at | ND4, Hnrnpm, DCAF6 |
| 1555653_at | HNRNPA3 |
| 1553588_at | ND3, SH3KBP1 |
| 201492_s_at | RPL41 |
| 212788_x_at | FTL |
| 203540_at | GFAP |
| 200095_x_at | RPS10 |
| 229353_s_at | NUCKS1 |
RESULTS
The analysis of the GSE4757 dataset [8] as an MCO problem produced a list of 10 genes from the first 3 frontiers that are listed in Table 1. Analyzing thousands of genes to converge to a shortlist of 10 without setting any procedure parameter evidences some of the qualities of the MCO method.
The computations of the correlations were carried out in a pairwise manner and the results are presented in the correlation matrix in Fig. 3. Their absolute values allow assessing how strong these correlations are in a scale from 0 (not correlated) to 1 (perfectly linearly correlated). Out of the 10 potential biomarkers, the two expression changes most correlated were those of COX1 and ND2. COX1 expression changes correlates with four biomarkers while ND2 correlates with three biomarkers. Fig. 4 shows the result of modeling the expression changes of the selected genes as a TSP. Table 2 and Fig. 5 summarize the biological processes and chromosomal location of the 10 genes selected by the MCO analysis.
Fig.3
Correlation matrix indicating how strong the correlations between the expression changes for the 10 potential biomarkers are. Values close to 1 indicates strong correlations, the strength decreases as the correlation coefficient does.
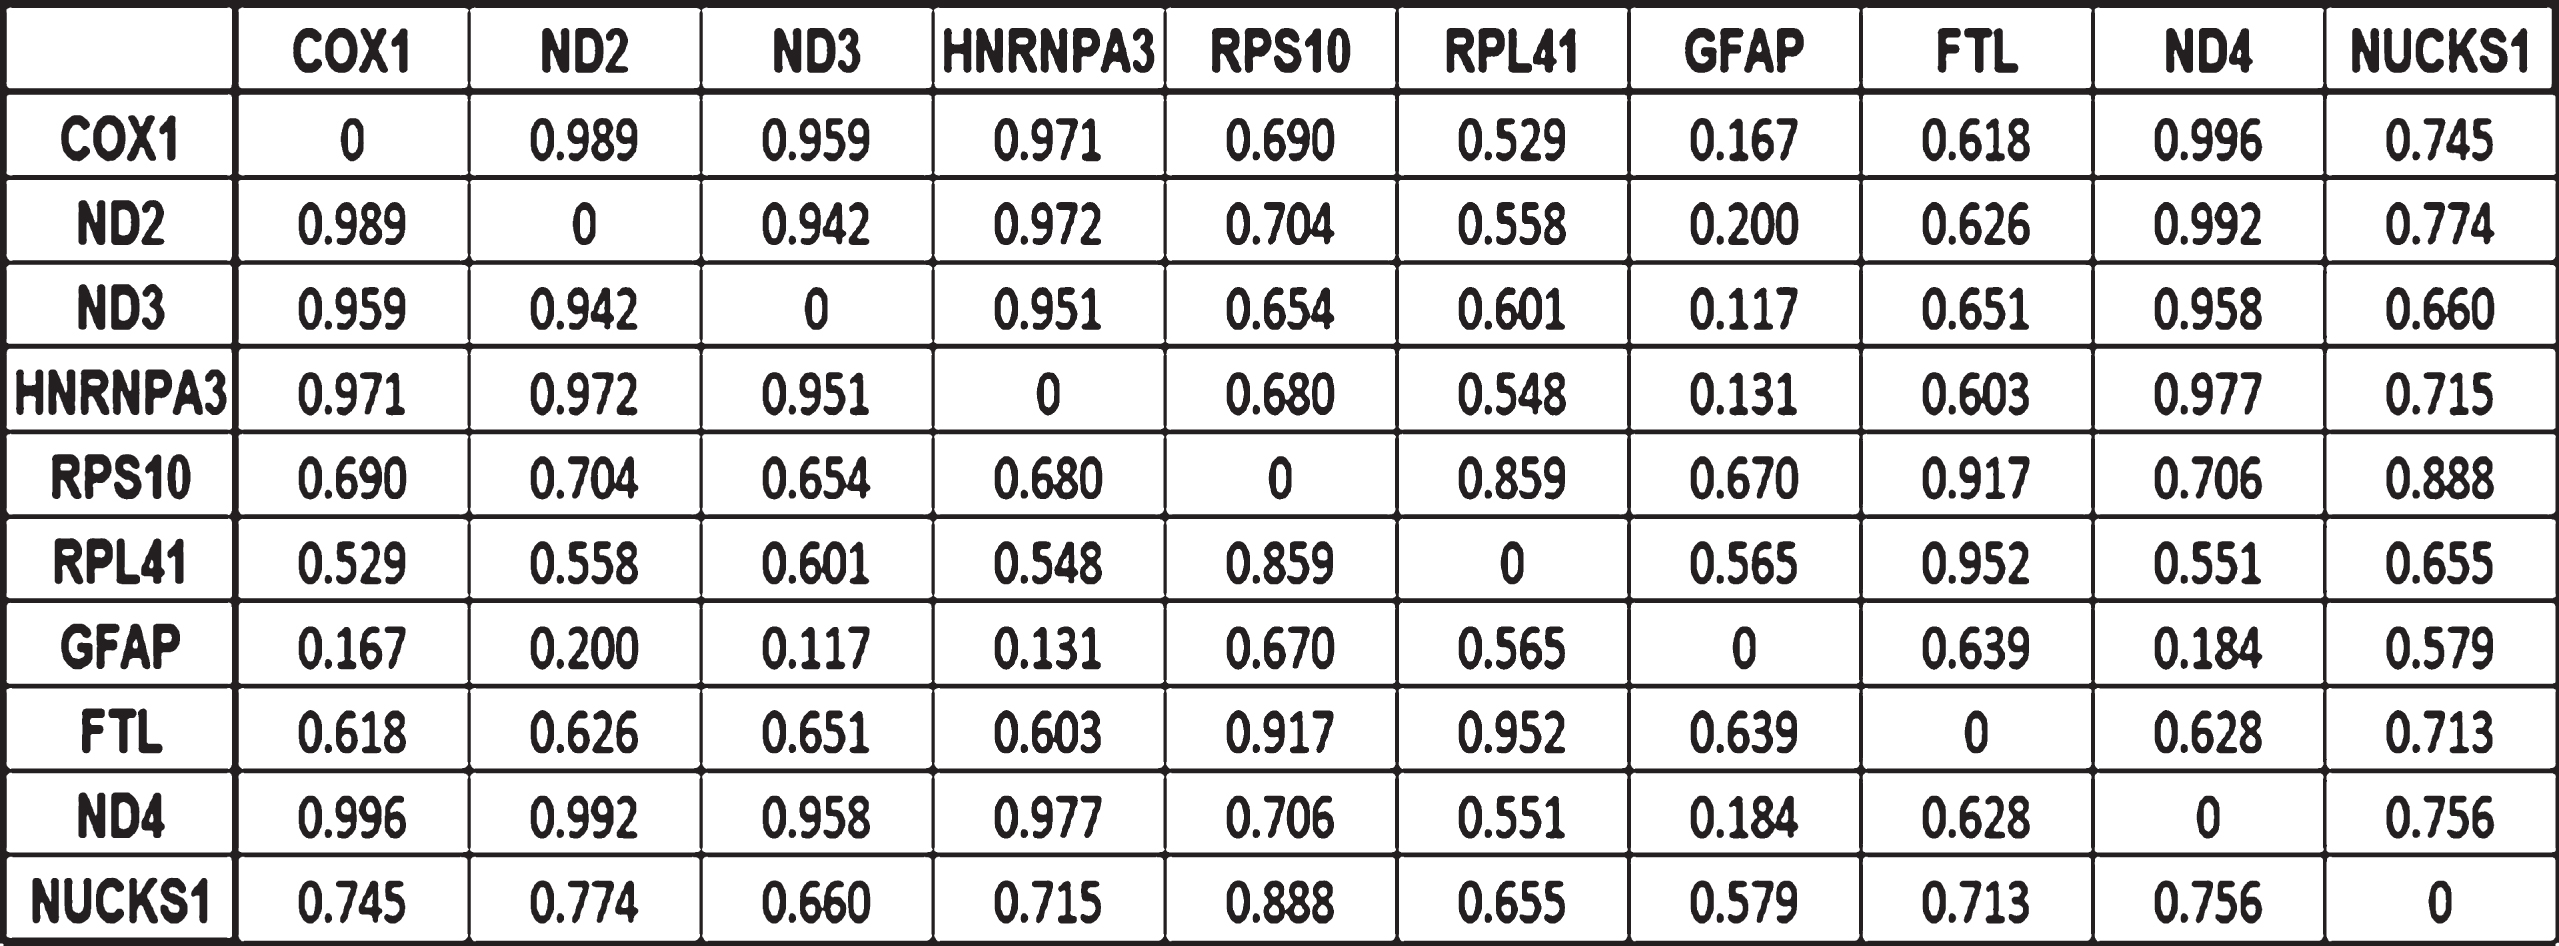
Fig.4
Gene coordinated behavior pathway as determined by the Traveling Sales Problem solution.
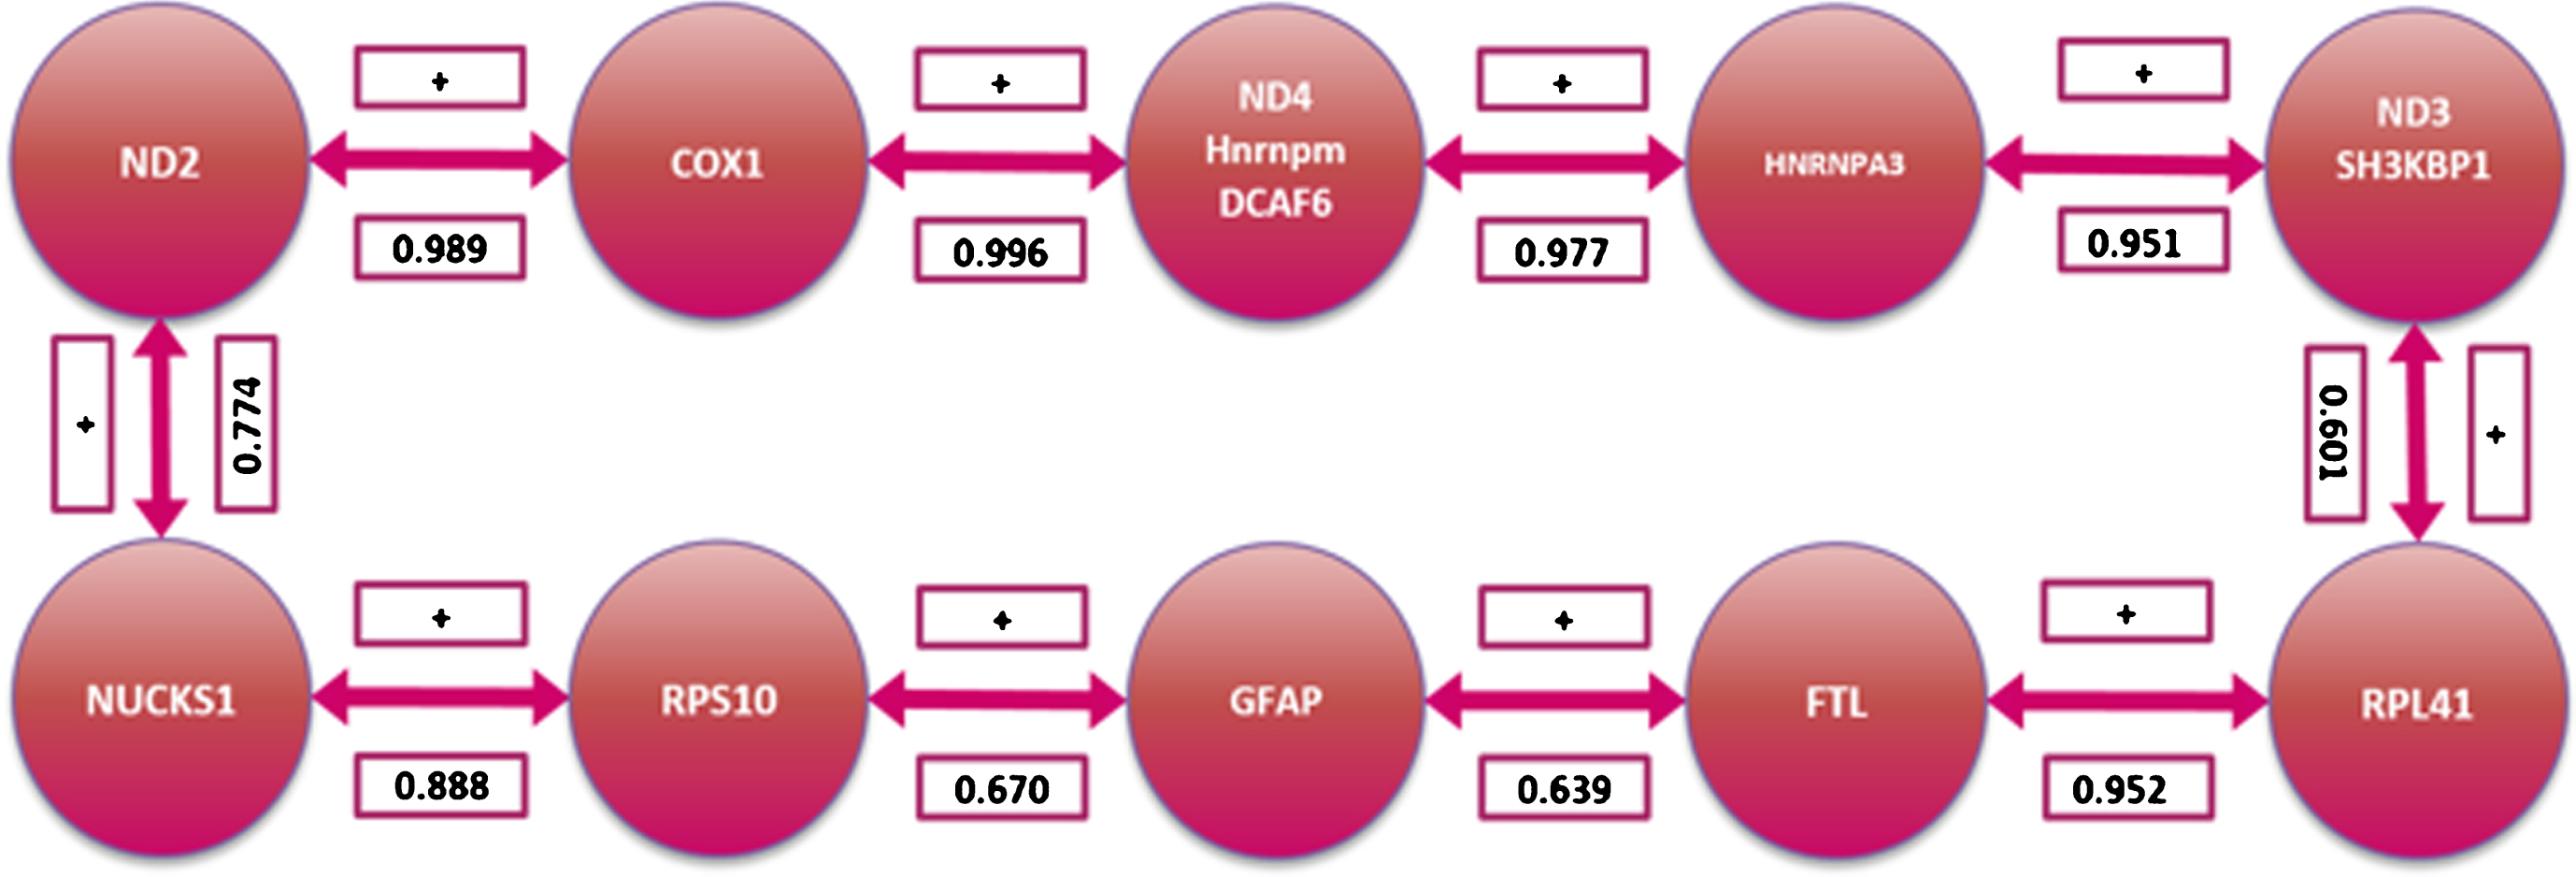
Fig.5
Cellular localization of the selected genes’ protein products
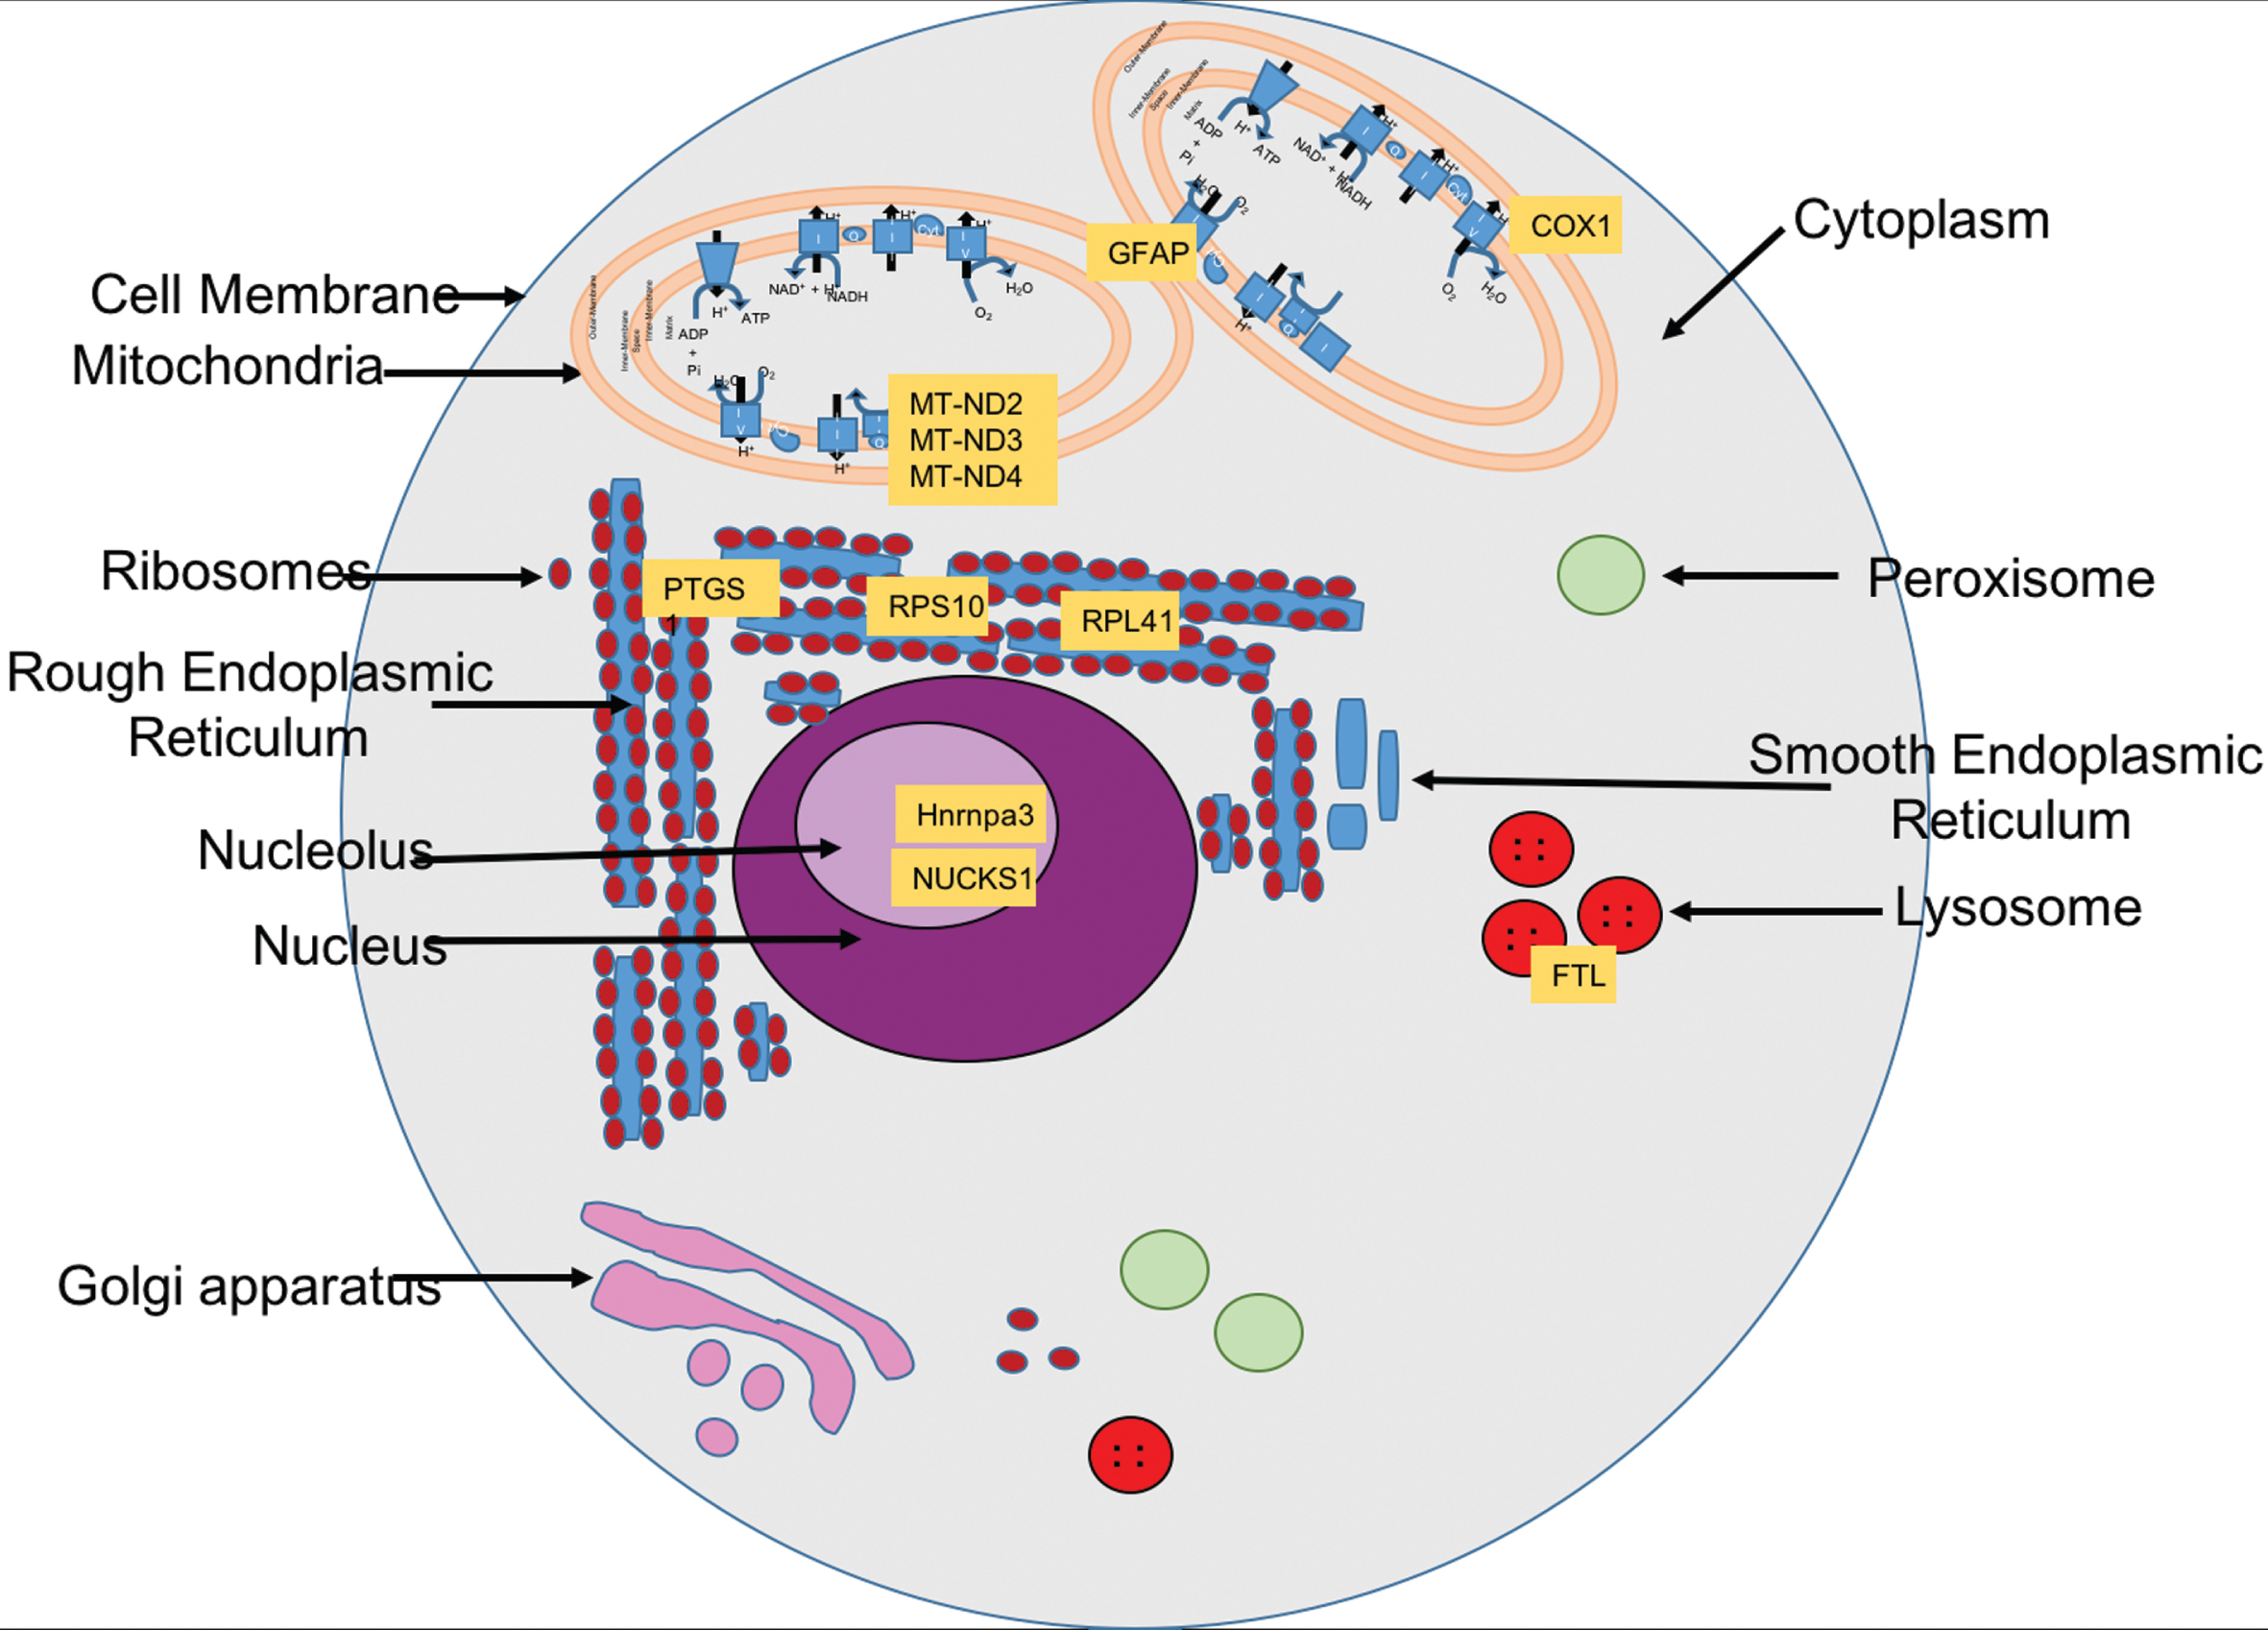
Table 2
Biological processes, chromosomal location, and subcellular location of the 10 genes identified by the MCO and TSP method
| Gene name | Abbreviation | Biological Process | Subcellular location | Chromosomal location | Literature Review Expression | Expression due to our model | Reference |
|---|---|---|---|---|---|---|---|
| Ferritin light chain | FTL | iron homeostasis; neutrophil degranulation | cytosol, lysosome, extracellular exosome | 19q13.33 | Underexpression | overexpression | Uniprot [91] |
| Glial fibrillary acidic protein | GFAP | cytoskeletal organization, response to wounding, negative regulation of neuron projection development | cytoskeleton, cytosol, mitochondrion | 17q21.31 | Overexpression | overexpression | Gencards [92] |
| Heterogenous nuclear ribonucleoprotein A3 | HNRNPA3 | mRNA splicing, mRNA transport, RNA metabolic process | nucleus, cytosol | 2q31.2 | Underexpression | overexpression | Uniprot [93] |
| Cytochrome C oxidase subunit 1 | COX1 | aerobic respiration, aging, cerebellum development, response to electrical stimulus and oxidative stress | mitochondrion | 9q32-33.3 | Overexpression | overexpression | Uniprot [94] |
| NADH Ubiquinone oxidoreductase chain 2 | ND2 | receptor binding, reactive oxygen species metabolic process | mitochondrion inner membrane | Overexpression | overexpression | Uniprot | |
| NADH Uniquinone oxidoreductase chain 3 | ND3, SH3KBP1 | cellular response to glucocorticoid stimulus; oxidoreductase process, response to light intensity | mitochondrion inner membrane | 10p22.12 | Overexpression | overexpression | Uniprot [95, 96] |
| NADH Ubiquinone oxidoreductase chain 4 | ND4, DCAF6, hnnnrnp | aging, cerebellum process, mitochondrial electron transport | mitochondrion inner membrane | 1q24.2 | Overexpression | overexpression | Uniprot |
| Nuclear ubiquitine casein and cyclin dependent kinase substrate 1 | NUCKS1 | cellular glucose homeostasis, regulation of insulin receptor and regulation of viral transcription | nucleus | 1q32.1 | overexpression | overexpression | Uniprot [97] |
| 60S ribosomal protein 41 | RPL41 | rRNA processing, translation, viral transcription | cytosol | 12q13.2 | overexpression | overexpression | Uniprot, Genecards [98] |
| 40S ribosomal protein S10 | RPS10 | ribosomal small subunit | |||||
| assembly, rRNA processing, viral transcription | nucleus | 6p21.31 | overexpression | overexpression | Uniprot |
DISCUSSION
The solution genes were grouped by function and their position in the TSP for the following discussion.
Mitochondrial dysfunction linked with AD pathogenesis
Mitochondrial dysfunction is known to be related to AD pathogenesis, but the relationship is still poorly understood [12]. Out of the 10 biomarkers identified by the analysis described in this work, four are related to the mitochondria function: MT-ND2, MT-ND4, COX1, and MT-ND3. Figure 6 shows the location of the genes identified with mitochondria dysregulation. These genes’ expressions have been reported to change in AD [13]. The genes found by the analysis will be discussed starting with MT-ND2 and will follow the TSP path in Fig. 4. MT-ND2 codes for the mitochondrial encoded NADH Dehydrogenase 2. Its product is part of the Complex I mitochondrial membrane respiratory chain NADH dehydrogenase. There are conflicting reports about the role of this gene in AD. Mutations in this gene have been observed in AD brains [14], but a later report concluded that the mutation was not specifically associated with AD [15]. Supporting MT-ND2 possible relation to AD, Drosophila MT-ND2 mutants show progressive neurodegeneration [16]. The results from our analysis support the role of MT-ND2 expression changein AD.
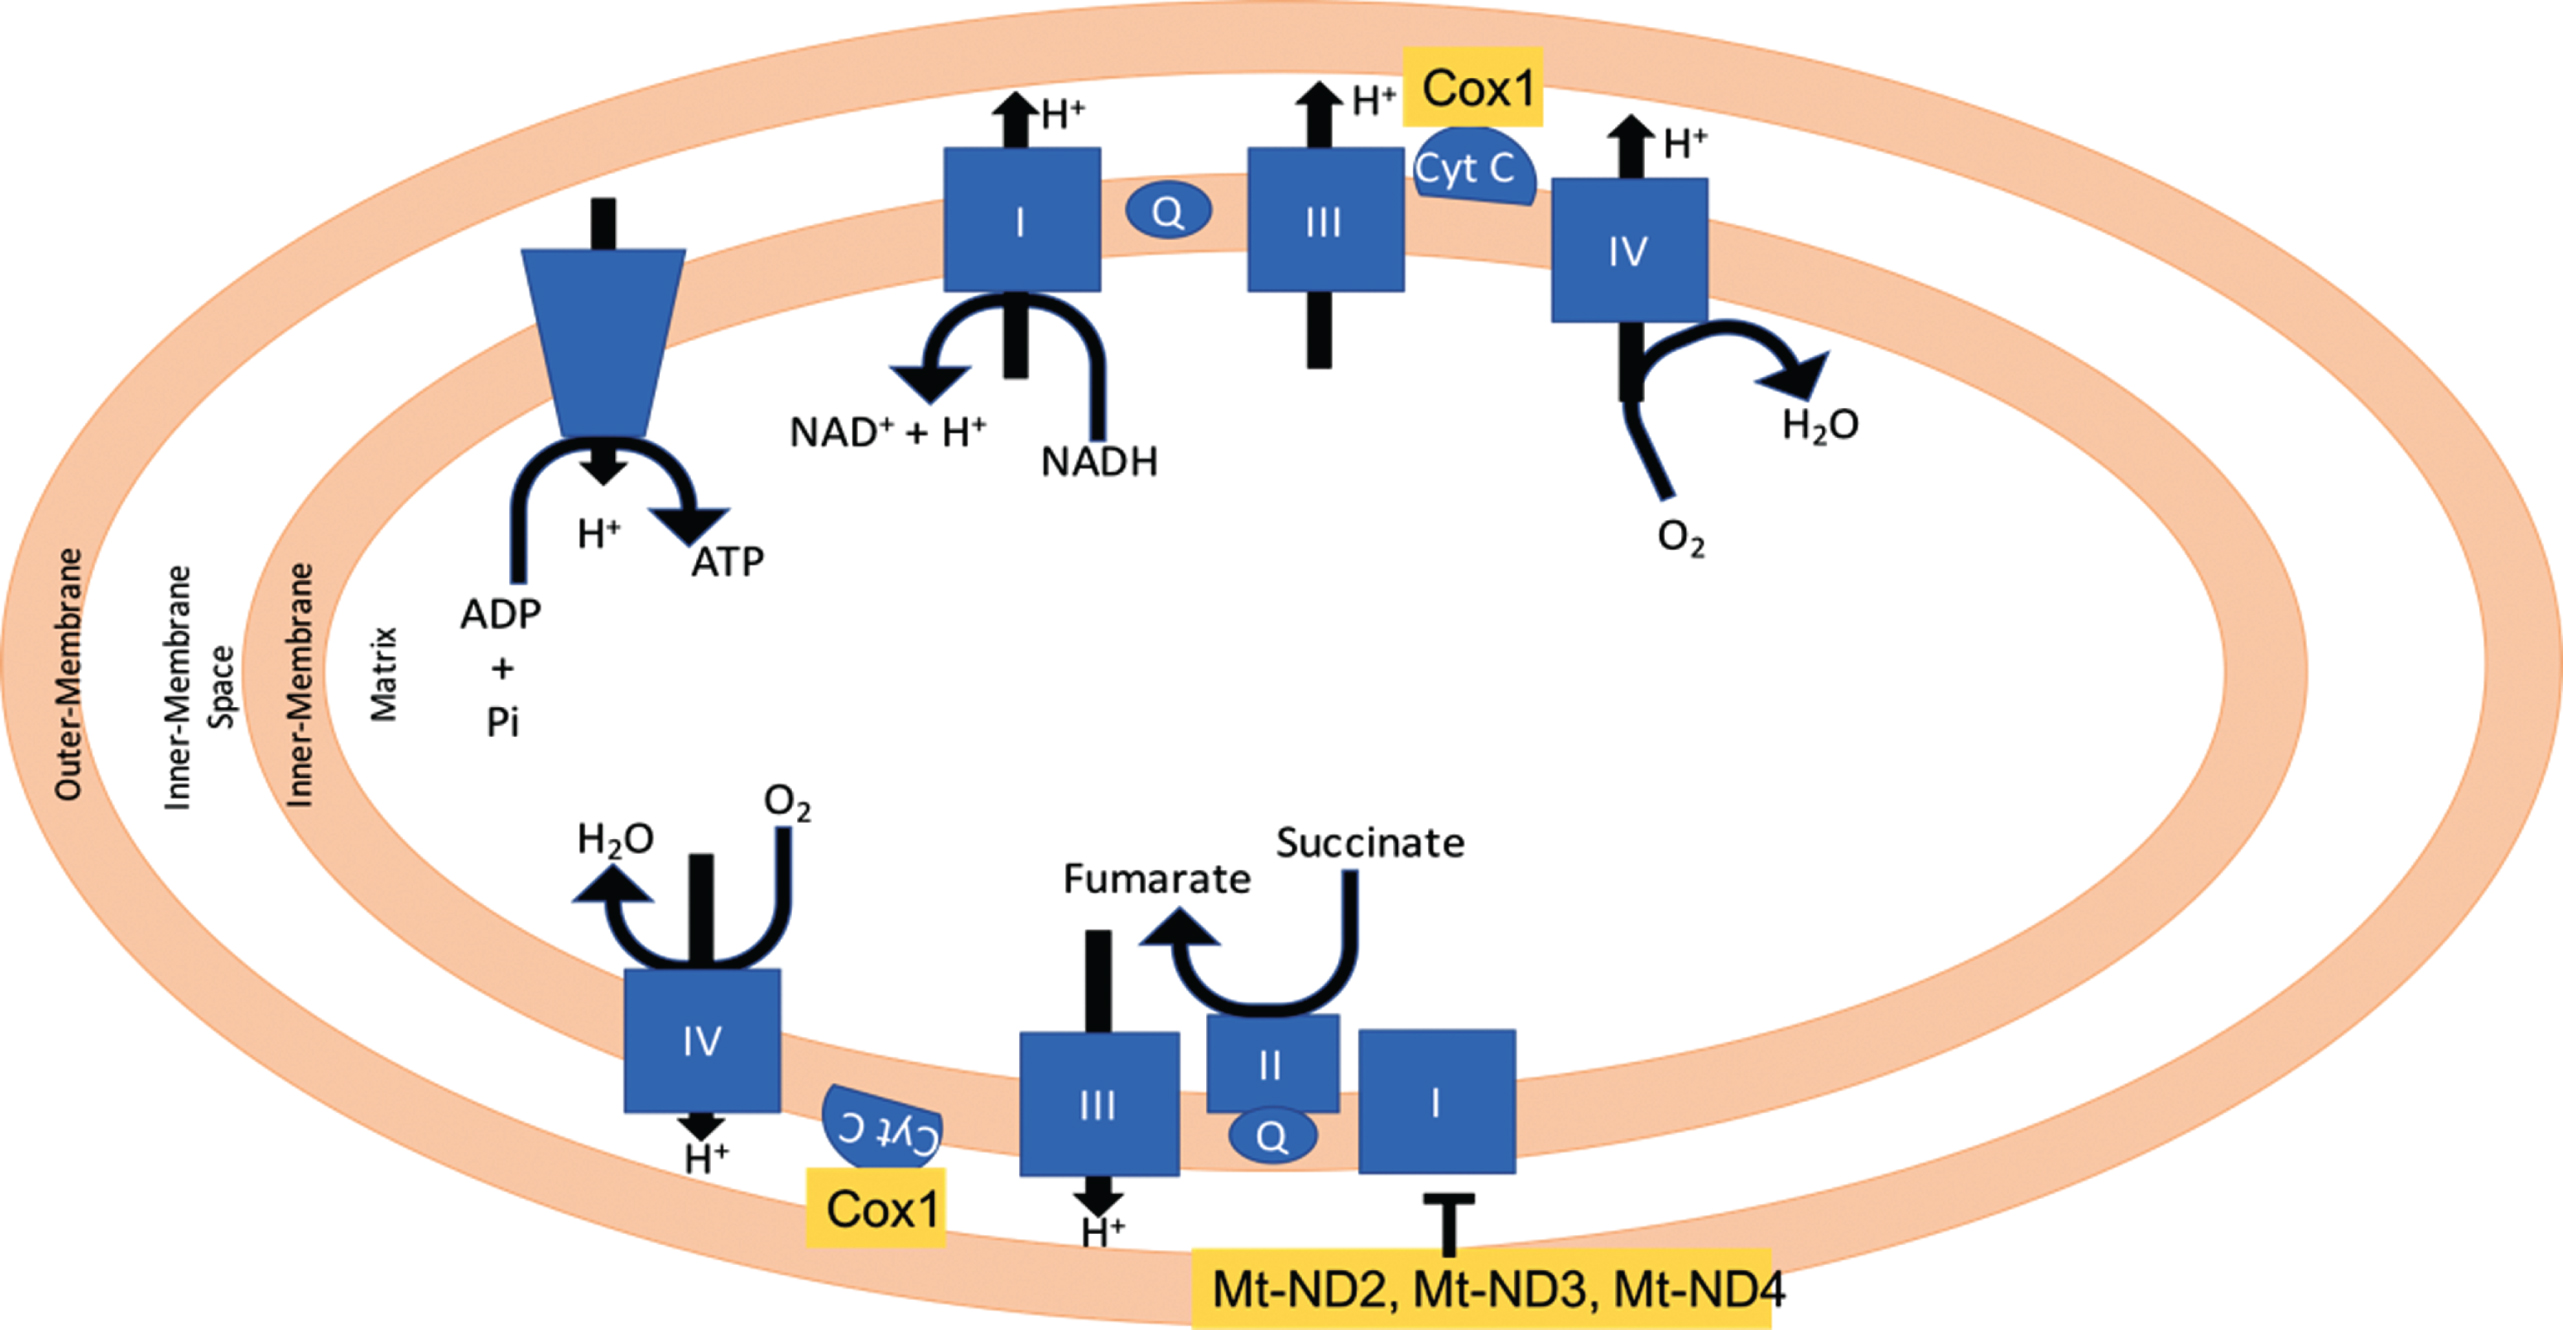
Fig.6
Mitochondrial localization of COX1, Mt-ND3, and Mt-ND4.
Following the TSP, the next gene is COX-1. COX are microsomal enzymes present in two isoforms: COX-1 and COX-2, that are constitutively expressed in most cells. COX enzymes have been reported to play a role in the mechanisms of neurodegeneration [17] and AD through inflammation [18] as well as through interferences with fatty acid metabolism [19]. In a study by Hoozemans et al. in AD brains, microglial cells stained COX-1 positive and was associated with Aβ plaques while COX-2 stained positive in the neuronal cells [20]. This cell specific difference in COX-1 and COX-2 could implicate that they are involved in different processes of AD pathogenesis [20]. COX-1 is overexpressed in frontal and temporal cortex, while its presence in the microglial cells is involved with the amyloid plaque formation [18]. Shukuri et al. provided evidence that COX-1 plays a critical role in microglial activation during acute neuroinflammation in vivo. Non-steroidal anti-inflammatory drugs (NSAIDs) have been shown to reduce AD risk by the inhibition of inflammatory responses [21, 22]. COX-1 is involved in immunoregulation of the CNS [23–26] and the deletion of COX-1 gene reduces Aβ-induced neuroinflammation and neuronal damage [24–27]. NCX-2216, is a selective inhibitor of COX-1 and has been shown to have an intermediate effect on reducing amyloid burden [28]. Oddo et al. [29] reported that SC-560, a selective inhibitor of COX-1, reduces amyloid deposits, tau hyperphosphorylation, and neuroinflammation in aged AD mice. Coma et al. [30] demonstrated that Triflusal, an irreversible inhibitor of COX-1, can correct cognition defects in an AD mousemodel.
The expression change for the genes recognized by probe 224373_s_at [31]: ND4, Hnrnpm, and DCAF6, is also selected by the method as being one of biggest ones. MT-ND4, or mitochondrial encoded NADH Dehydrogenase 4, product is also part of Complex I. The mRNA expression for this gene has been reported to decrease in the hippocampus and inferior parietal lobule of AD patients [32]. A study for the expression of mitochondrial ND2 and ND4 genes in amyotrophic lateral sclerosis found that the anterior neurons in the cervical spinal cord had reduced mtDNA gene levels and an increment in the amount of mtDNA deletions [33]. It has been reported that ND4 expression is lower in the temporal cortex of AD patients [34]. Supporting the relation of the mitochondrial electron transfer complexes changes and AD, the study by Lee et al. [35] reported that the expression of SIRT3 was reduced in AD patients, and that lower expression of SIRT3 was reflected in a lower amount of ND2 and ND4, summarized in Fig. 7. The other mRNA recognized by the 224373_s_at probe is that of the Heterogenous nuclear ribonucleoprotein (hnRNP) protein, the product directly binds to pre-mRNA and has important roles in the post-transcriptional regulations in splicing and transport of mRNAs [36, 37]. Studies have shown that some pathological incidents in the AD brain are associated with post-transcriptionally regulation [38–42], but the details on the post-transcriptionally regulation still remains unclear [42]. Different studies have reported that tangle-bearing neurons reduced mRNAs that are implicated in AD pathology [43] and reduced polyadenylated RNA [44]. Another study reported that hnRNP A2 and B1 expression is decreased in tangle-bearing neurons [42]. DCAF6 codes for a protein that works as a ligand-dependent coactivator of nuclear receptors including androgen receptors, which are involved with the development of AD [32, 45]. Mutations of the DCAF6 gene have been also linked to maternally inherited schizophrenia [46].
Following the correlation path, the next probe (HNRNPA3) corresponds to a control for the microarray. The following probe is for MT-ND3. MT-ND3 codes for another member of mitochondrial Complex I. The product of this gene was shown to bind to a peptide corresponding to 25 amino acids of the C-terminal of Aβ [47]. The authors of the report proposed that the ND3 Aβ interaction could explain in part the lower activity of Complex I in astrocytes and neurons in AD patients.
Insight into molecular role of ribosomal proteins in AD
Following the TSP path, the next gene is RPL41, which codes for the Ribosomal Protein L41. RPL41 has not been associated with AD yet. RPL41 is a small peptide involved in initiating translation. It has been suggested that the RPL41 product plays different roles in cell proliferation and differentiation during neurogenesis [48]. This protein has also been found to help with virus replication in two avian viruses: infectious bursal disease virus [49] and Sindbis virus [50]. RPL41 promotes the expression of the c-myc proto-oncogene [51]. In carcinogenesis, RPL41 induces ATF4 phosphorylation [52]. ATF4 is needed for cancer cells to survive hypoxia and oxidative stress [53, 54]. Figure 8a provides a diagram for the relation of glutathione, RPL41, and neuronal dysfunction. ATF4 in turn mediates neurodegeneration in AD andtransmission of a neurodegenerative signal through some brain regions [55, 56]. Solid evidence have shown that oxidative stress is an initiator of neuronal dysfunction in prevalent neurological diseases, including spinal cord injury, AD, and Parkinson’ s disease [57]. ATF4 is induced by oxidative stress due to the depletion of glutathione. Deletion of ATF4 renders neurons resistant to neuronal cell death and is associated with the preservation of glutathione levels [58], as shown schematically in Fig. 8b.
Fig.7
Diagram summarizing a response to SIRT3 lower expression leading to a decrease level of MT-ND2 and MT-ND4 [35]. This decrease levels results in neuronal damage and subsequent neurodegeneration.
![Diagram summarizing a response to SIRT3 lower expression leading to a decrease level of MT-ND2 and MT-ND4 [35]. This decrease levels results in neuronal damage and subsequent neurodegeneration.](https://content.iospress.com:443/media/jad/2018/65-1/jad-65-1-jad170799/jad-65-jad170799-g007.jpg)
Fig.8
Flowchart summarizing a relation between RPL41 and ATF4. A) Depletion of glutathione induces oxidative stress which causes activation of RPL41 that results in phosphorylation of ATF4 causing neuronal dysfunction [52]. B) Deletion of ATF4 causes neurons to resist cell death and preserve glutathione levels [58].
![Flowchart summarizing a relation between RPL41 and ATF4. A) Depletion of glutathione induces oxidative stress which causes activation of RPL41 that results in phosphorylation of ATF4 causing neuronal dysfunction [52]. B) Deletion of ATF4 causes neurons to resist cell death and preserve glutathione levels [58].](https://content.iospress.com:443/media/jad/2018/65-1/jad-65-1-jad170799/jad-65-jad170799-g008.jpg)
Fig.9
Overexpression of FTL causes increase production of Aβ plaques leading to neurodegeneration [66].
![Overexpression of FTL causes increase production of Aβ plaques leading to neurodegeneration [66].](https://content.iospress.com:443/media/jad/2018/65-1/jad-65-1-jad170799/jad-65-jad170799-g009.jpg)
RPS10, next gene in the TSP pathway, codes for one of the proteins of the 40S ribosomal subunit. RPS10 is part of the ribosomal protein family, a family of proteins that has been reported to change its expression in neurodegenerative diseases such as AD [59]. The expression of this gene was found to be lower in schizophrenia patients than in controls [60]. Changes in expression of this gene has been observed in colorectal cancer [61]. The RPS10 protein interacts with the HIV-1 Nef protein [59]. Mutations in the RPS10 are linked to Diamond-Blackfan anemia [62].
Dysregulation of iron in the brain contributes to AD
FTL gene codes for the ferritin light polypeptide protein. Ferritin is the principal iron storage protein. Ferritin consists of ferritin heavy chain (FTH) and ferritin light chain (FTL) [63]. It has been reported that levels of ferritin are lower in the peripheral blood mononuclear cells from AD patients and it has been proposed that this change is one of the factors responsible for the dysregulation of iron found in AD patients [64]. Ferritin has been reported to protect cells from oxidative damage and to participate in innate immunity [65]. Even as ferritin as a whole has a protective role, it has been reported that overexpression of FTL increases γ-secretase that in turn produces more Aβ [66] (Fig. 8). In our results, FTL was overexpress in the cases. FTL product is associated with neurodegenerative disorder related with iron accumulation in the brain, primarily in the basal ganglia [67] and enhances oxidative damage [68–70]. Besides the effect that FTL has on Aβ production, dysregulation of iron storage proteins has an impact on cell function. Iron has a direct impact on the formation of Aβ plaque through its effect on amyloid-β protein precursor metabolism [71, 72], promoting Aβ deposition and oxidative stress induced toxicity [73], as well as the aggregation of hyperphosphorylated tau [63].
Biomarker for astroglial pathology in AD
Next gene on the TSP path is GFAP; this gene codes for Glial fibrillary acidic protein (GFAP), an intermediate filament protein in astrocytes. Astrocytes are part of the glial cells and their functions include maintenance of the central nervous system neurons’ microenvironment [74]. GFAP is increased in processes of brain damage and neurodegeneration and is a target and biomarker for astroglial pathology in neurological diseases [75, 76]. Mutations in this gene are responsible for Alexander disease (a rare disorder of the central nervous system), leukodystrophy, and AD [22].
NUCKS1
Following the TSP pathway is NUCKS1, this gene codes for nuclear casein kinase and cyclin-dependent kinase substrate 1 [77]. NUCKS1 is a nuclear protein, highly conserved in vertebrates [78]. It is expressed in most tissues and experiments in rats have shown that its expression increases during the initial stages of embryonic development in brain and liver [77]. Qiu et al. [79] reported that in the embryonic development, NUCKS1 appears to be a marker for migrating cells of the neural crests. NUCKS1 has been shown to be important for homologous recombination DNA damage response [80] and to play a role in inflammatory immune response [78]. It is interesting to note that the NUCKS1 product is also used by the HIV-1 for the viral transcription of its genetic material [81] and has been reported as a biomarker for some cancer [82, 83]. Gene ontology analyses indicates that NUCKS1 also helps maintain glucose homeostasis [84]. The expression change of the NUCKS1 has been linked to mood disorders, Parkinson’s disease [85, 86], and to AD [87], providing a common link between different neurological conditions.
In summary, grouping genes that code for proteins of a bigger complex one finds: ND4, ND2, and ND3, mitochondrial encoded NADH dehydrogenase (Complex I) genes. Another mitochondrial-encoded gene is COX1 and its product also forms part of one of the electron transport complexes. The correlations between the expression changes for these genes are high, more than 0.9. These results coincide with the reports of mitochondrial genes expression change in AD [88, 89] and other neurodegenerative diseases [90]. There are two genes that code for different ribosomal proteins: RPS10 and RPL4, in the TSP they are separated by FTL and GFAP. Some of the selected genes have been reported to change their expression in different cancers and some are known to be used by viruses to produce infections.
Conclusion
In this study, the analysis of the microarray dataset GSE4757 was modeled as an MCO problem in order to find those genes that change their expression the most in AD neurons in the presence of NFTs. To find how the expression changes are correlated for the selected genes, the TSP formulation was used. From the results, it is possible to identify biologically relevant connections that can help to characterize this disease.
Our analysis identifies genes already reported as relevant to inflammation and neurodegenerative diseases and provides leads for future experimental studies for those genes that had not been reported yet in AD. Results also suggest that infections could be related to AD development as other reports have proposed [47–50]. Genes without previous report relevance in AD can be proposed for further biological validation as well as the gene expression connections that have not been explored yet.
ACKNOWLEDGMENTS
The project described was supported by Award Number G12MD007579 from the National Institute on Minority Health and Health Disparities. The content is solely the responsibility of the authors and does not necessarily represent the official views of the National Institutes of Health. The authors also acknowledge the support of National Institutes of Health (NIH) MARC Grant 5T36GM095335-02 ‘Bioinformatics Programs at Minority Institutions’. Coauthors Cruz-Rivera and Cabrera-Ríos acknowledge the support of USDA-NIFA Award 2015-38422-24064 sub award 1000000920. BE AWARE Project.
Authors’ disclosures available online (https://www.j-alz.com/manuscript-disclosures/17-0799r2).
References
[1] | Rall JM , Mach SA , Dash PK ((2003) ) Intrahippocampal infusion of a cyclooxygenase-2 inhibitor attenuates memory acquisition in rats. Brain Res 968: , 273–276. |
[2] | Frey HJ , Mattila KM , Korolainen MA , Pirttila T ((2005) ) Problems associated with biological markers of Alzheimer’s disease. Neurochem Res 30: , 1501–1510. |
[3] | Sanchez-Pena ML , Isaza CE , Perez-Morales J , Rodriguez-Padilla C , Castro JM , Cabrera-Rios M ((2013) ) Identification of potential biomarkers from microarray experiments using multiple criteria optimization. Cancer Med 2: , 253–265. |
[4] | Watts-Oquendo E , Sanchez-Pena M , Isaza CE , Cabrera-Rios M ((2012) ) Potential colon cancer biomarker search using more than two performance measures in a multiple criteria optimization approach. P R Health Sci J 31: , 59–63. |
[5] | Camacho-Caceres KI , Acevedo-Diaz JC , Perez-Marty LM , Ortiz M , Irizarry J , Cabrera-Rios M , Isaza CE ((2015) ) Multiple criteria optimization joint analyses of microarray experiments in lung cancer: From existing microarray data to new knowledge. Cancer Med 4: , 1884–1900. |
[6] | Cooper-Knock J , Kirby J , Ferraiuolo L , Heath PR , Rattray M , Shaw PJ ((2012) ) Gene expression profiling in human neurodegenerative disease. Nat Rev Neurol 8: , 518–530. |
[7] | Lorenzo E , Camacho-Caceres K , Ropelewski AJ , Rosas J , Ortiz-Mojer M , Perez-Marty L , Irizarry J , Gonzalez V , Rodriguez JA , Cabrera-Rios M , Isaza C ((2015) ) An optimization-driven analysis pipeline to uncover biomarkers and signaling paths: Cervix cancer. Microarrays (Basel) 4: , 287–310. |
[8] | Dunckley T , Beach TG , Ramsey KE , Grover A , Mastroeni D , Walker DG , LaFleur BJ , Coon KD , Brown KM , Caselli R , Kukull W , Higdon R , McKeel D , Morris JC , Hulette C , Schmechel D , Reiman EM , Rogers J , Stephan DA ((2006) ) Gene expression correlates of neurofibrillary tangles in Alzheimer’s disease. Neurobiol Aging 27: , 1359–1371. |
[9] | Reinelt G ((1991) ) TSPLIB- A traveling salesman problem library. ORSA J Comput 3: , 376–384. |
[10] | Montgomery D , Runger D ((2003) ) Applied Statistics and Probability for Engineers, John Wiley & Sons Inc. |
[11] | The MathWorks, Inc. Natick, Massachusetts, United States. |
[12] | Cheng Y , Bai F ((2018) ) The association of tau with mitochondrial dysfunction in Alzheimer’s disease. Front Neurosci 12: , 163. |
[13] | Lunnon K , Keohane A , Pidsley R , Newhouse S , Riddoch-Contreras J , Thubron EB , Devall M , Soininen H , Kloszewska I , Mecocci P , Tsolaki M , Vellas B , Schalkwyk L , Dobson R , Malik AN , Powell J , Lovestone S , Hodges A ((2017) ) Mitochondrial genes are altered in blood early in Alzheimer’s disease. Neurobiol Aging 53: , 36–47. |
[14] | Petruzzella V , Chen X , Schon EA ((1992) ) Is a point mutation in the mitochondrial ND2 gene associated with Alzheimer’s disease. Biochem Biophys Res Commun 186: , 491–497. |
[15] | Lin FH , Lin R , Wisniewski HM , Hwang YW , Grundke-Iqbal I , Healy-Louie G , Iqbal K ((1992) ) Detection of point mutations in codon 331 of mitochondrial NADH dehydrogenase subunit 2 in Alzheimer’s brains. Biochem Biophys Res Commun 182: , 238–246. |
[16] | Burman JL , Itsara LS , Kayser EB , Suthammarak W , Wang AM , Kaeberlein M , Sedensky MM , Morgan PG , Pallanck LJ ((2014) ) A Drosophila model of mitochondrial disease caused by a complex I mutation that uncouples proton pumping from electron transfer. Dis Model Mech 7: , 1165–1174. |
[17] | Shukuri M , Mawatari A , Ohno M , Suzuki M , Doi H , Watan-abe Y , Onoe H ((2016) ) Detection of cyclooxygenase-1 in activated microglia during amyloid plaque progression: Pet studies in Alzheimer’s disease model mice. J NucI Med 57: , 291–296. |
[18] | Bazan NG , Colangelo V , Lukiw WJ ((2002) ) Prostaglandins and other lipid mediators in Alzheimer’s disease. Prostaglandins Other Lipid Mediat 68-69: , 197–210. |
[19] | Czapski GA , Czubowicz K , Strosznajder JB , Strosznajder RP ((2016) ) The lipoxygenases: Their regulation and implication in Alzheimer’s disease. Neurochem Res 41: , 243–257. |
[20] | Hoozemans JJ , Rozemuller AJ , Janssen I , De Groot CJ , Veerhuis R , Eikelenboom P ((2001) ) Cyclooxygenase expression in microglia and neurons in Alzheimer’s disease and control brain. Acta Neuropathol 101: , 2–8. |
[21] | Lim GP , Yang F , Chu T , Chen P , Beech W , Teter B , Tran T , Ubeda O , Ashe KH , Frautschy SA , Cole GM ((2000) ) Ibuprofen suppresses plaque pathology and inflammation in a mouse model for Alzheimer’s disease. J Neurosci 20: , 5709–5714. |
[22] | McKee AC , Carreras I , Hossain L , Ryu H , Klein WL , Oddo S , LaFerla FM , Jenkins BG , Kowall NW , Dedeoglu A ((2008) ) Ibuprofen reduces Abeta, hyperphosphorylated tau and memory deficits in Alzheimer mice. Brain Res 1207: , 225–236. |
[23] | Garcia-Bueno B , Serrats J , Sawchenko PE ((2009) ) Cerebrovascular cyclooxygenase-1 expression, regulation, and role in hypothalamic-pituitary-adrenal axis activation by inflammatory stimuli. J Neurosci 29: , 12970–12981. |
[24] | Choi SH , Bosetti F ((2009) ) Cyclooxygenase-1 null mice show reduced neuroinflammation in response to beta-amyloid. Aging (Albany NY) 1: , 234–244. |
[25] | Matousek SB , Hein AM , Shaftel SS , Olschowka JA , Kyrkanides S , O’Banion MK ((2010) ) Cyclooxygenase-1 mediates prostaglandin E(2) elevation and contextual memory impairment in a model of sustained hippocampal interleukin-1beta expression. J Neurochem 114: , 247–258. |
[26] | Dargahi L , Nasiraei-Moghadam S , Abdi A , Khalaj L , Moradi F , Ahmadiani A ((2011) ) Cyclooxygenase (COX)-1 activity precedes the COX-2 induction in Abeta-induced neuroinflammation. J Mol Neurosci 45: , 10–21. |
[27] | Choi SH , Aid S , Bosetti F ((2009) ) The distinct roles of cyclooxygenase-1 and -2 in neuroinflammation: Implications for translational research. Trends Pharmacol Sci 30: , 174–181. |
[28] | Jantzen PT , Connor KE , DiCarlo G , Wenk GL , Wallace JL , Rojiani AM , Coppola D , Morgan D , Gordon MN ((2002) ) Microglial activation and beta-amyloid deposit reduction caused by a nitric oxide-releasing nonsteroidal anti-inflammatory drug in amyloid precursor protein plus presenilin-1 transgenic mice. J Neurosci 22: , 2246–2254. |
[29] | Oddo S , Caccamo A , Smith IF , Green KN , LaFerla FM ((2006) ) A dynamic relationship between intracellular and extracellular pools of Abeta. Am J Pathol 168: , 184–194. |
[30] | Coma M , Sereno L , Da Rocha-Souto B , Scotton TC , Espana J , Sanchez MB , Rodriguez M , Agullo J , Guardia-Laguarta C , Garcia-Alloza M , Borrelli LA , Clarimon J , Lleo A , Bacskai BJ , Saura CA , Hyman BT , Gomez-Isla T ((2010) ) Triflusal reduces dense-core plaque load, associated axonal alterations and inflammatory changes, and rescues cognition in a transgenic mouse model of Alzheimer’s disease. Neurobiol Dis 38: , 482–491. |
[31] | Information for probe set 224373_s_at. https://genecards.weizmann.acJl/cgi-bin/geneannot/GA_search.pl?keyword_type=probe_set_id&target=genecards&keyword=224373_s_at&array=HG-UI33 (retrieved on 01-01-2016) |
[32] | Aksenov MY , Tucker HM , Nair P , Aksenova MV , Butterfield DA , Estus S , Markesbery WR ((1999) ) The expression of several mitochondrial and nuclear genes encoding the subunits of electron transport chain enzyme complexes, cytochrome c oxidase, and NADH dehydrogenase, in different brain regions in Alzheimer’s disease. Neurochem Res 24: , 767–774. |
[33] | Keeney PM , Bennett JP Jr. ((2010) ) ALS spinal neurons show varied and reduced mtDNA gene copy numbers and increased mtDNA gene deletions., Mol Neurodegener 5: , 21. |
[34] | Fukuyama R , Hatanpaa K , Rapoport SI , Chandrasekaran K ((1996) ) Gene expression of ND4, a subunit of complex I of oxidative phosphorylation in mitochondria, is decreased in temporal cortex of brains of Alzheimer’s disease patients. Brain Res 713: , 290–293. |
[35] | Lee J , Kim Y , Liu T , Hwang YJ , Hyeon SJ , Im H , Lee K , Alvarez VE , McKee AC , Um SJ , Hur M , Mook-Jung I , Kowall NW , Ryu H ((2018) ) SIRT3 deregulation is linked to mitochondrial dysfunction in Alzheimer’s disease. Aging Cell 17: , e12679. |
[36] | Pinol-Roma S , Dreyfuss G ((1992) ) Shuttling of pre-mRNA binding proteins between nucleus and cytoplasm. Nature 355: , 730–732. |
[37] | Dreyfuss G , Matunis MJ , Pinol-Roma S , Burd CG ((1993) ) hnRNP proteins and the biogenesis of mRNA. Annu Rev Biochem 62: , 289–321. |
[38] | Akbarian S , Smith MA , Jones EG ((1995) ) Editing for an AMPA receptor subunit RNA in prefrontal cortex and striatum in Alzheimer’s disease, Huntington’s disease and schizophrenia. Brain Res 699: , 297–304. |
[39] | Honda K , Smith MA , Zhu X , Baus D , Merrick WC , Tartakoff AM , Hattier T , Harris PL , Siedlak SL , Fujioka H , Liu Q , Moreira PI , Miller FP , Nunomura A , Shimohama S , Perry G ((2005) ) Ribosomal RNA in Alzheimer disease is oxidized by bound redox-active iron. J Biol Chem 280: , 20978–20986. |
[40] | Li S , Mallory M , Alford M , Tanaka S , Masliah E ((1997) ) Glutamate transporter alterations in Alzheimer disease are possibly associated with abnormal APP expression. J Neuropathol Exp Neurol 56: , 901–911. |
[41] | Wallace WC , Bragin V , Robakis NK , Sambamurti K , VanderPutten D , Merril CR , Davis KL , Santucci AC , Haroutunian V ((1991) ) Increased biosynthesis of Alzheimer amyloid precursor protein in the cerebral cortex of rats with lesions of the nucleus basalis of Meynert. Brain Res Mol Brain Res 10: , 173–178. |
[42] | Mizukami K , Ishikawa M , Iwakiri M , Ikonomovic MD , Dekosky ST , Kamma H , Asada T ((2005) ) Immunohistochemical study of the hnRNP A2 and B1 in the hippocampal formations of brains with Alzheimer’s disease. Neurosci Lett 386: , 111–115. |
[43] | Ginsberg SD , Hemby SE , Lee VM , Eberwine JH , Trojanowski JQ ((2000) ) Expression profile of transcripts in Alzheimer’s disease tangle-bearing CA1 neurons. Ann Neurol 48: , 77–87. |
[44] | Sajdel-Sulkowska EM , Marotta CA ((1984) ) Alzheimer’s disease brain: Alterations in RNA levels and in a ribonuclease-inhibitor complex. Science 225: , 947–949. |
[45] | Chen PH , Tsao YP , Wang CC , Chen SL ((2008) ) Nuclear receptor interaction protein, a coactivator of androgen receptors (AR), is regulated by AR and Sp1 to feed forward and activate its own gene expression through AR protein stability. Nucleic Acids Res 36: , 51–66. |
[46] | Martorell L , Segues T , Folch G , Valero J , Joven J , Labad A , Vilella E ((2006) ) New variants in the mitochondrial genomes of schizophrenic patients. Eur J Hum Genet 14: , 520–528. |
[47] | Munguia ME , Govezensky T , Martinez R , Manoutcharian K , Gevorkian G ((2006) ) Identification of amyloid-beta 1-42 binding protein fragments by screening of a human brain cDNA library. Neurosci Lett 397: , 79–82. |
[48] | Ueno M , Nakayama H , Kajikawa S , Katayama K , Suzuki K , Doi K ((2002) ) Expression of ribosomal protein L4 (rpL4) during neurogenesis and 5-azacytidine (5AzC)-induced apoptotic process in the rat. HistolHistopathol 17: , 789–798. |
[49] | Chen Y , Lu Z , Zhang L , Gao L , Wang N , Gao X , Wang Y , Li K , Gao Y , Cui H , Gao H , Liu C , Zhang Y , Qi X , Wang X ((2016) ) Ribosomal protein L4 interacts with viral protein VP3 and regulates the replication of infectious bursal disease virus. Virus Res 211: , 73–78. |
[50] | Green L , Houck-Loomis B , Yueh A , Goff SP ((2012) ) Large ribosomal protein 4 increases efficiency of viral recoding sequences. J Virol 86: , 8949–8958. |
[51] | Egoh A , Nosuke Kanesashi S , Kanei-Ishii C , Nomura T , Ishii S ((2010) ) Ribosomal protein L4 positively regulates activity of a c-myb proto-oncogene product. Genes Cells 15: , 829–841. |
[52] | Wang A , Xu S , Zhang X , He J , Yan D , Yang Z , Xiao S ((2011) ) Ribosomal protein RPL41 induces rapid degradation of ATF4, a transcription factor critical for tumour cell survival in stress. J Pathol 225: , 285–292. |
[53] | Fels DR , Koumenis C ((2006) ) The PERK/eIF2alpha/ATF4 module of the UPR in hypoxia resistance and tumor growth. Cancer Biol Ther 5: , 723–728. |
[54] | Ye J , Kumanova M , Hart LS , Sloane K , Zhang H , De Panis DN , Bobrovnikova-Marjon E , Diehl JA , Ron D , Koumenis C ((2010) ) The GCN2-ATF4 pathway is critical for tumour cell survival and proliferation in response to nutrient deprivation. EMBO J 29: , 2082–2096. |
[55] | Fayaz SM , Rajanikant GK ((2014) ) ATF4: The perpetrator in axonal-mediated neurodegeneration in Alzheimer’s disease. CNS Neurol Disord Drug Targets 13: , 1483–1484. |
[56] | Baleriola J , Walker CA , Jean YY , Crary JF , Troy CM , Nagy PL , Hengst U ((2014) ) Axonally synthesized ATF4 transmits a neurodegenerative signal across brain regions. Cell 158: , 1159–1172. |
[57] | Beal MF ((2000) ) Oxidative metabolism. Ann N Y Acad Sci 924: , 164–169. |
[58] | Lange PS , Chavez JC , Pinto JT , Coppola G , Sun CW , Townes TM , Geschwind DH , Ratan RR ((2008) ) ATF4 is an oxidative stress-inducible, prodeath transcription factor in neurons and. J Exp Med 205: , 1227–1242. |
[59] | Abbas W , Dichamp I , Herbein G ((2012) ) The HIV-1 Nef protein interacts with two components of the 40S small ribosomal subunit, the RPS10 protein and the 18S rRNA. Virol J 9: , 103. |
[60] | Martins-de-Souza D , Gattaz WF , Schmitt A , Rewerts C , Marangoni S , Novello JC , Maccarrone G , Turck CW , Dias-Neto E ((2009) ) Alterations in oligodendrocyte proteins, calcium homeostasis and new potential markers in schizophrenia anterior temporal lobe are revealed by shotgun proteome analysis. J Neural Transm (Vienna) 116: , 275–289. |
[61] | Frigerio JM , Dagorn JC , Iovanna JL ((1995) ) Cloning, sequencing and expression of the L5, L21, L27a, L28, S5, S9, S10 and S29 human ribosomal protein mRNAs. Biochim Biophys Acta 1262: , 64–68. |
[62] | Doherty L , Sheen MR , Vlachos A , Choesmel V , O’Donohue MF , Clinton C , Schneider HE , Sieff CA , Newburger PE , Ball SE , Niewiadomska E , Matysiak M , Glader B , Arceci RJ , Farrar JE , Atsidaftos E , Lipton JM , Gleizes PE , Gazda HT ((2010) ) Ribosomal protein genes RPS10 and RPS26 are commonly mutated in Diamond-Blackfan anemia. Am J Hum Genet 86: , 222–228. |
[63] | Yamamoto A , Shin RW , Hasegawa K , Naiki H , Sato H , Yoshimasu F , Kitamoto T ((2002) ) Iron (III) induces aggregation of hyperphosphorylated tau and its reduction to iron (II) reverses the aggregation: Implications in the formation of neurofibrillary tangles of Alzheimer’s disease. J Neurochem 82: , 1137–1147. |
[64] | Crespo AC , Silva B , Marques L , Marcelino E , Maruta C , Costa S , Timoteo A , Vilares A , Couto FS , Faustino P , Correia AP , Verdelho A , Porto G , Guerreiro M , Herrero A , Costa C , de Mendonca A , Costa L , Martins M ((2014) ) Genetic and biochemical markers in patients with Alzheimer’s disease support a concerted systemic iron homeostasis dysregulation. Neurobiol Aging 35: , 777–785. |
[65] | Arosio P , Carmona F , Gozzelino R , Maccarinelli F , Poli M ((2015) ) The importance of eukaryotic ferritins in iron handling and cytoprotection. Biochem J 472: , 1–15. |
[66] | Li X , Liu Y , Zheng Q , Yao G , Cheng P , Bu G , Xu H , Zhang YW ((2013) ) Ferritin light chain interacts with PEN-2 and affects gamma-secretase activity. Neurosci Lett 548: , 90–94. |
[67] | Maciel P , Cruz VT , Constante M , Iniesta I , Costa MC , Gallati S , Sousa N , Sequeiros J , Coutinho P , Santos MM ((2005) ) Neuroferritinopathy: Missense mutation in FTL causing early-onset bilateral pallidal involvement. Neurology 65: , 603–605. |
[68] | Barbeito AG , Garringer HJ , Baraibar MA , Gao X , Arredondo M , Nunez MT , Smith MA , Ghetti B , Vidal R ((2009) ) Abnormal iron metabolism and oxidative stress in mice expressing a mutant form of the ferritin light pol2ypeptide gene. J Neurochem 109: , 1067–1078. |
[69] | Vidal R , Miravalle L , Gao X , Barbeito AG , Baraibar MA , Hekmatyar SK , Widel M , Bansal N , Delisle MB , Ghetti B ((2008) ) Expression of a mutant form of the ferritin light chain gene induces neurodegeneration and iron overload in transgenic mice. J Neurosci 28: , 60–67. |
[70] | Baraibar MA , Barbeito AG , Muhoberac BB , Vidal R ((2012) ) A mutant light-chain ferritin that causes neurodegeneration has enhanced propensity toward oxidative damage. Free Radic Biol Med 52: , 1692–1697. |
[71] | Bodovitz S , Falduto MT , Frail DE , Klein WL ((1995) ) Iron levels modulate alpha-secretase cleavage of amyloid precursor protein. J Neurochem 64: , 307–315. |
[72] | Rogers JT , Randall JD , Cahill CM , Eder PS , Huang X , Gunshin H , Leiter L , McPhee J , Sarang SS , Utsuki T , Greig NH , Lahiri DK , Tanzi RE , Bush AI , Giordano T , Gullans SR ((2002) ) An iron-responsive element type II in the 5’-untranslated region of the Alzheimer’s amyloid precursor protein transcript. J Biol Chem 277: , 45518–45528. |
[73] | Mantyh PW , Ghilardi JR , Rogers S , DeMaster E , Allen CJ , Stimson ER , Maggio JE ((1993) ) Aluminum, iron, and zinc ions promote aggregation of physiological concentrations of beta-amyloid peptide. J Neurochem 61: , 1171–1174. |
[74] | Guillamon-Vivancos T , Gomez-Pinedo U , Matias-Guiu J ((2015) ) Astrocytes in neurodegenerative diseases (I): Function and molecular description. Neurologia 30: , 119–129. |
[75] | Long Y , Liang J , Xu H , Huang Q , Yang J , Gao C , Qiu W , Lin S , Chen X ((2018) ) Autoimmune glial fibrillary acidic protein astrocytopathy in Chinese patients: A retrospective study. Eur J Neurol 25: , 477–483. |
[76] | Ben Haim L , Carrillo-de Sauvage MA , Ceyzeriat K , Escartin C ((2015) ) Elusive roles for reactive astrocytes in neurodegenerative diseases. Front Cell Neurosci 9: , 278. |
[77] | Grundt K , Haga IV , Aleporou-Marinou V , Drosos Y , Wanvik B , Ostvold AC ((2004) ) Characterisation of the NUCKS gene on human chromosome 1q32.1 and the presence of a homologous gene in different species. Biochem Biophys Res Commun 323: , 796–801. |
[78] | Huang P , Cai Y , Zhao B , Cui L ((2018) ) Roles of NUCKS1 in diseases: Susceptibility, potential biomarker, and regulatory mechanisms. Biomed Res Int 2018: , 7969068. |
[79] | Qiu B , Han W , Tergaonkar V ((2015) ) NUCKS: A potential biomarker in cancer and metabolic disease. Clin Sci (Lond) 128: , 715–721. |
[80] | Parplys AC , Zhao W , Sharma N , Groesser T , Liang F , Maranon DG , Leung SG , Grundt K , Dray E , Idate R , Ostvold AC , Schild D , Sung P , Wiese C ((2015) ) NUCKS1 is a novel RAD51AP1 paralog important for homologous recombination and genome stability. Nucleic Acids Res 43: , 9817–9834. |
[81] | Kim HY , Choi BS , Kim SS , Roh TY , Park J , Yoon CH ((2014) ) NUCKS1, a novel Tat coactivator, plays a crucial role in HIV-1 replication by increasing Tat-mediated viral transcription on the HIV-1 LTR promoter., Retrovirology 11: , 67. |
[82] | Kikuchi A , Ishikawa T , Mogushi K , Ishiguro M , Iida S , Mizushima H , Uetake H , Tanaka H , Sugihara K ((2013) ) Identification of NUCKS1 as a colorectal cancer prognostic marker through integrated expression and copy number analysis. Int J Cancer 132: , 2295–2302. |
[83] | Gu L , Xia B , Zhong L , Ma Y , Liu L , Yang L , Lou G ((2014) ) NUCKS1 overexpression is a novel biomarker for recurrence-free survival in cervical squamous cell carcinoma. Tumor Biol 35: , 7831–7836. |
[84] | Kitamura T , Kahn CR , Accili D ((2003) ) Insulin receptor knockout mice. Annu Rev Physiol 65: , 313–332. |
[85] | Liu X , Cheng R , Verbitsky M , Kisselev S , Browne A , Mejia-Sanatana H , Louis ED , Cote LJ , Andrews H , Waters C , Ford B , Frucht S , Fahn S , Marder K , Clark LN , Lee JH ((2011) ) Genome-wide association study identifies candidate genes for Parkinson’s disease in an Ashkenazi Jewish population. BMC Med Genet 12: , 104. |
[86] | Savitz J , Frank MB , Victor T , Bebak M , Marino JH , Bellgowan PS , McKinney BA , Bodurka J , Kent Teague T , Drevets WC ((2013) ) Inflammation and neurological disease-related genes are differentially expressed in depressed patients with mood disorders and correlate with morphometric and functional imaging abnormalities. Brain Behav Immun 31: , 161–171. |
[87] | Augustin R , Lichtenthaler SF , Greeff M , Hansen J , Wurst W , Trumbach D ((2011) ) Bioinformatics identification of modules of transcription factor binding sites in Alzheimer’s disease-related genes by in silico promoter analysis and microarrays. Int J Alzheimers Dis 2011: , 154325. |
[88] | Francis BM , Yang J , Song BJ , Gupta S , Maj M , Bazinet RP , Robinson B , Mount HT ((2014) ) Reduced levels of mitochondrial complex I subunit NDUFB8 and linked complex I+III oxidoreductase activity in the TgCRND8 mouse model of Alzheimer’s disease. J Alzheimers Dis 39: , 347–355. |
[89] | Bhat AH , Dar KB , Anees S , Zargar MA , Masood A , Sofi MA , Ganie SA ((2015) ) Oxidative stress, mitochondrial dysfunction and neurodegenerative diseases; a mechanistic insight. Biomed Pharmacother 74: , 101–110. |
[90] | Brockington A , Heath PR , Holden H , Kasher P , Bender FL , Claes F , Lambrechts D , Sendtner M , Carmeliet P , Shaw PJ ((2010) ) Downregulation of genes with a function in axon outgrowth and synapse formation in motor neurones of the VEGFdelta/delta mouse model of amyotrophic lateral sclerosis. BMC Genomics 11: , 203. |
[91] | FTL gene - Genetics Home Reference |
[92] | GFAP gene - Genetics Home Reference. |
[93] | Yi G , Xiang W , Feng W , Chen Z , Li Y , Deng S , Guo M , Zhao L , Sun X , He M , Qi S , Liu Y ((2018) ) Identification of key candidate proteins and pathways associated with temozolomide resistance in glioblastoma based on subcellular proteomics and bioinformatical analysis. Biomed Res Int 2018: , 5238760. |
[94] | Bitto A , Giuliani D , Pallio G , Irrera N , Vandini E , Canalini F , Zaffe D , Ottani A , Minutoli L , Rinaldi M , Guarini S , Squadrito F , Altavilla D ((2017) ) Effects of COX1-2/5-LOX blockade in Alzheimer transgenic 3xTg-AD mice. Inflamm Res 66: , 389–398. |
[95] | Aissouni Y , Zapart G , Iovanna JL , Dikic I , Soubeyran P ((2005) ) CIN85 regulates the ability of MEKK4 to activate the p38 MAP kinase pathway. Biochem Biophys Res Commun 338: , 808–814. |
[96] | Chai H-T , Chen K-H , Wallace CG , Chen C-H , Sung P-H , Chen Y-L , Yuen C-M , Shao P-L , Sun C-K , Chang H-W , Wang C-J , Lee MS , Yip H-K , Ko S-F ((2017) ) Extracorporeal shock wave therapy effectively protects brain against chronic cerebral hypo-perfusion-induced neuropathological changes. Am J Transl Res 9: , 5074–5093. |
[97] | Huang P , Cai Y , Zhao B , Cui L ((2018) ) Roles of NUCKS1 in diseases: Susceptibility, potential biomarker, and regulatory mechanisms. Biomed Res Int 2018: , 7969068. |
[98] | Wang A , Xu S , Zhang X , He J , Yan D , Yang Z , Xiao S ((2011) ) Ribosomal protein RPL41 induces rapid degradation of ATF4, a transcription factor critical for tumour cell survival in stress. J Pathol 225: , 285–292. |


