
The Montreal Cognitive Assessment: Normative Data from a Large Swedish Population-Based Cohort
Abstract
Background:
The Montreal Cognitive Assessment (MoCA) has a high sensitivity for detecting cognitive dysfunction. Swedish normative data does not exist and international norms are often derived from populations where cognitive impairment has not been screened for and not been thoroughly assessed to exclude subjects with dementia or mild cognitive impairment.
Objective:
To establish norms for MoCA and develop a regression-based norm calculator based on a large, well-examined cohort.
Methods:
MoCA was administered on 860 randomly selected elderly people from a population-based cohort from the EPIC study. Cognitive dysfunction was screened for and further assessed at a memory clinic. After excluding cognitively impaired participants, normative data was derived from 758 people, aged 65–85.
Results:
MoCA cut-offs (–1 to –2 standard deviations) for cognitive impairment ranged from <25 to <21 for the lowest educated and <26 to <24 for the highest educated, depending on age group. Significant predictors for MoCA score were age, sex and level of education.
Conclusion:
We present detailed normative MoCA data and cut-offs according to the DSM-5 criteria for cognitive impairment based on a large population-based cohort of elderly individuals, screened and thoroughly investigated to rule out cognitive impairment. Level of education, sex, and age should be taken in account when evaluating MoCA score, which is facilitated by our online regression-based calculator that provide percentile and z-score for a subject’s MoCA score.
INTRODUCTION
Cognitive impairment is a growing problem in an aging population with increasing comorbidity. It has been estimated that 35.6 million people lived with dementia worldwide in 2010, and these numbers are expected to almost double every 20 years, to 65.7 million in 2030 and 115.4 million in 2050 [1]. There is a great need for early and correct diagnosis and treatment of cognitive impairment. To achieve this, cognitive tests for early and sensitive detection is essential. Furthermore, it is important that the tests are accessible and that the results are simple to interpret. The Montreal Cognitive Assessment (MoCA) has increased in popularity for assessment of cognitive function, but the Mini-Mental State Examination (MMSE) is still one of the most frequently used cognitive screening tests, despite its significant limitations [2]. The MoCA, however, has a higher sensitivity and similar specificity compared to the MMSE for diseases affecting cognition [3]. Previous studies have shown that the MoCA is a better screening method for cognitive impairment due to Parkinson’s disease [4], stroke [5], chronic obstructive pulmonary disease [6], heart failure [7], diabetes mellitus with complications [8], and chronic hemodialysis [9]. Despite its global popularity, normative data for the MoCA does not yet exist in Sweden.
The original validation study of the MoCA suggested a cut-off value of ≥26 out of 30 points to differ healthy subjects from mild cognitive impairment (MCI) and healthy subjects [3]. Studies thereafter, however, have shown that lower thresholds are necessary for optimal diagnostic accuracy of MoCA in dementia, as many people incorrectly would be diagnosed with cognitive impairment using the cut-off score of 26 [10].
Cognitive impairment is typically investigated in adults over the age of 65. When interpreting cognitive assessments, it is important to have population-based normative data suitable for the population on which it is being used. Several previous studies on normative data for the MoCA have included age groups below the average age of patients who are being assessed for cognitive impairment (including participants below the age of 45) [11–15], and some studies have derived norms based on a relatively small normal population [13, 16–18]. Hence, there is a need for normative data from a large population in a representative age group.
Our aim was to generate normative data for the MoCA valid for Swedish population. We analyzed normative scores using data from 746 cognitively healthy participants aged 65–85 years in a population-based study. We also investigated how the variables age, sex, and level of education affect MoCA scores. Moreover, we created a regression model using the significant predictors, to be available in an online calculator for physicians and other professionals to assess cognitive impairment.
METHODS
Study population and demographics
The participants were included from the prospective cohort Malmö Diet and Cancer Study [19], a part of the EPIC study. In the 1990s, 44–74-year-old people living in Malmö were recruited for the study. Over 28,000 subjects completed a baseline examination consisting of a questionnaire, anthropometric measurements, and dietary assessment, corresponding to a participation rate of 40.8% of the eligible city population [20]. The only exclusion criteria that were decided on beforehand were language problems and mental retardation that prevented responders from answering the questionnaire [19]. From this cohort, 6,103 individuals were randomly selected for further examination, and between 2007–2012, there was a reinvestigation where 3,734 people participated [21, 22]. By this time, participants were aged between 65–85. They were consecutively examined with cognitive tests, initially the MMSE and A Quick Test of Cognitive Speed (AQT) [23], but eventually the MoCA was added to the screening. 860 consecutive people were examined with the MoCA together with the other cognitive tests.
The initial questionnaire involved questions on education, smoking, comorbidities, and medications. Participants with common comorbidities, such as high blood pressure and diabetes, were kept in the study so that the normative sample would reflect a true elderly population. There were three options for level of education: primary education/elementary school including up to 10 years of education; secondary school meaning high school including any additional courses; and finally higher education such as a university degree. Participants missing data on education were asked for number of completed education years when assessed with the MoCA, and answers were transformed into education level.
This study was approved by the regional ethical committee at Lund University, Lund, Sweden. A written informed consent was obtained from all participants.
MoCA administration and scoring
The MoCA assesses global cognitive function and contains of 10 subtests. Visuospatial abilities are assessed using a clock-drawing task and a three-dimensional cube copy, short-term memory is tested with two learning trials of five nouns followed by a delayed recall task. Executive functions are assessed using a task adapted from the Trail Making B test, a phonemic fluency task, and a two-item verbal abstraction task. Attention, concentration, and working memory are evaluated using an attention task, a serial subtraction task and digits forward and backward. Language is tested with a naming task with low-familiarity animals (lion, camel, rhinoceros), repetition of two syntactically complex sentences, and the fluency task. Orientation is evaluated by time and place [3]. The participants in our study were evaluated with the Swedish MoCA, version 7.0 (http://www.mocatest.org). Nurses and biomedical scientists experienced in cognitive testing, administered the MoCA. In the original validation study [3], it was suggested that people being evaluated with the MoCA received an extra point to the total score if they had ≤12 years of education. We calculated mean MoCA scores without adding an extra point for low education. To increase the sample sizes of age groups, larger age intervals were created with overlapping age groups according to a previously described method [24], which has been used in other normativestudies [15].
Screening and assessment of cognitive impairment
We screened for cognitive impairment with the MMSE and AQT. The MMSE assesses global cognition with a well-established cut-off for cognitive impairment at <24 points that provides a high specificity [25, 26]. AQT, on the other hand, provides a high sensitivity for impaired attention and executive function [23, 27]. The test score constitutes the number of seconds it takes to fulfil each test plate where the subject should name the color and form of 40 figures [23]. The cut-off for AQT was set at >90 s for cognitive impairment (higher score equals poorer performance). This approximately corresponds to +1 standard deviation (SD) based on a previous normative sample where the mean score was 71.2 s (SD 21.5 s) [28]. The MMSE and AQT administered together improve sensitivity, and have a higher sensitivity than MMSE in combination with Clock Drawing Test [28]. They are thus a suitable complement to each other when evaluating cognitive function.
Extended examination to rule out cognitive impairment
Participants who scored below 24 points on the MMSE, finished the AQT in over 90 s, or reported symptoms of cognitive impairment, were summoned for a clinical investigation at the Memory Clinic of Skåne University Hospital in Sweden. Here, they were evaluated by physicians with special interest in cognitive disorders. Cases with a suspicion of cognitive disorder underwent a thorough dementia investigation. This included a computed tomography of the brain and in a majority of the cases analysis of cerebrospinal fluid amyloid-beta 1–42, total tau, and phosphorylated tau was also performed. Additionally, they underwent neuropsychological testing with the animal and letter S fluency test, cube copying, clock drawing, 10-wordlist of immediate and delayed recall from the Alzheimer’s Disease Assessment Scale-cognitive (ADAS-cog), naming objects from the ADAS-cog and Stroop test (Victorian version). Subjects diagnosed with any type of mild or major neurocognitive disorder (NCD) according to the DSM-5 criteria [29] were excluded from the normative sample. Diagnosis was based on consensus decision by physicians experienced in dementia disorders (S.P., K.N.). Participants not diagnosed with cognitive impairment were re-entered into the normative population.
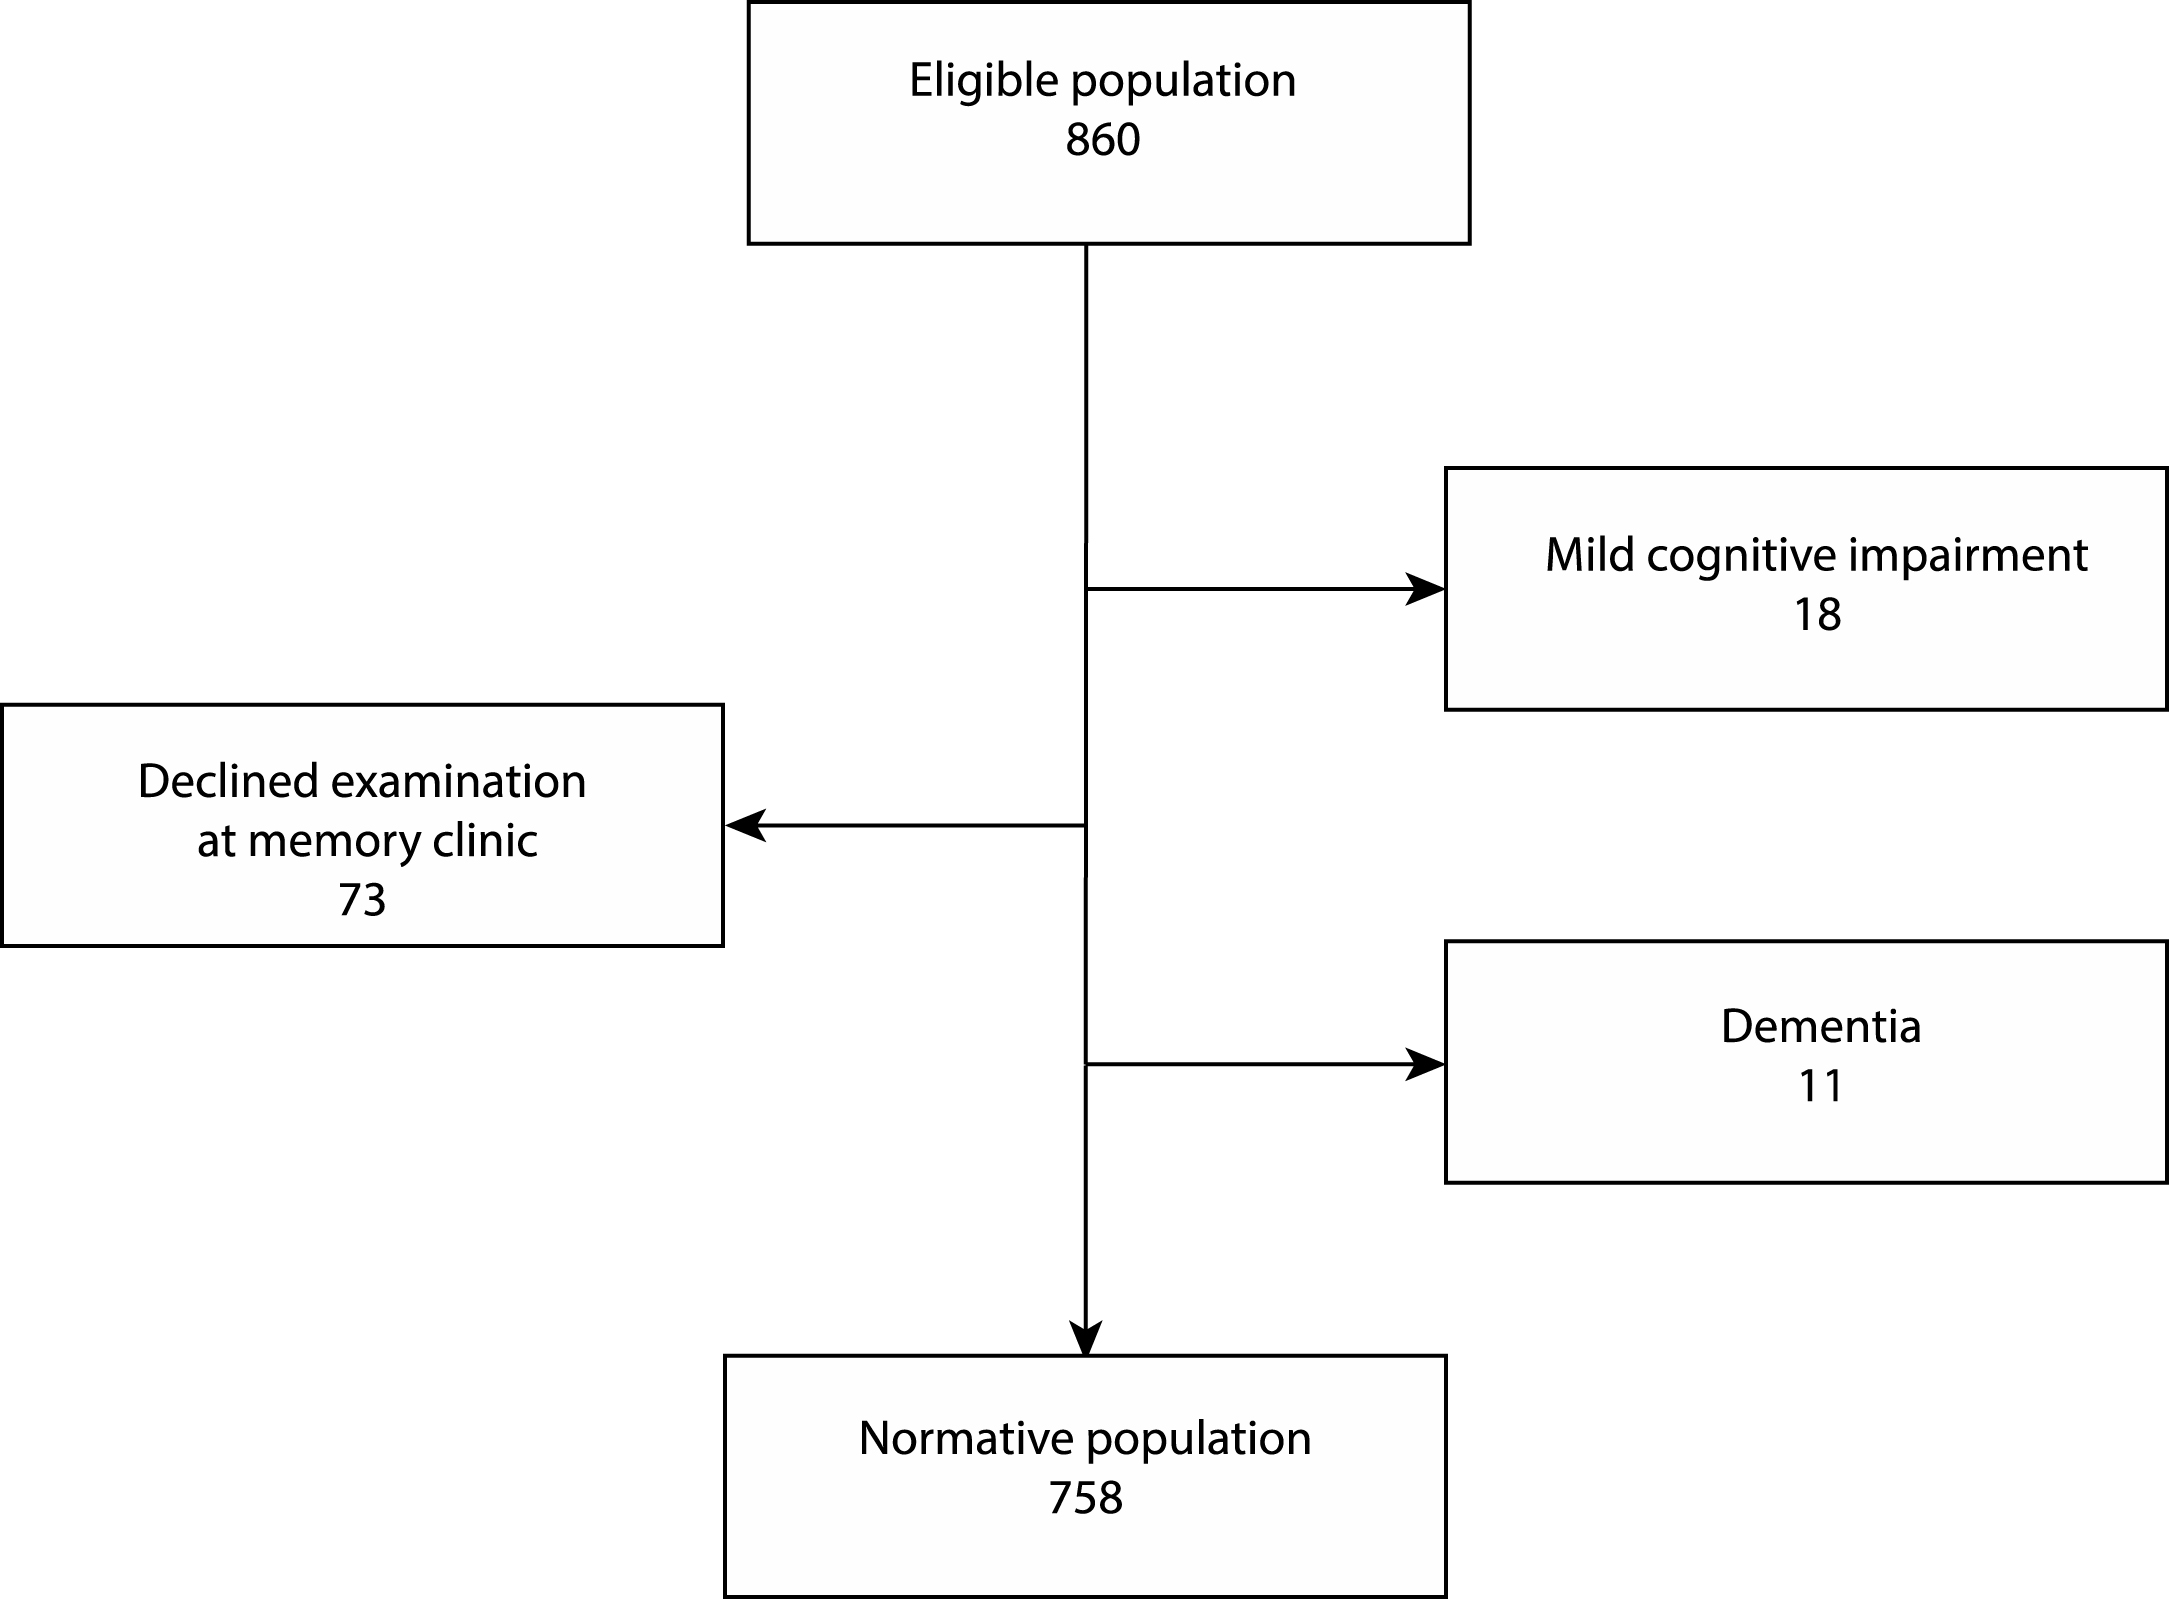
Fig.1
Flow chart of the enrollment process. 860 people completed MoCA together with MMSE and AQT. 133 participants scored <24 on MMSE, >90 on AQT or reported symptoms of cognitive impairment, and were summoned for a clinical investigation at the memory clinic. 31 of these 133 people were assessed as cognitively healthy and re-entered into the normative population and 102 were excluded according to the flowchart.
Statistical analysis
Chi-square tests and the Mann-Whitney U test were used for group comparisons. The different factors’ impact on total MoCA score were analyzed using linear regression and the factors sex, age, level of education, lipid lowering medication, cardiovascular medication, diabetes medication, and smoking were entered separately in linear regression models with MoCA as the dependent variable using a stepwise method. The association between the significant covariates and the MoCA was tested using quadratic, cubic, and logarithmic models, and interaction between variables was tested for. Finally, the significant covariates were entered into a multivariate regression model with MoCA as the dependent variable. To calculate predicted z-scores and percentiles, we used the intercept, the estimates, and the Root Mean Square Error (RMSE) from the final multivariate regression model according to a previously published article [30]. A p-value less than 0.05 was considered significant. For analysis of data we used SPSS (Released 2013. IBM SPSS Statistics for Macintosh, Version 22.0, NY: IBM Corp).
RESULTS
Enrollment
134 of 860 individuals completed the AQT in over 90 s, scored below 24 on the MMSE, or reported symptoms of cognitive impairment, and were summoned for a clinical examination (Fig. 1). Out of the 134 participants, 73 people declined proceeding with an examination and were excluded from the study. Out of the 61 people examined, 18 were diagnosed with MCI, 11 with dementia, and the remaining 32 were considered cognitively healthy and were re-entered into the normative population. The final normative group thus consisted of 758 people: 474 women and 284 men. The mean age for women was 73.3 (SD 5.2) and for men 72.7 (SD 5.0) (p = 0.133).
Table 1
Demographics of the study population
| Normative | Excluded | p-value | |
| group | group | ||
| Age (SD) | 73.1 (5.1) | 75.5 (5.7) | <0.0001 |
| Use of medication, n (%) | |||
| - Cardiovascular | 409 (54.0) | 41 (40.2) | 0.266 |
| - Anti-diabetes | 60 (7.9) | 12 (11.8) | 0.188 |
| - Lipid lowering | 218 (28.8) | 37 (36.3) | 0.119 |
| Education level (%) | 0.002 | ||
| - Primary school* | 63.9 | 79.2 | |
| - Secondary school** | 20.8 | 13.9 | |
| - Higher education*** | 15.3 | 6.9 | |
| Smoking (%) | 0.665 | ||
| - Yes, I smoke or have smoked | 54.8 | 52.5 | |
| - No, I have never smoked | 45.2 | 47.5 | |
| MMSE score, mean (SD) | 27.9 (1.4) | 24.9 (3.1) | <0.0001 |
| AQT score, mean (SD) | 69.9 (13.1) | 107.2 (29.8) | <0.0001 |
| MoCA total score, mean (SD) | 26.0 (2.3) | 21.6 (4.3) | <0.0001 |
| - Visuospatial/Executive abilities | 4.1 (1.0) | 2.9 (1.4) | <0.0001 |
| - Naming | 2.9 (0.3) | 2.7 (0.7) | <0.0001 |
| - Attention digits | 1.8 (0.5) | 1.4 (0.6) | <0.0001 |
| - Attention letters | 1.0 (0.1) | 0.9 (0.2) | 0.007 |
| - Attention subtraction | 2.9 (0.3) | 2.3 (1.0) | <0.0001 |
| - Language repeat | 1.9 (0.4) | 1.4 (0.8) | <0.0001 |
| - Language fluency | 0.7 (0.5) | 0.3 (0.5) | <0.0001 |
| - Abstraction | 1.7 (0.6) | 1.4 (0.8) | <0.0001 |
| - Delayed recall | 3.1 (1.3) | 2.3 (1.5) | <0.0001 |
| - Orientation | 6.0 (0.2) | 5.8 (0.6) | 0.002 |
| Abnormal MoCA score according | 37.3 | 78.4 | <0.0001 |
| to original cut-off (<26), (%) | |||
| Total | 758 | 102 |
*Elementary school or lower, up to 10 years of education. **Graduation from high school/Advanced level including any additional courses. ***University degree. SD, standard deviation. Bold p-values are considered significant (<0.05).
Socio-demographics
The normative group and the excluded group, i.e., cognitively impaired people or people who declined a complementary examination, are described in Table 1. There was a significant difference in the groups’ education level and mean age, which was expected considering that low education and older age both are risk factors for cognitive impairment. There was also a significant difference in the groups’ scores in MMSE, AQT, and MoCA, including every MoCA subtest. 37.3% of the normative group scored below the original cut-off value of 26 compared to 78.4% of the excluded group.
MOCA scores
The mean MoCA score was 26.0 (SD 2.3) for the entire normative population (ages 65–85). The mean (SD) scores stratified on age group and education level are shown in Table 2. The participants scored on average 82% on visuospatial function, 98% on naming, 98% on attention letters, 97% on attention subtraction, 89% on attention digits, 93% on language repeat, 69% on language fluency, 85% on abstraction, 62% on delayed recall, and 99% on orientation. Normative scores for the different parts of MoCA stratified according to age and education are provided in Supplementary Table 1. The mean MoCA score for women was 26.1 (SD 2.3) and for men 25.7 (SD 2.4) (p = 0.006). In Table 3, we present data of calculated cut-off scores ≤1, ≤1.5 and ≤2 SD below the mean score.
Table 2
MoCA scores by age and education level
| Education level | ||||
| Age | Primary | Secondary | Higher | Total |
| group | school* | school** | education*** | by age |
| 65–75 | 25.8 (2.2) | 26.7 (2.1) | 27.1 (1.7) | 26.3 (2.2) |
| n = 327 | n = 112 | n = 95 | n = 534 | |
| 70–80 | 25.4 (2.3) | 26.5 (2.2) | 26.8 (1.7) | 25.9 (2.3) |
| n = 291 | n = 79 | n = 72 | n = 442 | |
| 75–85 | 24.9 (2.4) | 26.0 (2.6) | 26.5 (1.9) | 25.3 (2.5) |
| n = 184 | n = 56 | n = 28 | n = 268 | |
| Total by | 25.5 (2.3) | 26.5 (2.3) | 27.0 (1.8) | 26.0 (2.3) |
| education | n = 484 | n = 158 | n = 116 | n = 758 |
Scores are in mean (standard deviation). *Elementary school or lower, up to 10 years of education. **Graduation from high school/Advanced level including any additional courses. ***University degree.
Table 3
Cut-off scores by age and education level
| Education level | ||||
| Age group | SD below mean | Primary | Secondary | Higher |
| school* | school** | education*** | ||
| 65–75 | ≤1 | 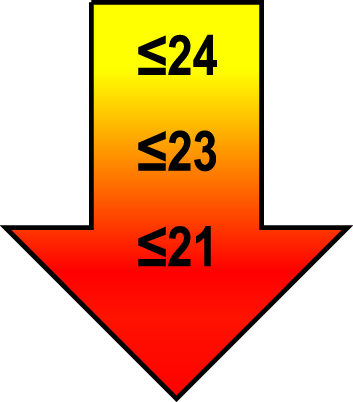 | 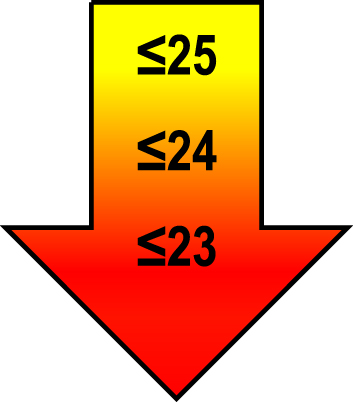 | 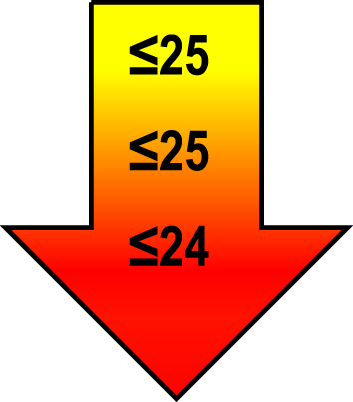 |
| ≤1.5 | ||||
| ≤2 | ||||
| 70–80 | ≤1 | 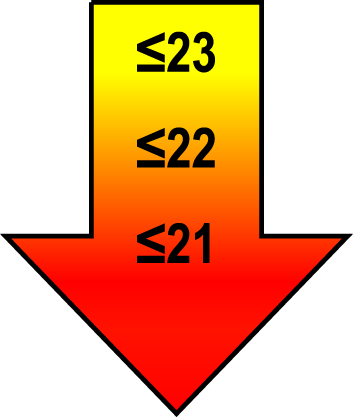 | 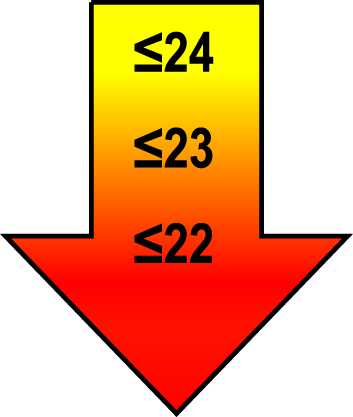 | 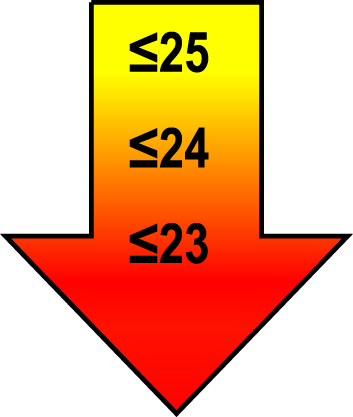 |
| ≤1.5 | ||||
| ≤2 | ||||
| 75–85 | ≤1 | 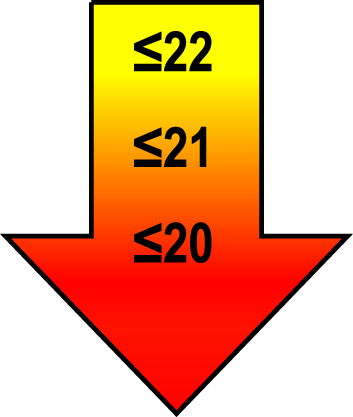 | 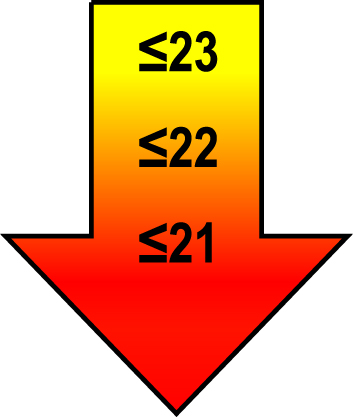 | 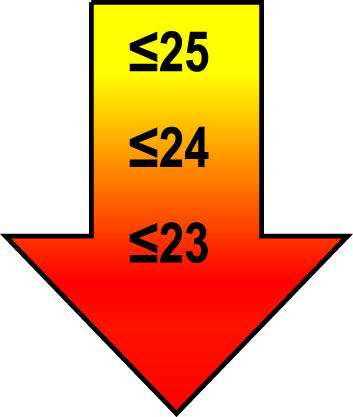 |
| ≤1.5 | ||||
| ≤2 | ||||
Raw MoCA-scores not including an extra point for low education. Arrows show cut-offs at –1 SD (yellow), –1.5 SD (orange), and –2 SD (red) below the mean MoCA score. The cut-offs correspond to the DSM-5 criteria where major neurocognitive disorders s typically perform ≥2 SD below appropriate norms, and mild neurocognitive disorders typically perform in the 1-2 SD range. Cut-offs are preferably chosen in the age group where age is centered midmost in the age interval. *Elementary school or lower, up to 10 years of education. **Graduation from high school/Advanced level including any additional courses. ***University degree. SD, standard deviation.
Regression analysis
The variables sex, level of education, and age were significantly associated with total MoCA score in the univariate models as well as independent significant variables in the multivariate model (r = 0.334, r2 = 0.112) (Table 4). The results show female sex and higher level of education significantly correlating with higher MoCA scores, and older age significantly associating with lower scores. We did not find stronger association between the significant variables with total MoCA score using logarithmic, quadratic or cubic models (data not shown). The other variables entered in the linear regression model did not show significant effect on total MoCA score [lipid lowering medication (standardized β= 0.037, p = 0.338), cardiovascular medication (standardized β= –0.028, p = 0.476), diabetes medication (standardized β= 0.003, p = 0.934), or smoking (standardized β= –0.045, p = 0.209)]. We did not find a significant interaction between variables.
Table 4
Significant predictors of MoCA score in the multivariate regression model
| Standardized | Unstandardized | p-value | |
| beta | beta | ||
| Sex | 0.119 | 0.565 | 0.001 |
| Age | –0.201 | –0.90 | <0.0001 |
| Education level | 0.231 | 0.713 | <0.0001 |
All three variables were also significant in univariate models. Non-significant co-variates were use of anti-diabetes medication, cardiovascular drugs or lipid-lowering drugs, as well as smoking. The intercept of the model was 31.104 and the root mean square error (RMSE) was 2.176.
In the Supplementary Material, we present a regression model for interpreting MoCA scores. The model can be used for individuals being assessed for cognitive impairment, simply by inserting MoCA score, gender (1 = female, 0 = male), level of education (1, 2, 3), and age. The result is shown as a z-score, i.e., SD, and percentiles from the normativemean.
DISCUSSION
We present normative scores for the MoCA from a large cognitively healthy Swedish population-based cohort of 758 elderly individuals aged 65–85 years. We found that higher level of education and female sex were independently associated with higher MoCA scores, and older age with lower scores. Using the cut-off score from the original study, 37.3% of our normative population would have been incorrectly interpreted as cognitively impaired according to our evaluation of the population. The mean score of 26.0 (SD 2.3) was 1.0–4.2 points higher than in other normative studies [13–17, 31–33], though lower than the average score of 27 for cognitively normal participants in the small original study (n = 90 healthy elderly controls). The very large normative study using data from the Dallas Heart Study (n = 2,653) included participants aged 18–85 [15]. They presented a mean score of only 23.4 (SD 4.0) despite a high mean education (13 years) and low mean age (50 years). In the age groups closest corresponding to our study (65–80 years), the mean scores were 16–24 points depending on education level, compared with 25–27 points in our study. Considering their low mean scores and that no other tests for cognitive impairment were conducted, we conclude their study included people with cognitive impairment. It is also possible socio-cultural background may play a role in the study considering the study consisted of ethnically diverse subjects. The largest normative study we found (n = 5,802) from the TILDA study presented mean scores for the age of 65 between 23.1–26.3 depending on education level, compared to 25.8–27.1 in our youngest group. At the age of 85, scores ranged 19.3–23.9 compared to 24.9–26.5 in our oldest group, given of course our groups include larger age groups. The reason why we have found higher scores than in most other studies is probably because we have more thoroughly screened out people with cognitive impairment, deriving a sample of truly cognitively healthy elderly. However, we do not believe that our population consists of “super normal” participants since we did not just use an automated algorithm to screen out subjects. The participants who were screened out, were then assessed at a memory clinic (some using longitudinal follow-up visits), and re-entered into the normative sample if not diagnosed with MCI, dementia, or any type of neurodegenerative disease.
Consistent with previous findings, older age was associated with lower scores [11–18, 31–35]. We found a 1.0-point difference between the youngest (65–75) and oldest (75–85) groups; other studies have reported a difference of 0.6–2.4 points between similar age groups [13, 15–17, 31]. Lower level of education was significantly associated with lower scores, correlating with results from other studies [11–18, 31–35]. The difference in mean score was 1.4 points between the least and highest educated groups, in agreement with the original suggested method of adding an extra point for low education (≤12 years). Gender was significantly associated with MoCA score, with a mean for men of 0.45 points below the mean for women. This is consistent with a Greek normative study showing a difference in mean of 0.3 points between sexes [11]. In a study by Larouche et al., in which mean scores were not presented, male sex was also a negative predictive factor in their regression model [12]. The Irish study by Kenny et al. also found differences between men and women were statistically significant, however, relatively minor why they chose not to stratify after sex [35]. Given the effects of age, education, and gender, a sharp cut-off point as suggested in the original MoCA study [3] is not as optimal as when all factors are taken into account to evaluate the result. In the multivariate regression model, we found that the effect sizes of age and education on MoCA scores were similar and twice that of gender (standardized betas of –0.20 and 0.23, respectively, compared with 0.12). We have only found one previously presented regression model for the MoCA [12]. That study included participants from the age of 41, and participants were not physician-evaluated to exclude people with cognitive impairment. Using their suggested model on our population shows their equation does not fit an elderly population such as ours. Giving an example of an 85-year-old woman with 17 years of education (corresponding to education level 3), the previous equation would calculate an expected score of 31.5, compared to 26.2 with our model. Considering 31.5 is above maximum score, and well-educated elderly are a growing population, we claim our regression model to be moreversatile.
A shortcoming of the study is the small amount of individuals in the oldest age group with a university degree (n = 28), which in the future in an aging population will be more common. On the other hand, the elderly of today mostly have a low education and in this norm group we had a large subsample (n = 184) compared to the largest normative study (n = 2,653) where their corresponding norm group (70–80 years old, <12 years of education) only consisted of 14 participants. This highlights a strength of the present study, which is that we have used a large suitable age group of elderly people, corresponding to the typical patient group being assessed for cognitive impairment.
In DSM-5, performance of neuropsychological testing for neurocognitive disorders is suggested for major neurocognitive disorder (corresponding to dementia level) as 2 SD below appropriate norms, and for mild neurocognitive disorder (corresponding to MCI level) performance typically lies in the 1-2 SD range below a normative mean [29]. Based on these guidelines, appropriate cut-offs stratified on age and education are presented in Table 3. When interpreting an individual’s score, the ≤–2 SD cut-off should be considered a clear cognitive impairment, while a score of ≤–1 SD is just indicative of cognitive impairment and these individuals should be further examined or followed longitudinally to ensure the diagnosis. In a clinical situation, there are of course many other reasons besides cognitive impairment that can explain a low score (language difficulties, cultural differences, motivation, etc.). Because of the overlapping age groups in Table 3, the group where age is midmost in age intervals should be selected. To account for all significant predictors of MoCA score (age, education, and gender) as well as the exact age of the patient, we instead recommend using the regression-based calculator in the online supplement. This regression-based approach has also been shown to give a more accurate classification of cognitive impairment compared to a traditional stratification as in Table 3 [36].
To conclude, we believe that the presented normative data for the MoCA will facilitate the assessment and interpretation of MoCA scores in clinical practice using the cut-offs in Table 3 and the online calculator. Emerging disease-modifying treatments will demand early diagnostics of cognitive impairment [37], and with normative data of the MoCA, this can advance the timespan from suspected disease to treatment. In future studies, more normative data should be examined in the growing population of oldest old with a high education. Another important future step is to collect data from primary care settings to decide on sensitivity and specificity as well as positive and negative predictive values for identifying cognitive impairment with the MoCA.
ACKNOWLEDGMENTS
The study was supported by the Strategic Research Area MultiPark (Multidisciplinary Research in Parkinson’s disease) at Lund University, the Swedish federal government under the ALF agreement, the Medical Research Council of Sweden (grant K2011-65X-20752-04-6), the Region Skåne County Council, and the Ernhold Lundstrom Foundation.
Authors’ disclosures available online (http://j-alz.com/manuscript-disclosures/17-0203r1).
SUPPLEMENTARY MATERIAL
[1] The supplementary material is available in the electronic version of this article: http://dx.doi.org/10.3233/JAD-170203.
REFERENCES
[1] | Prince M , Bryce R , Albanese E , Wimo A , Ribeiro W , Ferri CP ((2013) ) The global prevalence of dementia: A systematic review and metaanalysis. Alzheimers Dement 9: , 63–75 e62. |
[2] | Ismail Z , Rajji TK , Shulman KI ((2010) ) Brief cognitive screening instruments: An update. Int J Geriatr Psychiatry 25: , 111–120. |
[3] | Nasreddine ZS , Phillips NA , Bedirian V , Charbonneau S , Whitehead V , Collin I , Cummings JL , Chertkow H ((2005) ) The Montreal Cognitive Assessment, MoCA: A brief screening tool for mild cognitive impairment. J Am Geriatr Soc 53: , 695–699. |
[4] | Biundo R , Weis L , Bostantjopoulou S , Stefanova E , Falup-Pecurariu C , Kramberger MG , Geurtsen GJ , Antonini A , Weintraub D , Aarsland D ((2016) ) MMSE and MoCA in Parkinson’s disease and dementia with Lewy bodies: A multicenter 1-year follow-up study. J Neural Transm 123: , 431–438. |
[5] | Burton L , Tyson SF ((2015) ) Screening for cognitive impairment after stroke: A systematic review of psychometric properties and clinical utility. J Rehabil Med 47: , 193–203. |
[6] | Villeneuve S , Pepin V , Rahayel S , Bertrand JA , de Lorimier M , Rizk A , Desjardins C , Parenteau S , Beaucage F , Joncas S , Monchi O , Gagnon JF ((2012) ) Mild cognitive impairment in moderate to severe COPD: A preliminary study. Chest 142: , 1516–1523. |
[7] | Cameron J , Worrall-Carter L , Page K , Stewart S , Ski CF ((2013) ) Screening for mild cognitive impairment in patients with heartfailure: Montreal cognitive assessment versus mini mental stateexam. Eur J Cardiovasc Nurs 12: , 252–260. |
[8] | Ogurel T , Ogurel R , Ozer MA , Turkel Y , Dag E , Ornek K ((2015) ) Mini-mental state exam versus Montreal Cognitive Assessment in patients with diabetic retinopathy. Niger J Clin Pract 18: , 786–789. |
[9] | Tiffin-Richards FE , Costa AS , Holschbach B , Frank RD , Vassiliadou A , Kruger T , Kuckuck K , Gross T , Eitner F , Floege J , Schulz JB , Reetz K ((2014) ) The Montreal Cognitive Assessment (MoCA) - a sensitive screening instrument for detecting cognitive impairment in chronic hemodialysis patients. PLoS One 9: , e106700. |
[10] | Davis DH , Creavin ST , Yip JL , Noel-Storr AH , Brayne C , Cullum S ((2015) ) Montreal Cognitive Assessment for the diagnosis of Alzheimer’s disease and other dementias. Cochrane Database Syst Rev, CD010775. |
[11] | Konstantopoulos K , Vogazianos P , Doskas T ((2016) ) Normative data of the Montreal Cognitive Assessment in the Greek population and parkinsonian dementia. Arch Clin Neuropsychol 31: , 246–253. |
[12] | Larouche E , Tremblay MP , Potvin O , Laforest S , Bergeron D , Laforce R , Monetta L , Boucher L , Tremblay P , Belleville S , Lorrain D , Gagnon JF , Gosselin N , Castellano CA , Cunnane SC , Macoir J , Hudon C ((2016) ) Normative data for the Montreal Cognitive Assessment in middle-aged and elderly Quebec-French people. Arch Clin Neuropsychol 31: , 819–826. |
[13] | Santangelo G , Siciliano M , Pedone R , Vitale C , Falco F , Bisogno R , Siano P , Barone P , Grossi D , Santangelo F , Trojano L ((2015) ) Normative data for the Montreal Cognitive Assessment in an Italian population sample. Neurol Sci 36: , 585–591. |
[14] | Freitas S , Simoes MR , Alves L , Santana I ((2011) ) Montreal Cognitive Assessment (MoCA): Normative study for the Portuguese population. J Clin Exp Neuropsychol 33: , 989–996. |
[15] | Rossetti HC , Lacritz LH , Cullum CM , Weiner MF ((2011) ) Normative data for the Montreal Cognitive Assessment (MoCA) in a population-based sample. Neurology 77: , 1272–1275. |
[16] | Malek-Ahmadi M , Powell JJ , Belden CM , O’Connor K , Evans L , Coon DW , Nieri W ((2015) ) Age- and education-adjusted normative data forthe Montreal Cognitive Assessment (MoCA) in older adultsage 70-99. Neuropsychol Dev Cogn B Aging Neuropsychol Cogn 22: , 755–761. |
[17] | Conti S , Bonazzi S , Laiacona M , Masina M , Coralli MV ((2015) ) Montreal Cognitive Assessment (MoCA)-Italian version: Regression based norms and equivalent scores. Neurol Sci 36: , 209–214. |
[18] | Kopecek M , Stepankova H , Lukavsky J , Ripova D , Nikolai T , Bezdicek O ((2017) ) Montreal Cognitive Assessment (MoCA): Normative data for old and very old Czech adults. Appl Neuropsychol Adult 24: , 23–29. |
[19] | Manjer J , Carlsson S , Elmstahl S , Gullberg B , Janzon L , Lindstrom M , Mattisson I , Berglund G ((2001) ) The Malmo Diet and Cancer Study: Representativity, cancer incidence and mortality in participants and non-participants. Eur J Cancer Prev 10: , 489–499. |
[20] | Manjer J , Elmstahl S , Janzon L , Berglund G ((2002) ) Invitation to a population-based cohort study: Differences between subjects recruited using various strategies. Scand J Public Health 30: , 103–112. |
[21] | Gottsater M , Ostling G , Persson M , Engstrom G , Melander O , Nilsson PM ((2015) ) Non-hemodynamic predictors of arterial stiffness after 17 years of follow-up: The Malmo Diet and Cancer study. J Hypertens 33: , 957–965. |
[22] | Rosvall M , Persson M , Ostling G , Nilsson PM , Melander O , Hedblad B , Engstrom G ((2015) ) Risk factors for the progression of carotid intima-media thickness over a 16-year follow-up period: The Malmo Diet and Cancer Study. Atherosclerosis 239: , 615–621. |
[23] | Palmqvist S , Minthon L , Wattmo C , Londos E , Hansson O ((2010) ) A Quick Test of cognitive speed is sensitive in detecting early treatment response in Alzheimer’s disease. Alzheimers Res Ther 2: , 29. |
[24] | Pauker JD ((1988) ) Constructing overlapping cell tables to maximize the clinical usefulness of normative test data: Rationale and an example from neuropsychology. J Clin Psychol 44: , 930–933. |
[25] | Folstein MF , Folstein SE , McHugh PR ((1975) ) “Mini-mental state”. A practical method for grading the cognitive state of patients for the clinician. J Psychiatr Res 12: , 189–198. |
[26] | Creavin ST , Wisniewski S , Noel-Storr AH , Trevelyan CM , Hampton T , Rayment D , Thom VM , Nash KJ , Elhamoui H , Milligan R , Patel AS , Tsivos DV , Wing T , Phillips E , Kellman SM , Shackleton HL , Singleton GF , Neale BE , Watton ME , Cullum S ((2016) ) Mini-MentalState Examination (MMSE) for the detection of dementia inclinically unevaluated people aged 65 and over in community andprimary care populations. Cochrane Database Syst Rev, CD011145. |
[27] | Jacobson JM , Wiig EH ((2005) ) New developments in cognitive testing. Long-Term Care News, pp. 10–14. |
[28] | Kvitting AS , Wimo A , Johansson MM , Marcusson J ((2013) ) A quick test of cognitive speed (AQT): Usefulness in dementia evaluations in primary care. Scand J Prim Health Care 31: , 13–19. |
[29] | American Psychiatric Association ((2013) ) Diagnostic and Statistical Manual of Mental Disorders, Arlington, VA. |
[30] | Shirk SD , Mitchell MB , Shaughnessy LW , Sherman JC , Locascio JJ , Weintraub S , Atri A ((2011) ) A web-based normative calculator for the uniform data set (UDS) neuropsychological test battery. Alzheimers Res Ther 3: , 32–32. |
[31] | Narazaki K , Nofuji Y , Honda T , Matsuo E , Yonemoto K , Kumagai S ((2013) ) Normative data for the montreal cognitive assessment in a Japanese community-dwelling older population. Neuroepidemiology 40: , 23–29. |
[32] | Mellor D , Lewis M , McCabe M , Byrne L , Wang T , Wang J , Zhu M , Cheng Y , Yang C , Dong S , Xiao S ((2016) ) Determining appropriate screening tools and cut-points for cognitive impairment in an elderly Chinese sample. Psychol Assess 28: , 1345–1353. |
[33] | Lu J , Li D , Li F , Zhou A , Wang F , Zuo X , Jia XF , Song H , Jia J ((2011) ) Montreal cognitive assessment in detecting cognitive impairment in Chinese elderly individuals: A population-based study. J Geriatr Psychiatry Neurol 24: , 184–190. |
[34] | Tan JP , Li N , Gao J , Wang LN , Zhao YM , Yu BC , Du W , Zhang WJ , Cui LQ , Wang QS , Li JJ , Yang JS , Yu JM , Xia XN , Zhou PY ((2015) ) Optimal cutoff scores for dementia and mild cognitive impairment of the Montreal Cognitive Assessment among elderly and oldest-old Chinese population. J Alzheimers Dis 43: , 1403–1412. |
[35] | Kenny RA , Coen RF , Frewen J , Donoghue OA , Cronin H , Savva GM ((2013) ) Normative values of cognitive and physical function in older adults: Findings from the Irish Longitudinal Study on Ageing. J Am Geriatr Soc 61: (Suppl 2), S279–290. |
[36] | Pirraglia E , Lobach I , De Santi S , Karantzoulis S , Glodzik L , de Leon M ((2012) ) A comparison of methods for deriving normative scores for evaluating cognitive impairment. Alzheimers Dement 8: , P541–P542. |
[37] | Sevigny J , Chiao P , Bussiere T , Weinreb PH , Williams L , Maier M , Dunstan R , Salloway S , Chen T , Ling Y , O’Gorman J , Qian F , Arastu M , Li M , Chollate S , Brennan MS , Quintero-Monzon O , Scannevin RH , Arnold HM , Engber T , Rhodes K , Ferrero J , Hang Y , Mikulskis A , Grimm J , Hock C , Nitsch RM , Sandrock A ((2016) ) The antibody aducanumab reduces Abeta plaques in Alzheimer’s disease. Nature 537: , 50–56. |


