
Iron Concentration in Deep Gray Matter Structures is Associated with Worse Visual Memory Performance in Healthy Young Adults
Abstract
Abnormally high deposition of iron can contribute to neurodegenerative disorders with cognitive impairment. Since previous studies investigating cognition-brain iron accumulation relationships focused on elderly people, our aim was to explore the association between iron concentration in subcortical nuclei and two types of memory performances in a healthy young population. Gender difference was found only in the globus pallidus. Our results showed that iron load characterized by R2* value on the MRI in the caudate and putamen was related to visual memory, while verbal memory was unrelated to iron concentration.
INTRODUCTION
Iron is considered to play a major role in many biological processes in the central nervous system. It is primarily located in subcortical brain regions, basal ganglia, cerebellar nuclei, and hippocampi [1]. Pathological iron accumulation can contribute to numerous neurological disorders, including Alzheimer’s disease (AD), Parkinson’s disease, Huntington’s disease, dementia with Lewy Bodies, focal cervical dystonia, and multiple sclerosis [2–8]. Pathological studies of patients with AD revealed that excessive iron accumulation can contribute to the formation of free radicals, which can result in cell death and cell membrane damage [9, 10].
Quantitative magnetic resonance imaging (MRI) techniques, such as mapping of the R2* relaxation rate (1/T2*), represent an indirect measure of iron which is a sensible and reproducible measure of tissue iron content [11–15].
Only few studies investigated the association between brain iron and cognitive performance in nondemented adults [7, 15, 17]. The major drawback of all these studies is that they include middle- and old-aged subjects, while neurodegenerative disorders can be present in these age groups with a high likelihood even without clinical signs. To our knowledge, no studies have investigated the relationship between iron concentration and cognitive performance in healthy young adults. Here our aim was to explore the association between iron concentration in subcortical nuclei and memory performance in the healthy young population.
METHODS
Participants
Fifty-nine healthy university students (26 males) aged between 18 and 30 (mean±SD: 22.5±2.4 years) were included. Subjects with chronic illnesses, neurological or psychiatric disorders were not included. Subjects underwent MRI measurements, cognitive testing assessing verbal memory, visual memory, and intelligence. According to the Wechsler Intelligence Scale mean IQ score was 123.7 (SD = 7.0, min = 110, max = 138).
The study was approved by the local ethical committee and all subjects gave written informed consent.
Rey-osterrieth complex figure test
The Rey-Osterrieth complex figure (ROCF) test is widely used in clinical and research settings to assess non-verbal visuoperceptual and visual memory [18, 19]. To perform the ROCF, a figure was placed in front of the subject, who was requested to copy the figure as accurately as possible. After a 30-min delay, subjects were asked to reproduce the figure from memory without forewarning. Scoring followed the procedure as described in the original manual [20].
Since nearly all of the participants reached maximum scores on the direct copying task, only the scores of delayed recall were analyzed in our study.
Rey auditory-verbal learning test
The Rey Auditory-Verbal Learning Test (RAVLT) measures short-term verbal memory and verbal learning [21]. A list of 15 substantives (list A) is read aloud to the subject five consecutive times. Each of the attempts was followed by a test of spontaneous retrieval. After the fifth attempt, a list of interference, also comprising 15 substantives (list B), was read to the subject, followed by its retrieval. After attempt B1, the examiner asked the individual to recall the words from list A, without reading it again. After a 30-min interval, the examiner asked the individual to remember the words from list A (Trial A7) without reading this list.
Only the scores of the Trial 73/4the number of correctly recalled words after the 30-min interval3/4were analyzed in the study.
Magnetic resonance imaging and data analysis
All measurements were performed on a 3T Siemens MAGNETOM Trio MRI scanner with a12-channel head coil.
For R2* mapping, a multi-echo 3D FLASH sequence with 12 equally spaced echoes (TR/TE1 =47/3.58 ms; inter-echo spacing = 3.53 ms; Flip Angle = 16°; 104 axial slices; slice thickness = 1 mm; FOV = 208×256 mm2; matrix size = 208×256; receiver bandwidth = 300 Hz/pixel) was used. The shortest echo time was limited by the resolution selected, while the longest one was chosen based on the expected T2* of the deep gray matter structures [22]. For tissue segmentation and registration, a T1-weighted 3D magnetization-prepared rapid gradient echo (MPRAGE) sequence was utilized using the following parameters: R/TI/TE = 2530/1100/3.37 ms; Flip Angle = 7°; 176 sagittal slices; slice thickness = 1 mm; FOV = 256×256 mm2; matrix size = 256×256; receiver bandwidth = 200 Hz/pixel.
Four deep gray matter structures (left and right thalamus, caudate, putamen, and globus pallidus) were segmented automatically on T1-weighted MPRAGE images using FIRST [23]. The quality of segmentations was visually checked for all participants.
R2* maps were calculated by voxel-wise nonlinear least-squares fitting of the mono-exponential signal decay over echo time (i.e., STE = S0·e–TE·R2 *, where STE is the measured signal intensity at time TE and S0·is a constant) using Matlab (MathWorks, Natick, MA).
In order to derive R2* values of the deep gray matter structures, R2* map of each subject was linearly registered to that subject’s MPRAGE image (6 degrees-of-freedom linear fit) using FLIRT [24]. Finally, the inverse of the spatial transformation from R2* map to MPRAGE space was applied to align the segmented brain masks to R2* map space, where R2* values were obtained.
The resulting masks were eroded by using a 3D kernel of 3×3×3 voxels to avoid partial volume effects and to minimize possible impacts of misregistration between R2* maps and MPRAGE images. R2* values were calculated for the eroded deep gray matter structures and obtained separately for both the left and the right sides of the structures (Fig. 1). Finally, mean R2* values were calculated for each deep gray matter structure by averaging the means from the left and right hemispheres.
Fig.1
A representative image of deep grey matter structures (cyan, left thalamus; yellow, right thalamus; pink, left globus pallidus; green, right globus pallidus; blue, left putamen; red, right putamen; grey, left caudate; brown, right caudate).
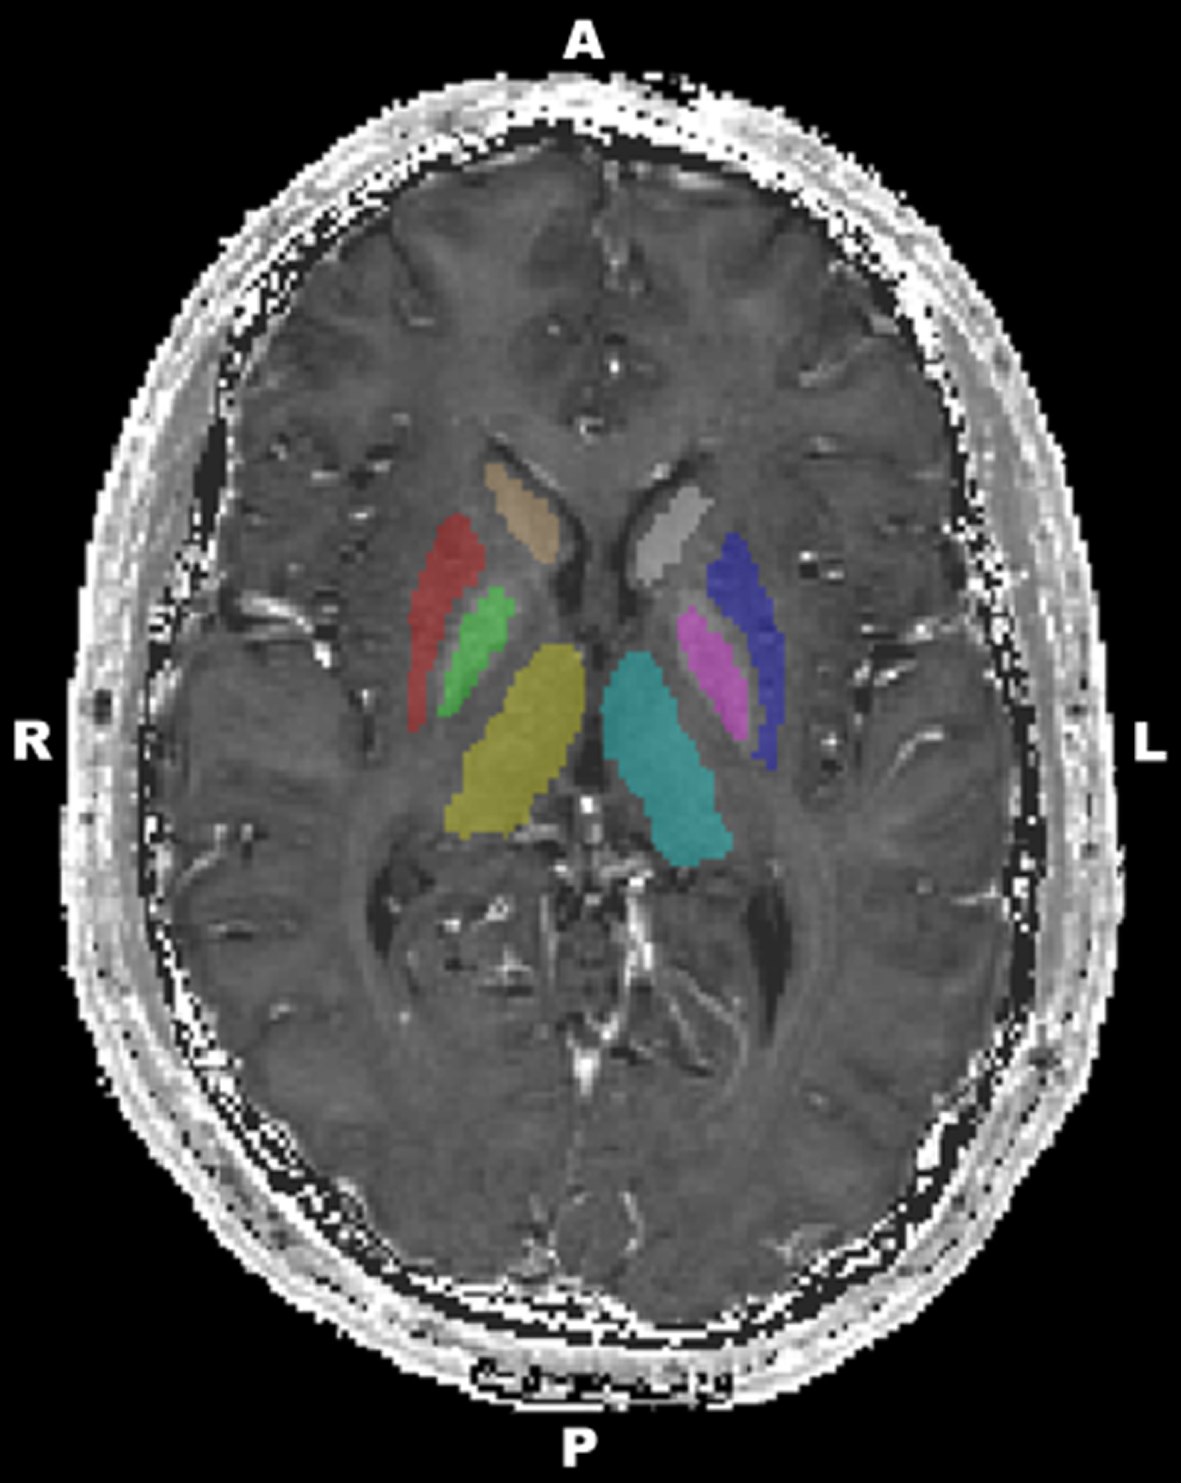
An internal white matter reference was added to the figures (for more details, see [25]). A free-hand region of interest (ROI) was drawn in the left centrum semiovale on a given axial slice of MNI152 standard-space 1 mm T1-weighted average structural template image (Supplementary Figure 1). In order to derive R2* values of this ROI, the MNI152 standard-space image was linearly registered to R2* map of each subject using FLIRT. Then the spatial transformation from MNI standard-space to R2* map was applied to align the ROI to R2* map space, where R2* values were obtained. Finally, R2* values were calculated for each individual separately.
Statistical analyses
Each variable was tested for normality using Kolmogorov–Smirnov test; only age deviated significantly from normal distribution. Gender differences were assessed by using independent samples t-tests. Age deviated significantly from normal distribution, therefore the associations between age and R2* values were tested using nonparametric Spearman correlation analyses. Some previous studies showed that age and gender significantly correlate with R2* values [1, 5, 7, 26]. Therefore, we controlled for the effect of age and gender in separate multiple linear regression models, in which R2* values were used as the independent and cognitive parameters were used as dependent variables. The assumptions of linear regressions were satisfied, as judged by testing for linearity, normality assumptions of the residues, outliers, independence of errors, homoscedasticity, and multi-collinearity [27]. Data analysis was performed using SPSS statistical software ® version 22.0 (IBM Corp. Released 2013. IBM SPSS Statistics for Windows, Version 22.0. Armonk, NY:IBM Corp.).
RESULTS
Significant gender difference was found in the globus pallidus and centrum semiovale. According to the independent samples t-tests, females showed higher R2* values in the globus pallidus and smaller in the centrum semiovale (Table 1). Age was positively correlated with R2* values in the thalamus, caudate, and putamen (Supplementary Figure 2).
Table 1
Median, gender- and age-effects on iron levels. One asterisk denotes p < 0.05, two asterisks denote p < 0.01
| Brain regions | Median (IQR) (male) | Median (IQR) (female) | Gender differences | Age |
| t | Spearman’s rho | |||
| Thalamus | 19.30 (1.25) | 19.41 (1.31) | –0.302 | 0.316* |
| Caudate | 18.72 (1.17) | 19.34 (1.74) | –0.493 | 0.439** |
| Putamen | 20.78 (2.02) | 21.37 (2.74) | –0.141 | 0.515** |
| Globus pallidus | 33.09 (4.33) | 34.65 (4.69) | –2.098* | 0.120 |
| Centrum semiovale | 18.8 (1.55) | 18.2 (1.09) | 2.539* | –0.025 |
Cognitive scores showed no gender differences. The mean score (SD) in the ROCF was 22.65 (6.63) in males and 23.91 (6.31) in females. The mean score (SD) in the RAVLT was 12.77 (2.32) in males and 13.33 (1.85) in females.
Multivariate analyses controlling for age and gender
R2* variables and cognitive parameters were used in multivariate analyses to control for age and gender (Fig. 2). In this analysis, the associations between visual memory and R2* values were significant in the caudate (ß= –0.313, 95% CI –3.065, –0.044, p = 0.044) and putamen (ß= –0.326, 95% CI –2.356, –0.013, p = 0.048), while R2* values in the thalamus and globus pallidus showed no significant relationships.
Fig.2
Scatterplots representing the relationships between performance on memory tasks and iron content in deep gray matter structures and Centrum Semiovale (control region). The correlations in the caudate and putamen were significant after correction for age andgender.
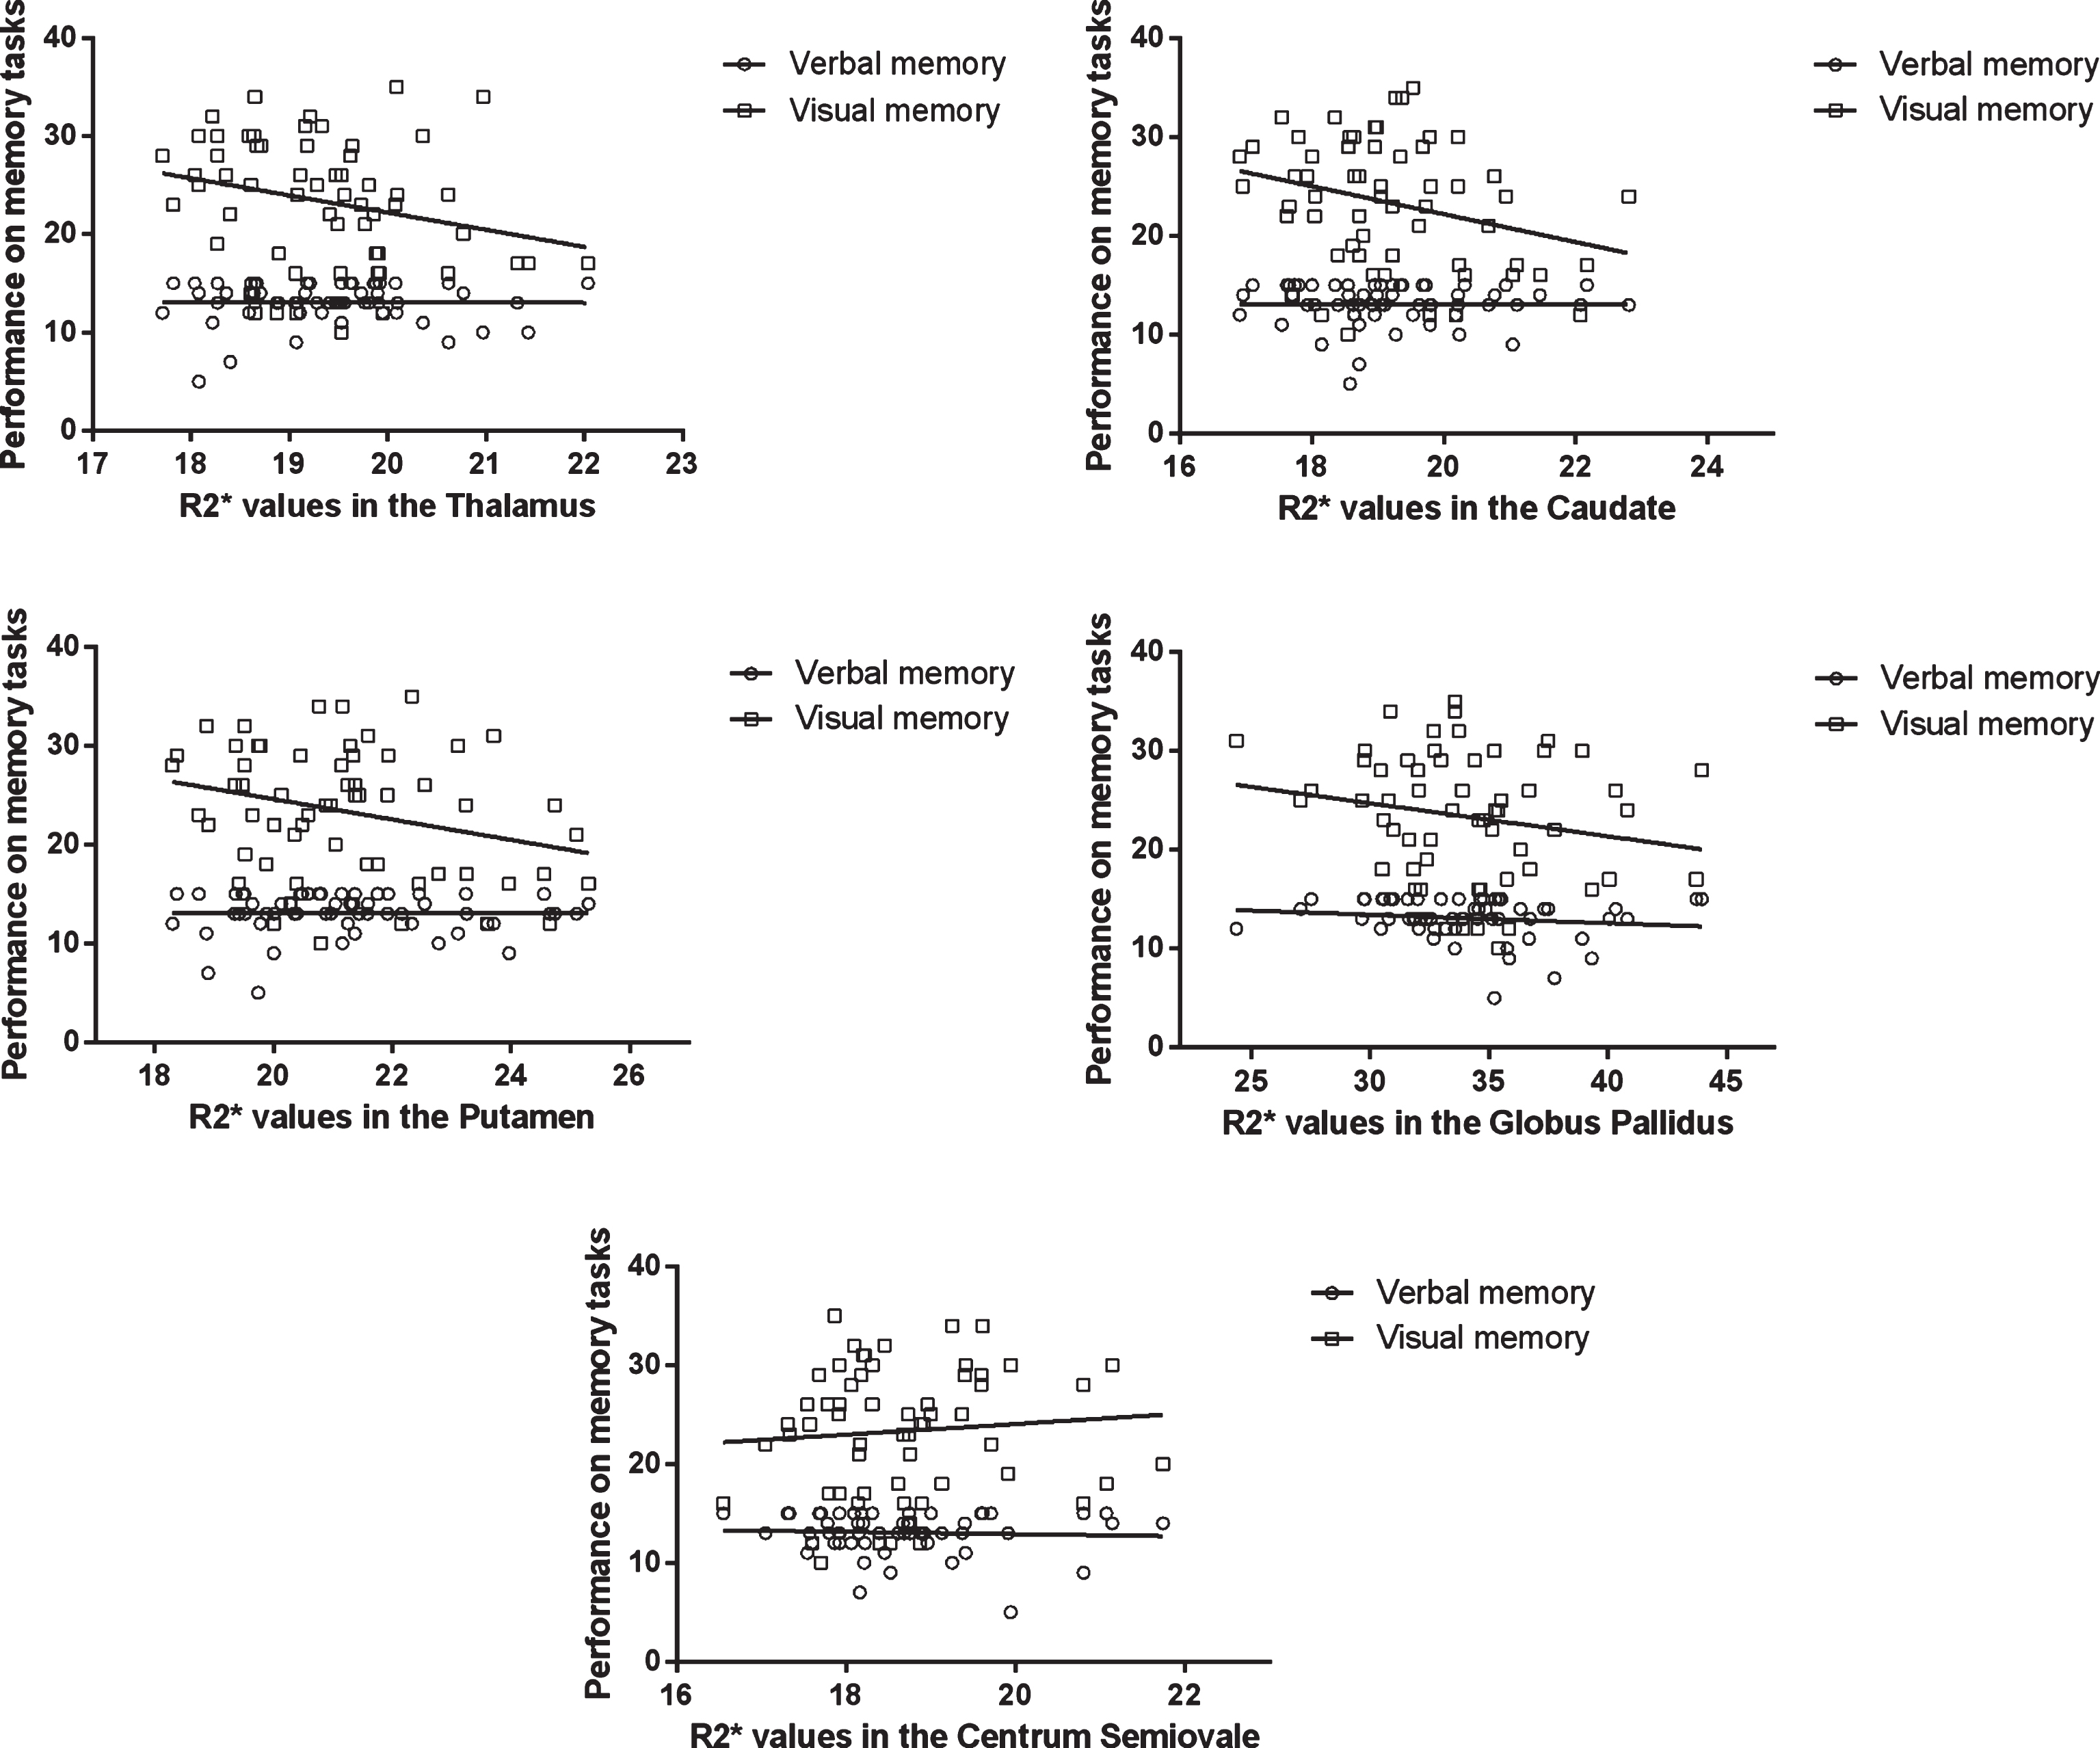
Verbal memory was unrelated to R2* values in deep gray matter structures.
DISCUSSION
As far as we know, this is the first study examining the relationship between cognitive performance and brain iron content as assessed by R2* values and in healthy young adults. Our main findings are that iron loads in the caudate and putamen were related to visual memory independently of the age-related iron increase. However, verbal memory was unrelated to iron concentration. In accordance with some previous findings, iron accumulation significantly increased with age in the thalamus, caudate, and putamen [26, 28, 29], and the pattern of mean R2* values was similar to those observed in previous studies (e.g., highest level in the pallidum) [30–32]. These similarities suggest that the differences in our study were also related to iron concentration and not to other factors, such as other minerals. However, since mean iron concentration in brain structures is strongly connected to age, and to our knowledge this is the first study investigating a young sample (with mean age of 22.5), it is difficult to compare our results to previousfindings.
Iron concentration in healthy young individuals with normal cognitive profile have so far been neglected in the literature. Our data showed moderate positive associations with age, particularly in the putamen, thalamus, and caudate. These findings are consistent with studies focusing on elderly people or patients with neurodegenerative disorders [1, 28, 33] and emphasize that age-related increase in the iron content of brain tissues is the most remarkable in earlier life stage [34]. However, several MRI imaging methods were found to strongly correlate with age and postmortem cortical iron staining (including phase imaging, R2 mapping, T2 weighting, and Field-dependent R2 increase). R2*, which was used in our study, appears to be the most reliable and least time-consuming method according to some previous studies [8, 35, 36].
In this study, we found associations between R2* values in deep gray matter structures and visual memory in healthy young adults with normal cognitive profile. Our results are in accordance with several previous findings performed in elderly. Penke et al. [17] found a negative association between iron deposition at age 72 and general cognitive ability at age 11, implicating that early life general cognitive ability leads to important lifestyle differences that influence the amount of iron in the brain on later life periods. Supporting evidence comes from a longitudinal study of Lozoff and colleagues [37]. They found that children who received iron-fortified formula as infants had worse cognitive scores at 10 years than those receiving low-iron formula. The test scores were also associated with hemoglobin level showing better cognitive performance in low hemoglobin group. Our study is also in agreement with the earlier reports of associations of cognitive tasks with iron, although the pattern of related cognitive skills and brain structures are inconsistent [16, 38–41]. These results including our findings suggest that brain iron accumulation is in correlation with cognitive performance inall ages.
One possible, but highly speculative, explanation indicates the role of brain iron concentration as a marker of AD. Some clinical studies tried to find when the neuropathology of AD begins and if there are any reliable early markers of the disease. Borenstein et al. [42] reviewed the topic and suggested that several risk factors are present in AD and it is best to consider it in a life-course framework. One of these potential risk factors is the reduced cognitive and intellectual reserve [43]. The study of Fox and colleagues [44] also demonstrates that memory loss in AD is detectable years before symptoms appear. However, studies regarding iron accumulation are even more sparse; only one study was found. In that paper, Bartzokis et al. [45] found no correlation between the length of illness and iron levels in basal ganglia, suggesting that iron increase in AD is not caused by the illness, rather it might be interpreted as a risk factor for the disease. They also found that iron levels in the putamen, globus pallidus, and caudate are the most prominent in patients with young-onset AD (age < 70). Data from these observational studies suggest that brain iron accumulation may be a risk factor in developing AD. More studies are needed to explore the mechanism of this potentialassociation.
The findings reported here should be interpreted in the context of the study limitations. First, R2* is a reliable but not a specific measure of iron in brain tissues and R2* values can be influenced by other elements, such as calcium [46]. Second, our study focused only on visual and verbal memory performance. Future studies with more extended assessments and longitudinal design are needed to get a clearer picture about the affected cognitive domains. Third, R2* data regarding hippocampus were not used in this study although it plays crucial role in memory functions. The reason is that hippocampus is a complex anatomical region which is difficult to study with R2* due to partial volume effects and due to susceptibility effects from the temporal bone and nearby air–tissue interfaces [47].
However, it is well known that the pathophysiological process of AD begins decades before the diagnosis [48] and the development of early biomarkers that detect asymptomatic AD became a priority, yet there is still a need to find new paths to determine them [49]. We may presume that early age brain iron detection is a promising way for future studies in the field.
ACKNOWLEDGMENTS
This work was supported by Grants SROP-4.2.1.B-10/2/KONV-2010-0002, SROP-4.2.2/A-11/1/KONV-2012-0017, PTE ÁOK-KA-2013/34039, PTE ÁOK-KA-2017-05, PTE ÁOK-KA-2017-06, Hungarian Brain Research Program –Grant No. KTIA_13_NAP-A-II/9 and EFOP-3.6.1.-16-2016-00004. The project has been supported by the European Social Fund, European Union. This paper was supported by the Janos Bolyai Research Scholarship of the Hungarian Academy of Sciences (GP and GO). GD was supported by the ÚNKP-16-3 New National Excellence Program of the Ministry of Human Capacities. The present scientific contribution is dedicated to the 650th anniversary of the foundation of the University of Pécs, Hungary.
Authors’ disclosures available online (http://j-alz.com/manuscript-disclosures/17-0118r3).
Appendices
The supplementary material is available in the electronic version of this article: http://dx.doi.org/10.3233/JAD-170118.
REFERENCES
[1] | Hallgren B , Sourander P ((1958) ) The effect of age on the non-haemin iron in the human brain. J Neurochem 3: , 41–51. |
[2] | Brass SD , Chen N , Mulkern RV , Bakshi R ((2006) ) Magnetic resonance imaging of iron deposition in neurological disorders. Top Magn Reson Imaging 17: , 31–40. |
[3] | Zecca L , Youdim MBH , Riederer P , Connor JR , Crichton RR ((2004) ) Iron, brain ageing and neurodegenerative disorders. Nat Rev Neurosci 5: , 863–873. |
[4] | Bartzokis G , Sultzer D , Cummings J , Holt LE , Hance DB , Henderson VW , Mintz J ((2000) ) In vivo evaluation of brain iron in Alzheimer disease using magnetic resonance imaging. Arch Gen Psychiatry 57: , 47–53. |
[5] | Bartzokis G ((2004) ) Age-related myelin breakdown: A developmental model of cognitive decline and Alzheimer’s disease. Neurobiol Aging 25: , 5–18. |
[6] | Bartzokis G ((2004) ) Quadratic trajectories of brain myelin content: Unifying construct for neuropsychiatric disorders. Neurobiol Aging 25: , 49–62. |
[7] | Bartzokis G , Tishler TA , Lu PH , Villablanca P , Altshuler LL , Carter M , Huang D , Edwards N , Mintz J ((2007) ) Brain ferritin iron may influence age- and gender-related risks of neurodegeneration. Neurobiol Aging 28: , 414–423. |
[8] | Aschermann Z , Perlaki G , Orsi G , Nagy SA , Horvath A , Bone B , Bihari K , Acs P , Janszky J , Komoly S , Bogner P ((2015) ) Quantitative assessment of brain iron by R2* relaxometry in patients with cervical dystonia. Mov Disord 30: , 1422–1426. |
[9] | Casadesus G , Smith MA , Zhu X , Aliev G , Cash AD , Honda K , Petersen RB , Perry G ((2004) ) Alzheimer disease: Evidence for a central pathogenic role of iron-mediated reactive oxygen species. J Alzheimers Dis 6: , 165–169. |
[10] | Smith MA , Harris PLR , Sayre LM , Perry G ((1997) ) Iron accumulation in Alzheimer disease is a source of redox-generated free radicals. Proc Natl Acad Sci U S A 94: , 9866–9868. |
[11] | Langkammer C , Krebs N , Goessler W , Scheurer E , Ebner F , Yen K , Fazekas F , Ropele S ((2010) ) Quantitative MR imaging of brain iron: A postmortem validation study 1. Radiology 257: , 455–462. |
[12] | Langkammer C , Schweser F , Krebs N , Deistung A , Goessler W , Scheurer E , Sommer K , Reishofer G , Yen K , Fazekas F , Ropele S , Reichenbach JR ((2012) ) Quantitative susceptibility mapping (QSM) as a means to measure brain iron? A post mortem validation study. Neuroimage 62: , 1593–1599. |
[13] | Péran P , Hagberg G , Luccichenti G , Cherubini A , Brainovich V , Celsis P , Caltagirone C , Sabatini U ((2007) ) Voxel-based analysis of R2* maps in the healthy human brain. J Magn Reson Imaging 26: , 1413–1420. |
[14] | Yan S-Q , Sun J-Z , Yan Y-Q , Wang H , Lou M ((2012) ) Evaluation of brain iron content based on magnetic resonance imaging (MRI): Comparison among phase value, R2* and magnitude signal intensity. PLoS One 7: , e31748. |
[15] | Ning N , Zhang L , Gao J , Zhang Y , Ren Z , Niu G , Dai Y , Wu EX , Guo Y , Yang J ((2014) ) Assessment of iron deposition and white matter maturation in infant brains by using enhanced T2 star weighted angiography (ESWAN): R2* versus phase values. PLoS One 9: , e89888. |
[16] | Pujol J , Junque C , Vendrell P , Grau JM , Marti-Vilalta JL , Olive C , Gili J ((1992) ) Biological significance of iron-related magnetic resonance imaging changes in the brain. Arch Neurol 49: , 711–717. |
[17] | Penke L , Valdés Hernandéz MC , Maniega SM , Gow AJ , Murray C , Starr JM , Bastin ME , Deary IJ , Wardlaw JM ((2012) ) Brain iron deposits are associated with general cognitive ability and cognitive aging. Neurobiol Aging 33: , 510–517.e2. |
[18] | Osterrieth PA ((1944) ) Le test de copied’une figure complexe. Arch Psychol 30: , 206–356. |
[19] | Taylor L ((1969) ) Localization of cerebral lesions by psychological testing. Clin Neurosurg 16: , 269–287. |
[20] | Rey A , Ferrara-Mori G ((1967) ) Reattivo della figura complessa: manuale, Organizzazioni Speciali, Firenze. |
[21] | Rey A ((1964) ) L’examen clinique en psychologi (The clinical examination in psychology), 2nd ed., Presses Universitaires de France, Paris. |
[22] | Khalil M , Langkammer C , Ropele S , Petrovic K , Wallner-Blazek M , Loitfelder M , Jehna M , Bachmaier G , Schmidt R , Enzinger C , Fuchs S , Fazekas F ((2011) ) Determinants of brain iron in multiple sclerosis: A quantitative 3T MRI study. Neurology 77: , 1691–1697. |
[23] | Patenaude B , Smith SM , Kennedy DN , Jenkinson M ((2011) ) A Bayesian model of shape and appearance for subcortical brain segmentation. Neuroimage 56: , 907–922. |
[24] | Jenkinson M , Bannister P , Brady M , Smith S ((2002) ) Improved optimization for the robust and accurate linear registration and motion correction of brain images. Neuroimage 17: , 825–841. |
[25] | Nagy SA , Aradi M , Orsi G , Perlaki G , Kamson DO , Mike A , Komaromy H , Schwarcz A , Kovacs A , Janszky J , Pfund Z , Illes Z , Bogner P ((2013) ) Bi-exponential diffusion signal decay in normal appearing white matter of multiple sclerosis. Magn Reson Imaging 31: , 286–295. |
[26] | Bartzokis G , Mintz J , Sultzer D , Marx P , Herzberg JS , Phelan CK , Marder SR ((1994) ) In vivo MR evaluation of age-related increases in brain iron. Am J Neuroradiol 15: , 1129–1138. |
[27] | Chan YH ((2004) ) Biostatistics 201: Linear regression analysis. Singapore Med J 45: , 55–61. |
[28] | Bartzokis G , Beckson M , Hange DB , Marx P , Foster JA , Marder SR ((1997) ) MR evaluation of age-related increase of brain iron in young adult and older normal males. Magn Reson Imaging 15: , 29–35. |
[29] | Wang D , Li W-B , Wei X-E , Li Y-H , Dai Y-M ((2012) ) An investigation of age-related iron deposition using susceptibility weighted imaging. PLoS One 7: , e50706. |
[30] | Daugherty AM , Haacke EM , Raz N ((2015) ) Striatal iron content predicts its shrinkage and changes in verbal working memory after two years in healthy adults. J Neurosci 35: , 6731–6743. |
[31] | Ghadery C , Pirpamer L , Hofer E , Langkammer C , Petrovic K , Loitfelder M , Schwingenschuh P , Seiler S , Duering M , Jouvent E , Schmidt H , Fazekas F , Mangin JF , Chabriat H , Dichgans M , Ropele S , Schmidt R ((2015) ) R2* mapping for brain iron: Associations with cognition in normal aging. Neurobiol Aging 36: , 925–932. |
[32] | Ropele S , Wattjes MP , Langkammer C , Kilsdonk ID , De Graaf WL , Frederiksen JL , Fuglø D , Yiannakas M , Wheeler-Kingshott CAM , Enzinger C , Rocca MA , Sprenger T , Amman M , Kappos L , Filippi M , Rovira A , Ciccarelli O , Barkhof F , Fazekas F ((2014) ) Multicenter R2* mapping in the healthy brain. Magn Reson Med 71: , 1103–1107. |
[33] | Bartzokis G , Cummings JL , Markham CH , Marmarelis PZ , Treciokas LJ , Tishler TA , Marder SR , Mintz J ((1999) ) MRI evaluation of brain iron in earlier- and later-onset Parkinson’s disease and normal subjects. Magn Reson Imaging 17: , 213–222. |
[34] | Aquino D , Bizzi A , Grisoli M , Garavaglia B , Bruzzone MG , Nardocci N , Savoiardo M , Chiapparini L ((2009) ) Age-related iron deposition in the basal ganglia: Quantitative analysis in healthy subjects. Radiology 252: , 165–172. |
[35] | Walsh AJ , Lebel RM , Eissa A , Blevins G , Catz I , Lu J-Q , Resch L , Johnson ES , Emery DJ , Warren KG , Wilman AH ((2013) ) Multiple sclerosis: Validation of MR imaging for quantification and detection of iron. Radiology 267: , 531–542. |
[36] | Pfefferbaum A , Adalsteinsson E , Rohlfing T , Sullivan EV ((2009) ) MRI estimates of brain iron concentration in normal aging: Comparison of field-dependent (FDRI) and phase (SWI) methods. Neuroimage 47: , 493–500. |
[37] | Lozoff B ((2012) ) Iron-fortified vs low-iron infant formula. Arch Pediatr Adolesc Med 166: , 208. |
[38] | Sullivan EV , Adalsteinsson E , Rohlfing T , Pfefferbaum A ((2009) ) Relevance of iron deposition in deep gray matter brain structures to cognitive and motor performance in healthy elderly men and women: Exploratory findings. Brain Imaging Behav 3: , 167–175. |
[39] | Rodrigue KM , Daugherty AM , Haacke EM , Raz N ((2013) ) The role of hippocampal iron concentration and hippocampal volume in age-related differences in memory. Cereb Cortex 23: , 1533–1541. |
[40] | Bartzokis G , Lu PH , Tingus K , Peters DG , Amar CP , Tishler TA , Finn JP , Villablanca P , Altshuler LL , Mintz J , Neely E , Connor JR ((2011) ) Gender and iron genes may modify associations between brain iron and memory in healthy aging. Neuropsychopharmacology 3622: , 1375–1384. |
[41] | Valdés Hernández M del C. , Ritchie S , Glatz A , Allerhand M , Muñoz Maniega S , Gow AJ , Royle NA , Bastin ME , Starr JM , Deary IJ , Wardlaw JM ((2015) ) Brain iron deposits and lifespan cognitive ability. Age (Omaha) 37: , 100. |
[42] | Borenstein AR , Copenhaver CI , Mortimer JA ((2006) ) Early-life risk factors for Alzheimer disease. Alzheimer Dis Assoc Disord 20: , 63–72. |
[43] | Stern Y , Habeck C , Moeller J , Scarmeas N , Anderson KE , Hilton HJ , Flynn J , Sackeim H , van Heertum R ((2005) ) Brain networks associated with cognitive reserve in healthy young and old adults. Cereb Cortex 15: , 394–402. |
[44] | Fox NC , Warrington EK , Seiffer AL , Agnew SK , Rossor MN ((1998) ) Presymptomatic cognitive deficits in individuals at risk of familial Alzheimer’s disease – A longitudinal prospective study. Brain 121: , 1631–1639. |
[45] | Bartzokis G , Tishler TA , Shin IS , Lu PH , Cummings JL ((2004) ) Brain ferritin iron as a risk factor for age at onset in neurodegenerative diseases. Ann N Y Acad Sci 1012: , 224–236. |
[46] | Naderi S , Çolakoğlu Z , Lüleci G ((1993) ) Calcification of basal ganglia associated with pontine calcification in four cases: A radiologic and genetic study. Clin Neurol Neurosurg 95: , 155–157. |
[47] | Ojemann JG , Akbudak E , Snyder a Z , McKinstry RC , Raichle ME , Conturo TE ((1997) ) Anatomic localization and quantitative analysis of gradient refocused echo-planar fMRI susceptibility artifacts. Neuroimage 6: , 156–167. |
[48] | Morris JC ((2005) ) Early-stage and preclinical Alzheimer disease. Alzheimer Dis Assoc Disord 19: , 163–165. |
[49] | Sperling RA , Aisen PS , Beckett LA , Bennett DA , Craft S , Fagan AM , Iwatsubo T , Jack CR , Kaye J , Montine TJ , Park DC , Reiman EM , Rowe CC , Siemers E , Stern Y , Yaffe K , Carrillo MC , Thies B , Morrison-Bogorad M , Wagster M V , Phelps CH , Phelps CH ((2011) ) Toward defining the preclinical stages of Alzheimer’s disease: Recommendations from the National Institute on Aging-Alzheimer’s Association workgroups on diagnostic guidelines for Alzheimer’s disease. Alzheimers Dement 7: , 280–292. |


