
Associations of CAIDE Dementia Risk Score with MRI, PIB-PET measures, and cognition
Abstract
Background:
CAIDE Dementia Risk Score is the first validated tool for estimating dementia risk based on a midlife risk profile.
Objectives:
This observational study investigated longitudinal associations of CAIDE Dementia Risk Score with brain MRI, amyloid burden evaluated with PIB-PET, and detailed cognition measures.
Methods:
FINGER participants were at-risk elderly without dementia. CAIDE Risk Score was calculated using data from previous national surveys (mean age 52.4 years). In connection to baseline FINGER visit (on average 17.6 years later, mean age 70.1 years), 132 participants underwent MRI scans, and 48 underwent PIB-PET scans. All 1,260 participants were cognitively assessed (Neuropsychological Test Battery, NTB). Neuroimaging assessments included brain cortical thickness and volumes (Freesurfer 5.0.3), visually rated medial temporal atrophy (MTA), white matter lesions (WML), and amyloid accumulation.
Results:
Higher CAIDE Dementia Risk Score was related to more pronounced deep WML (OR 1.22, 95% CI 1.05–1.43), lower total gray matter (β-coefficient –0.29, p = 0.001) and hippocampal volume (β-coefficient –0.28, p = 0.003), lower cortical thickness (β-coefficient –0.19, p = 0.042), and poorer cognition (β-coefficients –0.31 for total NTB score, –0.25 for executive functioning, –0.33 for processing speed, and –0.20 for memory, all p < 0.001). Higher CAIDE Dementia Risk Score including APOE genotype was additionally related to more pronounced MTA (OR 1.15, 95% CI 1.00–1.30). No associations were found with periventricular WML or amyloid accumulation.
Conclusions:
The CAIDE Dementia Risk Score was related to indicators of cerebrovascular changes and neurodegeneration on MRI, and cognition. The lack of association with brain amyloid accumulation needs to be verified in studies with larger sample sizes.
INTRODUCTION
About one third of Alzheimer’s disease (AD) dementia cases worldwide were estimated to be attributable to modifiable vascular and lifestyle-related risk factors [1]. Estimating dementia risk is important for identifying individuals who may benefit most from preventive interventions, and several dementia risk scores have been developed [2]. However, longitudinal associations of such risk scores with dementia-related brain changes and performance in different cognitive domains are not fully clear. As dementia risk scores are meant to be practical tools for prevention-related decision-making (e.g., selecting participants in prevention trials, and targeting the right preventive interventions toward the right at-risk groups), it is important to investigate the full range of properties that such tools have, including how the estimated risk level relates to specific brain changes and performance in different cognitive domains. This knowledge can facilitate choosing an appropriate risk score from all available options. The crucial importance of adequate selection tools, and of targeting interventions to at-risk groups was recently emphasized by three large prevention trials showing benefits of multidomain vascular/lifestyle interventions in at-risk individuals, but not unselected populations [3–5].
The Cardiovascular Risk Factors, Aging and Dementia (CAIDE) Dementia Risk Score was the first tool proposed for estimating dementia risk based on a midlife risk profile [6], and it was validated in a large, diverse population from the US [7]. The CAIDE Dementia Risk Score includes age, sex, education, blood pressure, cholesterol, body mass index (BMI), and physical inactivity, with higher scores indicating increased risk of subsequent dementia. Another version of the risk score additionally includes APOE genotype [6].
Two previous studies have investigated whether the dementia prediction ability of the CAIDE Risk Score was related to different types of brain changes. A longitudinal population-based study reported that a higher CAIDE score was associated with more severe visually rated white matter lesions (WML) and medial temporal lobe atrophy (MTA) on magnetic resonance imaging (MRI) [8]. In a cross-sectional study of memory clinic patients without dementia, a higher CAIDE score was associated with more severe WML and MTA on MRI, as well as AD-related cerebrospinal fluid (CSF) biomarkers: higher total tau, and lower amyloid-β (Aβ)/tau ratio [9]. However, it is not clear whether these findings would also apply to a general population.
The relations of the CAIDE Risk Score with cognition were previously investigated in two longitudinal population-based studies with different cognitive assessments. One study focused on cognitive decline based on five tests, and reported associations of higher CAIDE score with more decline in global cognition, reasoning, and vocabulary, but not memory or fluency domains [10]. Another study with a more detailed test battery focused on cognitive impairment defined as performance below a specified cut-off, and reported associations of higher CAIDE score with impairment in processing speed, visuoconstruction, and reasoning, but not executive functioning, language, or memory [11].
The aims of this longitudinal study in older individuals without dementia from the general population are to investigate associations of CAIDE Dementia Risk Score with: 1) more detailed neuroimaging assessments, including Pittsburgh Compound B (PIB)-positron emission tomography (PET) measures of brain Aβ deposition, and MRI measures of hippocampus and total gray matter (GM) volume, cortical thickness, visually rated deep and periventricular WML, and MTA; and 2) performance in several cognitive domains assessed with a comprehensive test battery previously used in AD clinical trials.
MATERIALS AND METHODS
Study population
This study included participants in the Finnish Geriatric Intervention Study to Prevent Cognitive Impairment and Disability (FINGER, NCT01041989) with MRI scans (n = 132), PIB-PET scans (n = 48), and cognitive tests (n = 1260) conducted in connection to the baseline FINGER visit. FINGER participants [3, 12, 13] were selected from previous population-based non-intervention cohort studies: the National FINRISK Study [14] and FIN-D2D [15, 16]. The present study focused on the CAIDE Dementia Risk Score calculated based on FINRISK and FIN-D2D data, and neuroimaging and cognition data collected in connection to the baseline FINGER visit (Fig. 1). Mean age (standard deviation, SD) for the 1,260 FINGER participants was 56.2 (10.7) years at the FINRISK or FIN-D2D visit, and 69.4 (4.7) years at the FINGER baseline visit, and mean (SD) time between the FINRISK or FIN-D2D visit and baseline FINGER visit was 13.1 (9.9) years, range 2–39 years.
Fig.1
Overview of the study design.
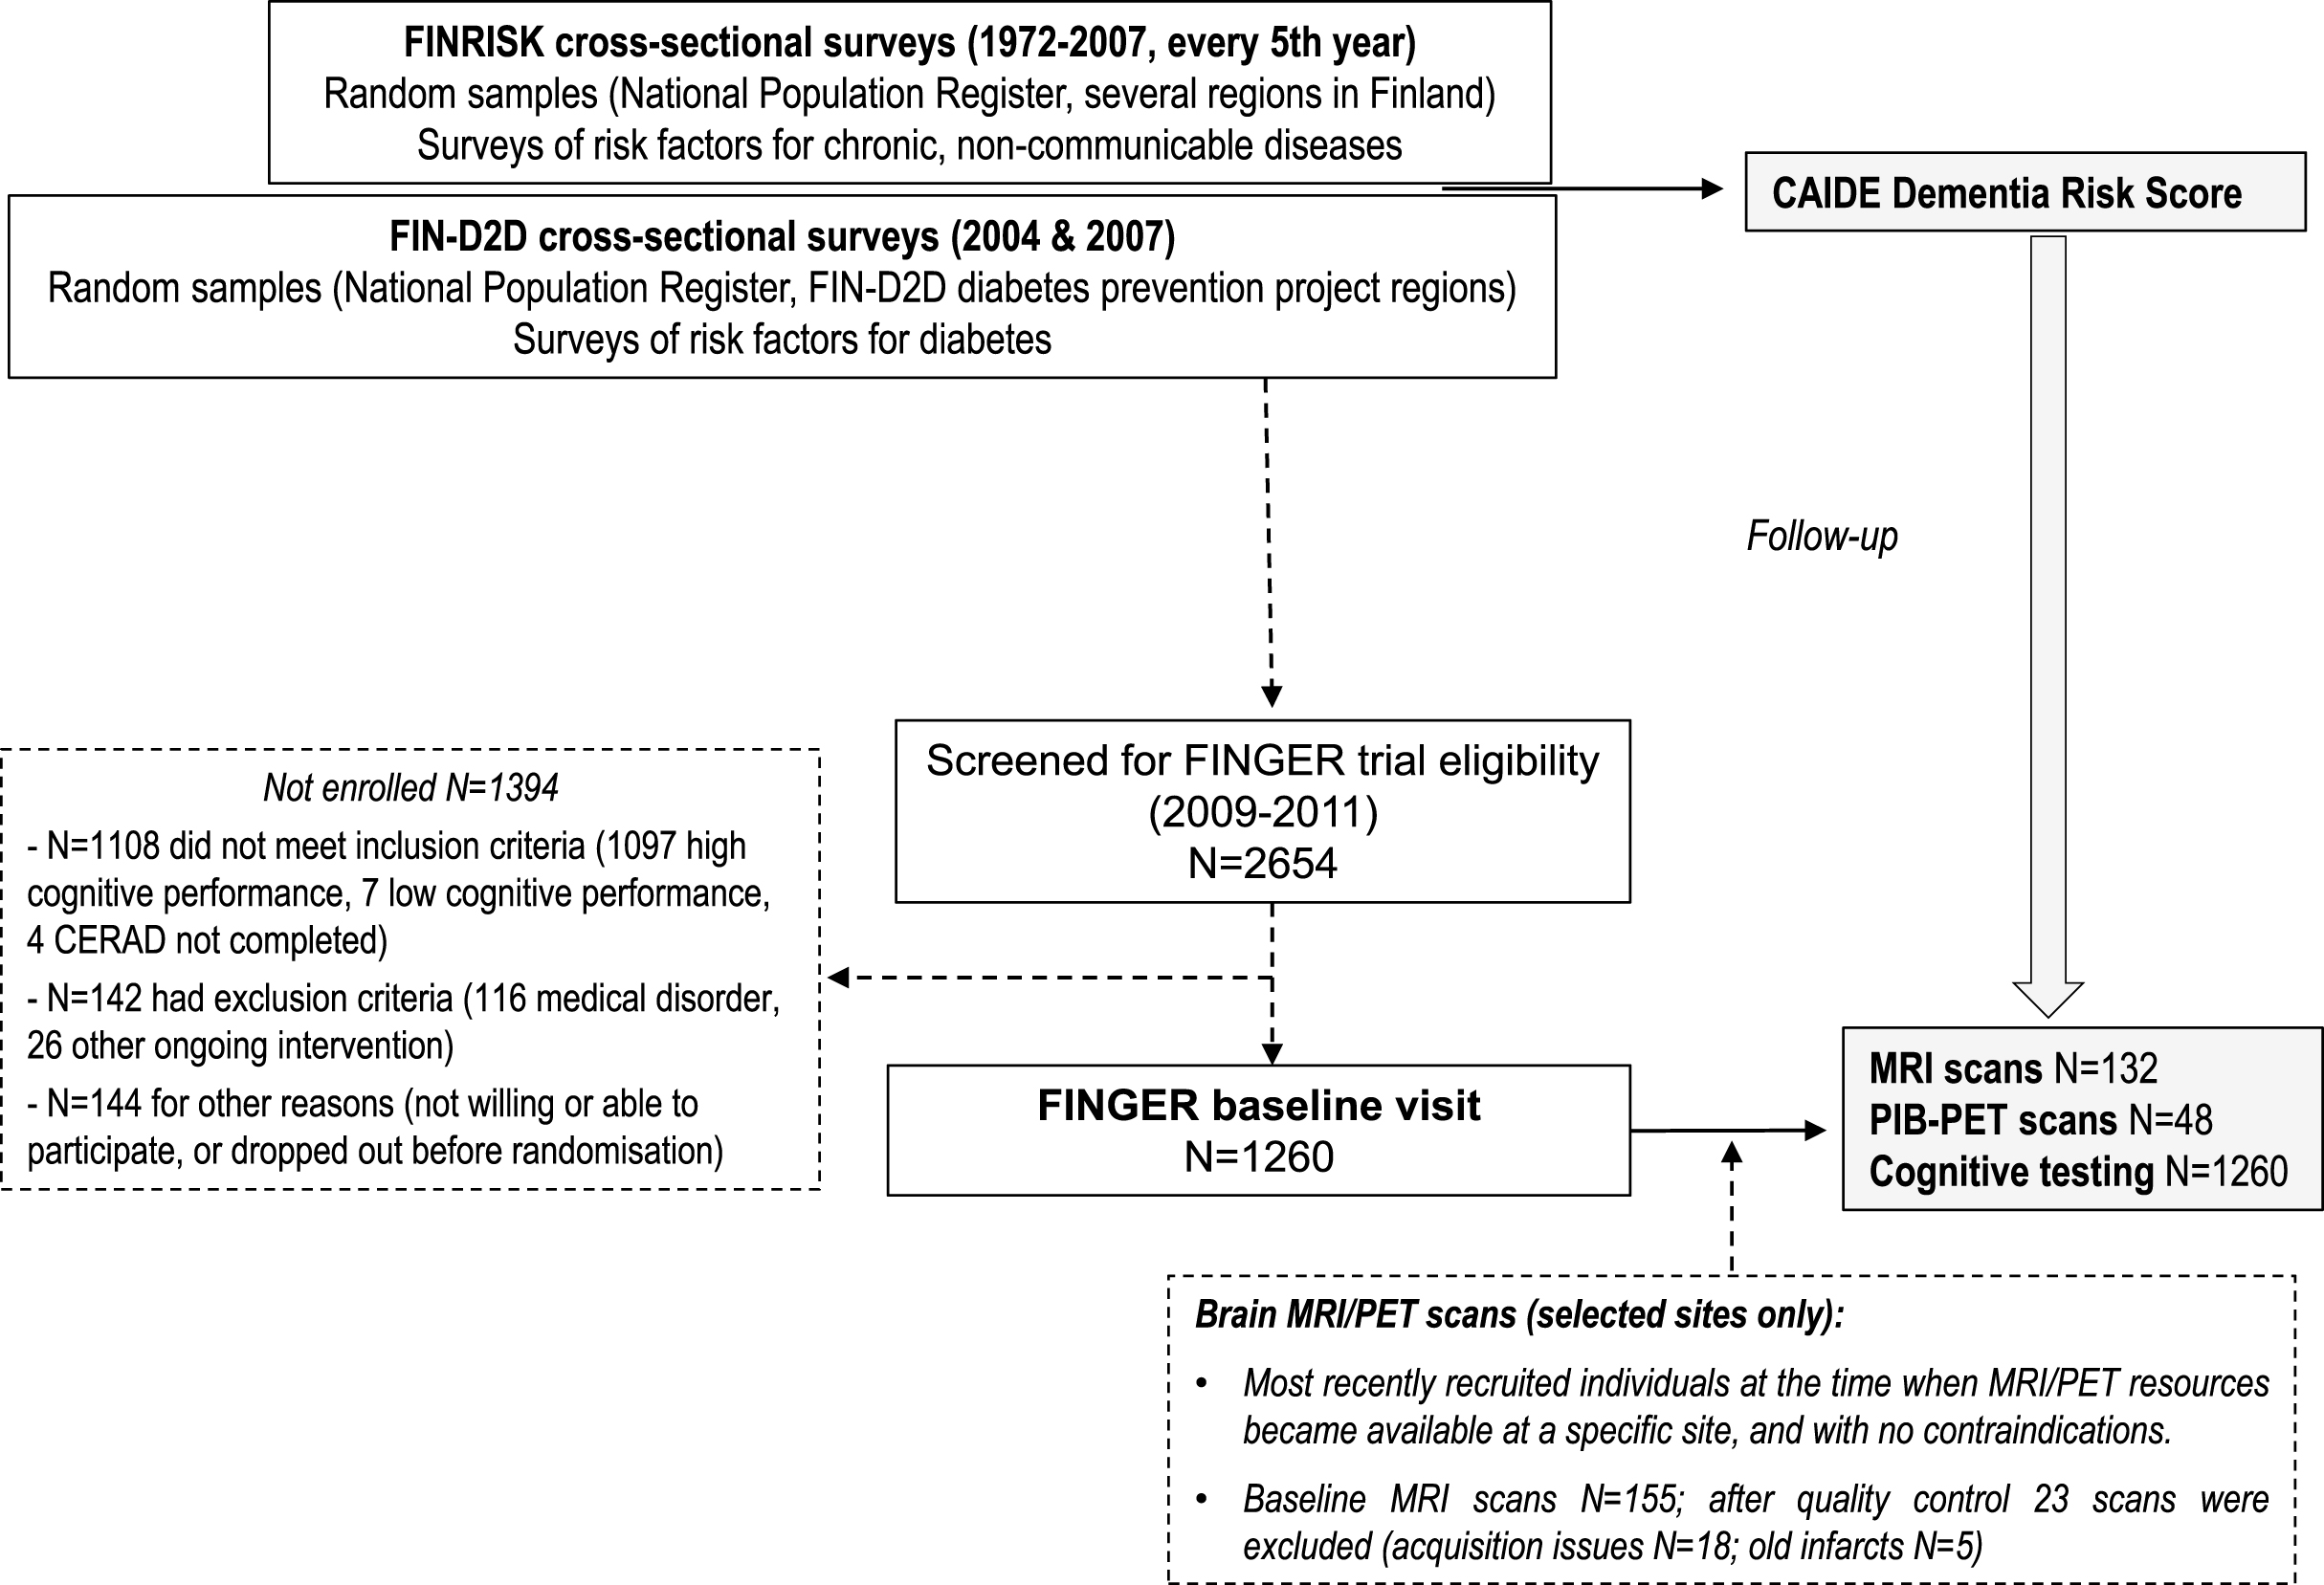
The FINRISK, FIN-D2D, and FINGER studies have been previously described in detail ([3, 12–16] and Supplementary Material). In 2009–2011, 1,260 participants in either FINRISK or FIN-D2D non-intervention surveys were selected to participate in the FINGER study. To be eligible, they had to be 60 to 77 years old, with the CAIDE Dementia Risk Score ≥6 points, and cognitive performance at the mean level or slightly lower than expected for age according to Finnish population norms for Consortium to Establish a Registry for Alzheimer’s Disease (CERAD) neuropsychological battery [17]. People with dementia and substantial cognitive impairment were excluded.
Ethical approval for the FINRISK surveys was obtained according to commonly required procedures since 1972 from local Ethics Committees that have varied over time (Coordinating Ethics Committee for the Uusimaa Hospital District since 2007). From 1997 onwards, written informed consent was obtained from each participant. The FINGER study was approved by the Coordinating Ethics Committee of the Hospital District of Helsinki and Uusimaa, and all participants gave written informed consent.
Measurements of CAIDE Dementia Risk Score factors in FINRISK and FIN-D2D surveys
The methodology of the FINRISK study surveys has been kept as similar as possible over the years and has been previously described in detail ([14] and Supplementary Material). The 1972 and 1977 surveys were largely comparable to later surveys 1982-92 where methodology closely followed the WHO MONICA protocol [18] and the later recommendations of the European Health Risk Monitoring project [19]. FIN-D2D survey methodology was based on FINRISK surveys ([15, 16] and Supplementary Material).
The surveys included a self-administered questionnaire, physical measurements, and blood samples. The CAIDE Dementia Risk Score for each subject was calculated based on FINRISK or FIN-D2D data (age, sex, years of formal education, systolic blood pressure, BMI, serum total cholesterol, and physical activity) according to previously specified cut-offs and number of points [6] (Supplementary Table 1). In addition, as specified in the original publication [6], a CAIDE Dementia Risk Score including apolipoprotein E (APOE) genotype was also calculated. For APOE assessment in FINGER, genomic DNA was extracted from venous blood samples with Chemagic MSM1 from PerkinElmer using magnetic beads. APOE genotyping was determined by polymerase chain reaction using TaqMan genotyping assays (Applied Biosystems (ABI), Foster City, CA, USA) for two single-nucleotide polymorphisms (rs429358 and rs7412) and an allelic discrimination method on the ABI 7500 platform [20].
Cognitive assessments in the FINGER study
An extended version of the neuropsychological test battery (NTB) [21] was used for cognitive assessments in the FINGER study. The NTB total score was calculated as a composite score based on results from 14 tests (Z scores standardized to the baseline mean and SD; for higher scores to indicate better performance, scores were inversed if needed, e.g., trail making test) [12]. An executive functioning score was similarly calculated from Z scores for category fluency test [17], digit span, concept shifting test (condition C), trail making test (shifting score B–A), and a shortened 40-stimulus version of the original Stroop test (interference score 3–2). A processing speed score was calculated from Z scores for letter digit substitution test, concept shifting test (condition A), and Stroop test (condition 2). A memory score was calculated using Z scores for visual paired associates test immediate and delayed recall, logical memory immediate and delayed recall, and word list learning and delayed recall [3]. The minimum number of necessary NTB components was set to eight of 14 for calculating NTB total score, three of five for executive functioning, two of three for processing speed, and three of six for memory [3]. An abbreviated memory score included four of six tests (two associative memory and two logical memory tests) with longer recall delay (30 min instead of 5 min) and requiring more complex processing. Mini-Mental State Examination [22] was also administered.
MRI assessments in the FINGER study
Brain MRI scans were conducted for a subsample of 155 FINGER participants from four of the six study sites. Participants were selected from the most recently recruited individuals at the time when MRI/PET resources became available at a specific site, and if there were no contraindications. 132 scans from three study sites passed quality control (all 18 scans from one site excluded due to acquisition issues, and 5 additional scans excluded due to old brain infarcts which may have affected automated image analysis). Data acquisition was conducted using four different MR systems (one General Electric 1.5T, two Siemens 1.5T, and one Philips Gemini PET/MRI 3T). Images were quality checked and read for any abnormalities, and regional cortical thickness and volumes were measured using the Freesurfer image analysis suite (version 5.0.3). Total GM volume and hippocampus volume were normalized to total intracranial volume to correct for head size. A measure of cortical thickness in AD signature regions was calculated as the average of cortical thickness in entorhinal, inferior temporal, middle temporal, and fusiform regions as previously described [23].
A single rater blinded to clinical data assessed MTA from T1-weighted images according to a visual rating scale commonly used in clinical practice [24]. MRIs were oriented perpendicular to the anterior commisure-posterior commisure line and MTA was rated from single coronal slice at the level where hippocampus, cerebral peduncles, and pons were all visible. MTA was graded from 0 (no atrophy) to 4 (end-stage atrophy) bilaterally [24]. WML were assessed from FLAIR images using a semi-quantitative visual rating scale [25] by a single rater blinded to clinical data. Periventricular WML were rated as 0 (absence), 1 (caps or pencil-thin lining), 2 (smooth halo), and 3 (irregular WML extending into the deep WM). Deep WML were rated as 0 (absence), 1 (punctate foci), 2 (beginning confluence of foci), and 3 (large confluent areas).
PET assessments in the FINGER study
PIB-PET was performed in one center (Turku University Hospital). [11C] PIB (N-methyl-[11 C]2-(4 methylaminophenyl)-6-hydroxybenzothiazole) was produced as described earlier [26]. On average 406.3 (SD 107.7) MBq of PIB was injected intravenously and a scan from 60–90 min (3×10 min frames) after injection was performed with a Philips Ingenuity TF PET/MR scanner (Philips, Amsterdam, the Netherlands). The scans were visually interpreted by two experienced readers and judged as visually positive or negative after consensusagreement.
Statistical analysis
Statistical analyses were done using Stata software version 12. The level of statistical significance was p < 0.05 in all analyses. Comparisons between FINGER participants with and without MRI or PET data were made using t-test or chi-square test as appropriate. Ordinal logistic regression was used to assess associations between CAIDE Dementia Risk Score, CAIDE Dementia Risk Score including APOE, and the following MRI measures (some additional categorizations were done to avoid too small groups): visually rated deep WML (3 groups with ratings 0, 1, and 2-3); visually rated periventricular WML (4 groups with ratings from 0 to 3); and visually rated MTA (the mean of left and right MTA ratings, 3 groups with ratings 0–0.5, 1, and 1.5–3). Brant command [27] was used to test proportional odds assumption. Binary logistic regression was used to assess associations between CAIDE Dementia Risk Score versions and amyloid positivity on PIB-PET scans (negative, n = 28 versus positive, n = 20 subjects). After zero-skewness log-transformation, linear regression was used to assess associations with total intracranial volume-normalized total GM and hippocampal volume, and AD signature thickness (average of cortical thickness in entorhinal, inferior temporal, middle temporal, and fusiform regions) [23]. All analyses were adjusted for site (except for amyloid positivity because PIB-PET scans were conducted in one site) and follow-up time. Results are reported as odds ratios (OR) and 95% confidence intervals (CI).
Linear regression models with cognitive test scores as dependent variables were used to analyze associations between CAIDE Dementia Risk Score, CAIDE Dementia Risk Score including APOE, and cognition (adjusted for time between the FINRISK or FIN-D2D visit and FINGER baseline visit). Results are shown as standardized β-coefficients and p-values.
RESULTS
The recruitment to the FINGER study from the FINRISK and FIN-D2D surveys has been previously described in detail [13], and summarized in Supplementary Table 2. Table 1 shows characteristics of FINGER participants with and without neuroimaging data at the three study sites where brain scans were available (total 682 participants, of which 132 had MRI and 48 had PIB-PET scans). The MRI population was not significantly different from the population without MRI at these sites (Table 1). The PET population was significantly younger at the FINRISK Study visit, had longer follow-up time, was more often physically inactive, and had lower CAIDE Dementia Risk Score at the FINRISK visit compared with participants without PET data. Cognition and other characteristics were not significantly different between participants with and without neuroimaging data.
Table 1
Comparison between FINGER participants with and without brain scans at the three neuroimaging study sites (total 682 participants)**
| n | No brain scan | n | Brain scan | p | |
| MRI POPULATION | |||||
| Men, n (%) | 550 | 292 (53.0) | 132 | 70 (53.0) | 0.99 |
| Education, years | 546 | 9.5 (3.07) | 132 | 9.4 (2.9) | 0.75 |
| APOE ɛ4 carriers, n (%) | 507 | 175 (34.5) | 119 | 35 (29.4) | 0.28 |
| # Follow-up time, years | 550 | 16.0 (11.0) | 132 | 17.6 (9.3) | 0.13 |
| Characteristics at the FINRISK/FIN-D2D assessment | |||||
| Age, years | 550 | 53.0 (11.4) | 132 | 52.4 (10.6) | 0.56 |
| Systolic blood pressure, mmHg | 548 | 141.0 (18.4) | 132 | 141.2 (20.7) | 0.95 |
| BMI, kg/m2 | 548 | 27.4 (4.3) | 132 | 26.9 (3.4) | 0.20 |
| Total cholesterol, mmol/l | 547 | 5.9 (1.1) | 132 | 5.9(1.1) | 0.78 |
| Physically inactive, n (%) | 542 | 255 (47.0) | 131 | 70 (53.4) | 0.18 |
| CAIDE Dementia Risk Score | 535 | 7.13 (2.5) | 131 | 6.8 (2.4) | 0.18 |
| CAIDE Dementia Risk Score including APOE | 492 | 8.7 (3.10) | 118 | 8.2 (2.8) | 0.14 |
| Characteristics at the FINGER baseline assessment | |||||
| Age, years | 550 | 69.2 (4.7) | 132 | 70.1 (4.6) | 0.06 |
| NTB Total score | 549 | –0.12 (0.56) | 132 | –0.067 (0.52) | 0.25 |
| NTB Executive functioning | 548 | –0.14 (0.67) | 132 | –0.04 (0.58) | 0.10 |
| NTB Processing speed | 549 | –0.13 (0.82) | 132 | –0.04 (0.78) | 0.23 |
| NTB Memory | 549 | –0.10 (0.64) | 132 | –0.10(0.60) | 0.90 |
| NTB Abbreviated memory | 539 | –0.15 (0.7) | 132 | –0.14 (0.70) | 0.94 |
| MMSE | 549 | 26.9 (1.98) | 130 | 26.9 (1.99) | 0.63 |
| *Visually rated deep WML | – | – | 131 | 1.2 (0.0–3.0) | – |
| *Visually rated periventricular WML | – | – | 131 | 1.4 (0.0–3.0) | – |
| *Visually rated MTA | – | – | 132 | 1.0 (0.0–3.0) | – |
| *Total hippocampal volume, ml | – | – | 132 | 7.3 (4.7–9.3) | – |
| *Total intracranial volume, ml | – | – | 132 | 1559.6 (957.9–2032.7) | – |
| *AD signature thickness, mm | – | – | 132 | 2.8 (2.4–3.1) | – |
| *Total GM volume, ml | – | – | 132 | 554.6 (420.7–695.4) | – |
| PET POPULATION | |||||
| Men, n (%) | 191 | 98 (51.3) | 48 | 26 (54.17) | 0.72 |
| Education, years | 189 | 9.4 (3.30) | 48 | 9.40 (3.09) | 0.97 |
| APOE ɛ4 carriers, n (%) | 180 | 76 (42.2) | 47 | 14 (29.7) | 0.12 |
| # Follow-up time, years | 191 | 11.1 (7.13) | 48 | 21.3 (3.0) | <0.001 |
| Characteristics at baseline (FINRISK/FIN-D2D assessment) | |||||
| Age, years | 191 | 58.9 (7.7) | 48 | 49.1 (5.9) | <0.001 |
| Systolic blood pressure, mmHg | 190 | 141.0 (19.4) | 48 | 136.20 (22.2) | 0.13 |
| BMI, kg/m2 | 190 | 27.9 (4.14) | 48 | 26.6 (3.0) | 0.05 |
| Total cholesterol, mmol/l | 190 | 5.84 (1.1) | 48 | 6.0 (1.1) | 0.38 |
| Physically inactive, n (%) | 190 | 82 (43.1) | 48 | 31 (64.5) | 0.008 |
| CAIDE Dementia Risk Score | 187 | 7.90 (1.90) | 48 | 6.52 (3.0) | <0.001 |
| CAIDE Dementia Risk Score including APOE | 176 | 9.8 (2.42) | 47 | 7.83 (3.14) | <0.001 |
| Characteristics at the FNGER baseline assessment | |||||
| Age, years | 191 | 70.0 (4.6) | 48 | 70.7 (5.04) | 0.35 |
| NTB Total score | 190 | –0.05 (0.52) | 48 | –0.01 (0.52) | 0.67 |
| NTB Executive functioning | 190 | –0.10 (0.64) | 48 | –0.0001 (0.56) | 0.30 |
| NTB Processing speed | 190 | –0.10 (0.76) | 48 | 0.05 (0.89) | 0.23 |
| NTB Memory | 190 | 0.02 (0.59) | 48 | –0.048 (0.58) | 0.44 |
| NTB Abbreviated memory | 184 | –0.020 (0.69) | 48 | –0.13 (0.67) | 0.33 |
| MMSE | 191 | 27.2 (2.02) | 48 | 27.0 (1.8) | 0.52 |
| Amyloid positive, n (%) | – | – | 48 | 20 (41.6) | – |
Values are means (SD) unless otherwise specified. *Values are medians (range). P-values are shown for differences between participants with and without brain scans. # Follow-up time is calculated as time between FINRISK/FIN-D2D visit and FINGER baseline visit. **Due to the geographical distribution of the different FINRISK/FIN-D2D cohorts, recruitment was primarily from earlier cohorts at neuroimaging study sites (i.e., younger participants), and primarily from later cohorts at study sites without neuroimaging (i.e., older participants). The comparisons shown in the table focused on the neuroimaging sites in order to assess if there were further differences between groups. APOE, apolipoprotein E genotype; BMI, body mass index; CAIDE, Cardiovascular Risk Factors, Aging and Dementia study; NTB, neuropsychological test battery; MMSE, Mini-Mental State Examination; WML, white matter lesions; MTA, medial temporal atrophy; AD signature thickness, Alzheimer’s disease signature thickness, average of cortical thickness in entorhinal, inferior temporal, middle temporal, and fusiform regions; GM, gray matter.
Due to the geographical distribution of the different FINRISK/FIN-D2D cohorts, recruitment was primarily from earlier cohorts at neuroimaging study sites, and primarily from later cohorts at study sites without neuroimaging (Supplementary Table 2). This resulted in a significant difference in age at the FINRISK/FIN-D2D visit (p < 0.001). Mean age (SD) was 52.9 (11.3) years for the 682 participants from neuroimaging sites, and 60.1 (8.5) years for the 578 participants from study sites without neuroimaging.
Associations of the CAIDE Dementia Risk Score, and CAIDE Dementia Risk Score including APOE with MRI and PIB-PET measures are shown in Table 2. Higher CAIDE Dementia Risk Score was significantly related to more pronounced deep WML (p = 0.010), lower hippocampal volume (p = 0.003), lower total GM volume (p = 0.001), and lower AD signature cortical thickness (p = 0.042). Higher CAIDE Dementia Risk Score including APOE was significantly related to more pronounced deep WML (p = 0.006), more pronounced MTA (p = 0.038), lower hippocampal volume (p = 0.001), lower total GM volume (p = 0.009), and lower AD signature cortical thickness (p = 0.018). No significant associations were found with periventricular WML or amyloid positivity on PIB-PET scans.
Table 2
Associations of CAIDE Dementia Risk Score with neuroimaging biomarkers
| CAIDE Dementia | CAIDE Dementia Risk Score | |||
| Risk Score | including APOE | |||
| n | OR (95% CI) | n | OR (95% CI) | |
| More pronounced deep WML | 130 | 1.22 (1.05–1.43) | 117 | 1.22 (1.06–1.40) |
| More pronounced periventricular WML | 130 | 1.09 (0.97–1.25) | 117 | 1.05 (0.93–1.18) |
| More pronounced MTA | 131 | 1.09 (0.95–1.27) | 118 | 1.15 (1.00–1.30) |
| Amyloid positivity on PIB-PET | 48 | 1.03 (0.84–1.25) | 47 | 1.13 (0.93–1.38) |
| Standardized β-coefficient (p-value) | ||||
| Hippocampal volume | 131 | –0.28 (0.003) | 118 | –0.33 (0.001) |
| AD signature thickness | 131 | –0.19 (0.042) | 118 | –0.24 (0.02) |
| Total GM volume | 131 | –0.29 (0.001) | 118 | –0.26 (0.009) |
OR and 95% CI from ordinal or binary logistic regressions with neuroimaging measures as outcomes:
• Visually rated deep WML (3 groups by Fazekas scale of severity: 0 for n = 17 subjects; 1 for n = 71; and 2-3 for n = 43).
• Visually rated periventricular WML (4 groups by Fazekas scale of severity: 0 for n = 25 subjects; 1 for n = 45; 2 for n = 36; and 3 for n = 25).
• Visually rated MTA (3 groups by Scheltens scale of severity: 0–0.5 for n = 20 subjects, 1 for n = 67, and 1.5–3 for n = 45).
• Amyloid accumulation on PIB-PET (negative n = 28 subjects, positive n = 20 subjects).
A higher CAIDE Dementia Risk Score at the FINRISK/D2D visit was significantly associated with poorer cognitive performance in all domains at the baseline FINGER visit (Table 3). The same was found for CAIDE Dementia Risk Score including APOE.
Table 3
Longitudinal associations between CAIDE Dementia Risk Score and cognitive functioning at the FINGER baseline visit
| n | CAIDE Dementia Risk | n | CAIDE Dementia Risk | |
| Score | Score including APOE | |||
| NTB total score | 1,144 | β= –0.31 (p < 0.001) | 1,061 | β= –0.41 (p < 0.001) |
| NTB Executive functioning | 1,143 | β= –0.25 (p < 0.001) | 1,060 | β= –0.35 (p < 0.001) |
| NTB Processing speed | 1,144 | β= –0.33 (p < 0.001) | 1,061 | β= –0.37 (p < 0.001) |
| NTB Memory | 1,144 | β= –0.20 (p < 0.001) | 1,061 | β= –0.29 (p < 0.001) |
| NTB Abbreviated memory | 1,126 | β= –0.20 (p < 0.001) | 1,044 | β= –0.29 (p < 0.001) |
| MMSE | 1,142 | β= –0.12 (p = 0.001) | 1,059 | β= –0.16 (p < 0.001) |
Values are standardized beta-coefficients (p-values) from linear regressions with cognitive tests as dependent variables. APOE, apolipoprotein E genotype; CAIDE, Cardiovascular Risk Factors, Aging and Dementia study; NTB, Neuropsychological Test Battery; MMSE, Mini-Mental State Examination.
DISCUSSION
The present study showed that a higher baseline CAIDE Dementia Risk Score was significantly associated with more pronounced deep WML, lower total GM and hippocampal volume, and lower cortical thickness in AD signature areas at follow-up. Higher CAIDE Dementia Risk Score including APOE was additionally related to more pronounced MTA. There were no significant relations with periventricular WML or amyloid accumulation on PIB-PET scans. A higher CAIDE Dementia Risk Score was significantly related to poorer cognition, and the same was found for CAIDE Dementia Risk Score including APOE.
The CAIDE Dementia Risk Score based on a midlife risk profile is known to perform well in predicting dementia 20 to 40 years later [6, 7], and has also been associated with cognitive impairment [11] or cognitive decline [10] in several domains, but not memory or executive functioning. In the present study of individuals without dementia, the CAIDE Dementia Risk Score was related to subsequent cognitive performance across multiple domains, including memory and executive functioning. Differences in findings compared to previous studies may be due to the use of different cognitive tests. The present study included a very comprehensive test battery that was previously used in AD clinical trials [21], and all cognitive domains were defined as composite scores based on several tests, which are likely to be more sensitive measures compared to a single test. Another explanation may be population differences. Previous studies have focused on unselected general populations without dementia from the UK and the Netherlands [10, 11]. FINGER participants represented a general Finnish population at risk for dementia, but without dementia or pronounced cognitive impairment (mean cognitive performance was less than 0.5 SD below the average level of a cognitively normal Finnish population) [13].
The CAIDE Dementia Risk Score is based primarily on vascular factors, and a higher score in midlife was previously shown to relate to more severe WML 20 to 30 years later [8]. The associations with deep WML but not periventricular WML observed in the present study further support the link between the CAIDE Dementia Risk Score and cerebrovascular changes on brain MRI. Deep and periventricular WML are considered to be the result of different pathological processes, i.e., deep WML are regarded as markers for cerebral small vessel disease, related disturbances in white matter perfusion and ischemia, while periventricular WML may be the result of, e.g., blood-brain barrier dysfunction or disturbances in CSF production [28].
A higher CAIDE Dementia Risk Score has been associated with more pronounced MTA 30 years later in a population-based study [8], and also in a cross-sectional study of memory clinic patients without dementia [9]. In the present study, higher CAIDE Dementia Risk Score was additionally associated with lower total GM and hippocampal volume, and lower cortical thickness in AD signature brain areas. However, no associations were found with amyloid positivity on PIB-PET scans. This is in contrast to the cross-sectional study of memory clinic patients without dementia, where a higher CAIDE Dementia Risk Score (version with APOE) was related to lower CSF Aβ1–42 [9]. Several factors may at least partly explain the conflicting results: compared with FINGER participants, memory clinic patients without dementia are highly selected, most likely located further downstream in the temporal evolution of AD biomarkers; cross-sectional versus longitudinal design; and small PIB-PET sample size in the present study. In addition, disagreements between CSF and PET findings have been previously reported in individuals without pronounced cognitive symptoms, e.g., amyloid positive CSF with amyloid negative PET [29].
Brain amyloid accumulation does not have a straightforward relation to dementia or cognitive impairment [30, 31]. In the present study, 41.6% of participants were amyloid-positive on PIB-PET despite exclusion of dementia or substantial cognitive impairment. The significance of a positive PIB-PET scan in asymptomatic individuals is not fully clear. The new research criteria for AD have mentioned two different situations: preclinical AD (i.e., the disease is already present as shown by co-occurrence of both amyloidopathy and tauopathy), and an asymptomatic at-risk state (i.e., increased risk for future AD development as shown by isolated amyloidopathy or tauopathy) [32]. The natural history of these two states, especially concerning potential progression to dementia, still needs clarifications. Considering the increasing interest in dementia prevention trials targeting preclinical AD and/or asymptomatic at-risk states [33], investigating potential predictors of amyloid positivity in asymptomatic individuals is important for, e.g., determining which risk estimation tools may be useful for reducing screening failures in these types of trials.
Our findings suggest the possibility that the performance of the CAIDE risk score in predicting dementia in the general population may not be directly related to prediction of amyloid pathology. Medial temporal atrophy and atrophy in other brain regions can occur through mechanisms unrelated to amyloid accumulation or AD [23, 34–37]. Midlife vascular and lifestyle-related risk factors included in the CAIDE Dementia Risk Score (e.g., hypertension, obesity, hypercholesterolemia, or physical inactivity) have previously been associated with brain atrophy [37], but their associations with brain amyloid pathology in clinical-pathological studies have been inconsistent [38]. Cerebrovascular and amyloid pathologies are often present simultaneously, especially at older ages, and they have been shown to interact at cellular and molecular level [39]. Regarding AD, it is still debated if the entire pathological cascade is initiated by Aβ, or if Aβ deposition and neuronal injury are partly independent events [40]. The main strengths of the present study are longitudinal population-based design, and availability of detailed cognitive and neuroimaging assessments at the follow-up exam (although not at the baseline FINRISK/FIN-D2D surveys). MRI scanners were different between study sites, but this was adjusted for in the analyses. In addition, Freesurfer morphometric procedures have previously shown good test-retest reliability across scanner manufacturers and field strengths [41, 42].
The main limitation of the study is that FINGER neuroimaging sample sizes were small, particularly the PIB-PET sample (n = 48), which limited statistical power and thus the possibility to identify an association between the CAIDE risk score and brain amyloid deposition. Selection bias may have also reduced the ability to identify associations with neuroimaging measures for several reasons: 1) Overall, the FINGER population included individuals at risk for dementia, and does not fully reflect the entire risk continuum (from low to high) observed in the general population; 2) Age is a central risk factor for dementia and related brain pathology, and participants from study sites without neuroimaging were older at the midlife FINRISK/FIN-D2D visit; also, at study sites with neuroimaging, participants without PIB-PET scans were older than those with PIB-PET scans; and 3) Exclusion of MRI scans of inadequate quality led to the exclusion of 5 individuals with old brain infarcts, which may have underestimated associations of CAIDE score with cerebrovascular changes including WML, as higher vascular risk is related to higher risk of cerebrovascular disease. In addition, FINGER participants did not have substantial cognitive impairment, and it is not yet clear how many of them will actually develop dementia in the future (an extended follow-up is currently ongoing).
In conclusion, the CAIDE Dementia Risk Score was related to indicators of cerebrovascular changes and neurodegeneration on MRI, but not to brain amyloid accumulation on PIB-PET. The CAIDE Dementia Risk Score is a simple and easily available tool for evaluating dementia risk profiles in midlife, and it is also related to WML, markers of brain atrophy, and cognitive performance in late-life. The lack of association with brain amyloid accumulation in this at-risk general population contrasts with reported links to AD-related CSF biomarkers in a memory clinic setting, and will need to be confirmed in studies with larger sample size.
ACKNOWLEDGMENTS
The authors wish to acknowledge the MIND-AD (Academy of Finland 291803, EU Joint Programme – Neurodegenerative Disease Research, JPND); Academy of Finland 278457, 287490, 294061, 258981 projects; EVO/VTR funding from Kuopio University Hospital for FINGER and MIND-AD projects; UEF Strategic funding for UEFBRAIN; Swedish Research Council; Knut and Alice Wallenberg Foundation Sweden; Alzheimerfonden Sweden; Alzheimer’s Research & Prevention Foundation USA; European Union 7th Framework Program for research, technological development and demonstration VPH-DARE@IT (Grant Agreement No: 601055); Center for Innovative Medicine (CIMED) at Karolinska Institutet Sweden; Stiftelsen Stockholms sjukhem Sweden; Konung Gustaf V:s och Drottning Victorias Frimurarstiftelse Sweden; AXA Research Fund; Sigrid Juselius Foundation (JOR), EVO/VTR funding from Turku University Hospital, Oulu University Hospital, Oulu City and South Ostrobothnia Central Hospital, Faculty of Health Sciences (University of Eastern Finland), Fund of Mauri and Sirkka Wiljasalo, and Finnish Cultural Foundation North Savo Regional Fund. The funding sources had no involvement in study design; in the collection, analysis and interpretation of data; in the writing of the report; and in the decision to submit the article for publication.
Authors’ disclosures available online (http://j-alz.com/manuscript-disclosures/17-0092r2).
Appendices
The supplementary material is available in the electronic version of this article: http://dx.doi.org/10.3233/JAD-170092.
REFERENCES
[1] | Norton S , Matthews FE , Barnes DE , Yaffe K , Brayne C ((2014) ) Potential for primary prevention of Alzheimer’s disease, an analysis of population-based data. Lancet Neurol 13: , 788–794. |
[2] | Tang EY , Harrison SL , Errington L , Gordon MF , Visser PJ , Novak G , Dufouil C , Brayne C , Robinson L , Launer LJ , Stephan BC ((2015) ) Current developments in dementia risk prediction modelling, an updated systematic review. PLoS One 10: , e0136181. |
[3] | Ngandu T , Lehtisalo J , Solomon A , Levalahti E , Ahtiluoto S , Antikainen R , Backman L , Hanninen T , Jula A , Laatikainen T , Lindstrom J , Mangialasche F , Paajanen T , Pajala S , Peltonen M , Rauramaa R , Stigsdotter-Neely A , Strandberg T , Tuomilehto J , Soininen H , Kivipelto M ((2015) ) A 2 year multidomain intervention of diet, exercise, cognitive training, and vascular risk monitoring versus control to prevent cognitive decline in at-risk elderly people (FINGER), a randomised controlled trial. Lancet 385: , 2255–2263. |
[4] | Moll van Charante EP , Richard E , Eurelings LS , van Dalen JW , Ligthart SA , van Bussel EF , Hoevenaar-Blom MP , Vermeulen M , van Gool WA ((2016) ) Effectiveness of a 6-year multidomain vascular care intervention to prevent dementia (preDIVA): A cluster-randomised controlled trial. Lancet 388: , 797–805. |
[5] | Andrieu S , Guyonnet S , Coley N , Cantet C , Bonnefoy M , Bordes S , Bories L , Cufi MN , Dantoine T , Dartigues JF , Desclaux F , Gabelle A , Gasnier Y , Pesce A , Sudres K , Touchon J , Robert P , Rouaud O , Legrand P , Payoux P , Caubere JP , Weiner M , Carrie I , Ousset PJ , Vellas B ((2017) ) Effect of long-term omega 3 polyunsaturated fatty acid supplementation with or without multidomain intervention on cognitive function in elderly adults with memory complaints (MAPT): A randomised, placebo-controlled trial. Lancet Neurol 16: , 377–389. |
[6] | Kivipelto M , Ngandu T , Laatikainen T , Winblad B , Soininen H , Tuomilehto J ((2006) ) Risk score for the prediction of dementia risk in 20 years among middle aged people, a longitudinal, population-based study. Lancet Neurol 5: , 735–741. |
[7] | Exalto LG , Quesenberry CP , Barnes D , Kivipelto M , Biessels GJ , Whitmer RA ((2014) ) Midlife risk score for the prediction of dementia four decades later. Alzheimers Dement 10: , 562–570. |
[8] | Vuorinen M , Spulber G , Damangir S , Niskanen E , Ngandu T , Soininen H , Kivipelto M , Solomon A ((2015) ) Midlife CAIDE dementia risk score and dementia-related brain changes up to 30 years later on magnetic resonance imaging. J Alzheimers Dis 44: , 93–101. |
[9] | Enache D , Solomon A , Cavallin L , Kareholt I , Kramberger MG , Aarsland D , Kivipelto M , Eriksdotter M , Winblad B , Jelic V ((2016) ) CAIDE Dementia Risk Score and biomarkers of neurodegeneration in memory clinic patients without dementia. Neurobiol Aging 42: , 124–131. |
[10] | Kaffashian S , Dugravot A , Elbaz A , Shipley MJ , Sabia S , Kivimaki M , Singh-Manoux A ((2013) ) Predicting cognitive decline, a dementia risk score vs. the Framingham vascular risk scores. Neurology 80: , 1300–1306. |
[11] | Reijmer YD , van den Berg E , van Sonsbeek S , Dekker JM , Nijpels G , Stehouwer CD , Kappelle LJ , Biessels GJ ((2011) ) Dementia risk score predicts cognitive impairment after a period of 15 years in a nondemented population. Dement Geriatr Cogn Disord 31: , 152–157. |
[12] | Kivipelto M , Solomon A , Ahtiluoto S , Ngandu T , Lehtisalo J , Antikainen R , Bäckman L , Hänninen T , Jula A , Laatikainen T , Lindström J , Mangialasche F , Nissinen A , Paajanen T , Pajala S , Peltonen M , Rauramaa R , Stigsdotter-Neely A , Strandberg T , Tuomilehto J , Soininen H ((2013) ) The Finnish Geriatric Intervention Study to Prevent Cognitive Impairment and Disability (FINGER), study design and progress. Alzheimers Dement 9: , 657–665. |
[13] | Ngandu T , Lehtisalo J , Levalahti E , Laatikainen T , Lindstrom J , Peltonen M , Solomon A , Ahtiluoto S , Antikainen R , Hanninen T , Jula A , Mangialasche F , Paajanen T , Pajala S , Rauramaa R , Strandberg T , Tuomilehto J , Soininen H , Kivipelto M ((2014) ) Recruitment and baseline characteristics of participants in the Finnish Geriatric Intervention Study to Prevent Cognitive Impairment and Disability (FINGER)-a randomized controlled lifestyle trial. Int J Environ Res Public Health 11: , 9345–9360. |
[14] | Borodulin K , Vartiainen E , Peltonen M , Jousilahti P , Juolevi A , Laatikainen T , Mannisto S , Salomaa V , Sundvall J , Puska P ((2015) ) Forty-year trends in cardiovascular risk factors in Finland. Eur J Public Health 25: , 539–546. |
[15] | Tuomilehto H , Peltonen M , Partinen M , Seppa J , Saaristo T , Korpi-Hyovalti E , Oksa H , Saltevo J , Puolijoki H , Vanhala M , Tuomilehto J ((2008) ) Sleep-disordered breathing is related to an increased risk for type 2 diabetes in middle-aged men, but not in women–the FIN-D2D survey. Diabetes Obes Metab 10: , 468–475. |
[16] | Miettinen ME , Kinnunen L , Leiviska J , Keinanen-Kiukaanniemi S , Korpi-Hyovalti E , Niskanen L , Oksa H , Saaristo T , Tuomilehto J , Vanhala M , Uusitupa M , Peltonen M ((2014) ) Association of serum 25-hydroxyvitamin D with lifestyle factors and metabolic and cardiovascular disease markers, population-based cross-sectional study (FIN-D2D). PLoS One 9: , e100235. |
[17] | Morris JC , Heyman A , Mohs RC , Hughes JP , van Belle G , Fillenbaum G , Mellits ED , Clark C , et al. The Consortium to Establish a Registry for Alzheimer’s Disease (CERAD) ((1989) ) Part I. Clinical and neuropsychological assessment of Alzheimer’s disease. Neurology 39: , 1159–1165. |
[18] | The World Health Organization MONICA Project (monitoring trends and determinants in cardiovascular disease), a major international collaboration ((1988) ) WHO MONICA Project Principal Investigators. J Clin Epidemiol 41: , 105–114. |
[19] | Tolonen H , Kuulasmaa K , Laatikainen T , Wolf H ((2002) ) European Health Risk Monitoring Project. Recommendation for Indicators, International Collaboration, Protocol and Manual of Operations for Chronic Disease Risk Factor Surveys. Project EHRM Helsinki, Finland, National Public Health Institute. |
[20] | De la Vega FM , Lazaruk KD , Rhodes MD , Wenz MH ((2005) ) Assessment of two flexible and compatible SNP genotyping platforms, TaqMan SNP Genotyping Assays and the SNPlex Genotyping System. Mutat Res 573: , 111–135. |
[21] | Harrison J , Minassian SL , Jenkins L , Black RS , Koller M , Grundman M ((2007) ) A neuropsychological test battery for use in Alzheimer disease clinical trials. Arch Neurol 64: , 1323–1329. |
[22] | Folstein MF , Folstein SE , McHugh PR . “Mini-mental state” ((1975) ) A practical method for grading the cognitive state of patients forthe clinician. J Psychiatr Res 12: , 189–198. |
[23] | Jack CR Jr , Wiste HJ , Weigand SD , Knopman DS , Mielke MM , Vemuri P , Lowe V , Senjem ML , Gunter JL , Reyes D , Machulda MM , Roberts R , Petersen RC ((2015) ) Different definitions of neurodegeneration produce similar amyloid/neurodegeneration biomarker group findings. Brain 138: , 3747–3759. |
[24] | Scheltens P , Leys D , Barkhof F , Huglo D , Weinstein HC , Vermersch P , Kuiper M , Steinling M , Wolters EC , Valk J ((1992) ) Atrophy of medial temporal lobes on MRI in “probable” Alzheimer’s disease and normal ageing, diagnostic value and neuropsychological correlates. J Neurol Neurosurg Psychiatry 55: , 967–972. |
[25] | Fazekas F , Chawluk JB , Alavi A , Hurtig HI , Zimmerman RA ((1987) ) MR signal abnormalities at 1.5 T in Alzheimer’s dementia and normal aging. AJR Am J Roentgenol 149: , 351–356. |
[26] | Kemppainen NM , Aalto S , Wilson IA , Nagren K , Helin S , Bruck A , Oikonen V , Kailajärvi M , Scheinin M , Viitanen M , Parkkola R , Rinne JO ((2006) ) Voxel-based analysis of PET amyloid ligand [11C]PIB uptake in Alzheimer disease. Neurology 67: , 1575–1580. |
[27] | Long SJ , Freese J ((2014) ) Regression Models for Categorical Dependent Variables using Stata, 3rd ed. Stata Press, College Station, TX. |
[28] | Schmidt R , Schmidt H , Haybaeck J , Loitfelder M , Weis S , Cavalieri M , Seiler S , Enzinger C , Ropele S , Erkinjuntti T , Pantoni L , Scheltens P , Fazekas F , Jellinger K ((2011) ) Heterogeneity in age-related white matter changes. Acta Neuropathol 122: , 171–185. |
[29] | Fagan AM ((2015) ) What does it mean to be ‘amyloid-positive’? Brain 138: , 514–516. |
[30] | Solomon A , Mangialasche F , Richard E , Andrieu S , Bennett DA , Breteler M , Breteler M , Fratiglioni L , Hooshmand B , Khachaturian AS , Schneider LS , Skoog I , Kivipelto M ((2014) ) Advances in the prevention of Alzheimer’s disease and dementia. J Intern Med 275: , 229–250. |
[31] | Jack CR Jr , Knopman DS , Jagust WJ , Petersen RC , Weiner MW , Aisen PS , Shaw LM , Vemuri P , Wiste HJ , Weigand SD , Lesnick TG , Pankratz VS , Donohue MC , Trojanowski JQ ((2013) ) Tracking pathophysiological processes in Alzheimer’s disease, an updated hypothetical model of dynamic biomarkers. Lancet Neurol 12: , 207–216. |
[32] | Dubois B , Hampel H , Feldman HH , Scheltens P , Aisen P , Andrieu S , Bakardjian H , Benali H , Bertram L , Blennow K , Broich K , Cavedo E , Crutch S , Dartigues JF , Duyckaerts C , Epelbaum S , Frisoni GB , Gauthier S , Genthon R , Gouw AA , Habert MO , Holtzman DM , Kivipelto M , Lista S , Molinuevo JL , O’Bryant SE , Rabinovici GD , Rowe C , Salloway S , Schneider LS , Sperling R , Teichmann M , Carrillo MC , Cummings J , Jack CR Jr ((2016) ) Preclinical Alzheimer’s disease: Definition, natural history, and diagnostic criteria. Alzheimers Dement 12: , 292–323. |
[33] | Schneider LS , Mangialasche F , Andreasen N , Feldman H , Giacobini E , Jones R , Mantua V , Mecocci P , Pani L , Winblad B , Kivipelto M ((2014) ) Clinical trials and late-stage drug development for Alzheimer’s disease: An appraisal from 1984 to 2014. J Intern Med 275: , 251–283. |
[34] | Dubois B , Feldman HH , Jacova C , Hampel H , Molinuevo JL , Blennow K , DeKosky ST , Gauthier S , Selkoe D , Bateman R , Cappa S , Crutch S , Engelborghs S , Frisoni GB , Fox NC , Galasko D , Habert MO , Jicha GA , Nordberg A , Pasquier F , Rabinovici G , Robert P , Rowe C , Salloway S , Sarazin M , Epelbaum S , de Souza LC , Vellas B , Visser PJ , Schneider L , Stern Y , Scheltens P , Cummings JL ((2014) ) Advancing research diagnostic criteria for Alzheimer’sdisease, the IWG-2 criteria. Lancet Neurol 13: , 614–629. |
[35] | Fjell AM , McEvoy L , Holland D , Dale AM , Walhovd KB , Alzheimer’s Disease Neuroimaging Initiative ((2014) ) What is normal in normal aging? Effects of aging, amyloid and Alzheimer’s disease on the cerebral cortex and the hippocampus. Prog Neurobiol 117: , 20–40. |
[36] | Jack CR Jr , Wiste HJ , Knopman DS , Vemuri P , Mielke MM , Weigand SD , Senjem ML , Gunter JL , Lowe V , Gregg BE , Pankratz VS , Petersen RC ((2014) ) Rates of beta-amyloid accumulation are independent of hippocampal neurodegeneration. Neurology 82: , 1605–1612. |
[37] | Fotuhi M , Do D , Jack C ((2012) ) Modifiable factors that alter the size of the hippocampus with ageing. Nat Rev Neurol 8: , 189–202. |
[38] | Chui HC , Zheng L , Reed BR , Vinters HV , Mack WJ ((2012) ) Vascular risk factors and Alzheimer’s disease, are these risk factors for plaques and tangles or for concomitant vascular pathology that increases the likelihood of dementia? An evidence-based review. Alzheimers Res Ther 4: , 1. |
[39] | Girouard H , Iadecola C ((2006) ) Neurovascular coupling in the normal brain and in hypertension, stroke, and Alzheimer disease. J Appl Physiol (1985) 100: , 328–335. |
[40] | Chetelat G ((2013) ) Alzheimer disease, Abeta-independent processes-rethinking preclinical AD. Nat Rev Neurol 9: , 123–124. |
[41] | Han X , Jovicich J , Salat D , van der Kouwe A , Quinn B , Czanner S , Busa E , Pacheco J , Albert M , Killiany R , Maguire P , Rosas D , Makris N , Dale A , Dickerson B , Fischl B ((2006) ) Reliability of MRI-derived measurements of human cerebral cortical thickness, the effects of field strength, scanner upgrade and manufacturer. Neuroimage 32: , 180–194. |
[42] | Reuter M , Schmansky NJ , Rosas HD , Fischl B ((2012) ) Within-subject template estimation for unbiased longitudinal image analysis. Neuroimage 61: , 1402–1418. |


