
Genetic Stratification to Identify Risk Groups for Alzheimer’s Disease
Abstract
Stratification by genetic risk factors for Alzheimer’s disease (AD) may help identify groups with the greatest disease risk. Biological changes that cause late-onset AD are likely to occur years, if not decades prior to diagnosis. Here, we select a subset of the Generation Scotland: Scottish Family Health Study cohort in a likely preclinical age-range of 60–70 years (subset n = 3,495 with cognitive and genetic data). We test for cognitive differences by polygenic risk scores for AD. The polygenic scores are constructed using all available SNPs, excluding those within a 500 kb distance of the APOE locus. Additive and multiplicative effects of APOE status on these associations are investigated. Small memory decrements were observed in those with high polygenic risk scores for AD (standardized beta –0.04, p = 0.020). These associations were independent of APOE status. There was no difference in AD polygenic scores across APOE haplotypes (p = 0.72). Individuals with high compared to low polygenic risk scores for AD (top and bottom 5% of the distribution) show cognitive decrements, albeit much smaller than for APOE ɛ4ɛ4 compared to ɛ3ɛ3 individuals (2.3 versus 3.5 fewer points on the processing speed test, and 1.8 versus 2.8 fewer points on the memory test). Polygenic risk scores for AD may help identify older individuals at greatest risk of cognitive decline and preclinical AD.
INTRODUCTION
It is widely acknowledged that the neuropathological hallmarks of Alzheimer’s disease (AD) present many years prior to diagnosis [1]. Cognitivedecrements are expected to be observed closer to clinical diagnosis [1]. Targeting individuals who are likely to be in the earliest stages of the disease is therefore a key focus for clinical trials and interventions [2–4].
Age is the biggest risk factor for AD although there are also genetic components to the disease. The apolipoprotein gene, APOE, which is involved in lipid transportation, confers the greatest known genetic risk of AD [5, 6]. APOE ɛ4ɛ4 homozygotes have a 14.9 increased odds of developing dementia compared to those with the ɛ3ɛ3 reference haplotype [7]. The ɛ4 allele has a frequency in the general population of around 15% [8], implying that just over 2% of the population are ɛ4ɛ4 homozygotes. Despite the well-replicated association between APOE and AD, relatively little is known about its functional role in the disease process [5], although many biological processes including neuroinflammation, neurotoxicity, and lipid metabolism among others have been highlighted [6].
In addition to APOE, several other genes have been implicated in the pathogenesis of AD [9]. As with many other diseases, AD is a polygenic trait whereby many genetic polymorphisms of small effect are likely to contribute to the disease process [9]. One method that incorporates many of these variants into a single measure is polygenic risk scoring [10]. This method uses existing results from genome-wide association studies (GWAS) to provide weights specific to each genetic polymorphism, which can then be applied to independent cohorts. Thus, each individual in an independent cohort can be assigned a genetic risk score that is based on potentially thousands of genetic variants that individually explain some fraction of the risk of AD. For example, polygenic scores for AD predict around 2% of the variance of AD in an independent cohort [11]. AD polygenic risk scores were also shown to discriminate best between cases and controls between the ages of 60 and 70 years [11].
Given the low frequency of the ɛ4ɛ4 haplotype, large sample population-based cohorts are required to study its effects with precision. A previous study utilizing one such cohort, Generation Scotland (n = 18,337), investigated cognitive ability by APOE status [12]. It found evidence for poorer memory and processing speed in ɛ4ɛ4 homozygotes (compared to ɛ3ɛ3 homozygotes) in a sub-sample of participants aged over 60 years. These age-stratified findings coincide with the theoretical predictions of Sperling et al. [1]. Furthermore, given the prediction models of AD development, it is plausible that cognitive decrements predictive of AD will be most notable in populations between the ages of 60 and 70, i.e., the decade prior to an exponential increase in ADdiagnosis.
The primary aim of this study is to test if there are cognitive decrements in those with a high polygenic risk of AD and to see how these effects compare with APOE ɛ4ɛ4 status. The analysis will focus on a sub-group from the Generation Scotland cohort in the age range of 60 to 70 years.
MATERIALS AND METHODS
Generation Scotland: Scottish Family Health Study
Data came from Generation Scotland: Scottish Family Health Study (hereafter referred to as Generation Scotland), a large population-based cohort sampled from five regional centers across Scotland [13, 14]. Initial recruitment focused on 7,953 individuals aged between 35 and 65 years, who were registered with a participating General Practice surgery; around 96% of the UK population is registered with a general medical practitioner. Relatives of these probands were then recruited. There were up to three generations of ∼7,000 participating families in the study, recruited between 2006 and 2011, yielding a cohort of over 24,000 subjects. There was no intended recruitment enrichment for any disease or health condition. Details on cognitive, anthropometric, and health measures were recorded. A full description of the cohort and the data collected have been reported elsewhere [13, 14] and at http://www.generationscotland.org.
Cognitive data
As previously described, four domains of cognitive function were assessed by single tests in nearly all Generation Scotland participants (n = 21,524): processing speed (Wechsler Digit Symbol Substitution Test [15]), verbal declarative memory (Wechsler Logical Memory Test; sum of immediate and delayed recall of one paragraph [16]), verbal fluency (the phonemic Verbal Fluency Test; using the letters C, F, and L, each for one minute [17]), and vocabulary (the Mill Hill Vocabulary Scale; junior and senior synonyms combined [18]). As a previous Generation Scotland study showed evidence for age-related cognitive decrements in processing speed and verbal declarative memory but not verbal fluency or vocabulary [12], we focused here on the former two outcomes only.
Genetic data
Genome wide genotyping and APOE haplotyping details have been described previously [12]. Briefly, Generation Scotland participants were genotyped with either the HumanOmniExpressExome8v1-2_A or HumanOmniExpressExome-8v1_A. Quality control was carried out in PLINK version 1.9b2c [19, 20]. SNPs were removed if they had a missingness rate >2% or a Hardy-Weinberg Equilibrium test p < 10–6. Duplicate samples were removed. Individuals were removed based on gender mismatch and missingness (>2% of genotypes missing). The subsequent data were combined with the 1,092 individuals of the 1000 Genomes population [21] prior to principal components being calculated in GCTA [22]. Outliers, defined by being more than six standard deviations away from the mean of the first two principal components, were removed [23]. This left a sample of 20,032 participants.
APOE haplotype status depends on the genotypes of two single nucleotide polymorphisms (SNPs), rs429358 and rs7412 that can form three possible haplotypes: ɛ2, ɛ3, and ɛ4 [24]). Array genotyping of these SNPs is technically difficult and, as a result, they are not available on the majority of commercial arrays. SNP genotypes were thus obtained using Taqman technology at the Wellcome Trust Clinical Research Facility Genetics Core, Edinburgh. Blood samples from Generation Scotland participants were collected, processed, and stored using standard operating procedures and managed through a laboratory information management system at the Wellcome Trust Clinical Research Facility Genetics Core, Edinburgh [25]. APOE genotyping data were available on 21,039 individuals.
Analysis cohort
After merging the APOE, GWAS, and cognitive data, and after excluding individuals withself-reported AD (or a missing value) and restricting the cohort to individuals aged between 60 and 70 years, inclusive, the analysis population contained 3,495 participants. A flowchart documenting the selection process is provided in Fig. 1.
Polygenic risk scores
Polygenic risk scores for AD were calculated using the PRSice software program with LD clumping parameters set to R2 > 0.25 over 250 kb sliding windows [26]. The discovery GWAS from which the SNP weights were extracted was the Stage I AD GWAS analysis by Lambert et al. [27]. The Generation Scotland polygenic scores were generated using all possible SNPs (p < 1) from the discovery GWAS [27] but excluding those within a 500 kb window of APOE. The p < 1 selection threshold was based on previous polygenic score models for AD, verbal-numerical reasoning (cognitive ability), and educational attainment [11, 28]. In these studies, while p < 1 was not the optimal threshold for AD and verbal-numerical reasoning (p < 0.5 and p < 0.05, respectively), there were negligible differences with the results for the p < 1 threshold. A total of 539,368 genotyped Generation Scotland SNPs (with MAF <5%) were used to construct the score using weights from the Stage I analysis of Lambert et al. [27]. The Lambert et al. study was a meta-analysis GWAS of the 1000 Genomes imputed SNPs (nSNPs >7,000,000). After excluding 2,581 SNPs within a 500 kb region of APOE, we mapped the remaining SNPs to the overlapping genotyped variants in Generation Scotland. A summary of the methods and acknowledgements from the discovery GWAS [27] are presented in the Supplementary Material.
Ethics
All components of Generation Scotland received ethical approval from the NHS Tayside Committee on Medical Research Ethics (REC Reference Number: 05/S1401/89). Generation Scotland has also been granted Research Tissue Bank status by the Tayside Committee on Medical Research Ethics (REC Reference Number: 15/0040/ES), providing generic ethical approval for a wide range of uses within medical research.
Statistical analyses
Linear mixed modelling was used to test for differences in cognitive ability by AD polygenic risk scores and APOE status. A mixed modelling framework is necessary to account for potential relatedness between participants; familial relationships were fitted using a pedigree-based kinship matrix. The polygenic score was entered as either a continuous variable or as ventiles (5% groupings) of risk. A fully adjusted model added self-reported educational attainment, hypertension, stroke, diabetes, heart disease, and depression, along with a measure of social deprivation (Scottish Index of Multiple Deprivation) [12]. A sample size of 3,495 is sufficient to detect an effect size with an R2 of 0.18% for a type-I error of α= 0.05 at 80% power using a one-sided test. APOE was entered as a factor with e3 homozygotes as the reference category for all other haplotype combinations.
All analyses were conducted in R, using the ‘pwr’, ‘kinship2’, and ‘coxme’ packages [29–32].
RESULTS
Description of the polygenic risk score cohort (n = 3,495, age-range 60–70 years)
A demographic summary of the target population aged between 60 and 70 years and with AD polygenic risk scores is presented in Table 1. The median age of the cohort was 63 (IQR 61–65) and 57% were female. The mean BMI of the cohort was 27.5 kg/m2 (SD 5.0). The median educational attainment was 12–13 years (measured categorically). The self-reported health questionnaire identified 27% of participants withself-reported hypertension, 9% with depression, 6% with diabetes, 2% with stroke, and 8% with heart disease.
Cognitive differences by AD polygenic score with and without adjustment for APOE status (n = 3,495, age-range 60–70 years)
There was a statistically significant association between the polygenic score and memory (Table 2): effect size of –0.31 points per SD of the polygenic score, SE 0.14, p = 0.020. A similar effect size was observed for processing speed although it was not significantly different from the null (effect size –0.28, SE 0.24, p = 0.25). There was no difference in polygenic score by APOE genotype (age- and sex-adjusted ANOVA p = 0.72). Moreover, the effect size for the polygenic score in the memory model remained significant and was not attenuated after adjusting for APOE haplotype (effect size –0.30 points, SE = 0.14, p = 0.025); there was also no evidence for an APOE x polygenic score interaction (likelihood ratio test P = 0.40). Similarly, there was no evidence of an APOE x polygenic score interaction for the processing speed model (likelihood ratio test p = 0.86). In the fully adjusted models, which controlled for self-reported diabetes, stroke, heart disease, diabetes, and depression, along with educational attainment and a social deprivation index, there was a slight increase in the effect size of the polygenic score on both the memory and processing speed measures: effect sizes of –0.34, SE 0.14, p = 0.014 and –0.31, SE 0.24, p = 0.20, respectively.
Cognitive differences in the top versus bottom 5% of the polygenic score distribution (age-range 60–70 years)
A significant association was observed in the age- and sex-adjusted analyses that compared the top and bottom ventile (5%) of the polygenic distribution for memory differences. Those in the top (highest AD risk) ventile scored a mean of 1.8 points (SE 0.8, p = 0.028) lower than those in the bottom ventile on the memory test; for processing speed, those in the top ventile scored a mean of 2.3 points (SE 1.5, p = 0.13) lower than the bottom ventile.
Cognitive differences by APOE status (n = 3,495, age-range 60–70 years)
In a regression of cognitive ability on age, sex, and APOE, ɛ4ɛ4 homozygotes scored a mean of 2.8 and 3.5 points lower on memory and processing speed (p = 0.001 and p = 0.022, respectively) compared to ɛ3ɛ3 homozygotes.
Sensitivity and secondary analyses
While a kinship matrix was included to model relatedness between participants, a sensitivity analysis on only unrelated individuals was performed. A genetic relationship matrix was created in GCTA and unrelated individuals (relationship coefficient <0.025) were retained (n = 2,677). In this sub-group, we observed results consistent with the primary analysis (Supplementary Table 1).
A second sensitivity analysis was run after excluding those with fewer than 5 years of education (n = 12) or a missing value for education (n = 130). These results were consistent with the primary analysis (Supplementary Table 2).
To determine if cognitive decrements by AD polygenic scores were present at younger ages, we selected an analysis sub-cohort in the age range of 45 to 60 years (n = 6,853). We observed generally smaller effect sizes to the 60 to 70 sub-group that were all non-significant (Supplementary Table 3). Similarly, we observed null associations between the polygenic score and cognitive decrements in a sub-group of participants aged over 70 years (Supplementary Table 4).
DISCUSSION
In a group of over 3,000 individuals aged between 60 and 70 years, polygenic risk scores for AD were associated with decrements for memory but not processing speed. This was the case when considering polygenic risk on a continuum and also when comparing the extremes (top and bottom 5%) of the distribution.
The main limitation of the current study is the sample size. The power calculation showed that the total number of participants in the 60–70 age range was only just sufficient to detect relatively small memory decrements by AD polygenic score status. The relatively modest association p-values for the primary analyses (Table 2) reflect this lack of power. The associations remained significant after a FDR correction; only the APOE association with Logical Memory would remain significant after a Bonferroni correction (p < 0.05/6).
Another possible limitation is the construction of the AD polygenic risk predictor. As the number of cases and controls increases in the discovery GWAS [27], the precision and reliability of the SNP regression weights will improve. The cross-sectional design of the Generation Scotland analysis may also be a limitation, as might the lack of information on subjective memory complaints. One recent study showed that a high genetic score for AD (based on 22 top SNP hits from a GWAS study) was associated with steeper decline in memory, although the magnitude of the effect was reduced when the APOE locus was removed from the score [33].
With sufficiently large sample sizes, it is likely that cognitive differences in processing speed will be present in the general population for those with high versus low polygenic risk of AD. Larger discovery GWAS studies will also help to identify the optimal number of SNPs (all SNPs in a truly polygenic architecture versus a smaller number of possibly more biologically informative SNPs) for a polygenic predictor. The genetic contribution to AD has been shown to overlap with the genetics of education, intelligence, and income but not other health, disease, or psychiatric outcomes [28, 34, 35]. Intuitively, we would therefore expect to see phenotypic differences across all ranges of the polygenic scores and more acutely with the extremes of the distribution.
The most comprehensive study to have examined the association between polygenic scores for AD with cognitive function [28] used a predictor based on the Lambert et al. discovery GWAS [27]. The independent target dataset in that study was the UK Biobank study. Small but significant associations, not explaining more than 0.05% of the variance in three cognitive traits and 0.07% of the variance in educational attainment were observed [28].
In conclusion, there is potential clinical utility for the stratification of mid-to-late-life population-based cohorts into high and low risk groups (based on APOE status and global polygenic risk) to better understand the pathophysiology of AD. However, large sample sizes for both the GWASs used to build the polygenic scores and to select at risk sub-groups of the population are likely to be necessary. By contrast, smaller sample sizes are likely to be required when stratifying by APOE ɛ4ɛ4 status, as effect sizes are far greater in magnitude. Nonetheless, with increasingly powerful polygenic predictors— as a result of bigger baseline GWAS studies— it seems likely that the extremes of the distribution will provide high risk groups equivalent to those with two ɛ4 alleles. However, the extremes of the polygenic score distribution will be of additional value as, by definition of their construction, they will tap into genome wide risk and multiple pathways that lead to AD. Longitudinal collection of cognitive test data in addition to biomarker panels and ‘omics data, such as methylomics, which have been linked to AD pathology [36] may help illuminate biological signatures for AD, and improve long-term prediction of the disease.
ACKNOWLEDGMENTS
This work was supported by multiple sources. Generation Scotland received core funding from the Chief Scientist Office of the Scottish Government Health Directorates CZD/16/6 and the Scottish Funding Council HR03006. We are grateful to all the families who took part, the general practitioners and the Scottish School of Primary Care for their help in recruiting them, and the whole Generation Scotland team, which includes interviewers, computer and laboratory technicians, clerical workers, research scientists, volunteers, managers, receptionists, healthcare assistants and nurses. Genotyping of the GS:SFHS samples was carried out by the Genetics Core Laboratory at the Wellcome Trust Clinical Research Facility, Edinburgh, Scotland and was funded by the UK Medical Research Council (MRC) and the Wellcome Trust (Wellcome Trust Strategic Award “STratifying Resilience and Depression Longitudinally” (STRADL) Reference 104036/Z/14/Z). The Quantitative Trait Locus team at the Human Genetics Unit are funded by the MRC. REM, SPH, DJP, PMV, and IJD undertook the work within The University of Edinburgh Centre for Cognitive Ageing and Cognitive Epidemiology (MR/K026992/1), part of the cross council Lifelong Health andWellbeing Initiative. Funding from the BBSRC, and MRC is gratefully acknowledged. We thank Professor Julie Williams for providing comments on an early draft of the manuscript.
Authors’ disclosures available online (http://j-alz.com/manuscript-disclosures/16-1070r2).
Appendices
The supplementary material is available in the electronic version of this article: http://dx.doi.org/10.3233/JAD-161070.
REFERENCES
[1] | Sperling RA , Aisen PS , Beckett LA , Bennett DA , Craft S , Fagan AM , Iwatsubo T , Jack CR , Kaye J , Montine TJ , Park DC , Reiman EM , Rowe CC , Siemers E , Stern Y , Yaffe K , Carrillo MC , Thies B , Morrison-Bogorad M , Wagster MV , Phelps CH ((2011) ) Toward defining the preclinical stages of Alzheimer’s disease: Recommendations from the National Institute on Aging-Alzheimer’s Association workgroups on diagnostic guidelines for Alzheimer’s disease. Alzheimers Dement 7: , 280–292. |
[2] | Ritchie CW , Molinuevo JL , Truyen L , Satlin A , Van der Geyten S , Lovestone S ((2016) ) Development of interventions for the secondary prevention of Alzheimer’s dementia: The European Prevention of Alzheimer’s Dementia (EPAD) project. Lancet Psychiatry 3: , 179–186. |
[3] | Ritchie CW , Ritchie K ((2012) ) The PREVENT study: A prospective cohort study to identify mid-life biomarkers of late-onset Alzheimer’s disease. BMJ Open 2: , pii: e001893. |
[4] | Winblad B , Amouyel P , Andrieu S , Ballard C , Brayne C , Brodaty H , Cedazo-Minguez A , Dubois B , Edvardsson D , Feldman H , Fratiglioni L , Frisoni GB , Gauthier S , Georges J , Graff C , Iqbal K , Jessen F , Johansson G , Jönsson L , Kivipelto M , Knapp M , Mangialasche F , Melis R , Nordberg A , Rikkert MO , Qiu C , Sakmar TP , Scheltens P , Schneider LS , Sperling R , Tjernberg LO , Waldemar G , Wimo A , Zetterberg H ((2016) ) Defeating Alzheimer’s disease and other dementias: A priority for European science and society. Lancet Neurol 15: , 455–532. |
[5] | Liu CC , Liu CC , Kanekiyo T , Xu H , Bu G ((2013) ) Apolipoprotein E and Alzheimer disease: Risk, mechanisms and therapy. Nat Rev Neurol 9: , 106–118. |
[6] | Yu JT , Tan L , Hardy J ((2014) ) Apolipoprotein E in Alzheimer’s disease: An update. Annu Rev Neurosci 37: , 79–100. |
[7] | Corder EH , Saunders AM , Risch NJ , Strittmatter WJ , Schmechel DE , Gaskell PC , Rimmler JB , Locke PA , Conneally PM , Schmader KE ((1994) ) Protective effect of apolipoprotein E type 2 allele for late onset Alzheimer disease. Nat Genet 7: , 180–184. |
[8] | Eisenberg DT , Kuzawa CW , Hayes MG ((2010) ) Worldwide allele frequencies of the human apolipoprotein E gene: Climate, local adaptations, and evolutionary history. Am J Phys Anthropol 143: , 100–111. |
[9] | Escott-Price V , Bellenguez C , Wang LS , Choi SH , Harold D , Jones L , Holmans P , Gerrish A , Vedernikov A , Richards A , DeStefano AL , Lambert JC , Ibrahim-Verbaas CA , Naj AC , Sims R , Jun G , Bis JC , Beecham GW , Grenier-Boley B , Russo G , Thornton-Wells TA , Denning N , Smith AV , Chouraki V , Thomas C , Ikram MA , Zelenika D , Vardarajan BN , Kamatani Y , Lin CF , Schmidt H , Kunkle B , Dunstan ML , Vronskaya M , Johnson AD , Ruiz A , Bihoreau MT , Reitz C , Pasquier F , Hollingworth P , Hanon O , Fitzpatrick AL , Buxbaum JD , Campion D , Crane PK , Baldwin C , Becker T , Gudnason V , Cruchaga C , Craig D , Amin N , Berr C , Lopez OL , De Jager PL , Deramecourt V , Johnston JA , Evans D , Lovestone S , Letenneur L , Hernández I , Rubinsztein DC , Eiriksdottir G , Sleegers K , Goate AM , Fiévet N , Huentelman MJ , Gill M , Brown K , Kamboh MI , Keller L , Barberger-Gateau P , McGuinness B , Larson EB , Myers AJ , Dufouil C , Todd S , Wallon D , Love S , Rogaeva E , Gallacher J , George-Hyslop PS , Clarimon J , Lleo A , Bayer A , Tsuang DW , Yu L , Tsolaki M , Bossú P , Spalletta G , Proitsi P , Collinge J , Sorbi S , Garcia FS , Fox NC , Hardy J , Naranjo MC , Bosco P , Clarke R , Brayne C , Galimberti D , Scarpini E , Bonuccelli U , Mancuso M , Siciliano G , Moebus S , Mecocci P , Zompo MD , Maier W , Hampel H , Pilotto A , Frank-García A , Panza F , Solfrizzi V , Caffarra P , Nacmias B , Perry W , Mayhaus M , Lannfelt L , Hakonarson H , Pichler S , Carrasquillo MM , Ingelsson M , Beekly D , Alvarez V , Zou F , Valladares O , Younkin SG , Coto E , Hamilton-Nelson KL , Gu W , Razquin C , Pastor P , Mateo I , Owen MJ , Faber KM , Jonsson PV , Combarros O , O’Donovan MC , Cantwell LB , Soininen H , Blacker D , Mead S , Mosley TH , Bennett DA , Harris TB , Fratiglioni L , Holmes C , de Bruijn RF , Passmore P , Montine TJ , Bettens K , Rotter JI , Brice A , Morgan K , Foroud TM , Kukull WA , Hannequin D , Powell JF , Nalls MA , Ritchie K , Lunetta KL , Kauwe JS , Boerwinkle E , Riemenschneider M , Boada M , Hiltunen M , Martin ER , Schmidt R , Rujescu D , Dartigues JF , Mayeux R , Tzourio C , Hofman A , Nöthen MM , Graff C , Psaty BM , Haines JL , Lathrop M , Pericak-Vance MA , Launer LJ , Van Broeckhoven C , Farrer LA , van Duijn CM , Ramirez A , Seshadri S , Schellenberg GD , Amouyel P , Williams J , Olson J , Kronmal R , Arnold AM , Robbins J , Carlson M , Burke G , Kuller LH , Tracy R , Gottdiener J , Prineas R , Becker JT , Enright P , Klein R , O’Leary DH ((2014) ) Gene-wide analysis detects two new susceptibility genes for Alzheimer’s disease. PLoS One 9: , e94661. |
[10] | Purcell SM , Wray NR , Stone JL , Visscher PM , O’Donovan MC , Sullivan PF , Sklar P ((2009) ) Common polygenic variation contributes to risk of schizophrenia and bipolar disorder. Nature 460: , 748–752. |
[11] | Escott-Price V , Sims R , Bannister C , Harold D , Vronskaya M , Majounie E , Badarinarayan N , Morgan K , Passmore P , Holmes C , Powell J , Brayne C , Gill M , Mead S , Goate A , Cruchaga C , Lambert JC , van Duijn C , Maier W , Ramirez A , Holmans P , Jones L , Hardy J , Seshadri S , Schellenberg GD , Amouyel P , Williams J , Abraham R , Hollingworth P , Gerrish A , Chapman J , Russo G , Hamshere M , Pahwa JS , Dowzell K , Williams A , Jones N , Thomas C , Stretton A , Morgan A , Taylor S , Lovestone S , Proitsi P , Lupton MK , Rubinsztein DC , Lawlor B , Lynch A , Brown K , Craig D , McGuinness B , Todd S , Johnston J , Mann D , Smith A , Love S , Kehoe PG , Fox N , Rossor M , Collinge J , Jessen F , Heun R , Schürmann B , Becker T , Herold C , Lacour A , Drichel D , van den Bussche H , Heuser I , Kornhuber J , Wiltfang J , Dichgans M , Frölich L , Hampel H , Hüll M , Rujescu D , Kauwe JS , Nowotny P , Morris JC , Mayo K , Livingston G , Bass NJ , Gurling H , McQuillin A , Gwilliam R , Deloukas P , Al-Chalabi A , Shaw CE , Singleton AB , Guerreiro R , Mühleisen TW , Nöthen MM , Moebus S , Jöckel KH , Klopp N , Wichmann HE , Carrasquillo MM , Pankratz VS , Younkin SG , ODonovan M , Owen MJ ((2015) ) Common polygenic variation enhances risk prediction for Alzheimer’s disease. Brain 138: (Pt12), 3673–3684. |
[12] | Marioni RE , Campbell A , Scotland G , Hayward C , Porteous DJ , Deary IJ ((2016) ) Differential effects of the APOE e4 allele on different domains of cognitive ability across the life-course. Eur J Hum Genet 24: , 919–923. |
[13] | Smith BH , Campbell A , Linksted P , Fitzpatrick B , Jackson C , Kerr SM , Deary IJ , Macintyre DJ , Campbell H , McGilchrist M , Hocking LJ , Wisely L , Ford I , Lindsay RS , Morton R , Palmer CN , Dominiczak AF , Porteous DJ , Morris AD ((2013) ) Cohort Profile: Generation Scotland: Scottish Family Health Study (GS:SFHS). The study, its participants and their potential for genetic research on health and illness. Int J Epidemiol 42: , 689–700. |
[14] | Smith BH , Campbell H , Blackwood D , Connell J , Connor M , Deary IJ , Dominiczak AF , Fitzpatrick B , Ford I , Jackson C , Haddow G , Kerr S , Lindsay R , McGilchrist M , Morton R , Murray G , Palmer CN , Pell JP , Ralston SH , St Clair D , Sullivan F , Watt G , Wolf R , Wright A , Porteous D , Morris AD ((2006) ) Generation Scotland: The Scottish Family Health Study; a new resource for researching genes and heritability. BMC Med Genet 7: , 74. |
[15] | Wechsler D ((1998) ) WAIS-III UK Wechsler Adult Intelligence Scale, Psychological Corporation, London, UK. |
[16] | Wechsler D ((1998) ) WMS-III UK, Wechsler Memory Scale-Revised, Psychological Corporation, London, UK. |
[17] | Lezak MD ((1995) ) Neuropsychological Assessment, 3rd edition. Oxford University Press, Oxford, UK. |
[18] | Raven JC , Court JH , Raven J ((1977) ) Manual for Raven’s Progressive Matrices and Vocabulary Scales. HK Lewis, London, UK. |
[19] | Chang CC , Chow CC , Tellier LC , Vattikuti S , Purcell SM , Lee JJ ((2015) ) Second-generation PLINK: Rising to the challenge of larger and richer datasets. Gigascience 4: , 7. |
[20] | Purcell S , Chang CC ((2015) ) PLINK 1.9 package. URL: https://www.coggenomics.org/plink2 |
[21] | The 1000 Genomes Project, Consortium ((2010) ) A map of human genome variation from population-scale sequencing. Nature 467: , 1061–1073. |
[22] | Yang J , Lee SH , Goddard ME , Visscher PM ((2011) ) GCTA: A tool for genome-wide complex trait analysis. Am J Hum Genet 88: , 76–82. |
[23] | Amador C , Huffman J , Trochet H , Campbell A , Porteous D , Wilson JF , Hastie N , Vitart V , Hayward C , Navarro P , Haley CS ((2015) ) Recent genomic heritage in Scotland. BMC Genomics 16: , 437. |
[24] | Wenham PR , Price WH , Blandell G ((1991) ) Apolipoprotein E genotyping by one-stage PCR. Lancet 337: , 1158–1159. |
[25] | Kerr SM , Campbell A , Murphy L , Hayward C , Jackson C , Wain LV , Tobin MD , Dominiczak A , Morris A , Smith BH , Porteous DJ ((2013) ) Pedigree and genotyping quality analyses of over 10,000 DNA samples from the Generation Scotland: Scottish Family Health Study. BMC Med Genet 14: , 38. |
[26] | Euesden J , Lewis CM , O’Reilly PF ((2015) ) PRSice: Polygenic Risk Score software. Bioinformatics 31: , 1466–1468. |
[27] | Lambert JC , Ibrahim-Verbaas CA , Harold D , Naj AC , Sims R , Bellenguez C , DeStafano AL , Bis JC , Beecham GW , Grenier-Boley B , Russo G , Thorton-Wells TA , Jones N , Smith AV , Chouraki V , Thomas C , Ikram MA , Zelenika D , Vardarajan BN , Kamatani Y , Lin CF , Gerrish A , Schmidt H , Kunkle B , Dunstan ML , Ruiz A , Bihoreau MT , Choi SH , Reitz C , Pasquier F , Cruchaga C , Craig D , Amin N , Berr C , Lopez OL , De Jager PL , Deramecourt V , Johnston JA , Evans D , Lovestone S , Letenneur L , Morón FJ , Rubinsztein DC , Eiriksdottir G , Sleegers K , Goate AM , Fiévet N , Huentelman MW , Gill M , Brown K , Kamboh MI , Keller L , Barberger-Gateau P , McGuiness B , Larson EB , Green R , Myers AJ , Dufouil C , Todd S , Wallon D , Love S , Rogaeva E , Gallacher J , St George-Hyslop P , Clarimon J , Lleo A , Bayer A , Tsuang DW , Yu L , Tsolaki M , Bossú P , Spalletta G , Proitsi P , Collinge J , Sorbi S , Sanchez-Garcia F , Fox NC , Hardy J , Deniz Naranjo MC , Bosco P , Clarke R , Brayne C , Galimberti D , Mancuso M , Matthews F , Moebus S , Mecocci P , Del Zompo M , Maier W , Hampel H , Pilotto A , Bullido M , Panza F , Caffarra P , Nacmias B , Gilbert JR , Mayhaus M , Lannefelt L , Hakonarson H , Pichler S , Carrasquillo MM , Ingelsson M , Beekly D , Alvarez V , Zou F , Valladares O , Younkin SG , Coto E , Hamilton-Nelson KL , Gu W , Razquin C , Pastor P , Mateo I , Owen MJ , Faber KM , Jonsson PV , Combarros O , O’Donovan MC , Cantwell LB , Soininen H , Blacker D , Mead S , Mosley TH , Bennett DA , Harris TB , Fratiglioni L , Holmes C , de Bruijn RF , Passmore P , Montine TJ , Bettens K , Rotter JI , Brice A , Morgan K , Foroud TM , Kukull WA , Hannequin D , Powell JF , Nalls MA , Ritchie K , Lunetta KL , Kauwe JS , Boerwinkle E , Riemenschneider M , Boada M , Hiltuenen M , Martin ER , Schmidt R , Rujescu D , Wang LS , Dartigues JF , Mayeux R , Tzourio C , Hofman A , Nöthen MM , Graff C , Psaty BM , Jones L , Haines JL , Holmans PA , Lathrop M , Pericak-Vance MA , Launer LJ , Farrer LA , van Duijn CM , Van Broeckhoven C , Moskvina V , Seshadri S , Williams J , Schellenberg GD , Amouyel P , Alpérovitch A , Boland A , Delépoine M , Dubois B , Duron E , Epelbaum J , Van Cauwenberghe C , Engelborghs S , Vandenberghe R , De Deyn PP , Ferri R , Romano C , Caltagirone C , Orfei MD , Ciaramella A , Scarpini E , Fenoglio C , Siciliano G , Bonuccelli U , Bagnoli S , Bracco L , Bessi V , Cecchetti R , Bastgiani P , Squassina A , Seripa D , Frank-García A , Sastre I , Blesa R , Alcolea D , Suárez-Clavet M , Sánchez-Juan P , Muñoz Fernandez C , Aladro Benito Y , Thonberg H , Forshell C , Lilus L , Kinhult-Ståhlbom A , Giedraitis V , Kilander L , Brundin RM , Concari L , Helisalmi S , Koivisto AM , Haapasalo A , Solfrizzi V , Frisardi V , Ott J , Carney RM , Mash DC , Albert MS , Albin RL , Apostolova LG , Arnold SE , Barmada MM , Barnes LL , Beach TG , Bigio EH , Bird TD , Boeve BF , Bowen JD , Boxer A , Burk JR , Cairns NJ , Cao C , Carlson CS , Carroll SL , Chibnik LB , Chui HC , Clark DG , Corneveaux J , Cribbs DG , DeCarli C , DeKosky ST , Demirci FY , Dick M , Dickson DW , Duara R , Ertekin-Taner N , Fallon KB , Farlow MR , Ferris S , Frosch MP , Galasko GR , Ganguli M , Gearing M , Geschwind DH , Ghetti B , Gilman S , Glass JD , Growdon JH , Hamilton RL , Harrell LE , Head E , Honig LS , Hulette CM , Hyman BT , Jarvik GP , Jicha GA , Jin LW , Karydas A , Kauwe JS , Kaye JA , Kim R , Koo EH , Kowall NW , Kramer JH , Kramer P , LaFerla FM , Lah JJ , Levernez JB , Levey AI , Li G , Lieberman AP , Lyketsos CG , Mack WJ , Marson DC , Martiniuk F , Masliah E , McCormick WC , McCurry SM , McDavid AN , McKee AC , Mesulam M , Miller BL , Miller CA , Miller JW , Morris JC , Murrell JR , Olichney JM , Pankratz VS , Parasi JE , Peskind E , Peterson RC , Pierce A , Poon WW , Potter H , Quinn JF , Raj A , Raskind M , Raiman EM , Reisberg B , Ringman JM , Roberson ED , Rosen HJ , Rosenberg RN , Sano M , Saykin AJ , Schneider JA , Schneider LS , Seely WW , Smith AG , Sonnen JA , Spina S , Stern RA , Tanzi RE , Trojanowski JQ , Troncoso JC , Van Deerlin VM , Van Eldik LJ , Vinters HV , Vonsattel JP , Weintraub S , Welsh-Bohmer KA , Williamson J , Woltjer RL , Yu CE , Barber R , Au R , Wolf PA , Beiser A , Debette S , Yang Q , Weinstein G , Johnson AD , Wang J , Uitterlinden AG , Rivadeneira F , Koudstgaal PJ , Longstreth WT , Becker JT , Kuller LH , Lumley T , Rice K , Garcia M , Aspelund T , Marksteiner JJ , Dal-Bianco P , Töglhofer AM , Freudenberger P , Ransmayr G , Benke T , Toeglhofer AM , Bressler J , Breteler MM , Fornage M , Hernández I , Rosende Roca M , Ana Mauleón M , Alegrat M , RamÍrez-Lorca R , González-Perez A , Chapman J , Stretton A , Morgan A , Kehoe PG , Medway C , Lord J , Turton J , Hooper NM , Vardy E , Warren JD , Schott JM , Uphill J , Ryan N , Rossor M , Ben-Shlomo Y , Makrina D , Gkatzima O , Lupton M , Koutroumani M , Avramidou D , Germanou A , Jessen F , Riedel-Heller S , Dichgans M , Heun R , Kölsch H , Schürmann B , Herold C , Lacour A , Drichel D , Hoffman P , Kornhuber J , Gu W , Feulner T , van den Bussche H , Lawlor B , Lynch A , Mann D , Smith AD , Warden D , Wilcock G , Heuser I , Wiltgang J , Frölich L , Hüll M , Mayo K , Livingston G , Bass NJ , Gurling H , McQuillen A , Gwilliam R , Deloukas P , Al-Chalabi A , Shaw CE , Singleton AB , Guerreiro R , Jöckel KH , Klopp N , Wichmann HE , Dickson DW , Graff-Radford NR , Ma L , Bisceglio G , Fisher E , Warner N , Pickering-Brown S ((2013) ) Meta-analysis of 74,046 individuals identifies 11 new susceptibility loci for Alzheimer’s disease. Nat Genet 45: , 1452–1458. |
[28] | Hagenaars SP , Harris SE , Davies G , Hill WD , Liewald DC , Ritchie SJ , Marioni RE , Fawns-Ritchie C , Cullen B , Malik R , Worrall BB , Sudlow CL , Wardlaw JM , Gallacher J , Pell J , McIntosh AM , Smith DJ , Gale CR , Deary IJ ((2016) ) Shared genetic aetiology between cognitive functions and physical and mental health in UK Biobank (N=112 151) and 24 GWAS consortia. Mol Psychiatry 21: , 1624–1632. |
[29] | Champely S ((2015) ) pwr: Basic Functions for Power Analysis. R package version 1.1-3. https://CRAN.R-project.org/package=pwr |
[30] | R Core Team ((2013) ) R: A Language and Environment for Statistical Computing. |
[31] | Therneau TM ((2015) ) coxme: Mixed Effects Cox Models. R package version 2.2-5. https://CRAN.R-project.org/package=coxme |
[32] | Therneau TM , Sinnwell J ((2015) ) kinship2: Pedigree. Functions. R package version 1.6.4. https://CRAN.R-project.org/package=kinship2 |
[33] | Marden JR , Mayeda ER , Walter S , Vivot A , Tchetgen Tchetgen EJ , Kawachi I , Glymour MM ((2016) ) Using an Alzheimer disease polygenic risk score to predict memory decline in black and white Americans over 14 years of follow-up. Alzheimer Dis Assoc Disord 30: , 195–202. |
[34] | Bulik-Sullivan B , Finucane HK , Anttila V , Gusev A , Day FR , Loh PR , Duncan L , Perry JR , Patterson N , Robinson EB , Daly MJ , Price AL , Neale BM ((2015) ) An atlas of genetic correlations across human diseases and traits. Nat Genet 47: , 1236–1241. |
[35] | Hill WD , Hagenaars SP , Marioni RE , Harris SE , Liewald DC , Davies G , Okbay A , McIntosh AM , Gale CR , Deary IJ ((2016) ) Molecular genetic contributions to social deprivation and household income in UK biobank. Curr Biol 26: , 3083–3089. |
[36] | Lunnon K , Smith R , Hannon E , De Jager PL , Srivastava G , Volta M , Troakes C , Al-Sarraj S , Burrage J , Macdonald R , Condliffe D , Harries LW , Katsel P , Haroutunian V , Kaminsky Z , Joachim C , Powell J , Lovestone S , Bennett DA , Schalkwyk LC , Mill J ((2014) ) Methylomic profiling implicates cortical deregulation of ANK1 in Alzheimer’s disease. Nat Neurosci 17: , 1164–1170. |
Figures and Tables
Fig.1
Flowchart documenting the selection process of the Generation Scotland analysis cohort.
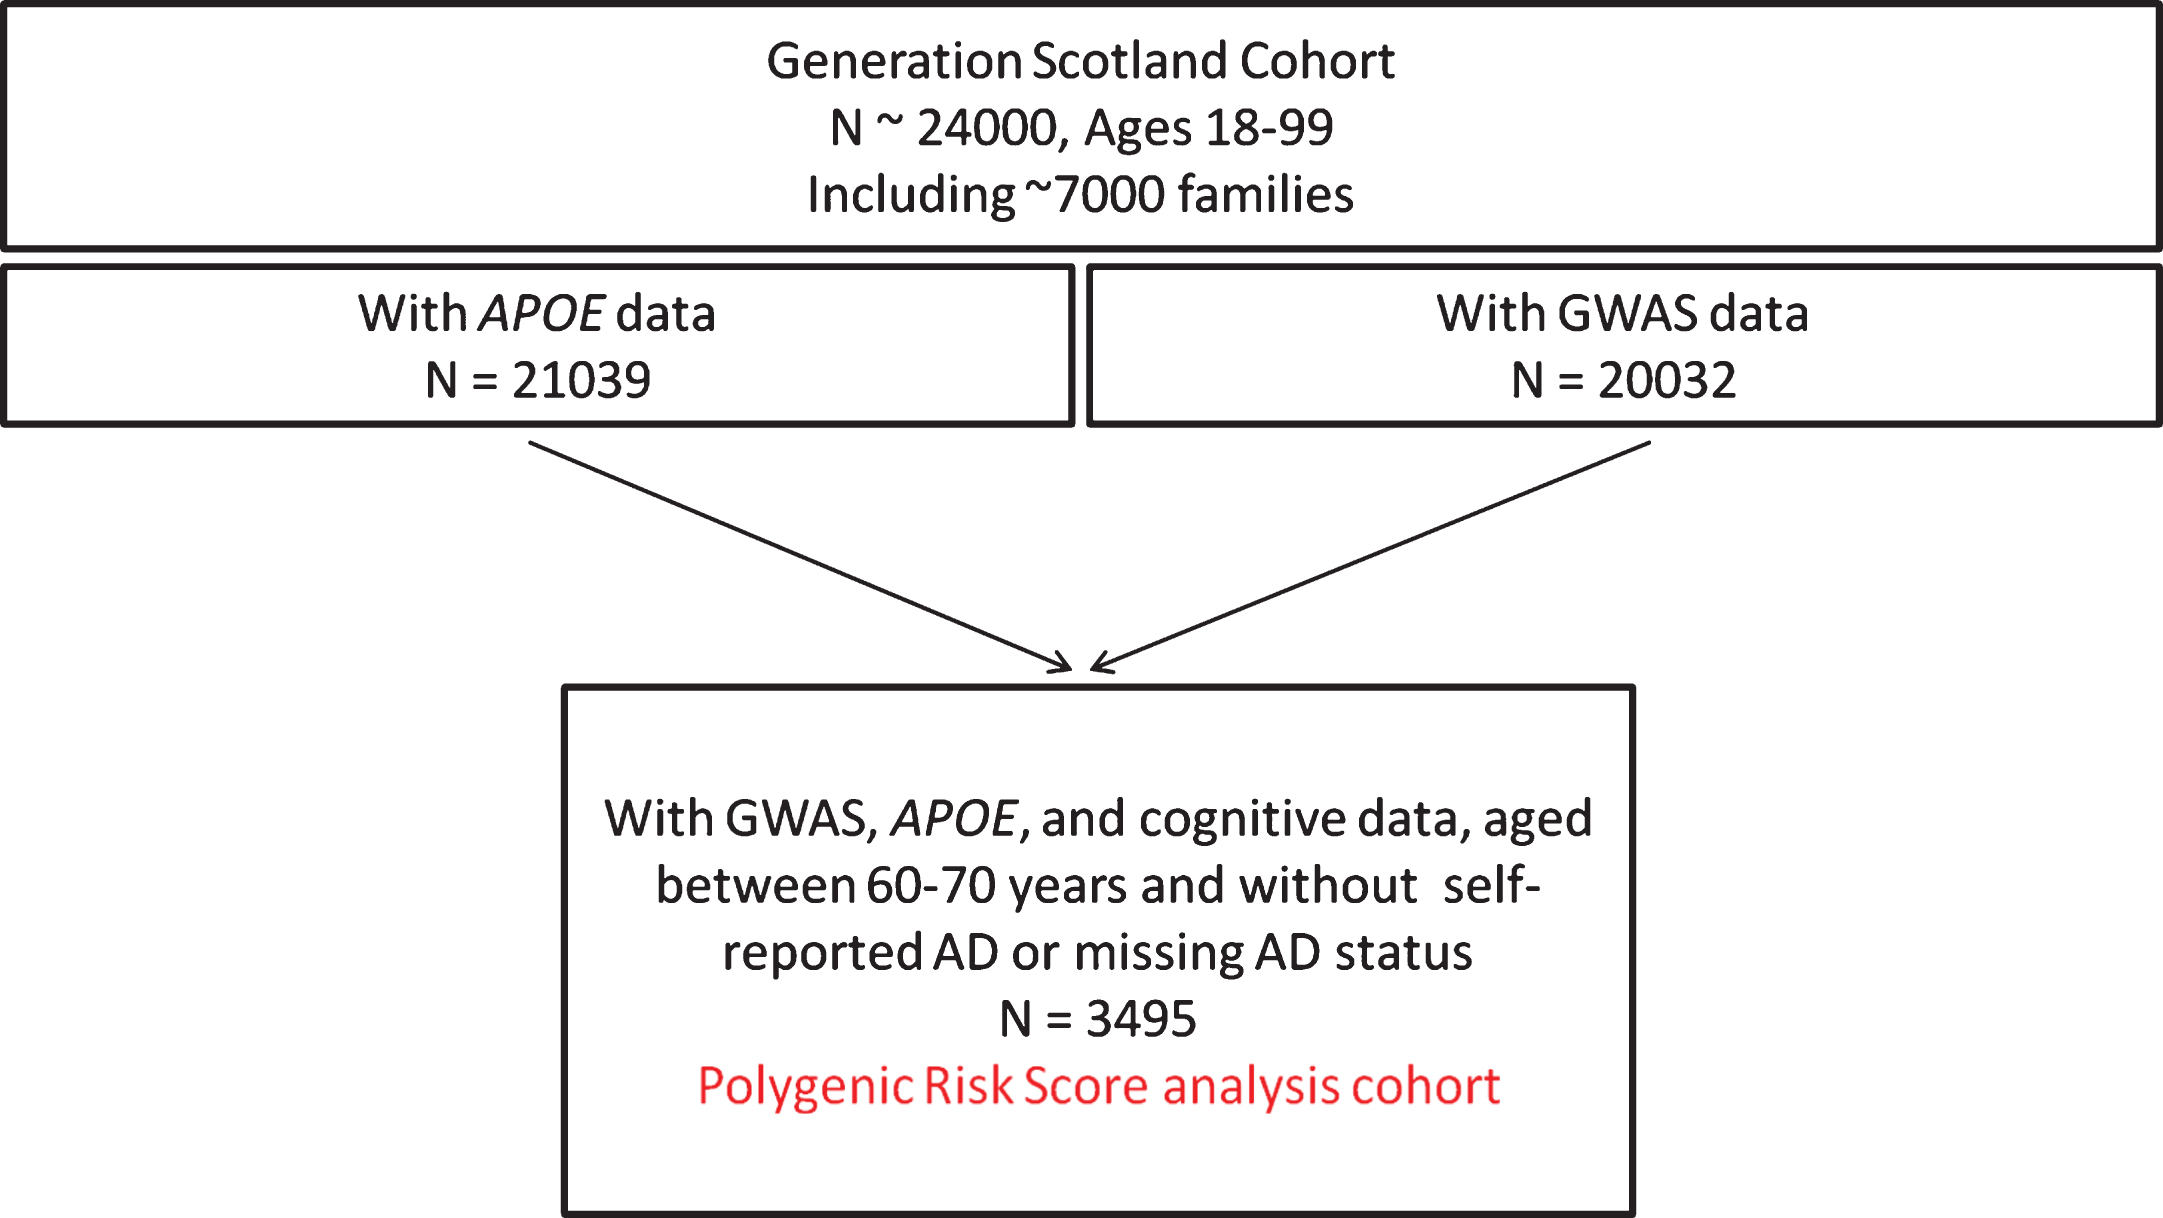
Table 1
Summary of the Generation Scotland AD polygenic risk cohort
| Polygenic risk cohort | |||
| Variable | n | mean | sd |
| Age (years – median, IQR) | 3,495 | 63 | 61–65 |
| Digit Symbol Test | 3,495 | 62.5 | 14.4 |
| Logical Memory | 3,495 | 29.5 | 8.0 |
| SIMD (rank, median, IQR)* | 3,318 | 4566 | 2924–5542 |
| Educational attainment† | 3,365 | 4 | 3–5 |
| n | % | ||
| Sex (Female) | 1,998 | 57.2 | |
| Self-report hypertension (yes) | 929 | 26.6 | |
| Self-report stroke (yes) | 79 | 2.3 | |
| Self-report diabetes (yes) | 194 | 5.6 | |
| Self-report heart disease (yes) | 285 | 8.2 | |
| Self-report depression (yes) | 298 | 8.5 | |
| APOE | |||
| ɛ2ɛ2 | 19 | 0.5 | |
| ɛ2ɛ3 | 437 | 12.5 | |
| ɛ2ɛ4 | 86 | 2.5 | |
| ɛ3ɛ3 | 2,081 | 59.5 | |
| ɛ3ɛ4 | 782 | 22.4 | |
| ɛ4ɛ4 | 90 | 2.6 | |
*Scottish Index of Multiple Deprivation. †Education was measured as an ordinal variable, so median and quartiles are reported. 0 : 0 years, 1 : 1–4 years, 2 : 5–9 years, 3 : 10–11 years, 4 : 12–13 years, 5 : 14–15 years, 6 : 16–17 years, 7 : 18–19 years, 8 : 20–21 years, 9 : 22–23 years, 10:≥24 years.
Table 2
Comparison of cognitive outcomes by genetic risk for AD and APOE status. All models adjust for age, sex, and pedigree-based relatedness
| Variable | beta | SE | p | FDR Adjusted p* |
| Effect per SD of PGRS | ||||
| Digit Symbol Test | –0.28 | 0.24 | 0.25 | 0.25 |
| Logical Memory | –0.31 | 0.14 | 0.020 | 0.04 |
| Top versus Bottom 5% of PGRS | ||||
| Digit Symbol Test | –2.32 | 1.54 | 0.13 | 0.15 |
| Logical Memory | –1.84 | 0.83 | 0.028 | 0.04 |
| APOE ɛ4ɛ4 versus ɛ3ɛ3 | ||||
| Digit Symbol Test | –3.51 | 1.53 | 0.022 | 0.04 |
| Logical Memory | –2.78 | 0.86 | 1.2×10⁻³ | 0.007 |
PGRS, Polygenic risk score; SD, standard deviation; SE, standard error. *False discovery rate adjusted p-values after applying a Benjamini-Hochberg correction to the six empirical p-values.


