
Alterations of Clock Gene RNA Expression in Brain Regions of a Triple Transgenic Model of Alzheimer’s Disease
Abstract
A disruption to circadian rhythmicity and the sleep/wake cycle constitutes a major feature of Alzheimer’s disease (AD). The maintenance of circadian rhythmicity is regulated by endogenous clock genes and a number of external Zeitgebers, including light. This study investigated the light induced changes in the expression of clock genes in a triple transgenic model of AD (3×Tg-AD) and their wild type littermates (Non-Tg). Changes in gene expression were evaluated in four brain areas¾suprachiasmatic nucleus (SCN), hippocampus, frontal cortex and brainstem¾of 6- and 18-month-old Non-Tg and 3×Tg-AD mice after 12 h exposure to light or darkness. Light exposure exerted significant effects on clock gene expression in the SCN, the site of the major circadian pacemaker. These patterns of expression were disrupted in 3×Tg-AD and in 18-month-old compared with 6-month-old Non-Tg mice. In other brain areas, age rather than genotype affected gene expression; the effect of genotype was observed on hippocampal Sirt1 expression, while it modified the expression of genes regulating the negative feedback loop as well as Rorα, Csnk1ɛ and Sirt1 in the brainstem. In conclusion, during the early development of AD, there is a disruption to the normal expression of genes regulating circadian function after exposure to light, particularly in the SCN but also in extra-hypothalamic brain areas supporting circadian regulation, suggesting a severe impairment of functioning of the clock gene pathway. Even though this study did not demonstrate a direct association between these alterations in clock gene expression among brain areas with the cognitive impairments and chrono-disruption that characterize the early onset of AD, our novel results encourage further investigation aimed at testing this hypothesis.
INTRODUCTION
Biological processes exhibit daily rhythms that enable organisms to coordinate their physiological activities with changes in demand over a day. In mammals, these rhythms exhibit a periodicity of about 24 h and are endogenously generated by the master circadian pacemaker located in the suprachiasmatic nucleus (SCN) of the anterior hypothalamus [1]. These rhythms are synchronized by regularly recurring environmental cues or “Zeitgebers”. Circadian biological clocks are entrained to a 24 h day/night cycle through the influence of light, the main Zeitgeber [2, 3]. Light is transduced into a neural signal by the retina and conveyed to the core of the SCN [4], which responds to light/dark cycles and co-ordinates circadian function, including locomotor activity, hormone secretion, body temperature maintenance, and feeding. The molecular and cellular basis of circadian rhythmicity consists of a complex interaction between specialized transcription factors, commonly described as the clock pathway, which represents an internal timekeeping system that interacts with these Zeitgebers [5, 6]. The generation and modulation of circadian rhythms rely on interconnected, self-sustained transcriptional/translational feedback loops, which result in the activation or repression of gene expression.
Alzheimer’s disease (AD) is the most frequent form of dementia and one of the most devastating psychiatric disorders [7] and is characterized by the accumulation of extracellular amyloid-β (Aβ) plaques, neurofibrillary tangles (NFTs) composed of hyperphosphorylated tau, neuronal loss, and neuroinflammation [8, 9]. As well as severe cognitive deficits, patients with AD exhibit profound disruptions to their circadian rhythms in sleep–wakefulness and other processes. In recent years, increasing efforts have been made to better understand the molecular and cellular basis of the sleep disturbances and disrupted circadian rhythms observed frequently in AD patients [10, 11]. The clock pathway is crucially involved in the maintenance of such rhythmicity, and studies linking this molecular family to brain and body processes in AD patients can further elucidate the etiopathogenesis of this common dementia [12, 13]. Therefore, the investigation of the interactions of Aβ and NFTs with the clock gene pathway represents an interesting challenge for researchers.
A distributed network of extra SCN brain regions contains autonomous oscillators, which support circadian function [3, 14]. In common with the SCN, these secondary oscillators also rely on feedback loops comprising clock genes and proteins. However, the role of the clock pathway in the SCN and extra-SCN regions is thought to be distinct and reflective of the particular function of each brain region [14]. Therefore, the disruption to the expression of clock genes in specific areas of the brain might contribute to the clinical phenomenology of AD although it cannot address the question as to whether this disruption is a cause or an effect of the neurodegenerativeprocesses.
The diversity of secondary clocks in the brain, their specific sensitivities to temporal cues, as well as their differential coupling to the master SCN clock, allows the circadian timing system to integrate and plastically respond to a wide range of temporal information. This raises the possibility that pathophysiological alterations of internal timing that are deleterious for health may result from desynchronization within this network of cerebral clocks [15]. The main brain areas affected by AD pathology are the cortex and the hippocampus, and recently morphological changes have been also reported in the brainstem [16]. Information on the molecular function of the clock pathway in different areas of AD afflicted brains is still limited, therefore this study aimed to evaluate the expression of the core genes comprising the clock pathway of the SCN and three other brain areas, such as hippocampus, frontal cortex and brainstem in a well-characterized triple transgenic murine model of AD (3×Tg-AD)[17–19].
The 3×Tg-AD mice develop amyloid plaques and neurofibrillary pathology in a hierarchical manner in AD-relevant brain regions, develop age-related cognitive decline, and closely mimic the disease progression in humans [17–19]. For the purpose of our study, we have evaluated the clock gene expression at two different stages of the disease in the 3×Tg-AD mice. In particular, mice have been studied at 6 and 18 months of age, which corresponds to mild and severe pathology of AD-like symptoms, respectively. The control animals were age- and sex-matched, cognitively normal non-transgenic (Non-Tg) mice. Based on our earlier work [18–21], the youngest group of animals (6 months of age) was expected to show intraneuronal Aβ, somatodendritic tau accumulation and was named the mild pathology group. The second age group (18 months of age) was expected to develop extensive Aβ plaque burden, mature NFTs, along with signs of activated microglia, strong signs of plaque-associated inflammation, and was named the severe pathology group [18]. Although this study was not designed to demonstrate a direct association between clock gene alteration and circadian rhythms or sleep-wake cycle, our findings open new perspectives on the chronopathologyof AD.
MATERIALS AND METHODS
Animal model
All animals received care in compliance with the Principles of Laboratory Animal Care formulated by the National Society for Medical Research and the guide for the Care and Use of Laboratory Animals prepared by the Institute of Laboratory Animal Resources, published by the National Institutes of Health (NIH Publication No. 86–23, revised 1985), as well as with Italian laws on animal experimentation. All efforts were made to minimize the number of animals used in the study.
6-month-old (adult) and 18-month-old (aged) 3×Tg-AD male mice and their wild type male littermates (Non-Tg) were housed at the animal facility of the Puglia and Basilicata Experimental Zooprophylactic Institute (Foggia, Italy), according to the procedures described previously [18, 19]. Genotypes were confirmed by polymerase chain reaction (PCR) after tail biopsies as previously described [18, 19].
Fresh food and water were freely available, and the housing conditions were controlled, with temperature 22°C, humidity 50–60%, a 12 h light (L)-12 h dark (D) cycle, with light on at Zeitgeber Time (ZT) 0 corresponding to Circadian Time (CT) 07:00 h and light off at ZT12 corresponding to CT 19:00 h. A full-spectrum white fluorescent lamp (526 lux) served as a daytime light source. On the day of the experiment, mice were decapitated at CT 07:00 h (after exposure to D) or at CT 19:00 h (after exposure to L); the brains were rapidly removed and placed on a cold surface to dissect the suprachiasmatic nucleus, frontal cortex, hippocampus, and the brainstem following a procedure obtained by modifying a previous published protocol [22]. All the tissues were then snap frozen in liquid nitrogen and stored at –80°C. Because of the small amount of tissue available, each sample was obtained by pooling tissues from 2 animals (for a total of 12 mice per group).
RNA extraction from fresh frozen tissue and first-strand cDNA synthesis
Tissues from brain areas stored at –80°C were homogenized and total RNA was extracted by RNeasy Lipid Tissue Mini Kit (QIAGEN GmbH, Germany) as recommended by the manufacturer. All RNA samples were quantified by measuring the optical density (NanoDrop ND-1000 Spectrophotometer, NanoDrop Technologies). Quality and purity of the samples were analyzed by gel electrophoresis. Complementary DNA was generated from these samples using M-MLV Reverse Transcriptase according to the manufacturer’s instructions (Invitrogen, Carlsbad, CA, USA).
Quantitative real-time reverse transcription- polymerase chain reaction (RT-PCR)
Real-time quantification of mRNA was performed with a SYBR Green I assay, and evaluated using an iCycler detection system (Bio-Rad Laboratories). The threshold cycle (CT) was determined, and the relative genes expression subsequently was calculated as follows: fold change = 2-Δ (ΔCT), where ΔCT = CT target – CT housekeeping and Δ(ΔCT) =ΔCT treated – ΔCT controls. All PCR primer pairs, purchased from Sigma-Aldrich (KiCqStartTM SYBR® Green qPCR ReadyMix TM, iQ, Sigma-Aldrich), are listed in Supplementary Table 1.
Immunohistochemistry
Mice (n = 3 per group) were intra-cardioven-tricularly perfused with saline followed by fixation solution (4% paraformaldehyde in 0.1 M phosphate buffer, PB, pH 7.4). Free-floating coronal sections of 50 μm thickness were obtained using a vibratome slicing system (microM, Walldorf, Germany). Immunohistochemistry was performed using peroxidase-based detection system. Endogenous peroxidase activity was quenched for 30 min in 0.3% H2O2. The brain sections were blocked with 10% normal goat serum/PBS with 0.3% Triton X-100 and then incubated overnight at 4°C with the following antibodies: mouse monoclonal 6E10 antibody (1:3000 dilution, Signet Laboratories) for total amyloid; and human-specific anti-tau antibody HT7 (1:1000 dilution, Pierce Biotechnology) [20]. After removing the primary antiserum in excess, sections were incubated with secondary antibody (Biotin-SP-conjugated fragment donkey anti rabbit IgG) for 1 h at room temperature. After washing excess of antibody, sections were treated with avidin–biotin–peroxidase complex (ABC, 1:200 dilution, Vector Laboratories) and then developed with diaminobenzidine substrate using the avidin-biotin horseradish peroxidase system (Vector Laboratories). Immunolabeled sections were viewed using a Nikon 80i Eclipse microscope equipped with a DS-U1 digital camera, and NIS-elements BR software (Nikon, Tokyo, Japan). Semiquantitative analyses of the signal of Aβ and tau immunostaining were performed using freeware software from the National Institutes of Health (Scion Image software) and were expressed as opticaldensities.
Statistics
All data were expressed as mean±standard error of the mean (SEM) of fold change values. Within-group variability was analyzed through Levene’s test for homogeneity of variances. Data were analyzed using three-way analysis of variance (ANOVA), to test the main effects of D/L cycle (Dark versus Light), genotype (G) (3×Tg-AD versus Non-Tg), age (A) (6 months versus 18 months of age) as between-subject factors; the interactions D/L×G, D/L×A, G×A and D/L×A×G were studied and a Tukey test was used as a post-hoc test for multiple comparisons. The correlation analysis between Aβ or tau protein levels and clock gene expression was performed by using the Pearson correlation test. The threshold for statistical significance was set at p < 0.05. The SPSS Statistics version 19 (IBM, Armonk, NY, USA) and GraphPad Prism 6 for Windows (GraphPad Software Inc., San Diego, CA, USA) were used to perform all the statistical analyses and to represent graph data, respectively.
RESULTS
Effect of D/L exposure on gene expression in the clock pathway in the suprachiasmatic nucleus (SCN) of 6- and 18-month-old 3×Tg-AD and Non-Tg mice
Since the major circadian pacemaker in mammals is located in the SCN, we first determined whether the variations in clock gene expressions occurring after a 12 h D/L cycle was observed in the 6- and 18-month-old 3×Tg-AD and Non-Tg mice littermates, referred as the mild and severe pathology group, respectively (Fig. 1). To this aim, animals were sacrificed at CT 07:00 h (after exposure to D) or at CT 19:00 h (after exposure to L) and the variability of core clock gene expressions was analyzed. The results obtained by the statistical analysis aimed to test the main effects of D/L, G, A and the interactions D/L×G, D/L×A, G×A, and D/L×A×G are shown in Table 1.
Fig.1
Clock gene expression level in the suprachiasmatic nucleus (SCN) of 6-month-old and 18-month-old Non-Tg and 3×Tg-AD mice after 12 h exposure to darkness (D) or light (L). Data are expressed as mean±SEM of fold change values and were analyzed by 3-way ANOVA. Tukey’s post-hoc test was used where appropriate to perform multiple comparisons. *p < 0.05; **p < 0.01; ***p < 0.001.
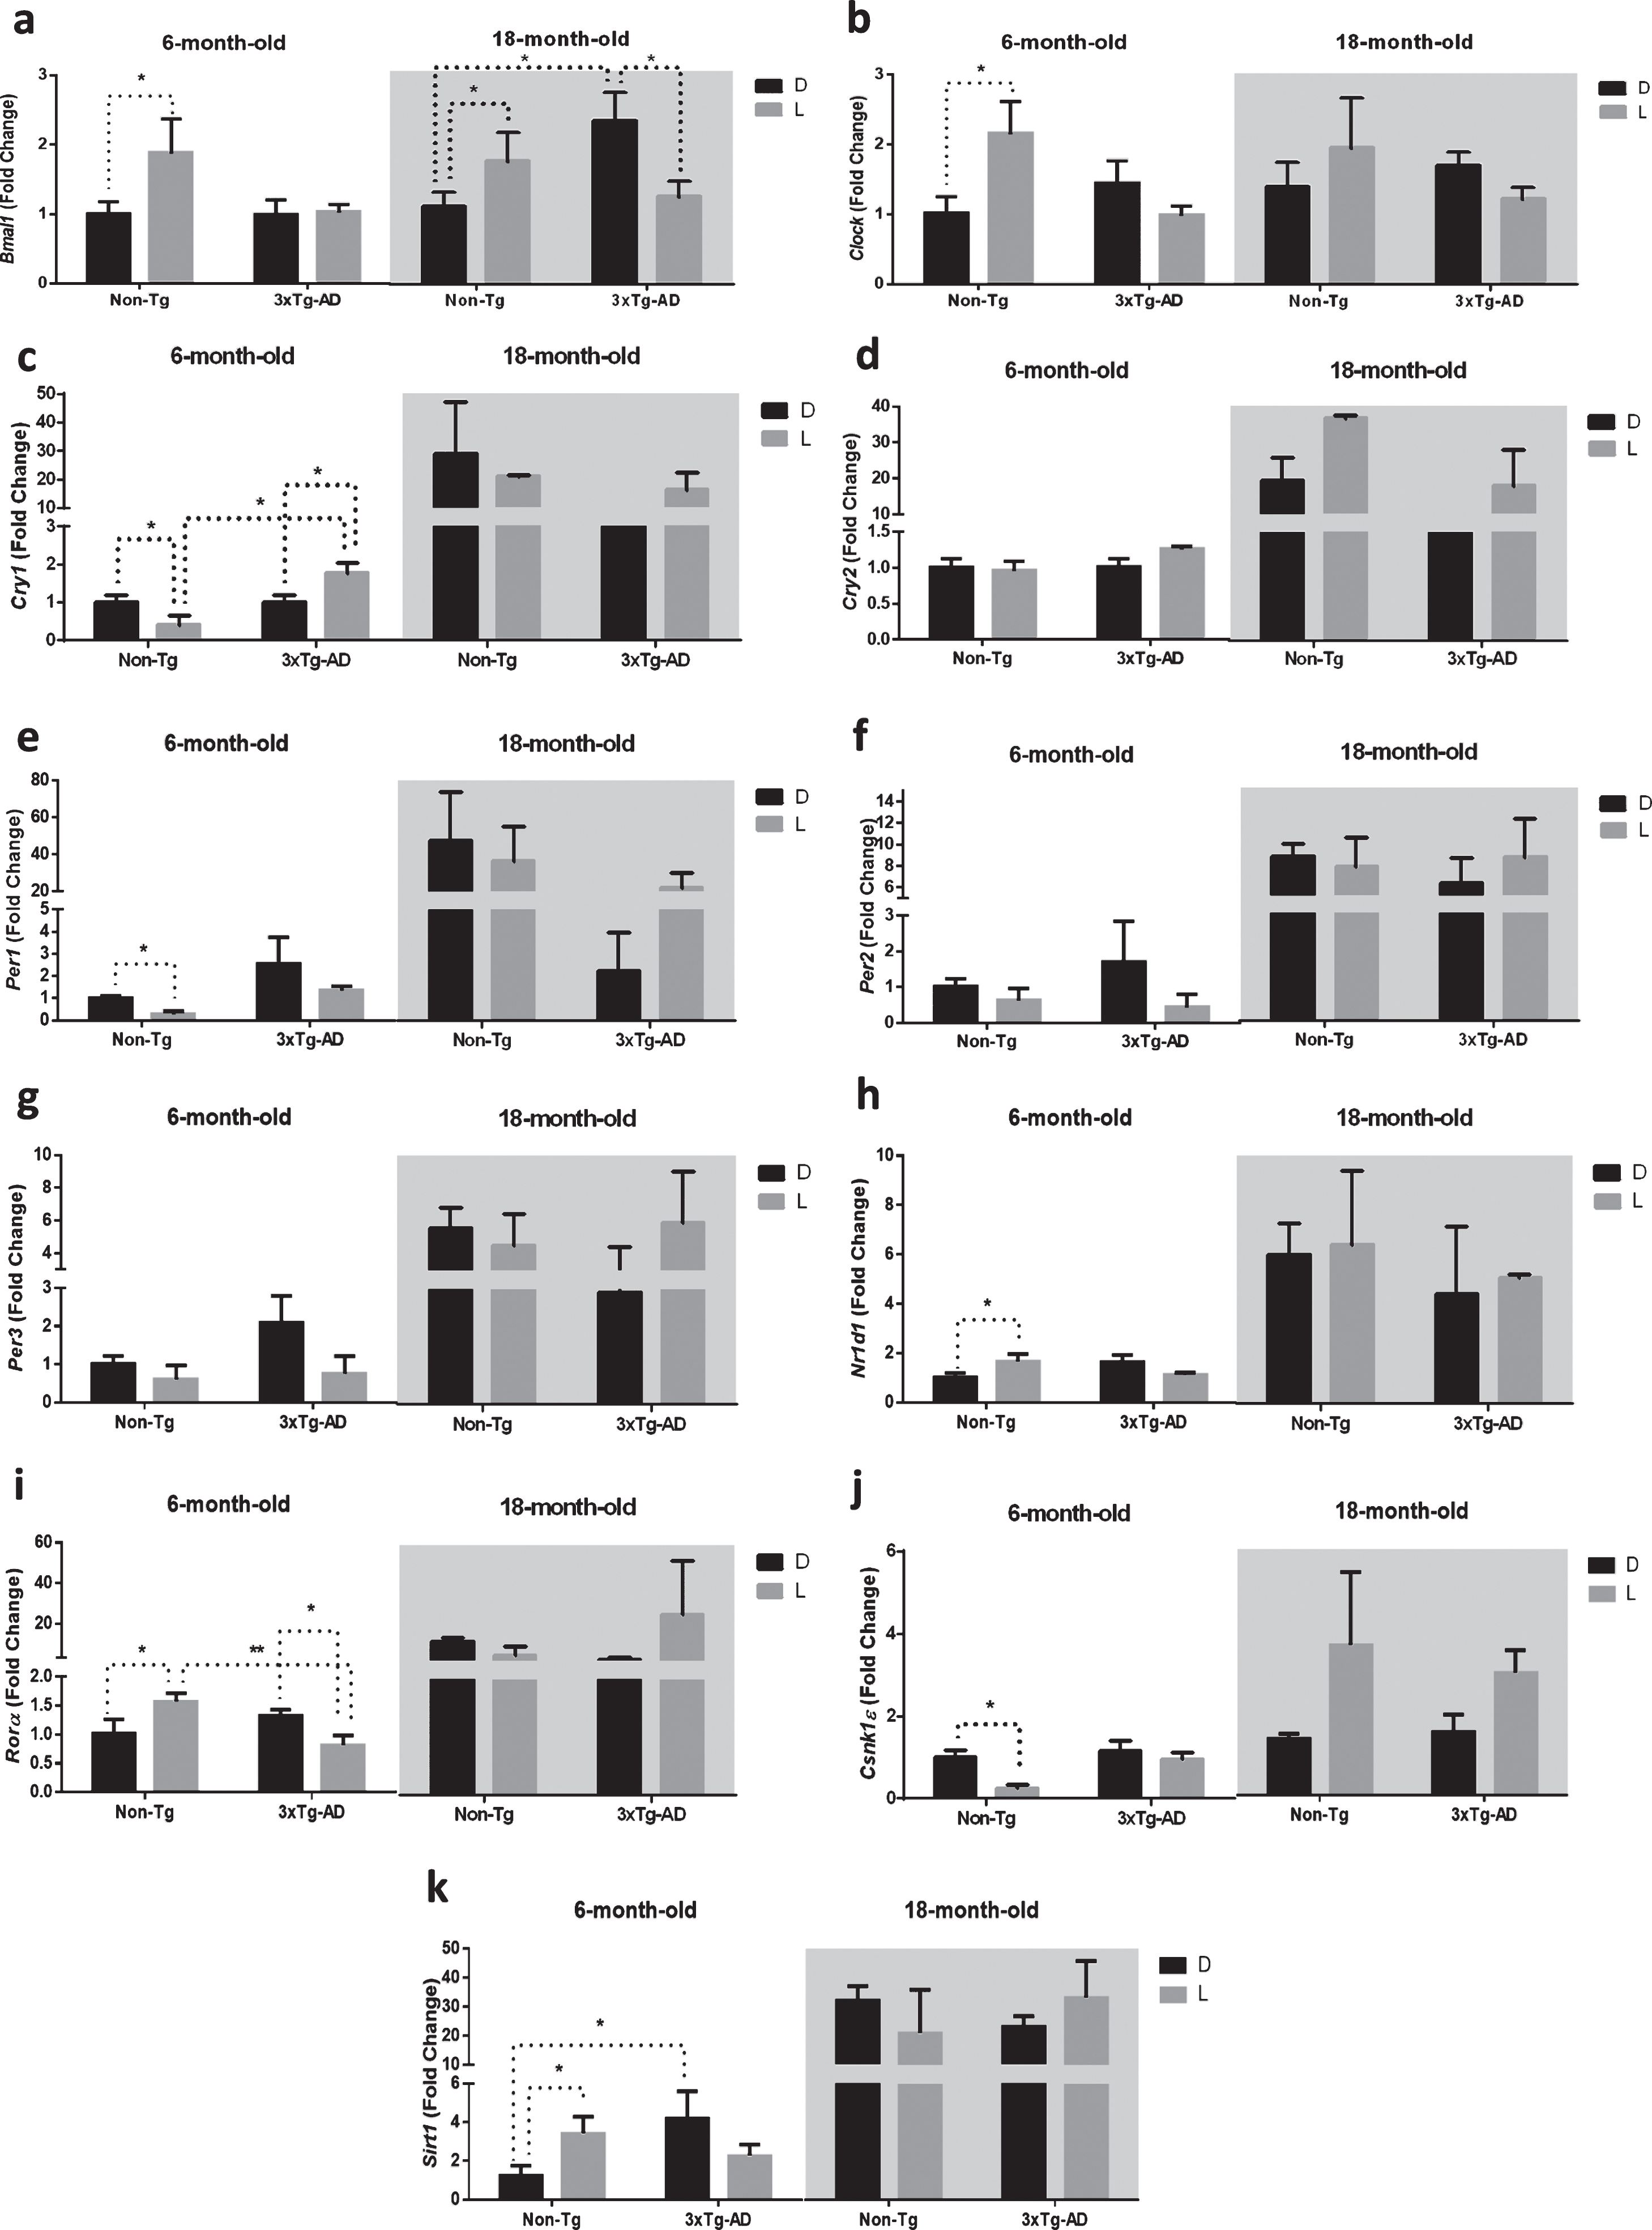
Table 1
Results from the three-way ANOVA of clock gene expression in the suprachiasmatic nucleus of 6-month and 18-month-old Non-Tg and 3×Tg-AD mice after a 12 h D/L cycle (n = 12 per group). D, darkness; L, light; G, genotype; A, age; F, Fisher’s test. *p < 0.05; **p < 0.01; ***p < 0.001
| D/L | G | A | D/L×G | D/L×A | G×A | D/L×G×A | ||
| Bmal1 | F | 27.78*** | 0.09 | 8.54** | 0.61 | 2.75 | 10.11** | 6.72* |
| Clock | F | 7.96* | 3.64 | 1.87 | 7.65* | 0.26 | 0.29 | 6.44* |
| Cry1 | F | 0.18 | 5.60* | 30.47*** | 3.45 | 0.16 | 6.84* | 2.65 |
| Cry2 | F | 16.78** | 19.76*** | 100.2*** | 0.21 | 16.35** | 20.49*** | 0.29 |
| Per1 | F | 0.19 | 7.49* | 31.64*** | 1.85 | 0.11 | 9.05** | 2.01 |
| Per2 | F | 0.00 | 0.14 | 33.86*** | 0.72 | 0.84 | 0.42 | 1.76 |
| Per3 | F | 0.01 | 0.00 | 34.64*** | 1.66 | 2.21 | 1.04 | 4.15 |
| Nr1d1 | F | 0.08 | 0.76 | 42.30*** | 0.02 | 0.32 | 1.80 | 0.12 |
| Rorα | F | 1.00 | 0.42 | 6.78* | 2.93 | 0.99 | 0.49 | 3.40 |
| Csnk1ɛ | F | 2.49 | 0.10 | 12.24** | 0.01 | 2.97 | 0.12 | 0.20 |
| Sirt1 | F | 0.14 | 0.01 | 152.1*** | 2.69 | 0.15 | 0.10 | 6.52* |
The main effect of D/L cycle was significant for the expression of the core clock genes Bmal1 and Clock, as well as the component of the negative feedback loop Cry2. The main effect of genotype was significant for the expression of Cry1, Cry2, and Per1, all coding for proteins of the negative feedback loop; moreover, the main effect of age was significant for the expression of all the genes studied, except for Clock. The interaction between the D/L cycle and genotype was significant only for Clock expression, while the interaction between the D/L cycle and age was significant for Cry2 expression; interestingly, the interaction between genotype and age was significant for Bmal1, Cry1, Cry2, and Per1 expression. Finally, the interaction of the three variables was significant for the expression of Bmal1, Clock, and Sirt1.
Post-hoc analysis showed an interesting picture of how D/L cycle, genotype and age affected the expression of clock genes in the SCN (Fig. 1). Bmal1 was significantly upregulated after a 12 h exposure to L in both 6- and 18-month-old Non-Tg mice (+86% and +73%, respectively; Fig. 1a), while it was not modified or significantly downregulated (–50%) after 12-h L exposure in 6- and 18-month-old 3×Tg-AD mice, respectively. Interestingly, Bmal1 expression in 18-month-old 3×Tg-AD mice was significantly higher (+111%) compared to 18-month-old Non-Tg mice after a 12 h exposure to darkness.
The expression of Clock was significantly higher (+115%) only in 6-month-old Non-Tg mice after 12 h exposure to L, but no significant differences were observed in the 6-month-old 3×Tg-AD and both 18-month-old Non-Tg and 3×Tg-AD mice (Fig. 1b).
Expression in the negative feedback loop (composed by Per-Cry genes) was also disrupted in 3×Tg-AD mice. We observed a lower expression of Cry1 and Per1 (–61% and –72%, respectively) after a 12 h exposure to L in 6-month-old Non-Tg mice. In the SCN of 6-month-old 3×Tg-AD, Cry1 was significantly upregulated (+77%), while Per1 was not modified. Moreover, the RNA expression of both genes was not significantly modified after D/L exposure in 18-month-old mice of both genotypes (Fig. 1c, e). Interestingly, Cry1 expression in 6-month-old 3×Tg-AD mice was significantly higher (+345%) compared to 6-month-old Non-Tg mice after 12 h exposure to L (Fig. 1c).
Nr1d1 and Rorα are both targets of the heterodimer CLOCK-BMAL1 and regulate, in turn, the expression of Bmal1. In our study, Nr1d1 expression was upregulated (+56%) after 12 h L exposure in 6-month-old Non-Tg mice, while no significant difference was observed after D/L exposure in both 6-month-old 3×Tg-AD and 18-month-old mice of both genotypes (Fig. 1h).
As far as Rorα, we observed an upregulation (+68%) in the 6-month-old Non-Tg mice and, conversely, a downregulation (–38%) in the 6-month-old 3×Tg-AD mice, while no significant difference was observed after D/L exposure in 18-month-old mice of both genotypes (Fig. 1i). Interestingly, Rorα expression in 6-month-old 3×Tg-AD mice was significantly lower (–48%) compared with 6-month-old Non-Tg mice after 12 h exposure to L (Fig. 1i).
Casein kinase 1 epsilon (CSNK1ɛ) phosphorylates PER proteins promoting their degradation through a proteasomal pathway [24]. Interestingly, Csnk1ɛ was downregulated (–75%) after 12 h L exposure in 6-month-old Non-Tg mice, while no significant difference was observed after D/L exposure in both 6-month-old 3×Tg-AD and 18-month-old mice of both genotypes (Fig. 1j).
The NAD-dependent deacetylase SIRT1 activates the transcription of both Bmal1 and Clock in the SCN [25]. In this context, we observed a significant upregulation (+221%) of Sirt1 in 6-month-old Non-Tg mice after 12 h L exposure, while nosignificant difference was observed after D/L exposure in both 6-month-old 3×Tg-AD and 18-month-old mice of both genotypes (Fig. 1k). Interestingly, Sirt1 expression in 6-month-old 3×Tg-AD mice was significantly higher (+240%) compared to 6-month-old Non-Tg mice after a 12 h exposure to darkness.
Effect of D/L exposure on gene expression in the clock pathway of the hippocampus of 6- and 18-month-old 3×Tg-AD and Non-Tg mice
Clock genes are expressed in various parts of the central nervous system constituting a distributed circadian network with different degrees of autonomy and SCN-dependence [26]. Therefore, we first investigated the expression of clock genes in the hippocampus, which is one of the brain regions mainly affected by the neuropathological alterations ofAD [27].
The results obtained by the statistical analysis aimed to test the main effects of D/L cycle, G, A, and the interactions between D/L×G, D/L×A, G×A, and D/L×A×G are shown in Table 2. Similarly to the SCN, we observed a significant main effect of D/L cycle on the expression of core clock genes Bmal1 and Clock, as well as the component of the negative feedback loop Cry2; moreover, the main effect of D/L cycle was significant for the expression of Csnk1ɛ and Sirt1 in the hippocampus. The main effect of genotype was significant only for the expression of Sirt1, while the main effect of age was observed for the expression of all the genes studied, except for Clock. The interaction between D/L and genotype was significant for Sirt1 expression, while the interaction between D/L and age was significant for Bmal1, Clock, Cry1-2, Nr1d1, Csnk1ɛ, and Sirt1. The interaction between genotype and age was significant for Sirt1 expression. Finally, the interaction among the three factors was significant for the expression of Per3 and Sirt1 (Table 2). As reported in the Fig. 2, the post-hoc analysis showed a significant downregulation (–49%) of Cry1 after 12 h L exposure in 6-month-old Non-Tg mice, while no significant difference was observed after D/L exposure in both 6-month-old 3×Tg-AD and 18-month-old mice of both genotypes (Fig. 2c).
Table 2
Results from the three-way ANOVA of clock gene expression in the hippocampus of 6-month and 18-month-old Non-Tg and 3×Tg-AD mice after a 12 h D/L cycle (n = 12 per group). D, darkness; L, light; G, genotype; A, age; F, Fisher’s test. *p < 0.05; **p < 0.01; ***p < 0.001
| D/L | G | A | D/L×G | D/L×A | G×A | D/L×G×A | ||
| Bmal1 | F | 11.40** | 0.69 | 7.49* | 2.27 | 10.39** | 0.40 | 1.47 |
| Clock | F | 5.91* | 0.73 | 2.49 | 0.01 | 9.92** | 0.22 | 0.06 |
| Cry1 | F | 0.64 | 0.01 | 16.18** | 0.02 | 19.51*** | 0.12 | 0.35 |
| Cry2 | F | 7.44* | 0.38 | 8.06* | 0.45 | 6.42* | 0.37 | 0.20 |
| Per1 | F | 3.32 | 1.57 | 24.20*** | 0.78 | 4.13 | 2.45 | 1.06 |
| Per2 | F | 1.89 | 0.58 | 12.34** | 0.24 | 2.94 | 0.87 | 0.53 |
| Per3 | F | 0.39 | 0.36 | 14.02** | 4.02 | 1.04 | 2.00 | 4.44* |
| Nr1d1 | F | 3.87 | 0.02 | 13.21** | 0.55 | 5.93* | 0.24 | 0.61 |
| Rorα | F | 2.59 | 0.37 | 6.60* | 1.54 | 2.98 | 0.33 | 1.71 |
| Csnk1ɛ | F | 13.96** | 0.98 | 33.13*** | 0.02 | 12.14** | 0.90 | 0.29 |
| Sirt1 | F | 11.36** | 12.21** | 22.40*** | 4.40* | 11.35** | 11.73** | 4.70* |
Fig.2
Clock gene expression level in the hippocampus (H) of 6-month-old and 18-month-old Non-Tg and 3×Tg-AD mice after 12 h exposure to darkness (D) or light (L). Data are expressed as mean±SEM of fold change values and analyzed by 3-way ANOVA. Tukey’s post hoc test was used where appropriate to perform multiple comparisons. *p < 0.05; **p < 0.01; ***p < 0.001.
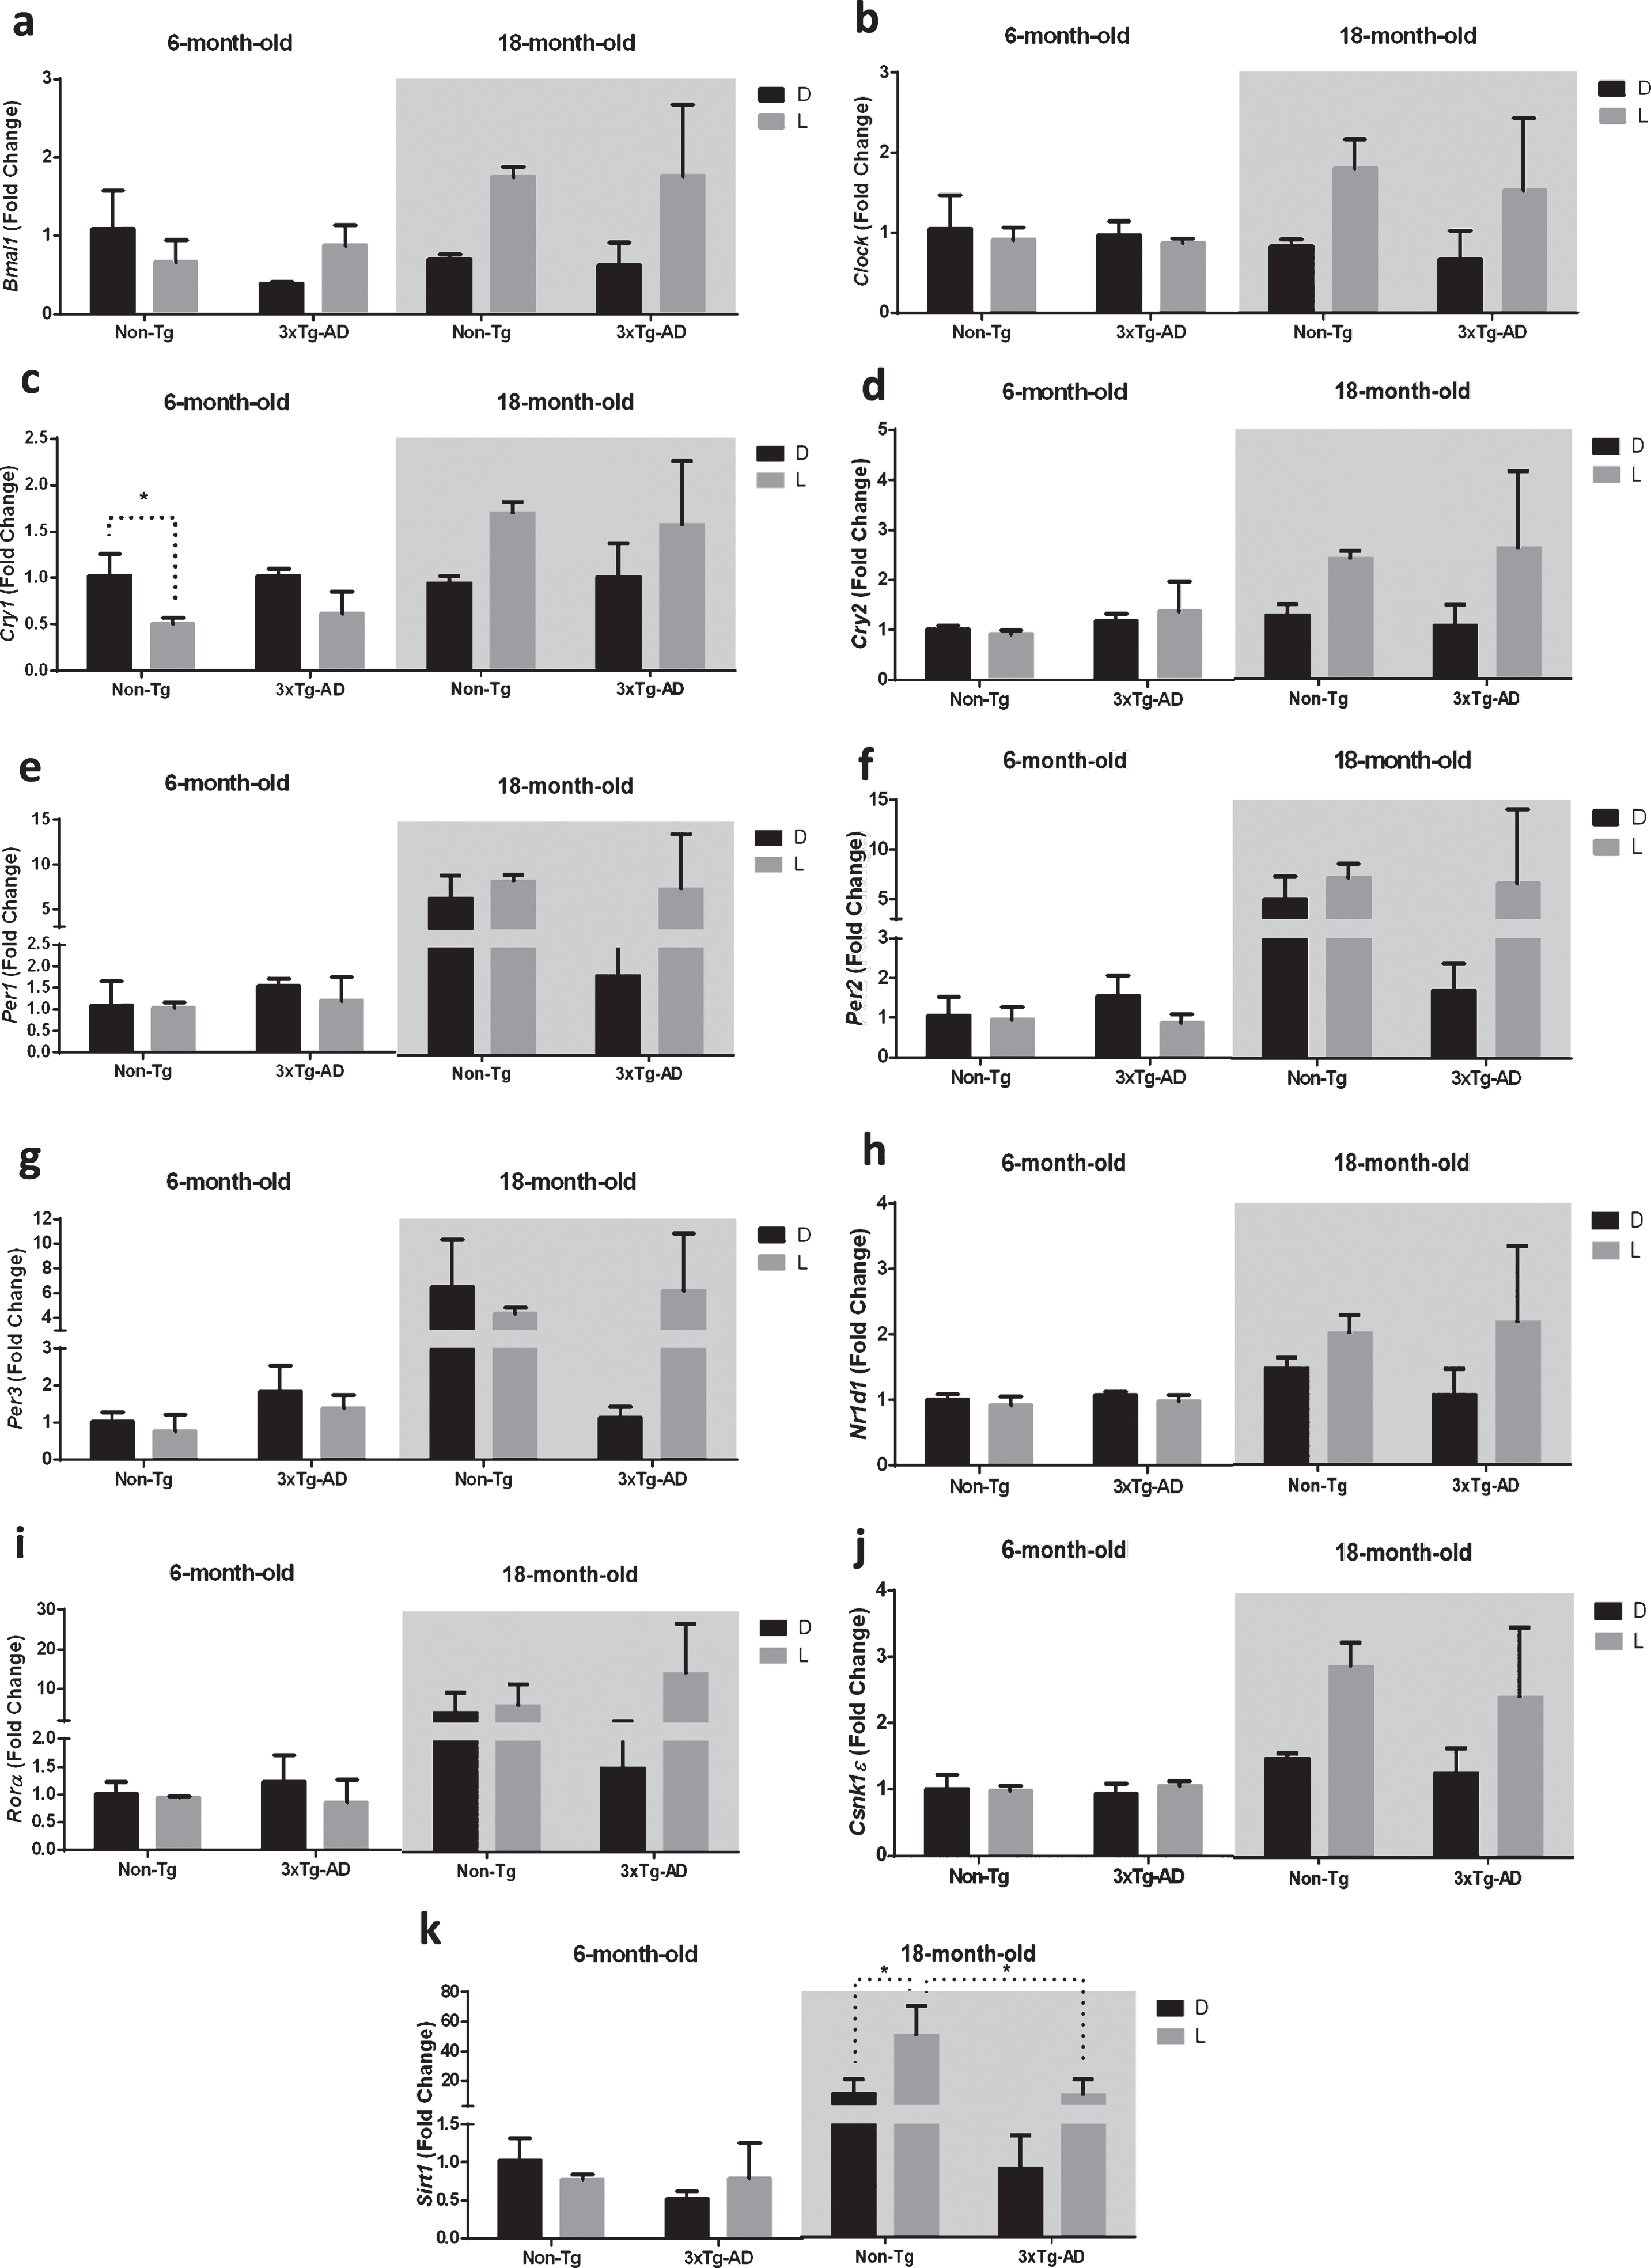
Moreover, the exposure to D/L cycle caused the upregulation (+59%) of Sirt1 only in 18-month-old Non-Tg mice, while no significant difference was observed after D/L exposure in both 18-month-old 3×Tg-AD and 6-month-old mice of both genotypes (Fig. 2k). Interestingly, Sirt1 expression in 18-month-old 3×Tg-AD mice was significantly lower (–80%) compared to 18-month-old Non-Tg mice after a 12 h exposure to L (Fig. 2k).
Effect of D/L exposure on expression of genes of the clock pathway in the frontal cortex of 6- and 18-month-old 3×Tg-AD and Non-Tg mice
Gene expression in the clock pathway was then analyzed in the frontal cortex.
The results obtained by the statistical analysis aimed to test the main effects of D/L cycle, G, A and the interactions D/L×G, D/L×A, G×A, and D/L×A×G are shown in Table 3. The main effect of D/L cycle was significant for the expression of Bmal1; overall the main effect of genotype was not significant, while the main effect of age was significant on the expression of all the genes studied, except for Sirt1. The interaction between the D/L cycle and age was significant for Bmal1, Clock, Cry1-2, and Per3; no further significant interactions were observed (Table 3).
Table 3
Results from the three-way ANOVA of clock gene expression in the frontal cortex of 6-month and 18-month-old Non-Tg and 3×Tg-AD mice after a 12 h D/L cycle (n = 12 per group). D, darkness; L, light; G, genotype; A, age; F, Fisher’s test. *p < 0.05; **p < 0.01; ***p < 0.001
| D/L | G | A | D/L×G | D/L×A | G×A | D/L×G×A | ||
| Bmal1 | F | 11.40** | 0.02 | 12.84** | 0.29 | 5.58* | 0.45 | 1.17 |
| Clock | F | 1.95 | 0.01 | 6.92* | 0.22 | 4.23* | 0.51 | 0.01 |
| Cry1 | F | 0.02 | 0.03 | 26.46*** | 0.18 | 5.24* | 0.02 | 0.37 |
| Cry2 | F | 1.88 | 0.08 | 16.64** | 0.15 | 4.71* | 0.02 | 0.14 |
| Per1 | F | 1.70 | 0.45 | 7.06* | 0.02 | 3.68 | 0.01 | 0.13 |
| Per2 | F | 0.28 | 1.47 | 19.50*** | 0.62 | 2.81 | 0.59 | 0.31 |
| Per3 | F | 0.88 | 1.43 | 17.23** | 0.04 | 4.97* | 0.01 | 0.17 |
| Nr1d1 | F | 0.27 | 0.38 | 16.77** | 0.69 | 0.52 | 0.03 | 0.98 |
| Rorα | F | 2.59 | 1.81 | 4.72* | 0.25 | 2.27 | 0.23 | 0.27 |
| Csnk1ɛ | F | 2.60 | 0.88 | 22.45*** | 0.07 | 3.79 | 0.01 | 0.13 |
| Sirt1 | F | 2.04 | 0.85 | 1.61 | 0.00 | 2.76 | 0.37 | 0.93 |
As reported in the Fig. 3c, the post-hoc analysis showed a significant downregulation (–51%) of Cry1 after 12 h L exposure in 6-month-old Non-Tg mice, while no significant difference was observed after D/L exposure in both 6-month-old 3×Tg-AD and 18-month-old mice of both genotypes.
Fig.3
Clock gene expression level in the frontal cortex (FC) of 6-month-old and 18-month-old Non-Tg and 3×Tg-AD mice after 12 h exposure to darkness (D) or light (L). Data are expressed as mean±SEM of fold change values and analyzed by 3-way ANOVA. Tukey’s post hoc test was used where appropriate to perform multiple comparisons. *p < 0.05; **p < 0.01; ***p < 0.001.
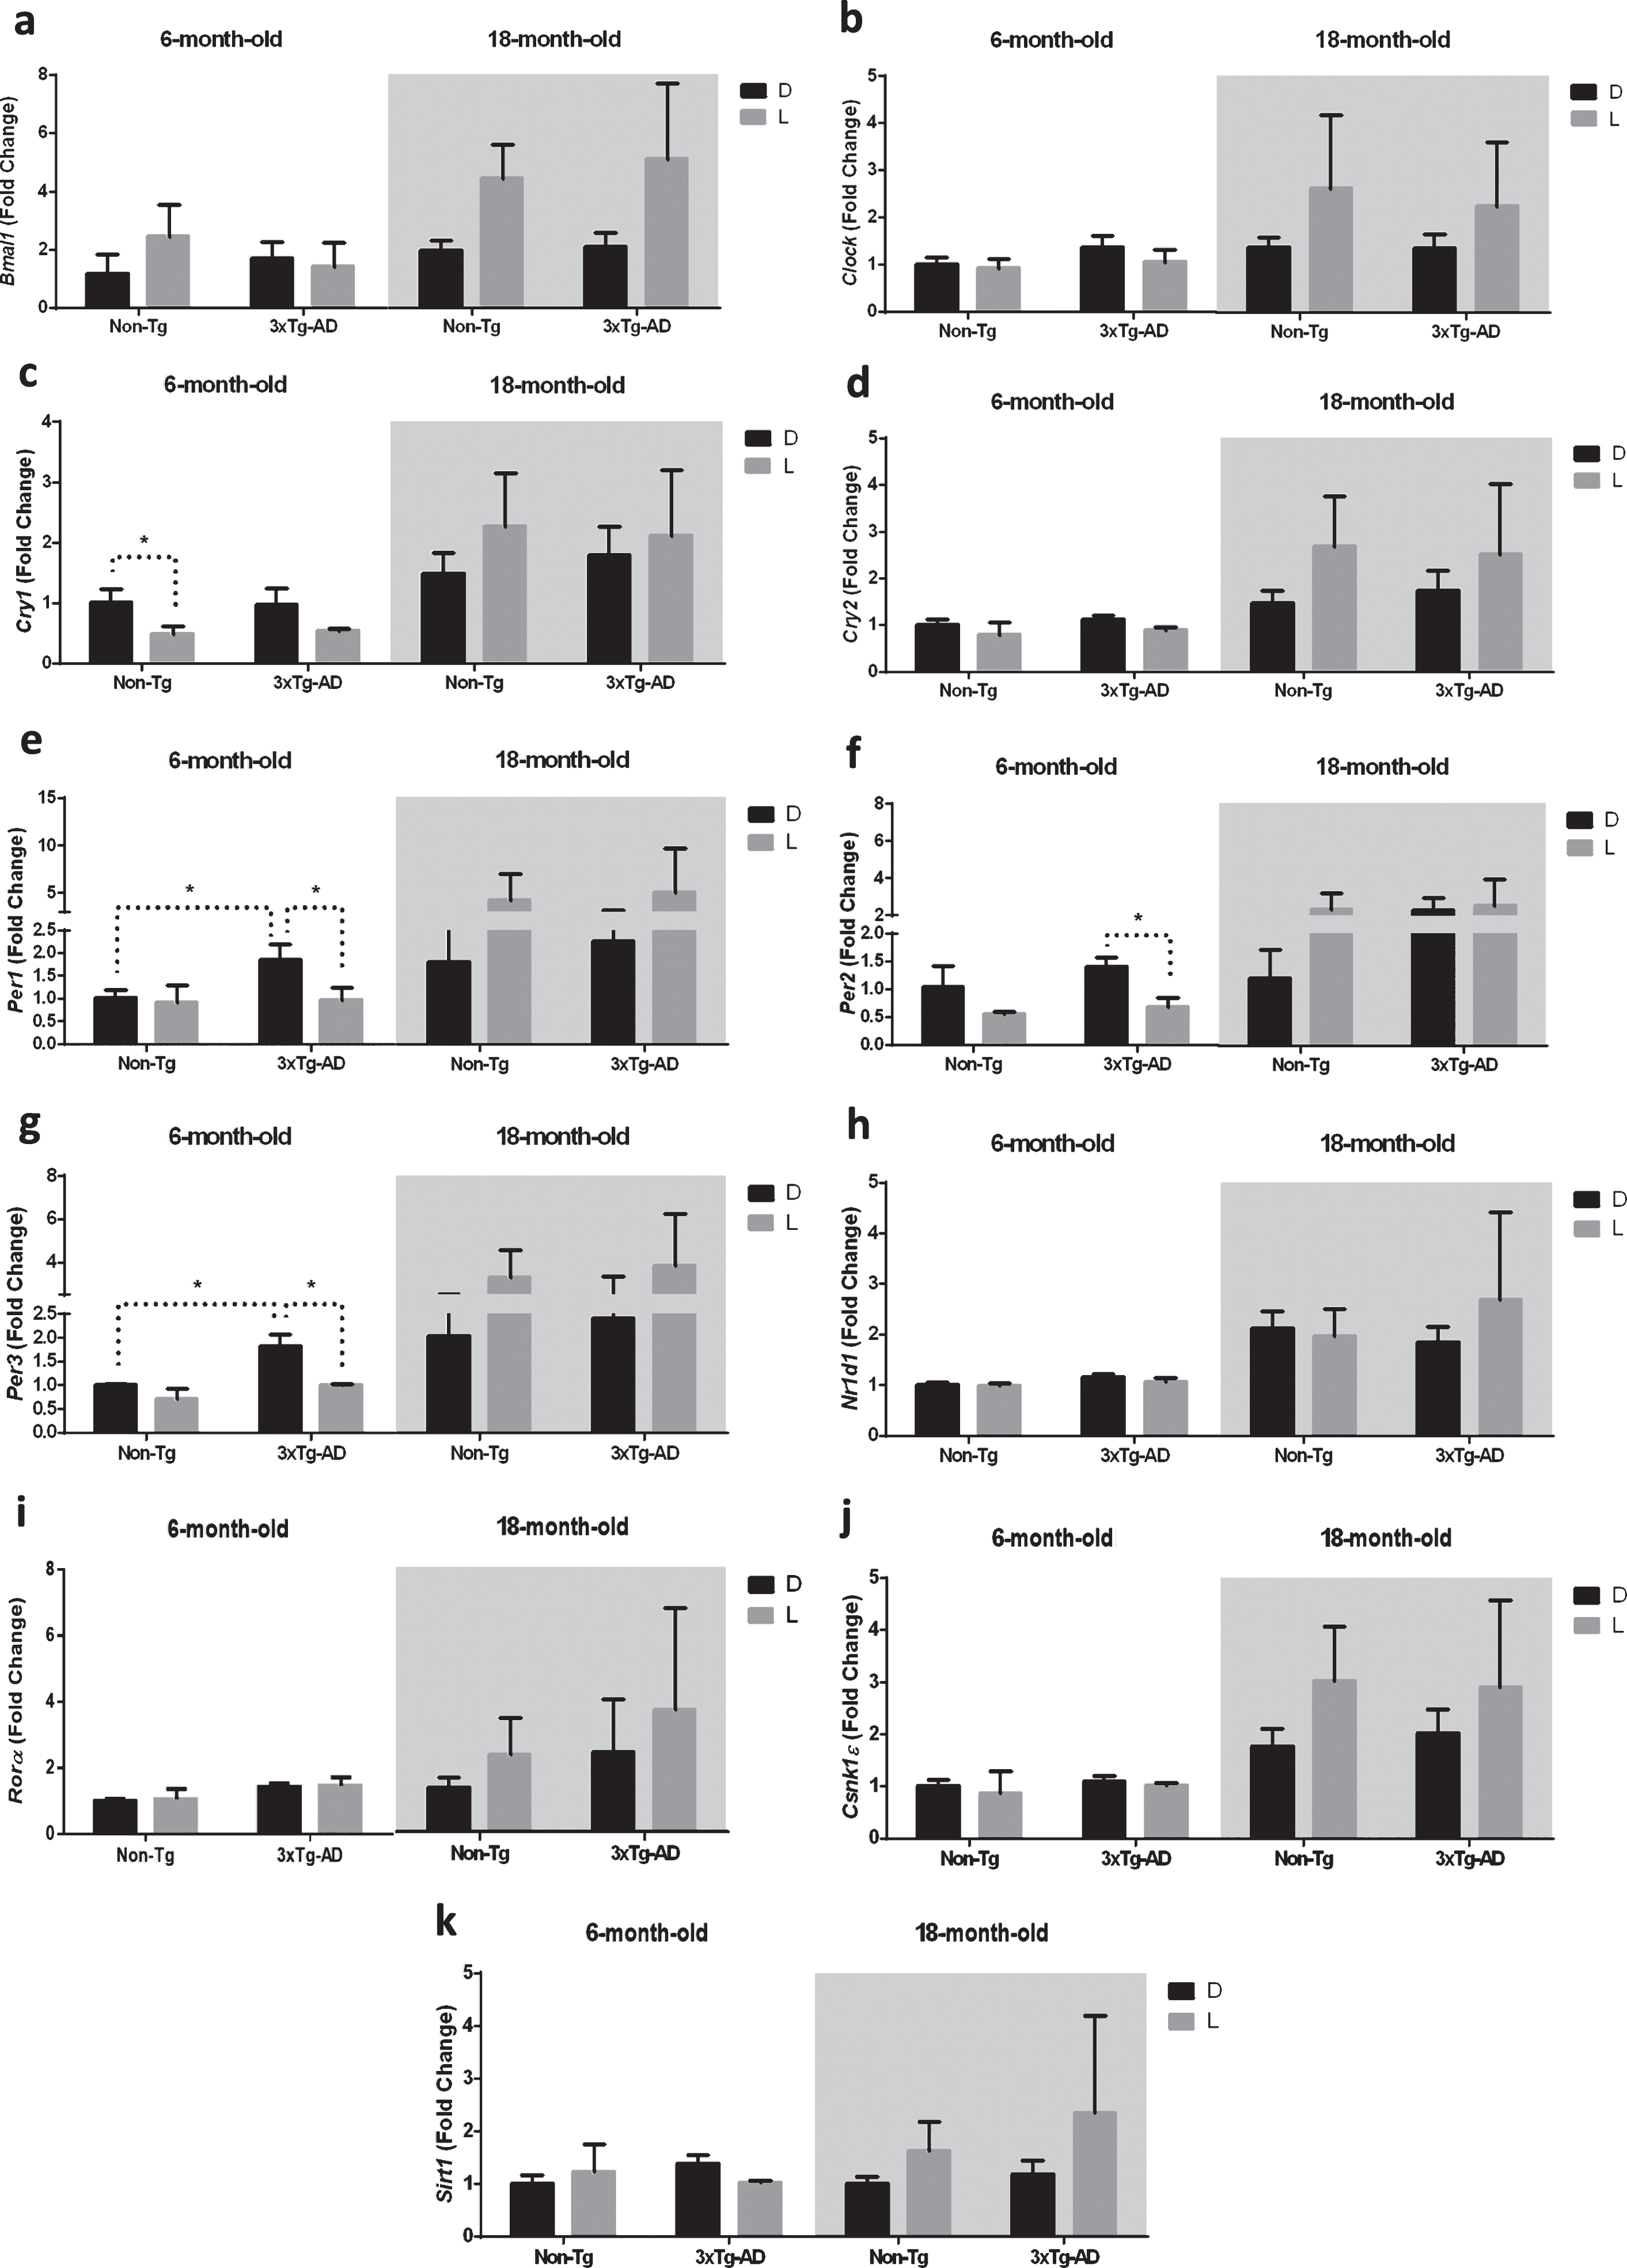
Moreover, after 12 h L exposure we observed a significant downregulation of Per1, 2, and 3 in 6-month-old 3×Tg-AD mice (–51%, –52%, and –44%, respectively), while no significant difference was observed after D/L exposure in both 6-month-old Non-Tg and 18-month-old mice of both genotypes (Fig. 3e-g). Interestingly, Per1 and Per3 expression in 6-month-old 3×Tg-AD mice was significantly higher (+85% and +82%, respectively) compared to 6-month-old Non-Tg mice after 12 h exposure to D (Fig. 3e, g).
Effect of D/L exposure on gene expression of the clock pathway in the brainstem of 6- and 18-month-old 3×Tg-AD and Non-Tg mice
We then evaluated the expression of clock genes in the brainstem, which is connected with the SCN by the neural circuits regulating sleep-wakerhythms [28].
The results obtained by the statistical analysis aimed to test the main effects of D/L cycle, G, A and the interactions D/L×G, D/L×A, G×A, and D/L×A×G are shown in Table 4. We observed a significant main effect of the D/L cycle on the expression of Bmal1, Cry2, Per1, Rorα, and Csnk1ɛ. The main effect of genotype was significant on the expression of Cry1-2 and Per1, as well as Rorα, Csnk1ɛ, and Sirt1. The main effect of age was a significant factor in the expression of all the genes studied, except for Clock and Cry1. The main effect of an interaction between the D/L cycle and genotype was significant for Bmal1 and Cry1-2 expression, while the interaction between the D/L cycle and age was significant for Bmal1, Cry1-2 and Per1 expression; moreover, the main effect of interaction between genotype and age was significant for Cry1-2, Per1, Rorα, Csnk1ɛ, and Sirt1 expression. The main effects of interaction among the three factors was significant for the expression of Cry2, Per1, and Csnk1ɛ(Table 4).
Table 4
Results from the three-way ANOVA of clock gene expression in the brainstem of 6-month and 18-month-old Non-Tg and 3×Tg-AD mice after a 12-hour D/L cycle (n = 12 per group). D, dark; L, light; G, genotype; A, age; F, Fisher’s test. *p < 0.05; **p < 0.01; ***p < 0.001
| D/L | G | A | D/L×G | D/L×A | G×A | D/L×G×A | ||
| Bmal1 | F | 19.10** | 0.29 | 19.49** | 18.08** | 11.66** | 2.28 | 0.57 |
| Clock | F | 1.94 | 3.56 | 0.03 | 2.50 | 1.21 | 1.50 | 1.03 |
| Cry1 | F | 0.00 | 5.24* | 1.29 | 8.61* | 6.70* | 23.83*** | 2.08 |
| Cry2 | F | 32.74*** | 20.53*** | 69.57*** | 19.51*** | 36.61*** | 34.32*** | 13.37** |
| Per1 | F | 10.43** | 14.26** | 25.90*** | 0.89 | 6.87* | 57.84*** | 9.06** |
| Per2 | F | 0.05 | 0.66 | 98.86*** | 0.06 | 0.08 | 0.60 | 0.08 |
| Per3 | F | 0.02 | 0.82 | 107.6*** | 0.24 | 0.00 | 0.66 | 0.05 |
| Nr1d1 | F | 0.45 | 0.05 | 83.16*** | 1.00 | 0.80 | 1.95 | 2.65 |
| Rorα | F | 7.58* | 6.00* | 42.50*** | 0.91 | 2.85 | 8.09* | 1.81 |
| Csnk1ɛ | F | 4.44* | 14.57** | 18.57*** | 0.08 | 0.51 | 21.90*** | 5.02* |
| Sirt1 | F | 2.60 | 24.03*** | 24.44*** | 0.05 | 1.24 | 27.02*** | 0.01 |
As reported in the Fig. 4a, the post-hoc analysis showed a significant upregulation of Bmal1 expression after 12 h L exposure only in the 6-month-old Non-Tg mice (–321%), while no significant difference was observed in both the 6-month-old 3×Tg-AD and 18-month-old mice of both genotypes.
Fig.4
Clock gene expression level in the brainstem (BS) of 6-month-old and 18-month-old Non-Tg and 3×Tg-AD mice after 12 h exposure to darkness (D) or light (L). Data are expressed as mean±SEM of fold change values and analyzed by 3-way ANOVA. Tukey’s post hoc test was used where appropriate to perform multiple comparisons. *p < 0.05; **p < 0.01; ***p < 0.001.
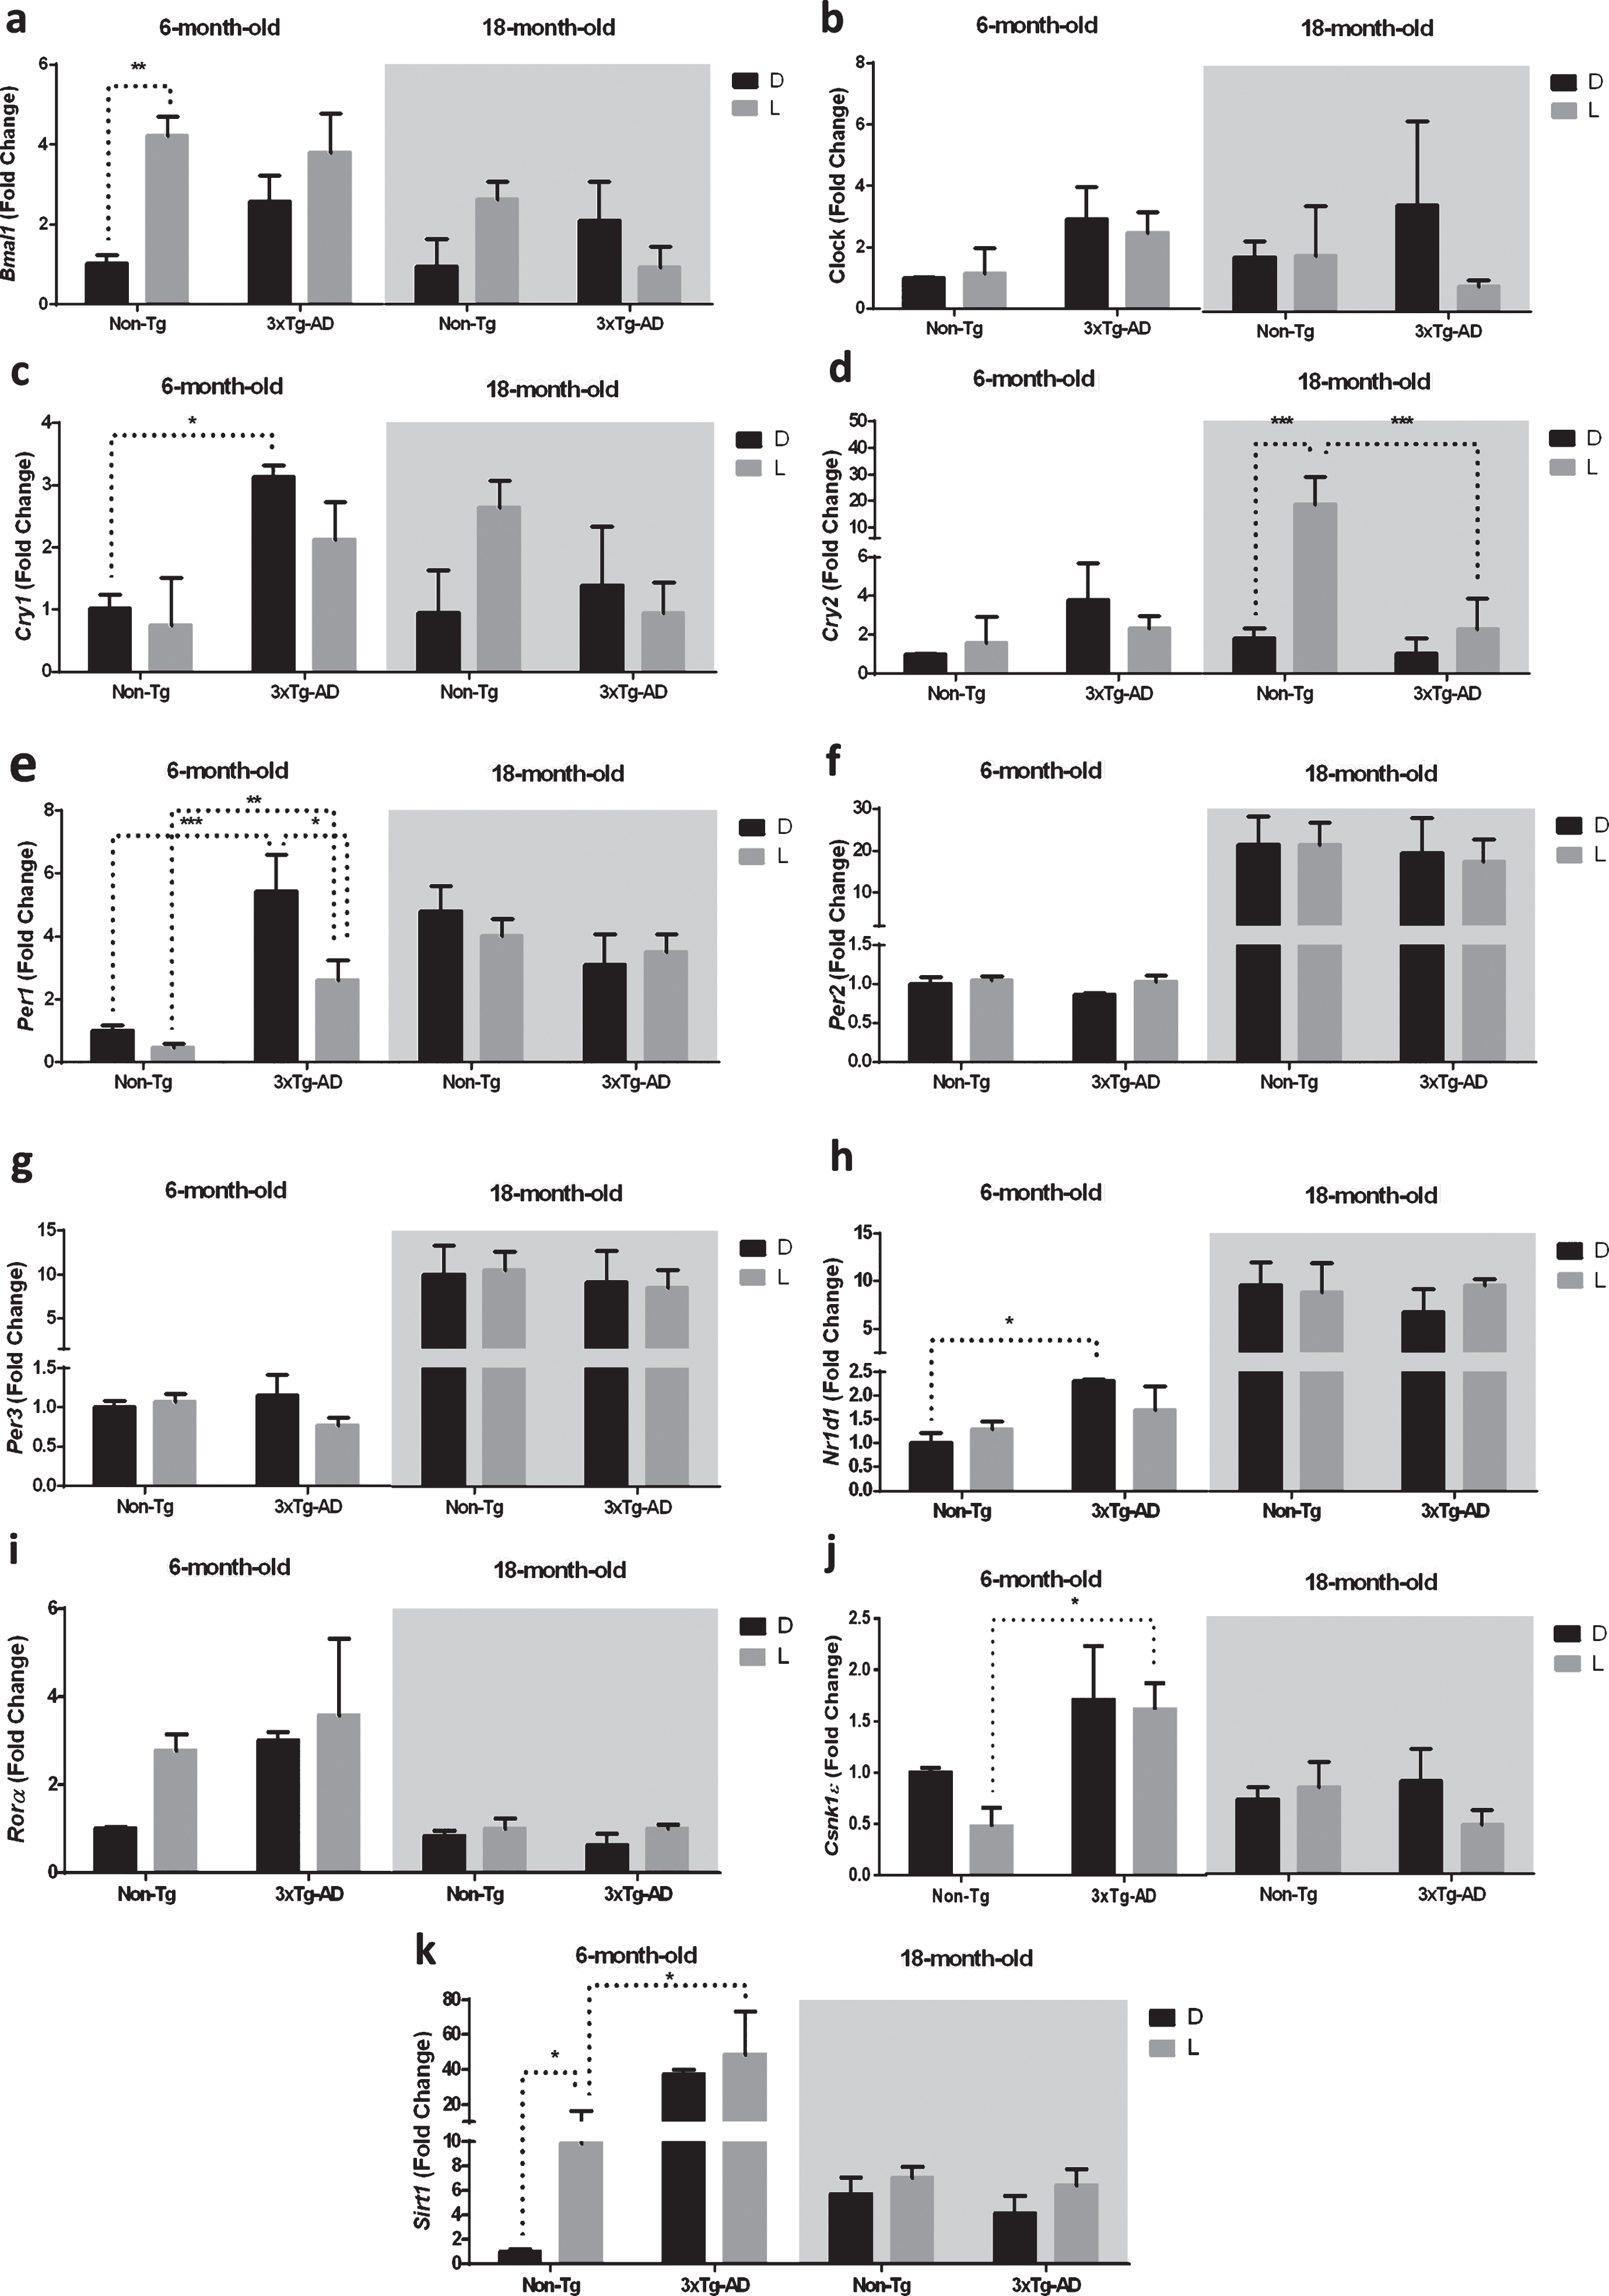
Cry1 expression in 6-month-old 3×Tg-AD mice was significantly higher (+212%) compared to 6-month-old Non-Tg mice after a 12 h exposure to D (Fig. 4c).
Moreover, Cry2 was upregulated (+471%) in 18-month-old Non-Tg mice after a 12 h L exposure (Fig. 4d). Interestingly, Cry2 expression in 18-month-old 3×Tg-AD mice was significantly lower (–74%) compared to 18-month-old Non-Tg mice after a 12 h exposure to L (Fig. 4d).
Per1 was downregulated (–54%) in 6-month-old 3×Tg-AD mice after a 12 h L exposure (Fig. 4e). Interestingly, Per1 expression in 6-month-old 3×Tg-AD mice was significantly higher compared to 6-month-old Non-Tg mice after a 12 h exposure to D and L (+444% and 467%, respectively, Fig. 4e).
As far as Nr1d1, the expression in 6-month-old 3×Tg-AD mice was significantly higher (+131%) compared to 6-month-old Non-Tg mice after a 12 h exposure to D (Fig. 4h).
Moreover, the expression of Csnk1ɛ was significantly higher (+237%) in 6-month-old 3×Tg-AD mice compared to 6-month-old Non-Tg mice after a 12 h exposure to L (Fig. 4j).
Finally, after a 12 h L exposure we observed an upregulation (+989%) of Sirt1 expression in 6-month-old Non-Tg mice, while no significant differences were observed after D/L exposure in both 6-month-old 3×Tg-AD and 18-month-old mice of both genotypes (Fig. 4k). Interestingly, Sirt1 expression in 6-month-old 3×Tg-AD mice was significantly higher (+347%) compared to 6-month-old Non-Tg mice after a 12 h exposure to L(Fig. 4k).
Alterations of clock gene expression and neuropathology
To verify whether variations in the clock pathway were related to brain pathology in the transgenic model, immunohistochemical analysis of both Aβ and tau was performed in all the areas where the clock gene expression was investigated. As previously reported, no immunostaining was detected in the SCN and in the brainstem (data not shown) [17].
As the 3×Tg-AD mice age, they gradually accumulate Aβ and tau pathology in their brains. Specifically, 6-month old 3×Tg-AD mice showed a significant increase in Aβ immunostaining compared to age-matched Non-Tg mice, while no difference was found in tau immunoreactivity at this age in both the frontal cortex and the hippocampus. Finally, we found dense Aβ deposits and extensive human tau immunoreactivity in the frontal cortex and hippocampus of 18-month-old 3×Tg-AD mice. None of these immunoreactive structures were detected in the Non-Tg brains (Fig. 5a).
Fig.5
a) Representative microphotographs (10×magnification, scale bar 100 μm) and results obtained from the semi-quantitative analyses of Aβ (6E10 antibody) and tau (HT7 antibody) immunostaining from Non-Tg (n = 3, white bars) and 3×Tg-AD (n = 3, black bars) mice. The red squares within the brain diagrams illustrate the sites where the representative microphotographs were taken. The data are mean±SEM **p < 0.01 and ***p < 0.001 versus age-matched Non-Tg mice (Unpaired Student’s t-test, n = 3). b-d) Scatterplot of Aβ or tau protein levels versus Per3 and Rorα mRNA expression showing a direct correlation (Pearson test) in the hippocampus of 3×Tg-AD mice.
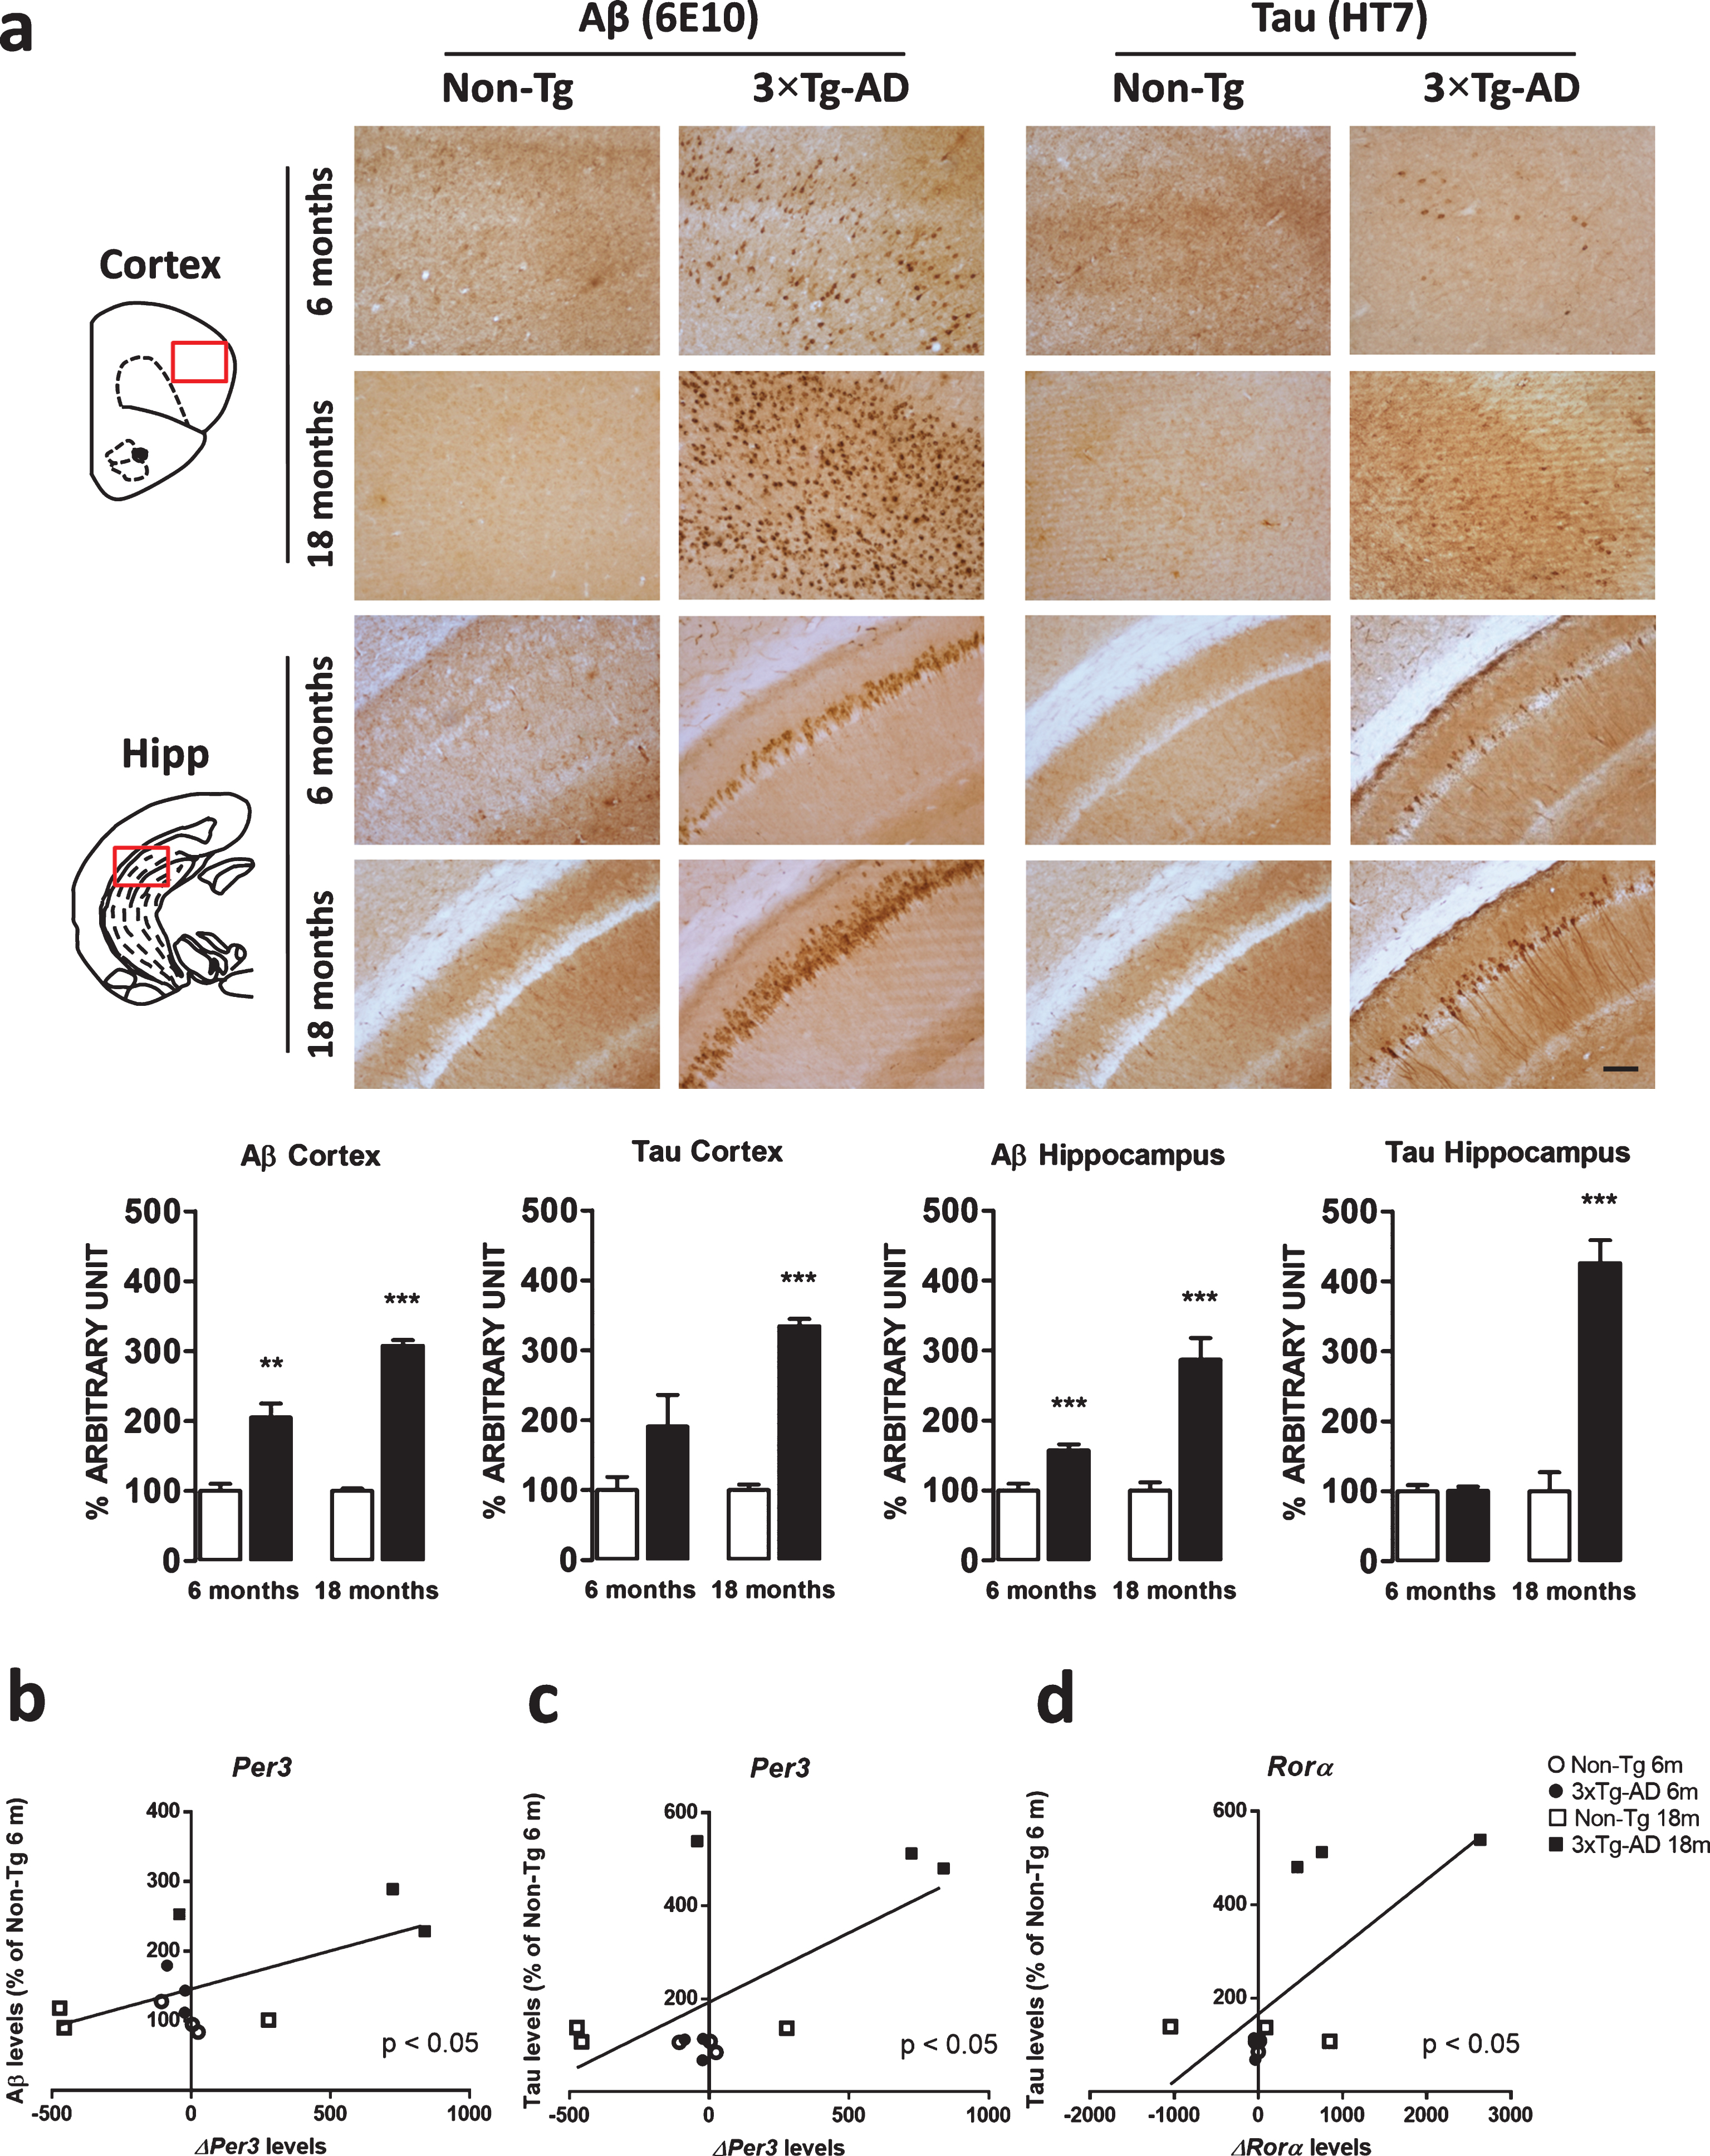
Moreover, the application of a Pearson correlation test did not find any relationship between modification of clock gene expression and Aβ deposition or tau immunoreactivity in the frontal cortex. Nevertheless, direct correlations between Aβ and Per3 variation (ρ= 0.6223, p = 0.0307), tau and Per3 variation (ρ= 0.6445, p = 0.0237), as well as tau and Rorα (ρ= 0.6901, p = 0.0130) were found in the hippocampus (Fig. 5b-d).
DISCUSSION
The present study demonstrates that the RNA expressions of clock genes are disrupted in both the SCN and three extra-hypothalamic brain areas that contribute to circadian regulation¾ the hippocampus, frontal cortex, and brainstem¾in the 6-month-old 3×Tg-AD compared to age-matched control Non-Tg mice. Differences between these genotypes were observed at 6 months (the stage of mild pathology), but then disappeared by 18 months at an increasingly severe stage of pathology. These data therefore demonstrate that, with the progression of AD, the increasing impact of Aβ and NFTs accumulation on gene expression in the clock pathway were obscured by an interaction with the normal aging process.
In the clock pathway, the clock gene product BMAL1 and its partner CLOCK are positive regulators of transcription, while others, such as CRY, PER, and RORα, are components of a negative feedback loop that attenuates activation of a range of endogenous clock genes [23]. During the day, CLOCK and BMAL1 heterodimerize and activate the rhythmic transcription of Per1-3 and Cry1-2, which in turn form complexes in the cytoplasm and then translocate to the nucleus interacting with CLOCK-BMAL1, which inhibit their own transcription. In a second positive loop, the CLOCK-BMAL1 complexes activate the transcription of Nr1d1 and Rorα, whose protein products repress and activate, respectively, Bmal1 transcription influencing its rhythmic expression. While BMAL1 level falls, the expression of Per and Cry genes increases, proteins enter the nucleus inhibiting their own transcription and also Rev-erb α transcription, leading to a de-repression or activation of Bmal1 expression, which completes and fine tunes this transcriptional feedback loop.
The CLOCK-BMAL1 duet also drives the expression of output genes, the so-called clock controlled genes [29–32]. The mechanism of negative feedback loops is needed to establish and maintain circadian rhythms, but the clock has further levels of complexity including post-transcriptional regulation, phosphorylation, ubiquitination, post-translational modifications, and chromatin remodeling [33, 34]. Therefore, we designed our gene expression study as previous observations of the interactions between environmental cues and gene expression of clock pathway transcripts have yielded important insights into the regulatory mechanisms of circadianfunction [35].
The function of circadian clocks, in common with several physiological activities, is greatly affected by neurodegenerative diseases [36], as well as the aging process [37]. The most novel finding of our study is the demonstration that gene expression in the clock pathway is disrupted in 6-month-old 3×Tg-AD mice, which is accompanied with the onset of mild pathology and cognitive impairments but these disruptions were masked by the normal ageing process and expression was not significantly disrupted in 18-month-old 3×Tg-AD, compared with normal aging control. This hypothesis is supported by clinical observations demonstrating that changes in the circadian patterns of geneexpression are significant during the normal aging processes, but less differences are observed when comparing elderly AD patients with age-matched controls [38, 39]. To our opinion, it is not conceivable that normal aging processes are stronger than AD pathology in the induction of circadian disruption, but rather that the lack of differences between 18-month-old Non-Tg and 3×Tg-AD mice may reflect a ceiling effect.
In a recent postmortem study, significant differences in the RNA expression level of Per1-2 and Bmal1 were found in the bed nucleus of the stria terminalis, cingulate cortex, and the pineal gland [40]. However, there are significant methodological difficulties in accurately interpreting clock pathway gene expression in human samples, as a daytime death would result in differing patterns of gene expression than a nightly one [36]. To date, studies in gene-manipulated mice commonly used as models of AD have not provided evidence of a disruption to clock pathway gene expression in AD, or demonstrated the potential involvement of these genes in the neurodegenerative process. This potential disruption in gene expression is further complicated by the variety of transgenic mice used as AD models, which can harbor single, double, or triple gene mutations, and show different phenotypes. The 3×Tg-AD mice exhibit both Aβ and tau pathology characteristic of the human form of AD, and have been so far extensively characterized in the context of biochemical, circadian, behavioral and cognitive changes [19, 41, 42]. Nevertheless, a methodological limitation of this investigation consists in the absence of electrophysiological measurement of circadian rhythms and sleep-wake cycle, taking into account that behavioral studies are characterized by environment-gene interaction and researcher-associated bias [43, 44].
Interestingly, this present study shows that the effects of light exposure on the expression of clock pathway genes in the SCN were altered in the AD model. Similar results though related to fewer genes were observed in the brainstem, but not in the hippocampus and the frontal cortex, the most affected brain areas in AD. Changes pertaining to circadian rhythmicity that occur prior to and post-AD pathology have been previously characterized in 3×Tg-AD mice, demonstrating that abnormalities in circadian rhythmicity precede the expected onset of AD pathology [41]. It is interesting to note that these differences presented in relatively young (6 months of age) 3×Tg-AD mice who express mild pathology and cognitive impairments, but by 18 months of age as the pathology and cognitive impairments increase in severity, these differences become statistically insignificant due to an interaction with ageing. Other studies have suggested that alterations in the expression of clock pathway genes association with AD are only slightly observed in brain areas where pathology develops. One rodent AD-model showed altered expression of Per2 in the SCN, but not in the hippocampus [45] and there is evidence that Aβ could induce degradation of BMAL1 and modulate Per2 expression [46]. Other recent reports have demonstrated that AD-related morphological findings occur in the hypothalamus and brainstem as well [47, 48]. It has been previously considered that the intact circadian system may have neuroprotective functions, but disruption of the circadian clock seems topromote neurodegeneration [49]. This study showed that correlations between amyloid plaques/NFTs accumulation and altered expression of clock genes were confined to the hippocampus, which is a brain region particularly affected by AD pathology in the 3×Tg-AD mice. In this regard, further studies are needed to clarify the underlying molecularmechanisms.
Previous experiments in rodents have shown that the age-related deterioration in circadian pacemaker function occurs at the level of individual cells in the SCN, and it is correlated with an altered expression of several of the genes that support the molecular function of the circadian clock [50, 51]. Moreover, it has been described that the light-induced expression of clock genes is modified in the SCN of aging hamsters [52], and that phase-shifts of the D/L cycle are affected in the pineal gland and the arcuate nucleus of aged rats [53]. When we examined and compared expression of clock pathway genes after light exposure as a function of aging in 6-month-old and 18-month-old animals, the main changes found as a consequence of aging suggested that expression was increased in aged mice. This study did not address whether clock gene dysregulation during aging was dependent on an impairment of the retina; however, a recent study performed with cholera toxin tracing has concluded that aging rather than retinal degeneration is a more important factor in reducing the efficiency of L or D information to the SCN [54]. Another cause of the alteration of the circadian pacemaker may be linked to age-related loss of sensitivity to melatonin in the SCN [55]. A further comment should be addressed concerning the progression of brain pathology on altered clock gene expression as a consequence of the D/L cycle in the extra-hypothalamic brain areas. While SCN clocks are able to independently generate and maintain their circadian oscillations, secondary clocks do require external signals to sustain and/or synchronize their rhythms [56]. It has then been suggested that the age-associated changes in the SCN might account for the impairments in circadian clock synchronization in other peripheral clocks [35]. However, since the brain contains multiple circadian oscillators in extra-hypothalamic areas, it is also conceivable that these peripheral regions could adapt to changes related to the pathological process [57]. It is interesting to note that in our study we observed the effect of light exposure on Bmal1 expression in all brain areas observed. However, this was not associated with an effect of light exposure on the negative feedback loop. The disruption of the circadian system by targeted deletions of Clock or Bmal1 significantly affects the rate of ageing, and is associated with increases in brain inflammation and neurodegeneration [37, 58]. CLOCK proteins may have other functions other than regulation of the circadian rhythm [49]. This is supported by evidence showing accelerated neurodegeneration in mouse models of brain-selective or conditional Bmal1 knock out mice [59, 60]. It is then conceivable that upregulation of Bmal1 and the altered activation of the negative feedback loop, which occurs in all the brain areas, would represent a counteracting mechanism to the neurodegenerative effect. However, these aspects need to be further investigated by using different circadian mutant models.
In conclusion, our results demonstrate that a mild AD-pathology in 6-month-old, 3×Tg-AD mice is associated with a disruption in the temporal patterns and quantitative levels gene expression in the clock pathway, particularly in the SCN but also in extra-hypothalamic brain areas associated with circadian function, suggesting a severe impairment of functioning of the clock gene machinery. Even though this study did not allow to establish a direct association between clock gene impairment and circadian behavioral changes, our novel findings encourage future studies testing the hypothesis that altered clock gene expression may account for the disruption of timely organization among brain areas, hampering the coordination between basic cellular metabolic and homeostatic processes, ultimately leading to altered functionality and connectivity of brain structures, cognitive impairment and chrono-disruption that characterize the early onset of AD in patients.
ACKNOWLEDGMENTS
Francesco Bellanti is co-funded by the Development and Cohesion Fund – APQ Research Regione Puglia (Future in Research project).
The publication of this manuscript is supported by the “5×1000 IRPEF” funds in favour of the University of Foggia, in memory of Gianluca Montel.
Authors’ disclosures available online (http://j-alz.com/manuscript-disclosures/16-0942r2).
Appendices
The supplementary material is available in the electronic version of this article: http://dx.doi.org/10.3233/JAD-160942.
REFERENCES
[1] | Moore RY , Silver R ((1998) ) Suprachiasmatic nucleus organization. Chronobiol Int 15: , 475–487. |
[2] | Mrosovsky N ((1996) ) Locomotor activity and non-photic influences on circadian clocks. Biol Rev Camb Philos Soc 71: , 343–372. |
[3] | Van Der Zee EA , Boersma GJ , Hut RA ((2009) ) The neurobiology of circadian rhythms. Curr Opin Pulm Med 15: , 534–539. |
[4] | Antle MC , Silver R ((2005) ) Orchestrating time: Arrangements of the brain circadian clock. Trends Neurosci 28: , 145–151. |
[5] | Franken P , Dijk DJ ((2009) ) Circadian clock genes and sleep homeostasis. Eur J Neurosci 29: , 1820–1829. |
[6] | Coogan AN , Thome J ((2011) ) Chronotherapeutics and psychiatry: Setting the clock to relieve the symptoms. World J Biol Psychiatry 12: (Suppl 1), 40–43. |
[7] | Barnes DE , Yaffe K ((2011) ) The projected effect of risk factor reduction on Alzheimer’s disease prevalence. Lancet Neurol 10: , 819–828. |
[8] | Frank-Cannon TC , Alto LT , Mcalpine FE , Tansey MG ((2009) ) Does neuroinflammation fan the flame in neurodegenerative diseases? Mol Neurodegener 4: , 47. |
[9] | Ballard C , Gauthier S , Corbett A , Brayne C , Aarsland D , Jones E ((2011) ) Alzheimer’s disease. Lancet 377: , 1019–1031. |
[10] | Song Y , Dowling GA , Wallhagen MI , Lee KA , Strawbridge WJ ((2010) ) Sleep in older adults with Alzheimer’s disease. J Neurosci Nurs 42: , 190–198. |
[11] | Bliwise DL , Mercaldo ND , Avidan AY , Boeve BF , Greer SA , Kukull WA ((2011) ) Sleep disturbance in dementia with Lewy bodies and Alzheimer’s disease: A multicenter analysis. Dement Geriatr Cogn Disord 31: , 239–246. |
[12] | Satlin A , Volicer L , Stopa EG , Harper D ((1995) ) Circadian locomotor activity and core-body temperature rhythms in Alzheimer’s disease. Neurobiol Aging 16: , 765–771. |
[13] | Harper DG , Stopa EG , Mckee AC , Satlin A , Fish D , Volicer L ((2004) ) Dementia severity and Lewy bodies affect circadian rhythms in Alzheimer disease. Neurobiol Aging 25: , 771–781. |
[14] | Cermakian N , Boivin DB ((2009) ) The regulation of central and peripheral circadian clocks in humans. Obes Rev 10: (Suppl 2), 25–36. |
[15] | Mendoza J , Challet E ((2009) ) Brain clocks: From the suprachiasmatic nuclei to a cerebral network. Neuroscientist 15: , 477–488. |
[16] | Lee JH , Ryan J , Andreescu C , Aizenstein H , Lim HK ((2015) ) Brainstem morphological changes in Alzheimer’s disease. Neuroreport 26: , 411–415. |
[17] | Oddo S , Caccamo A , Shepherd JD , Murphy MP , Golde TE , Kayed R , Metherate R , Mattson MP , Akbari Y , Laferla FM ((2003) ) Triple-transgenic model of Alzheimer’s disease with plaques and tangles: Intracellular Abeta and synaptic dysfunction. Neuron 39: , 409–421. |
[18] | Cassano T , Romano A , Macheda T , Colangeli R , Cimmino CS , Petrella A , Laferla FM , Cuomo V , Gaetani S ((2011) ) Olfactory memory is impaired in a triple transgenic model of Alzheimer disease. Behav Brain Res 224: , 408–412. |
[19] | Cassano T , Serviddio G , Gaetani S , Romano A , Dipasquale P , Cianci S , Bellanti F , Laconca L , Romano AD , Padalino I , Laferla FM , Nicoletti F , Cuomo V , Vendemiale G ((2012) ) Glutamatergic alterations and mitochondrial impairment in a murine model of Alzheimer disease. Neurobiol Aging 33: , 1121.e1–12. |
[20] | Bedse G , Romano A , Cianci S , Lavecchia AM , Lorenzo P , Elphick MR , Laferla FM , Vendemiale G , Grillo C , Altieri F , Cassano T , Gaetani S ((2014) ) Altered expression of the CB1 cannabinoid receptor in the triple transgenic mouse model of Alzheimer’s disease. J Alzheimers Dis 40: , 701–712. |
[21] | Barone E , Di DF , Cassano T , Arena A , Tramutola A , Lavecchia MA , Coccia R , Butterfield DA , Perluigi M ((2016) ) Impairment of biliverdin reductase-a promotes brain insulin resistance in Alzheimer disease: A new paradigm. Free Radic Biol Med 91: , 127–142. |
[22] | Cassano T , Gaetani S , Morgese MG , Macheda T , Laconca L , Dipasquale P , Taltavull J , Shippenberg TS , Cuomo V , Gobbi G ((2009) ) Monoaminergic changes in locus coeruleus and dorsal raphe nucleus following noradrenaline depletion. Neurochem Res 34: , 1417–1426. |
[23] | Bonaconsa M , Colavito V , Pifferi F , Aujard F , Schenker E , Dix S , Grassi-Zucconi G , Bentivoglio M , Bertini G ((2013) ) Cell clocks and neuronal networks: Neuron ticking and synchronization in aging and aging-related neurodegenerative disease. Curr Alzheimer Res 10: , 597–608. |
[24] | Eide EJ , Woolf MF , Kang H , Woolf P , Hurst W , Camacho F , Vielhaber EL , Giovanni A , Virshup DM ((2005) ) Control of mammalian circadian rhythm by CKI(-regulated proteasome-mediated PER2 degradation. Mol Cell Biol 25: , 2795–2807. |
[25] | Chang HC , Guarente L ((2013) ) SIRT1 mediates central circadian control in the SCN by a mechanism that decays with aging. Cell 153: , 1448–1460. |
[26] | Guilding C , Piggins HD ((2007) ) Challenging the omnipotence of the suprachiasmatic timekeeper: Are circadian oscillators present throughout the mammalian brain? Eur J Neurosci 25: , 3195–3216. |
[27] | Mesulam MM ((2000) ) A plasticity-based theory of the pathogenesis of Alzheimer’s disease. Ann N Y Acad Sci 924: , 42–52. |
[28] | Abbott SM , Arnold JM , Chang Q , Miao H , Ota N , Cecala C , Gold PE , Sweedler JV , Gillette MU ((2013) ) Signals from the brainstem sleep/wake centers regulate behavioral timing via the circadian clock. Plos One 8: , E70481>. |
[29] | Preitner N , Damiola F , Lopez-Molina L , Zakany J , Duboule D , Albrecht U , Schibler U ((2002) ) The orphan nuclear receptor REV-ERB(controls circadian transcription within the positive limb of the mammalian circadian oscillator. Cell 110: , 251–260. |
[30] | Hastings MH , Reddy AB , Maywood ES ((2003) ) A clockwork web: Circadian timing in brain and periphery, in health and disease. Nat Rev Neurosci 4: , 649–661. |
[31] | Ueda HR , Hayashi S , Chen W , Sano M , Machida M , Shigeyoshi Y , Iino M , Hashimoto S ((2005) ) System-level identification of transcriptional circuits underlying mammalian circadian clocks. Nat Genet 37: , 187–192. |
[32] | Liu AC , Tran HG , Zhang EE , Priest AA , Welsh DK , Kay SA ((2008) ) Redundant function of REV-ERB(and (and non-essential role for Bmal1 cycling in transcriptional regulation of intracellular circadian rhythms. Plos Genet 4: , E1000023. |
[33] | Harms E , Kivimae S , Young MW , Saez L ((2004) ) Posttranscriptional and posttranslational regulation of clock genes. J Biol Rhythms 19: , 361–373. |
[34] | Gallego M , Virshup DM ((2007) ) Post-translational modifications regulate the ticking of the circadian clock. Nat Rev Mol Cell Biol 8: , 139–148. |
[35] | Hofman MA , Swaab DF ((2006) ) Living by the clock: The circadian pacemaker in older people. Ageing Res Rev 5: , 33–51. |
[36] | Thome J , Coogan AN , Woods AG , Darie CC , Hassler F ((2011) ) CLOCK genes and circadian rhythmicity in Alzheimer disease. J Aging Res 2011: , 383091. |
[37] | Kondratov RV ((2007) ) A role of the circadian system and circadian proteins in aging. Ageing Res Rev 6: , 12–27. |
[38] | Chen CY , Logan RW , Ma T , Lewis DA , Tseng GC , Sibille E , Mcclung CA ((2016) ) Effects of aging on circadian patterns of gene expression in the human prefrontal cortex. Proc Natl Acad Sci U S A 113: , 206–211. |
[39] | Weissova K , Bartos A , Sladek M , Novakova M , Sumova A ((2016) ) Moderate changes in the circadian system of Alzheimer’s disease patients detected in their home environment. Plos One 11: , E0146200. |
[40] | Cermakian N , Lamont EW , Boudreau P , Boivin DB ((2011) ) Circadian clock gene expression in brain regions of Alzheimer’s disease patients and control subjects. J Biol Rhythms 26: , 160–170. |
[41] | Sterniczuk R , Dyck RH , Laferla FM , Antle MC ((2010) ) Characterization of the 3xTg-AD mouse model of Alzheimer’s disease: Part 1. circadian changes. Brain Res 1348: , 139–148. |
[42] | Sterniczuk R , Antle MC , Laferla FM , Dyck RH ((2010) ) Characterization of the 3xTg-AD mouse model of Alzheimer’s disease: Part 2. behavioral and cognitive changes. Brain Res 1348: , 149–155. |
[43] | Tucci V , Lad HV , Parker A , Polley S , Brown SD , Nolan PM ((2006) ) Gene-environment interactions differentially affect mouse strain behavioral parameters. Mamm Genome 17: , 1113–1120. |
[44] | Sorge RE , Martin LJ , Isbester KA , Sotocinal SG , Rosen S , Tuttle AH , Wieskopf JS , Acland EL , Dokova A , Kadoura B , Leger P , Mapplebeck JC , Mcphail M , Delaney A , Wigerblad G , Schumann AP , Quinn T , Frasnelli J , Svensson CI , Sternberg WF , Mogil JS ((2014) ) Olfactory exposure to males, including men, causes stress and related analgesia in rodents. Nat Methods 11: , 629–632. |
[45] | Duncan MJ , Smith JT , Franklin KM , Beckett TL , Murphy MP , St Clair DK , Donohue KD , Striz M , O’Hara BF ((2012) ) Effects of aging and genotype on circadian rhythms, sleep, and clock gene expression in Appxps1 knock-in mice, a model for Alzheimer’s disease. Exp Neurol 236: , 249–258. |
[46] | Song H , Moon M , Choe HK , Han DH , Jang C , Kim A , Cho S , Kim K , Mook-Jung I ((2015) ) Abeta-induced degradation of BMAL1 And CBP leads to circadian rhythm disruption in Alzheimer’s disease. Mol Neurodegener 10: , 13. |
[47] | Overk CR , Kelley CM , Mufson EJ ((2009) ) Brainstem Alzheimer’s-like pathology in the triple transgenic mouse model of Alzheimer’s disease. Neurobiol Dis 35: , 415–425. |
[48] | Baloyannis SJ , Mavroudis I , Mitilineos D , Baloyannis IS , Costa VG ((2015) ) The hypothalamus in Alzheimer’s disease: A Golgi and electron microscope study. Am J Alzheimers Dis Other Demen 30: , 478–487. |
[49] | Kondratova AA , Kondratov RV ((2012) ) The circadian clock and pathology of the ageing brain. Nat Rev Neurosci 13: , 325–335. |
[50] | Asai M , Yoshinobu Y , Kaneko S , Mori A , Nikaido T , Moriya T , Akiyama M , Shibata S ((2001) ) Circadian profile of per gene mRNA expression in the suprachiasmatic nucleus, paraventricular nucleus, and pineal body of aged rats. J Neurosci Res 66: , 1133–1139. |
[51] | Weinert H , Weinert D , Schurov I , Maywood ES , Hastings MH ((2001) ) Impaired expression of the mPer2 circadian clock gene in the suprachiasmatic nuclei of aging mice. Chronobiol Int 18: , 559–565. |
[52] | Kolker DE , Fukuyama H , Huang DS , Takahashi JS , Horton TH , Turek FW ((2003) ) Aging alters circadian and light-induced expression of clock genes in golden hamsters. J Biol Rhythms 18: , 159–169. |
[53] | Davidson AJ , Yamazaki S , Arble DM , Menaker M , Block GD ((2008) ) Resetting of central and peripheral circadian oscillators in aged rats. Neurobiol Aging 29: , 471–477. |
[54] | Lupi D , Semo M , Foster RG ((2012) ) Impact of age and retinal degeneration on the light input to circadian brain structures. Neurobiol Aging 33: , 383–392. |
[55] | Von GC , Weaver DR ((2008) ) Loss of responsiveness to melatonin in the aging mouse suprachiasmatic nucleus. Neurobiol Aging 29: , 464–470. |
[56] | Balsalobre A ((2002) ) Clock genes in mammalian peripheral tissues. Cell Tissue Res 309: , 193–199. |
[57] | Abe M , Herzog ED , Yamazaki S , Straume M , Tei H , Sakaki Y , Menaker M , Block GD ((2002) ) Circadian rhythms in isolated brain regions. J Neurosci 22: , 350–356. |
[58] | Dubrovsky YV , Samsa WE , Kondratov RV ((2010) ) Deficiency of circadian protein CLOCK reduces lifespan and increases age-related cataract development in mice. Aging (Albany NY) 2: , 936–944. |
[59] | Musiek ES , Lim MM , Yang G , Bauer AQ , Qi L , Lee Y , Roh JH , Ortiz-Gonzalez X , Dearborn JT , Culver JP , Herzog ED , Hogenesch JB , Wozniak DF , Dikranian K , Giasson BI , Weaver DR , Holtzman DM , Fitzgerald GA ((2013) ) Circadian clock proteins regulate neuronal redox homeostasis and neurodegeneration. J Clin Invest 123: , 5389–5400. |
[60] | Yang G , Chen L , Grant GR , Paschos G , Song WL , Musiek ES , Lee V , Mcloughlin SC , Grosser T , Cotsarelis G , Fitzgerald GA ((2016) ) Timing of expression of the core clock gene Bmal1 influences its effects on aging and survival. Sci Transl Med 8: , 324ra16. |


