
Successful Object Encoding Induces Increased Directed Connectivity in Presymptomatic Early-Onset Alzheimer’s Disease
Abstract
Background: Recent studies report increases in neural activity in brain regions critical to episodic memory at preclinical stages of Alzheimer’s disease (AD). Although electroencephalography (EEG) is widely used in AD studies, given its non-invasiveness and low cost, there is a need to translate the findings in other neuroimaging methods to EEG.
Objective: To examine how the previous findings using functional magnetic resonance imaging (fMRI) at preclinical stage in presenilin-1 E280A mutation carriers could be assessed and extended, using EEG and a connectivity approach.
Methods: EEG signals were acquired during resting and encoding in 30 normal cognitive young subjects, from an autosomal dominant early-onset AD kindred from Antioquia, Colombia. Regions of the brain previously reported as hyperactive were used for connectivity analysis.
Results: Mutation carriers exhibited increasing connectivity at analyzed regions. Among them, the right precuneus exhibited the highest changes in connectivity.
Conclusion: Increased connectivity in hyperactive cerebral regions is seen in individuals, genetically-determined to develop AD, at preclinical stage. The use of a connectivity approach and a widely available neuroimaging technique opens the possibility to increase the use of EEG in early detection of preclinical AD.
INTRODUCTION
Around 44 million people in the world are suffering from dementia [1]. Alzheimer’s disease (AD) is the most prevalent cause of dementia and according to family history can be divided in autosomal dominant, familial, and sporadic [2]. The most common cause of familial early onset AD are the presenilin-1 (PSEN1) mutations, and among these the E280A mutation. These mutations are involved in the production of amyloid-β [3]. The largest family group of carriers with the E280A mutation is found in Colombian, region of Antioquia. This mutation has an autosomal dominant inheritance and carriers have an estimated median age of 44 years at onset of mild cognitive impairment (MCI) and 49 years at onset of dementia [4, 5]. Given that the efficacy of some AD therapies may depend on the initiation of treatment before the clinical manifestation of the disease, stage when the neuronal damage may be irreversible, is important to search for early biomarkers. The study of mutation carriers, in which the current study is focused, provides an unique opportunity to identify early changes related to predisposition to the disease [6, 7].
Electroencephalography (EEG) represents a low cost, portable, and non-invasive alternative to study brain function and neurophysiological changes associated with neurodegenerative processes, as compared to other techniques like functional magnetic resonance imaging (fMRI) or positron emission imaging (PET). Additionally, it represents a brain mapping technique with high temporal resolution, closer to the timescale of the neuronal dynamics [8]. There is a lot of EEG applications covering different stages in sporadic AD [9] and an increase in the use of resting state EEG, given its potential use in population with high levels of impairment by the dementia [10, 11].
Whereas most of papers about AD are related to the sporadic type, the AD related to PSEN1 E280A mutation has been investigated recently through neuroimaging techniques. MRI in PSEN1 E280A mutation carriers have demonstrated preclinical changes in cerebral thickness and volume [12]. Changes have also been shown in regional brain activity using PET [13], fMRI [14, 15], and quantitative EEG [16–20].
There are different strategies for analysis of the neural activity measured through EEG recordings. The study of the spatiotemporal covariance of brain neuronal activity, captured by techniques like fMRI or EEG, is known as functional connectivity. This approach provides information about the interaction of different brain regions in terms of the underlying brain networks. Recently has been discussed that the connectivity approach is highly sensitive to the neurological disease presence, is able to distinguish among alternate diagnostics, gives insights about the disease phenomenology, and also is sensitive to progression and therapy effect [21]. Although the connectivity can be studied at electrode level, there are techniques like the inverse solution methods, that enable the study of the connectivity directly between brain regions [22–24].
In a recent paper, Quiroz et al. described a set of cerebral regions where PSEN1 E280A carriers showed increased activity, measured by fMRI, while encoding visual information [15]. We hypothesize that by using EEG in patients with the mutation, it is possible to detect altered connectivity features in the same brain zones, and therefore, this work aims to identify EEG correlates in presymptomatic carriers using the brain regions reported by Quiroz et al. as hyperactive [15].
Consequently, the EEG signals studied were recorded during resting state and during the performance of a memory-encoding task for two groups of individuals: PSEN1 E280A presymptomatic carriers and non-carriers. For each individual the signal at the cortex was obtained, through inverse solution methods, and the directed connectivity was estimated using transfer entropy (TE) [25]. Although EEG and fMRI use different physical principles, and albeit the connectivity approach is different from the univariate analysis used in fMRI, our findings point to an increase of activity, quantified by a connectivity measure, during an encoding task in presymptomatic carriers of the PSEN1 E280A mutation.
MATERIALS AND METHODS
Participants
Thirty volunteers were recruited from the Universidad de Antioquia (API Colombia) registry, which included more than 1,500 living members with familial AD at the time of the study. Fifteen participants were positive for the AD-associated PSEN1 mutation E280A (ACr); the remaining fifteen participants were PSEN1 mutation negative and served as controls (Control). Subjects in the Control group were matched by gender, age, and educational level to ACr subjects (Table 1). Informed consent for participation was obtained from all subjects according to the protocol approved by the Human Subjects Ethics Committee of the Universidad de Antioquia (Approbation act: 13-10-519). In addition to the EEG records, neurological and neuropsychological tests were performed [4]. Researchers, who were blinded to the genetic status of participants, acquired all the data. The exclusion criteria included severe physical illness, alcohol/drugs abuse, and regular use of neuroleptics or antidepressants with anticholinergic action.
Twenty-nine of the thirty subjects participated in a previous study oriented to search differences in brain rhythms [20]. The clinical assessment, gathering of information, and genetic analysis were performed under the protocols previously defined at the Neuroscience Group of Antioquia and were identical to those previously reported in the work of Quirozet al. [15].
EEG recordings
A Neuroscan unit amplifier (Neuroscan Medical System, Neurosoft Inc. Sterling, VA, USA) was used to record EEG signals. EEG data were recorded (1000 Hz sampling rate, 0.1 to 200 Hz bandpass filtered) from 64 electrodes positioned according to the international 10-10 system with midline reference. A simultaneous electrooculogram (0.1 to 100 Hz bandpass filtered) was also recorded. The impedance was kept below 10 KΩ for all electrodes andsubjects.
Five-minute recordings were obtained at resting state, with the subject relaxed and with eyes closed, and also while performing a memory-encoding task based on a paradigm previously used in the same population [26]. The paradigm is divided in two stages: the study stage, where each subject completed 50 trials of encoding concrete and nameable objects, and the test stage, where the previous 50 objects must be recognized among 50 new objects. Figure 1 shows how the objects are presented for the encoding during the study stage. For the current analysis the signals acquired during the encoding task (ENC) and during the resting state (REST) were used.
Preprocessing
Clean EEG recordings were obtained using an automated preprocessing pipeline based in routines from the EEGLAB [27]. Data were digitally filtered (1 to 30 Hz; FIR filter) and bad channels were detected and interpolated using spherical splines. Then, data were referenced to average and segmented in epochs of 1.5 s. The EEG epochs with ocular, muscular, and other types of artifacts were removed by a computerized automatic procedure based on linear trend, joint probability, and kurtosis [28]. Independent component analysis enhanced by wavelet was used to correct remaining eye blink artifacts [29].
The corrected data were resampled to 500 Hz, trying to keep enough data for the connectivity measure which is based on a mutual information estimator that improves with the amount of data [30], and the cortical current density source model [31] was used to solve the inverse problem through the weighted Minimum Norm Estimation (wMNE) algorithm included in the eConnectome software [32]. Solving the inverse problem implies that the signal captured by electrodes is represented as current density signal in 7850 voxels, where each voxel is of 4 mm3, that cover the entire cerebral cortex. Signals from seven regions of interest (ROIs) were obtained, as an average of the current density from the voxels of each ROI, according to the regions of increased activation reported by Quiroz et al. [15]: right angular gyrus (113 voxels), right precuneus (272 voxels), left frontal superior gyrus (171 voxels), right frontal inferior gyrus (263 voxels), left parahippocampus (58 voxels), left hippocampus (100 voxels), and right hippocampus (78 voxels). The ROIs, that wereestablished according to the partition scheme defined in the AAL atlas [33], differ in the number of voxels covered. Figure 2 shows the selected ROIs.
Transfer entropy and connectivity analysis
The connectivity approach tries to explain the emergence of cognition through the interaction of functionally specialized brain regions [34]. In this work, an interaction exists when information is transferred, using the information definition given by Shannon, that is, the amount of uncertainty contained in the outcome of a random process. Although different measures to quantify the brain connectivity have been proposed [35–37], TE was selected because does not require the specification of the type of interaction, capturing linear and non-linear interactions, and has been used in different studies with EEG data [38–46].
From epochs of 1.5 s, segments of 1.3 s, discarding the 0.2 s of baseline in the case of ENC trials, were used. Before the connectivity analysis, the stationarity of the data was verified using the Augmented Dicker Fuller test implemented in Matlab (MATLAB and Econometrics Toolbox Release 2012a, The MathWorks, Inc., Natick, Massachusetts, USA). For the estimation of the TE, the TRENTOOL toolbox was used [47] following the methodology proposed for optimal estimation [48]. Given that spurious connections could exist due to indirect interactions, a correction based in graph theory was used [49]. The estimator of TE used is defined as [39]:
Statistical analysis
To perform comparisons, the t-test for paired observations was used, where the null distribution was obtained by permutations (10.000 permutations) using the routine developed by Glerean et al. [51]. When multiple comparisons were needed, the p-values were corrected using the False Discovery Rate (FDR) through the Benjamini and Hochberg linear-step up procedure (MATLAB and Bioinformatic Toolbox Release 2012a, The MathWorks, Inc., Natick, Massachusetts, USA). To avoid possible confounding effects caused by differences in age between groups, the age of the subjects was regressed out of the connectivity values. Additionally, the effect size was computed in different comparisons through the Matlab toolbox provided by Hentschke andStüttgen [52].
The connectivity approach, based on a directed measure, allows the quantification of the incoming and outgoing TE for each ROI. Initially, a broad connectivity analysis was performed to evaluate differences in average connectivity between the two groups. Subsequent analyses were directed to search ROIs and connections with differences inconnectivity between the groups. Figure 3 shows some of the steps used in the methodology.
RESULTS
Behavioral results of the subsequent memory test
There were no significant differences between Control and ACr for the number of correctly encoded items (p = 0.4) or reaction time (p = 0.7). To confirm that subsequent memory effects were not influenced by response times during the encoding, we analyzed response times needed by the subject to answer: “Do you like this item?” (Fig. 1), according to the recognition performance in the test stage. This analysis revealed no differences between groups (p = 0.7).
Connectivity results
In the resting condition the average connectivity was higher for the Control group, although not statistical significant (p < 0.34; effect size: –0.15, CI (–0.94, 0.58)); however, for the memory encoding condition, the average connectivity was higher for the ACr group (p < 0.00; effect size: 1.14, CI (0.4,2.43)).
In the evaluation of each ROI, there were no statistical differences in the resting condition, although the average connectivity was higher for almost all ROI for the Control group (Fig. 4). For the encoding condition, differences were found for all the ROIs (Table 3). Additionally, correlation analysis showed that performance on the recognition test was significantly correlated with the average connectivity in the right precuneus (R = 0.53, p < 0.02) for the ACr group.
The study of the ENC condition at connection level shows stronger connectivity for the ACr subjects for almost all connections but only remain significant, after multiple comparison corrections, some connections related to the right precuneus and the right angular gyrus (Fig. 5).
Although the differences of the connectivity in the REST condition did not reach statistical significance, this could serve as baseline to compare the change in connectivity in ROIs from the REST to ENC condition. The average connectivity in theControl group decreased in the ENC condition respect to the REST condition but without statistical significant effect (p < 0.33, effect size: –0.17, CI (–0.91, 0.6)). Conversely, for the ACr group, there is an increase in connectivity from the REST to ENC condition (p < 5e-4, effect size: 1.37, CI (0.6, 2.8)).
These findings reveal that information encoding is related to an increase of connectivity for ACr subjects. A comparison between groups was done trying to find those ROIs where the change in connectivity, computed as the difference between ENC and REST, was statistically different. Statistical significant differences for all the ROIs were found. The difference was always higher for the ACr group(Table 4).
DISCUSSION
Despite identical behavioral performance during the successful of encoding visual information, young presymptomatic PSEN1 E280A mutation carriers exhibited higher connectivity values, when compared to non-carrier family members, in cerebral regions that are also hyperactive during the encoding of complex scenes for subjects with the same mutation [15].
Using EEG, different works have reported differences in PSEN1 E280A mutation carriers when compared against non-carriers. By estimating intracranial sources of evoked related potentials (ERPs) during a semantic-matching task, different topography and an increase of the ERP generator strength in the left hippocampus and parahippocampus was found in mutation carrier group with respect to the non-carriers [17]. In another study with young presymptomatic carriers, using the same memory task that we used, despite an identical behavioral performance, high density ERPs showed lower positivity in frontal regions and increased positivity in occipital regions in carriers compared to control subjects. Discriminant analysis in the 200–300 ms interval showed promising sensitivity (72.7%) and specificity (81.8%) predicting the presence of AD [18]. The quantitative EEG analysis has also shown differences for the oscillations in the beta band (12.5–19.1 Hz) and modification of spectral parameters in fronto-temporal regions for carriers [16]. Twenty-nine of the thirty subjects included in the current study participated in a previous analysis where differences in theta and alpha2 were found [20]. The motivation for introducing a new analysis is related to the need of finding an effective biomarker and the need to expand the knowledge about the neurophysiology ofthe AD.
We used a different approach to the previously reported, basing the main computations in freely available toolboxes: eConnectome [32] and TRENTOOL [47], and in methods that have reached a high level of maturity and have been extensively described in literature: the inverse solution methods [53], and the non-linear approaches to study connectivity [48]. Alternatives for improvement could be pursued, such as the use of the MRI of each subject instead of using a template [22] or the use of a multivariate measure for connectivity instead of a bivariate like TE. The bivariate approach is fundamental for many of the connectivity analysis done with fMRI [54], constituting one of the main sources of knowledge about the brain function, unfortunately, the use of bivariate measures, and even some multivariate measures, are related to the risk of false connections [55] and the impossibility of finding the sources of propagation [56]. Although the multivariate approach could better capture the structure of connections, assuming that all the relevant nodes in the network are known [55], the need for a different preprocessing approach, where the common average and the inverse solution are forbidden steps [57], restricts its use in the current study. Given the limitations of the bivariate approach, we avoid discussing the structure of the network, only concluding that there are differences, for all ROIs and for some specific connections, between presymptomatic carriers and non-carriers of the mutation E280A during the encoding ofinformation. The differences point to an increase of neural activity in mutation carriers and can be measured using fMRI and EEG.
The task used in the current study was also different from the task used by Quiroz et al. [15]. For the current task, differences have been reported in the PSEN1 E280A mutation carriers for encoding [19] and recognition [18] conditions. It is possible that the use of complex scenes elicit higher activity in the medial temporal lobe as has been seen in epilepsy studies [58], but given that our approach is based on connectivity, we sought differences in the interaction assuming that the brain regions involved in the encoding of complex scenes also interact during the encoding of the objects used in our experiment and even during the resting state. Our results show the presence of interaction during REST and ENC conditions and how the interaction is modulated by the task change for Control and ACr groups. From the results, it is possible to assume that tasks that have been previously reported as biomarkers for AD [59] might be analyzed under the connectivity approach [60]. At this point, is necessary to develop tasks that patients with cognitive impairment can execute, avoiding the use of tasks that might be biased by the performance of the patients.
In the current work, the analysis was restricted to the regions previously reported as hyperactivated under an encoding task [15]. The use of all gyri included in the AAL atlas is computationally expensive, even using the algorithms based in Graphical Processing Unit included in TRENTOOL, and thinking of using the connectivity approach for hypothesis testing instead of a fishing expedition should be avoided [61]. Nevertheless, our approach detected ROIs with different behavior between carriers and non-carriers of the PSEN1 E280A mutation. One of these regions, the right precuneus, which belongs to the default mode network [62] and is a highly connected brain region and key element for the possible spreading of the neurodegenerative pathology [63], is possibly the first brain region with altered activity previous to the clinical symptoms [64]. Surprisingly six of the seven ROIS are closer to the default mode network nodes reported by Shirer et al. [65], and seem to follow a contrary pattern in ACr in relation to the Control: increase its connectivity during the task execution.
The pattern of increased connectivity found might be used as a test in the early detection of AD. Our study presents additional evidence of neurophysiological changes, in the form of increased neuronal interaction that happens years before of the clinical manifestation of AD [14, 15, 19, 66] and even before the advent of measurable amyloid plaques using PET [64, 67]. Regarding the increase of connectivity that occurs during the task compared with the resting condition, with higher differences for the PSEN1 E280A mutation carriers for a similar performance of the task, we hypothesize that the increased connectivity might be part of a neuronal reserve mechanism, where existing resources in a given neuronal network are used to maintain the regular function, instead of neuronal compensation, where an alternative network is used [68]. Unfortunately, the early use of the reserve mechanism can be related to abrupt cognitive decline seen in the mutation carriers, something that has been seen in computational models [69].
We already know that the course from presymptomatic to AD is non-linear [64], and also it is possible that the increased neural activity is a part of a perpetuating cycle, which implies increases in the production of amyloid-β [70]. The current findings constitute a starting point for future use of approaches like graph theory, something that might help to understand the relationship between highly connected brain regions and the pathways observed of brain disease [71].
There are several limitations in the current study such as the limited number of participants, the uncertainty about the extent to which our current finding may be generalizable to other forms of AD, and the need of use the real anatomy of subjects instead of a template. At this point, it is also necessary to emphasize that the scope of our approach is limited in spatial resolution; our analyses are based on signals obtained from gyrus instead of voxels, a reason why our results are complementary to the previous findings using fMRI [15].
The strengths of our work are related to the use of an economic, in comparison to fMRI and PET, high temporal resolution approach in a very homogeneous population with a single-gene mutation for early-onset AD, the statistical power reached in the comparisons, and the concordance with previous findings of increased neuronal activity. Although there are differences in the methods of acquisition and analysis, the use of previously reported regions and a conservative approach, which provides results that are consistent over the different tests, increase the possibility of EEG use in the context of preclinical AD.
ACKNOWLEDGMENTS
This work was supported by Vicerrectoría de Investigación of Universidad de Antioquia (CODI), Projects “Identificación de marcadores preclínicos de la mutación E280A de la enfermedad de Alzheimer a partir de medidas de conectividad en EEG”, code PRG14-1-02, “Sistema de Entrenamiento en Neurocirugía”, code MDC-10-1-6, and by the Ministerio de Economía y Competividad, under contract DPI2014-59049R. CIBER-BBN is an initiative of the Instituto de Salud Carlos III, Spain.
Authors’ disclosures available online (http://j-alz.com/manuscript-disclosures/16-0803r1).
REFERENCES
[1] | Latypova X , Martin L ((2014) ) 2015: Which new directions for Alzheimer’s disease? Front Cell Neurosci 8: , 417. |
[2] | Alves L , Correia ASA , Miguel R , Alegria P , Bugalho P ((2012) ) Alzheimer’s disease: A clinical practice-oriented review. Front Neurol 3: , 63. |
[3] | Lopera F , Ardilla A , Martínez A , Madrigal L , Arango-Viana JC , Lemere CA , Arango-Lasprilla JC , Hincapíe L , Arcos-Burgos M , Ossa JE , Behrens IM , Norton J , Lendon C , Goate AM , Ruiz-Linares A , Rosselli M , Kosik KS ((1997) ) Clinical features of early-onset Alzheimer disease in a large kindred with an {E280A} presenilin-1 mutation. JAMA 277: , 793–799. |
[4] | Acosta-Baena N , Sepulveda-Falla D , Lopera-Gómez CM , Jaramillo-Elorza MC , Moreno S , Aguirre-Acevedo DC , Saldarriaga A , Lopera F ((2011) ) Pre-dementia clinical stages in presenilin 1 E280A familial early-onset Alzheimer’s disease: A retrospective cohort study. Lancet Neurol 10: , 213–220. |
[5] | Ardila A , Lopera F , Rosselli M , Moreno S , Madrigal L , Arango-Lasprilla JC , Arcos M , Murcia C , Arango-Viana JC , Ossa J , Goate A , Kosik KS ((2000) ) Neuropsychological profile of a large kindred with familial Alzheimer’s disease caused by the E280A single presenilin-1 mutation. Arch Clin Neuropsychol 15: , 515–528. |
[6] | Langbaum JB , Fleisher AS , Chen K , Ayutyanont N , Lopera F , Quiroz YT , Caselli RJ , Tariot PN , Reiman EM ((2013) ) Ushering in the study and treatment of preclinical Alzheimer disease. Nat Rev Neurol 9: , 371–381. |
[7] | Sperling R , Mormino E , Johnson K ((2014) ) The evolution of preclinical alzheimer’s disease: Implications for prevention trials. Neuron 84: , 608–622. |
[8] | Tsolaki A , Kazis D , Kompatsiaris I , Kosmidou V , Tsolaki M ((2014) ) Electroencephalogram and Alzheimer’s disease: Clinical and research approaches. Int J Alzheimers Dis 2014: , 349249. |
[9] | Lizio R , Vecchio F , Frisoni GB , Ferri R , Rodriguez G , Babiloni C ((2011) ) Electroencephalographic rhythms in Alzheimer’s disease. Int J Alzheimers Dis 2011: , 927573. |
[10] | van Straaten EC , Scheltens P , Gouw AA , Stam CJ ((2014) ) Eyes-closed task-free electroencephalography in clinical trials for Alzheimer’s disease: An emerging method based upon brain dynamics. Alzheimers Res Ther 6: , 86. |
[11] | Vecchio F, Babiloni C, Lizio R, De Vico Fallani F, Blinowska K, Verrienti G, Frisoni G, Rossini PM ((2013) ) Resting state cortical EEG rhythms in Alzheimer’s disease. In Supplements to Clinical Neurophysiology, Başar E, Başar-Eroĝlu C, Özerdem A, Rossini PM, Yener GG, eds. Elsevier, Netherlands, pp. 223–236. |
[12] | Quiroz YT , Stern CE , Reiman EM , Brickhouse M , Ruiz A , Sperling RA , Lopera F , Dickerson BC ((2013) ) Cortical atrophy in presymptomatic Alzheimer’s disease presenilin 1 mutation carriers. J Neurol Neurosurg Psychiatry 84: , 556–561. |
[13] | Fleisher AS , Chen K , Quiroz YT , Jakimovich LJ , Gomez MG , Langois CM , Langbaum JB , Ayutyanont N , Roontiva A , Thiyyagura P , Lee W , Mo H , Lopez L , Moreno S , Acosta-Baena N , Giraldo M , Garcia G , Reiman RA , Huentelman MJ , Kosik KS , Tariot PN , Lopera F , Reiman EM ((2012) ) Florbetapir {PET} analysis of amyloid-β deposition in the presenilin 1 {E280A} autosomal dominant Alzheimer’s disease kindred: A cross-sectional study. Lancet Neurol 11: , 1057–1065. |
[14] | Quiroz YT , Budson AE , Celone K , Ruiz A , Newmark R , Castrillón G , Lopera F , Stern CE ((2010) ) Hippocampal hyperactivation in presymptomatic familial Alzheimer’s disease. Ann Neurol 68: , 865–875. |
[15] | Quiroz YT , Willment KC , Castrillon G , Muniz M , Lopera F , Budson A , Stern CE ((2015) ) Successful scene encoding in presymptomatic early-onset Alzheimer’s disease. J Alzheimers Dis 47: , 955–964. |
[16] | Rodriguez R , Lopera F , Alvarez A , Fernandez Y , Galan L , Quiroz Y , Bobes MA ((2014) ) Spectral analysis of EEG in familial Alzheimer’s disease with E280A presenilin-1 mutation gene. Int J Alzheimers Dis 2014: , 180741. |
[17] | Bobes MA , García YF , Lopera F , Quiroz YT , Galán L , Vega M , Trujillo N , Valdes-Sosa M , Valdes-Sosa P ((2010) ) ERP generator anomalies in presymptomatic carriers of the Alzheimer’s disease E280A PS-1 mutation. Hum Brain Mapp 31: , 247–265. |
[18] | Quiroz YT , Ally BA , Celone K , McKeever J , Ruiz-Rizzo AL , Lopera F , Stern CE , Budson AE ((2011) ) Event-related potential markers of brain changes in preclinical familial Alzheimer disease. Neurology 77: , 469–475. |
[19] | Ochoa J , Sánchez F , Tobón C , Duque J , Quiroz Y , Lopera F , Hernandez M ((2015) ) Effective connectivity changes in presymptomatic Alzheimer’s disease with E280A presenilin-1 mutation gene. InVI Latin American Congress on Biomedical Engineering CLAIB 2014, Paraná, Argentina 29, 30 & 31 October 2014 SE - 130, Braidot A , Hadad A , eds. Springer International Publishing, pp. 508–511. |
[20] | Duque JE , Tobon C , Aponte C , Ochoa JF , Muñoz C , Hernández AM , Quiroz Y , Lopera F ((2014) ) Quantitative EEG analysis disease during resting and memory task in carriers and non-carriers of PS-1 E280A mutation of familial Alzheimer’s. CES Med 28: , 165–176. |
[21] | Horwitz B , Rowe JB ((2011) ) Functional biomarkers for neurodegenerative disorders based on the network paradigm. Prog Neurobiol 95: , 505–509. |
[22] | Astolfi L , Cincotti F , Mattia D , Babiloni C , Carducci F , Basilisco A , Rossini PM , Salinari S , Ding L , Ni Y , He B , Babiloni F ((2005) ) Assessing cortical functional connectivity by linear inverse estimation and directed transfer function: Simulations and application to real data. Clin Neurophysiol 116: , 920–932. |
[23] | Schoffelen J-M , Gross J ((2009) ) Source connectivity analysis with MEG and EEG. Hum Brain Mapp 30: , 1857–1865. |
[24] | Toppi J , Astolfi L , Poudel GR , Innes CRH , Babiloni F , Jones RD ((2016) ) Time-varying effective connectivity of the cortical neuroelectric activity associated with behavioural microsleeps. Neuroimage 124: , 421–432 . |
[25] | Lizier JT , Prokopenko M , Zomaya AY ((2010) ) Information modification and particle collisions in distributed computation. Chaos 20: , 37109. |
[26] | Quiroz YT , Ally BA , Celone K , McKeever J , Ruiz-Rizzo AL , Lopera F , Stern CE , Budson AE ((2011) ) Event-related potential markers of brain changes in preclinical familial Alzheimer disease. Neurology 77: , 469–475. |
[27] | Delorme A , Makeig S ((2004) ) EEGLAB: An open source toolbox for analysis of single-trial EEG dynamics including independent component analysis. J Neurosci Methods 134: , 9–21. |
[28] | Delorme A , Sejnowski T , Makeig S ((2007) ) Enhanced detection of artifacts in EEG data using higher-order statistics and independent component analysis. Neuroimage 34: , 1443–1449. |
[29] | Castellanos NP , Makarov VA ((2006) ) Recovering EEG brain signals: Artifact suppression with wavelet enhanced independent component analysis. J Neurosci Methods 158: , 300–312. |
[30] | Kraskov A , Stögbauer H , Grassberger P ((2004) ) Estimating mutual information. Phys Rev E Stat Nonlin Soft Matter Phys 69: , 066138. |
[31] | Dale AM , Sereno MI ((1993) ) Improved localization of cortical activity by combining EEG and MEG with MRI cortical surface reconstruction: A linear approach. J Cogn Neurosci 5: , 162–176. |
[32] | He B , Dai Y , Astolfi L , Babiloni F , Yuan H , Yang L ((2011) ) eConnectome: A MATLAB toolbox for mapping and imaging of brain functional connectivity. J Neurosci Methods 195: , 261–269. |
[33] | Tzourio-Mazoyer N , Landeau B , Papathanassiou D , Crivello F , Etard O , Delcroix N , Mazoyer B , Joliot M ((2002) ) Automated anatomical labeling of activations in SPM using a macroscopic anatomical parcellation of the MNI MRI single-subject brain. Neuroimage 15: , 273–289. |
[34] | Varela F , Lachaux JP , Rodriguez E , Martinerie J ((2001) ) The brainweb: Phase synchronization and large-scale integration. Nat Rev Neurosci 2: , 229–239. |
[35] | Astolfi L , Cincotti F , Mattia D , Marciani MG , Baccala LA , de Vico Fallani F , Salinari S , Ursino M , Zavaglia M , Ding L , Edgar JC , Miller GA , He B , Babiloni F ((2007) ) Comparison of different cortical connectivity estimators for high-resolution EEG recordings. Hum Brain Mapp 28: , 143–157. |
[36] | Dauwels J , Vialatte F , Musha T , Cichocki A ((2010) ) A comparative study of synchrony measures for the early diagnosis of Alzheimer’s disease based on EEG. Neuroimage 49: , 668–693. |
[37] | Dauwels J , Vialatte F , Latchoumane C , Jeong J , Cichocki A ((2009) ) EEG synchrony analysis for early diagnosis of Alzheimer’s disease: A study with several synchrony measures and EEG data sets. Conf Proc IEEE Eng Med Biol Soc 2009: , 2224–2227. |
[38] | Schreiber T ((2000) ) Measuring information transfer. Phys Rev Lett 85: , 461–464. |
[39] | Wibral M , Vicente R , Lindner M ((2014) ) Transfer entropy in neuroscience. In Directed Information Measures in Neuroscience SE - 1, Wibral M , Vicente R , Lizier JT , eds. Springer Berlin Heidelberg, pp. 3–36. |
[40] | Alonso JF , Romero S , Mañanas MÀ , Riba J ((2015) ) Serotonergic psychedelics temporarily modify information transfer in humans. Int J Neuropsychopharmacol 18: , pyv039. |
[41] | Roux F , Wibral M , Singer W , Aru J , Uhlhaas PJ ((2013) ) The phase of thalamic alpha activity modulates corticalgamma-band activity: Evidence from resting-state MEG recordings. J Neurosci 33: , 17827–17835. |
[42] | Bashivan P , Yeasin M , Bidelman GM ((2014) ) Modulation of brain connectivity by memory load in a working memory network. In 2014 IEEE Symposium on Computational Intelligence, Cognitive Algorithms, Mind, and Brain (CCMB), Pervlovsky L, Fontanari J, eds. IEEE, Orlando, pp. 127–133. |
[43] | Khadem A , Hossein-Zadeh G-A , Khorrami A ((2016) ) Long-range reduced predictive information transfers of autistic youths in EEG sensor-space during face processing. Brain Topogr 29: , 283–295. |
[44] | Huang C-S , Pal NR , Chuang C-H , Lin C-T ((2015) ) Identifying changes in EEG information transfer during drowsy driving by transfer entropy. Front Hum Neurosci 9: , 570. |
[45] | McBride J , Zhao X , Munro N , Jicha G , Smith C , Jiang Y ((2015) ) Discrimination of mild cognitive impairment and Alzheimer’s disease using transfer entropy measures of scalp EEG. J Healthc Eng 6: , 55–70. |
[46] | Dauwan M , van Dellen E , van Boxtel L , van Straaten ECW , de Waal H , Lemstra AW , Gouw AA , van der Flier WM , Scheltens P , Sommer IE , Stam CJ ((2016) ) EEG-directed connectivity from posterior brain regions is decreased in dementia with Lewy bodies: A comparison with Alzheimer’s disease and controls. Neurobiol Aging 41: , 122–129. |
[47] | Lindner M , Vicente R , Priesemann V , Wibral M ((2011) ) TRENTOOL: A Matlab open source toolbox to analyse information flow in time series data with transfer entropy. BMC Neurosci 12: , 119. |
[48] | Vicente R , Wibral M , Lindner M , Pipa G ((2011) ) Transfer entropy–a model-free measure of effective connectivity for the neurosciences. J Comput Neurosci 30: , 45–67. |
[49] | Wollstadt P , Meyer U , Wibral M ((2015) ) A graph algorithmic approach to separate direct from indirect neural interactions. PLoS One 10: , e0140530. |
[50] | Ragwitz M , Kantz H ((2002) ) Markov models from data by simple nonlinear time series predictors in delay embedding spaces. Phys Rev E Stat Nonlin Soft Matter Phys 65: , 56201. |
[51] | Glerean E , Pan RK , Salmi J , Kujala R , Lahnakoski JM , Roine U , Nummenmaa L , Leppämäki S , Nieminen-von Wendt T , Tani P , Saramäki J , Sams M , Jääskeläinen IP ((2016) ) Reorganization of functionally connected brain subnetworks in high-functioning autism. Hum Brain Mapp 37: , 1066–1079. |
[52] | Hentschke H , Stüttgen MC ((2011) ) Computation of measures of effect size for neuroscience data sets. Eur J Neurosci 34: , 1887–1894. |
[53] | Jatoi MA , Kamel N , Malik AS , Faye I , Begum T ((2014) ) A survey of methods used for source localization using EEG signals. Biomed Signal Process Control 11: , 42–52. |
[54] | Van Dijk KRA , Hedden T , Venkataraman A , Evans KC , Lazar SW , Buckner RL ((2010) ) Intrinsic functional connectivity as a tool for human connectomics: Theory, properties, and optimization. J Neurophysiol 103: , 297–321. |
[55] | Kuś R , Kamiński M , Blinowska KJ ((2004) ) Determination of EEG activity propagation: Pair-wise versus multichannel estimate. IEEE Trans Biomed Eng 51: , 1501–1510. |
[56] | Blinowska KJ ((2011) ) Review of the methods of determination of directed connectivity from multichannel data. Med Biol Eng Comput 49: , 521–529. |
[57] | Kaminski M , Blinowska KJ ((2014) ) Directed transfer function is not influenced by volume conduction-inexpedient pre-processing should be avoided. Front Comput Neurosci 8: , 61. |
[58] | Simó M , Ripollés P , Fuentemilla L , Vaquero L , Bruna J , Rodríguez-Fornells A ((2015) ) Studying memory encoding to promote reliable engagement of the medial temporal lobe at the single-subject level. PLoS One 10: , e0119159. |
[59] | Della Sala S , Parra MA , Fabi K , Luzzi S , Abrahams S ((2012) ) Short-term memory binding is impaired in AD but not in non-AD dementias. Neuropsychologia 50: , 833–840. |
[60] | Ibanez A , Parra MA ((2014) ) Mapping memory binding onto the connectome’s temporal dynamics: Toward a combined biomarker for Alzheimer’s disease. Front Hum Neurosci 8: , 237. |
[61] | De Vico Fallani F , Richiardi J , Chavez M , Achard S ((2014) ) Graph analysis of functional brain networks: Practical issues in translational neuroscience. Philos Trans R Soc Lond B Biol Sci 369: , pii: 20130521. |
[62] | Buckner RL , Andrews-Hanna JR , Schacter DL ((2008) ) The brain’s default network: Anatomy, function, and relevance to disease. Ann N Y Acad Sci 1124: , 1–38. |
[63] | Nath S , Agholme L , Kurudenkandy FR , Granseth B , Marcusson J , Hallbeck M ((2012) ) Spreading of neurodegenerative pathology via neuron-to-neuron transmission of β-amyloid. J Neurosci 32: , 8767–8777. |
[64] | Jones DT , Knopman DS , Gunter JL , Graff-Radford J , Vemuri P , Boeve BF , Petersen RC , Weiner MW , Jack CR ((2016) ) Cascading network failure across the Alzheimer’s disease spectrum. Brain 139: (Pt 2), 547–562. |
[65] | Shirer WR , Ryali S , Rykhlevskaia E , Menon V , Greicius MD ((2012) ) Decoding subject-driven cognitive states with whole-brain connectivity patterns. Cereb Cortex 22: , 158–165. |
[66] | Mondadori CRA , Buchmann A , Mustovic H , Schmidt CF , Boesiger P , Nitsch RM , Hock C , Streffer J , Henke K ((2006) ) Enhanced brain activity may precede the diagnosis of Alzheimer’s disease by 30 years. Brain 129: , 2908–2922. |
[67] | Reiman EM , Quiroz YT , Fleisher AS , Chen K , Velez-Pardo C , Jimenez-Del-Rio M , Fagan AM , Shah AR , Alvarez S , Arbelaez A , Giraldo M , Acosta-Baena N , Sperling RA , Dickerson B , Stern CE , Tirado V , Munoz C , Reiman RA , Huentelman MJ , Alexander GE , Langbaum JBS , Kosik KS , Tariot PN , Lopera F ((2012) ) Brain imaging and fluid biomarker analysis in young adults at genetic risk for autosomal dominant Alzheimer’s disease in the presenilin 1 E280A kindred: A case-control study. Lancet Neurol 11: , 1048–1056. |
[68] | Steffener J , Stern Y ((2012) ) Exploring the neural basis of cognitive reserve in aging. Biochim Biophys Acta 1822: , 467–473. |
[69] | Savioz A , Leuba G , Vallet PG , Walzer C ((2009) ) Contribution of neural networks to Alzheimer disease’s progression. Brain Res Bull 80: , 309–314. |
[70] | Sperling R , Mormino E , Johnson K ((2014) ) The evolution of preclinical Alzheimer’s disease: Implications for prevention trials. Neuron 84: , 608–622. |
[71] | Stam CJ ((2014) ) Modern network science of neurological disorders. Nat Rev Neurosci 15: , 683–695. |
Figures and Tables
Fig.1
Sequence of stimulus used during the encoding paradigm. During “fixation” the participant look at the cross in the screen and during the “stimulus target” the subject tries to memorize the object.
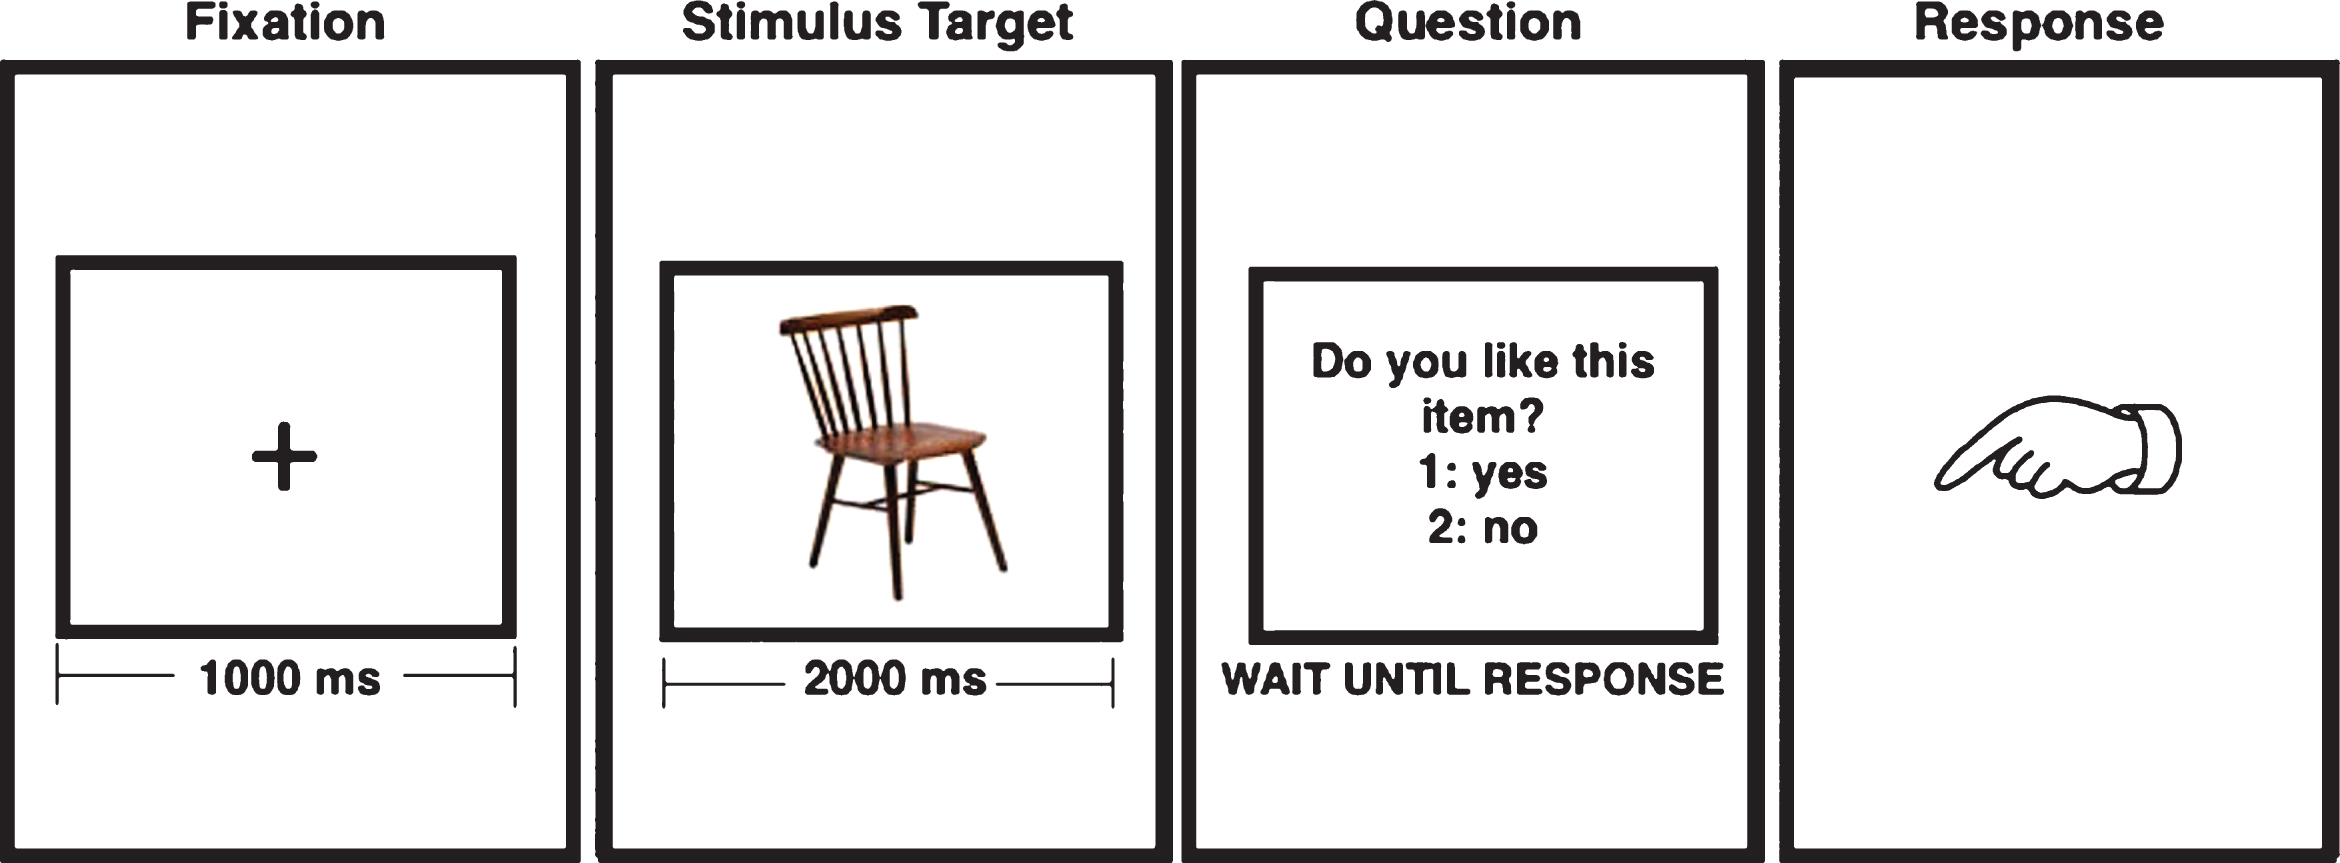
Fig.2
ROIs selected for analysis. The signals for each voxel inside colored regions are averaged to obtain the signal used for the transfer entropy analysis.
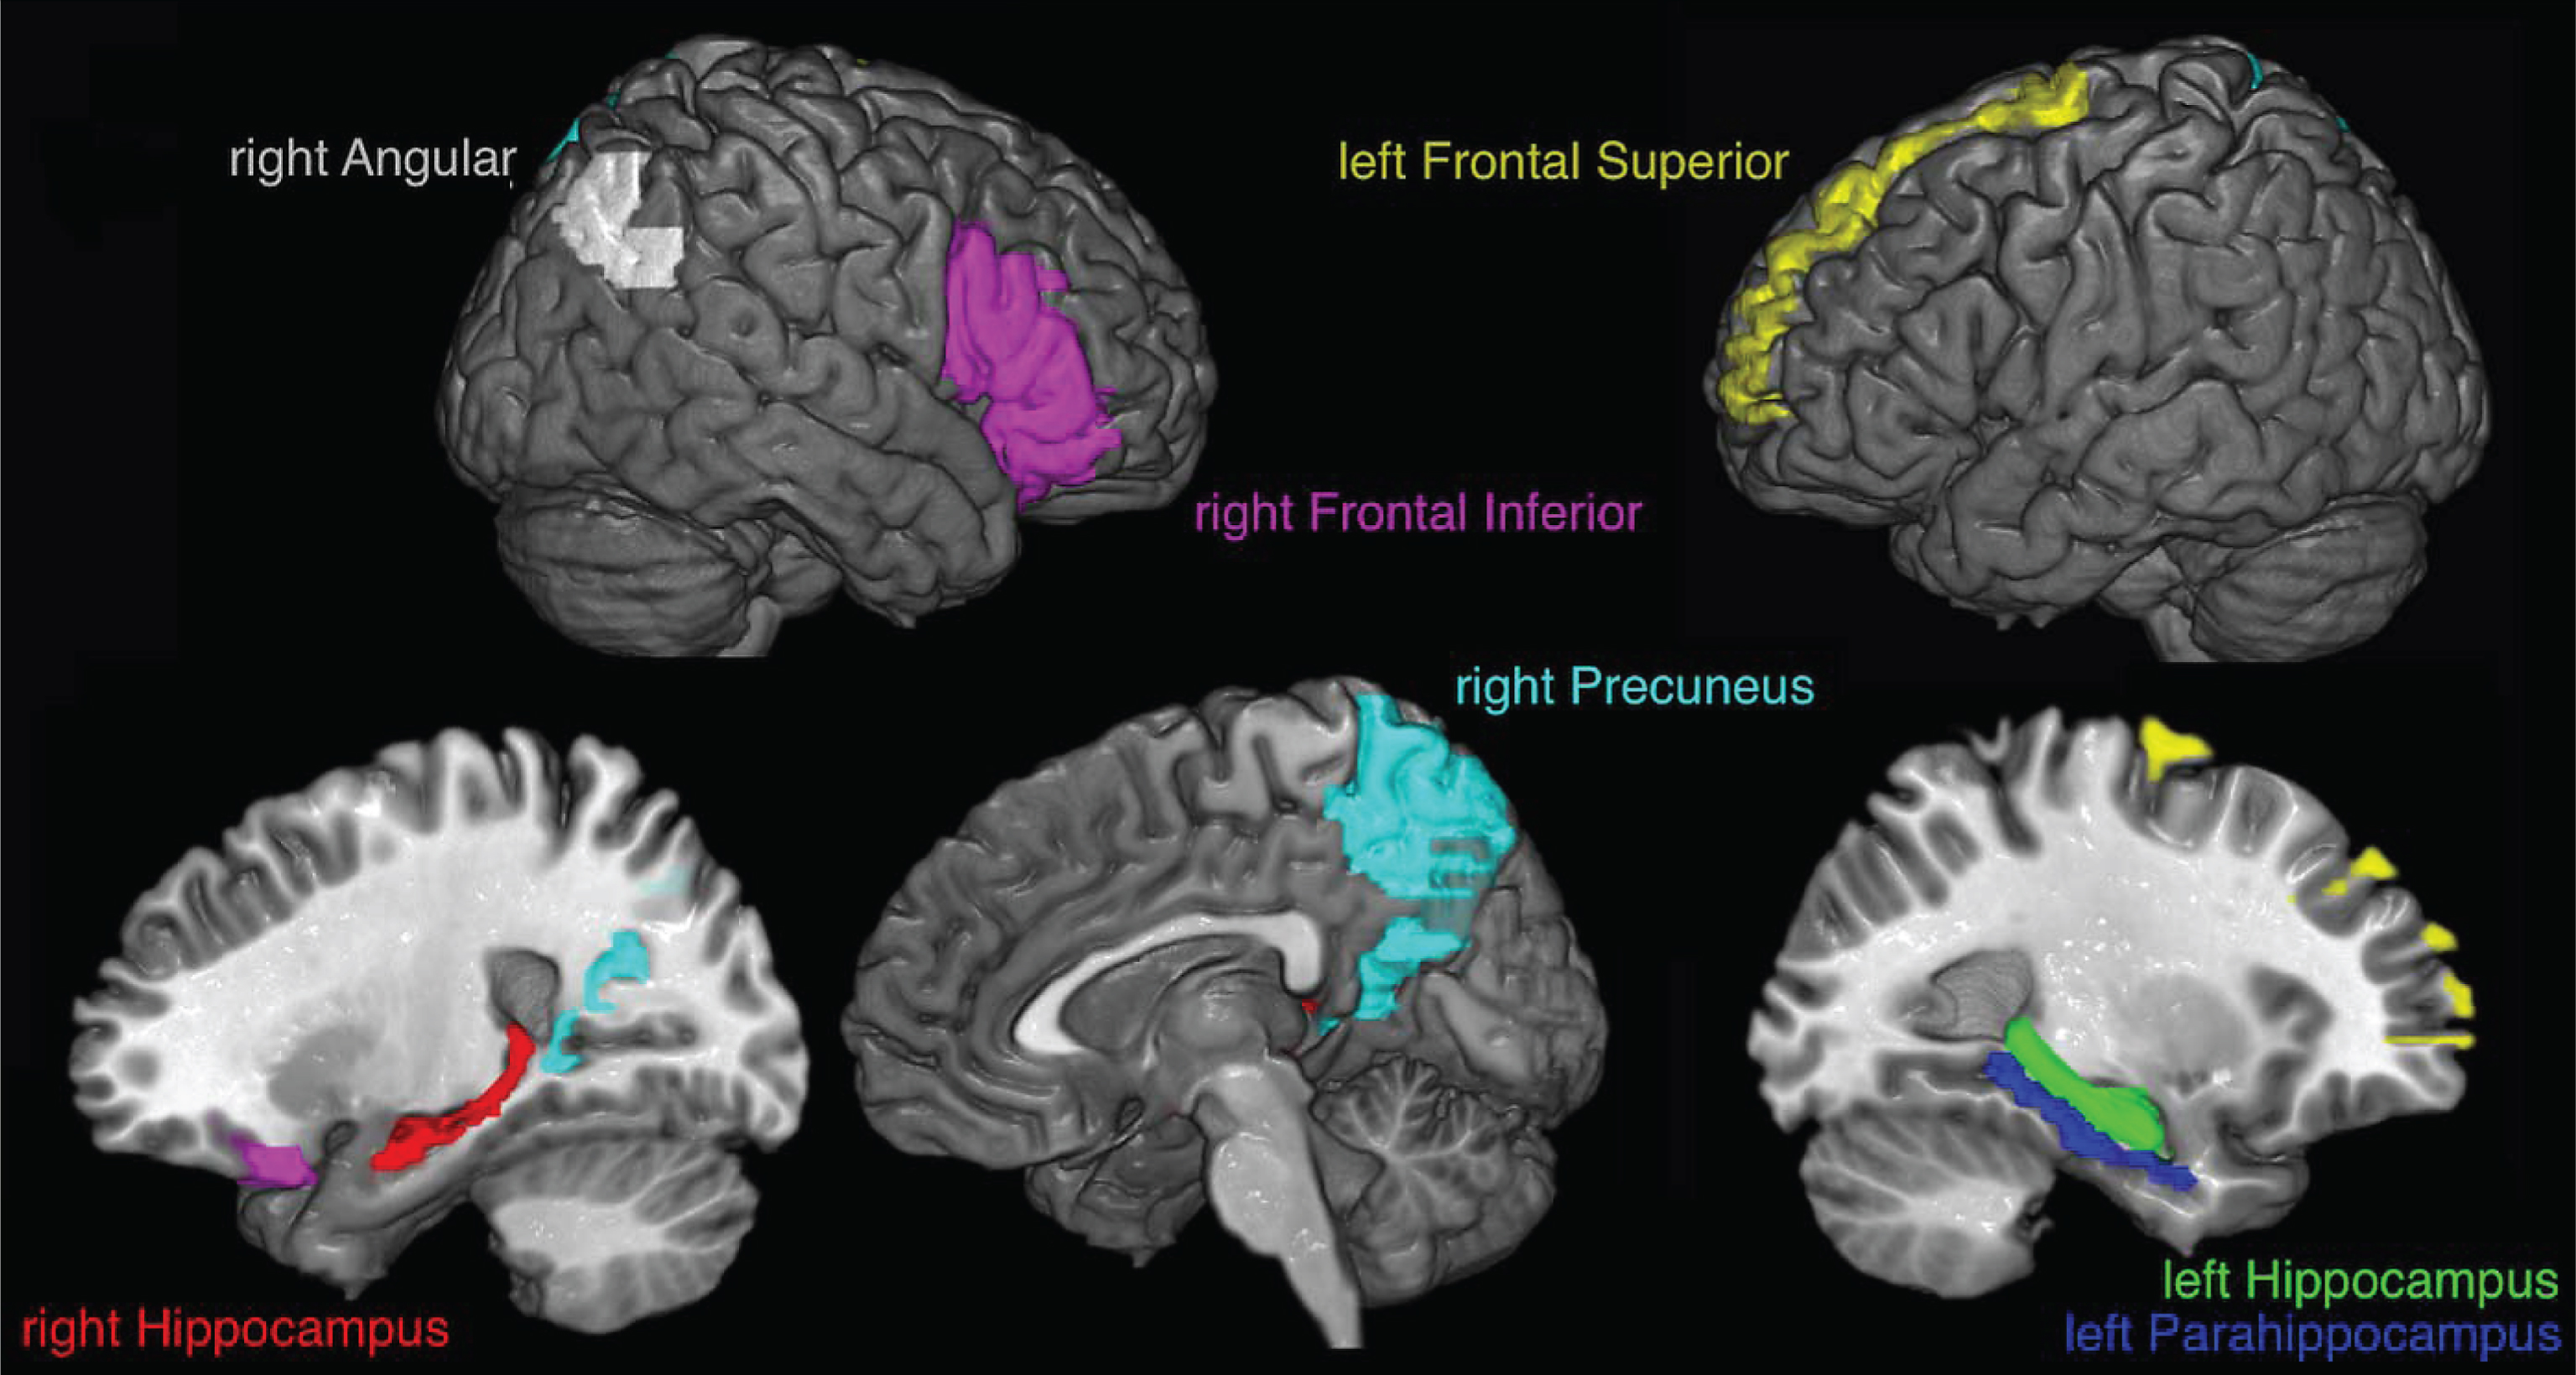
Fig.3
Steps followed for connectivity analysis: The scalp EEG (a) is converted to cortical current density (b). The signal for transfer entropy (TE) analysis is obtained as the average of the voxels contained in each ROI (c) and an Adjacency matrix is built, shown in colors where a warmer color indicates higher TE, and contains all the relevant connections. From the adjacency matrix the connectivity indices are obtained as sums over the rows or columns or both.
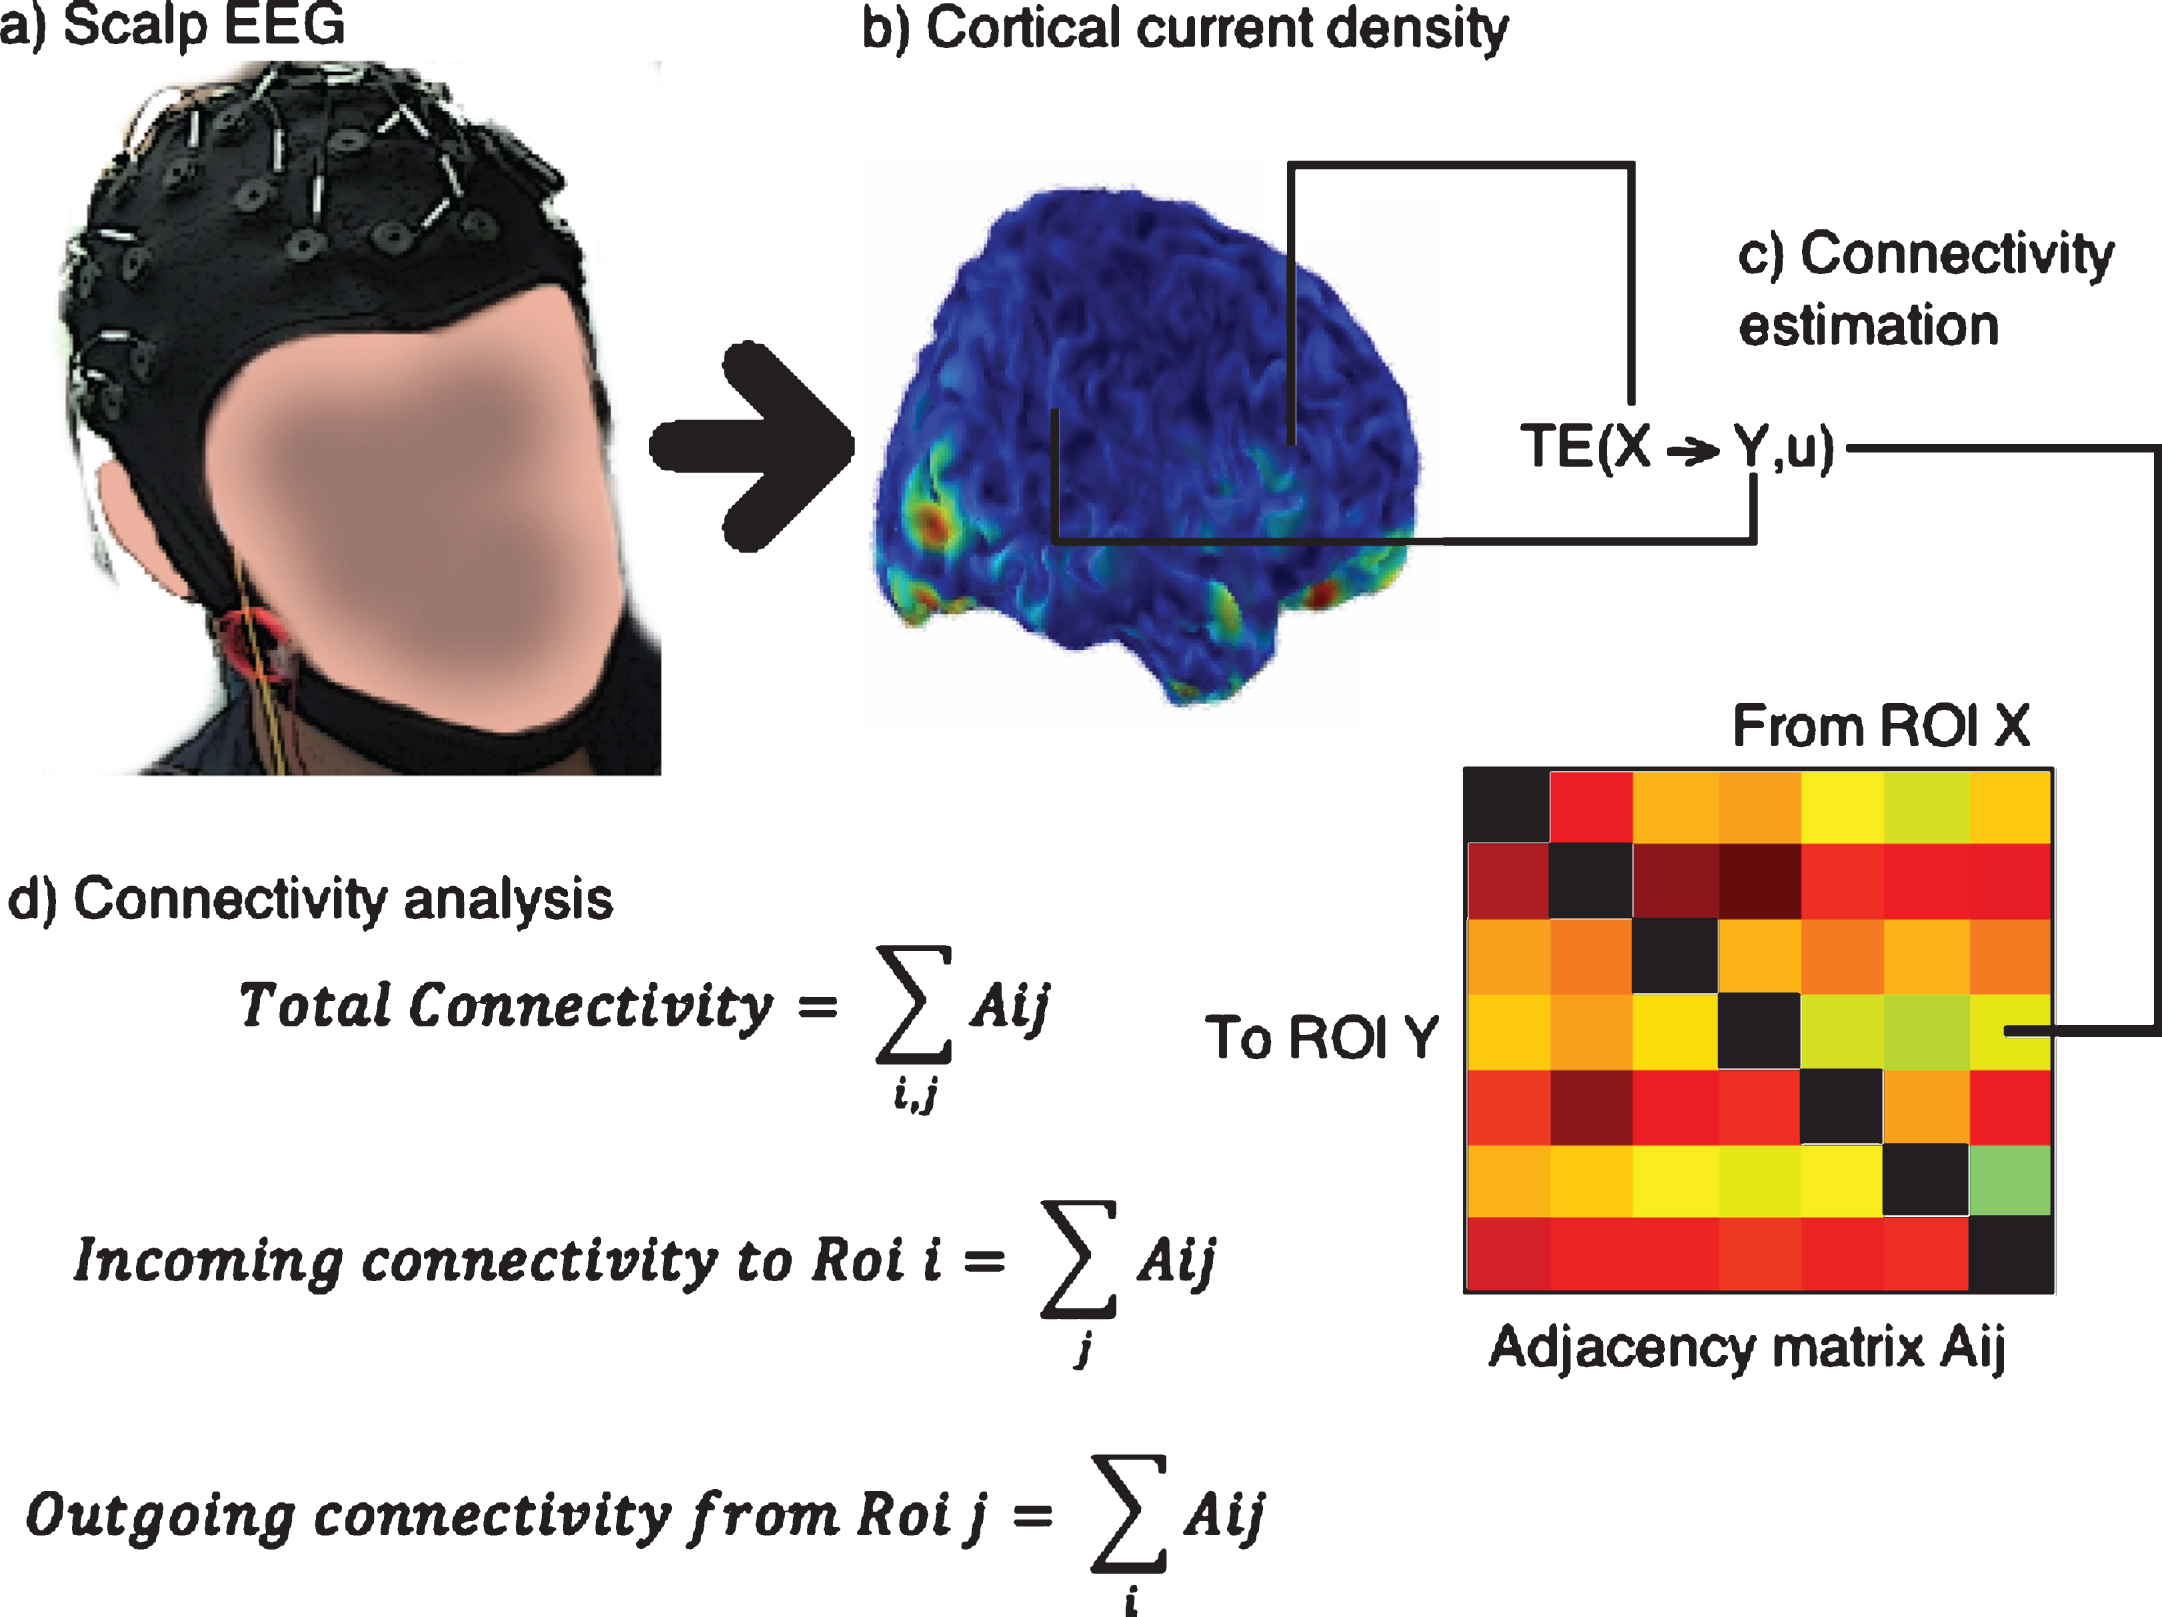
Fig.4
Differences in the REST condition for each ROI. Right Angular: r_ang, left Frontal Superior: l_front_sup, right Frontal Inferior: r_front_inf, left Parahippocampus: l_parahipp, left Hippocampus: l_hipp, right Hippocampus: r_hipp. The mean connectivity for each ROI is higher for Control although none of the comparison is statistical significant.
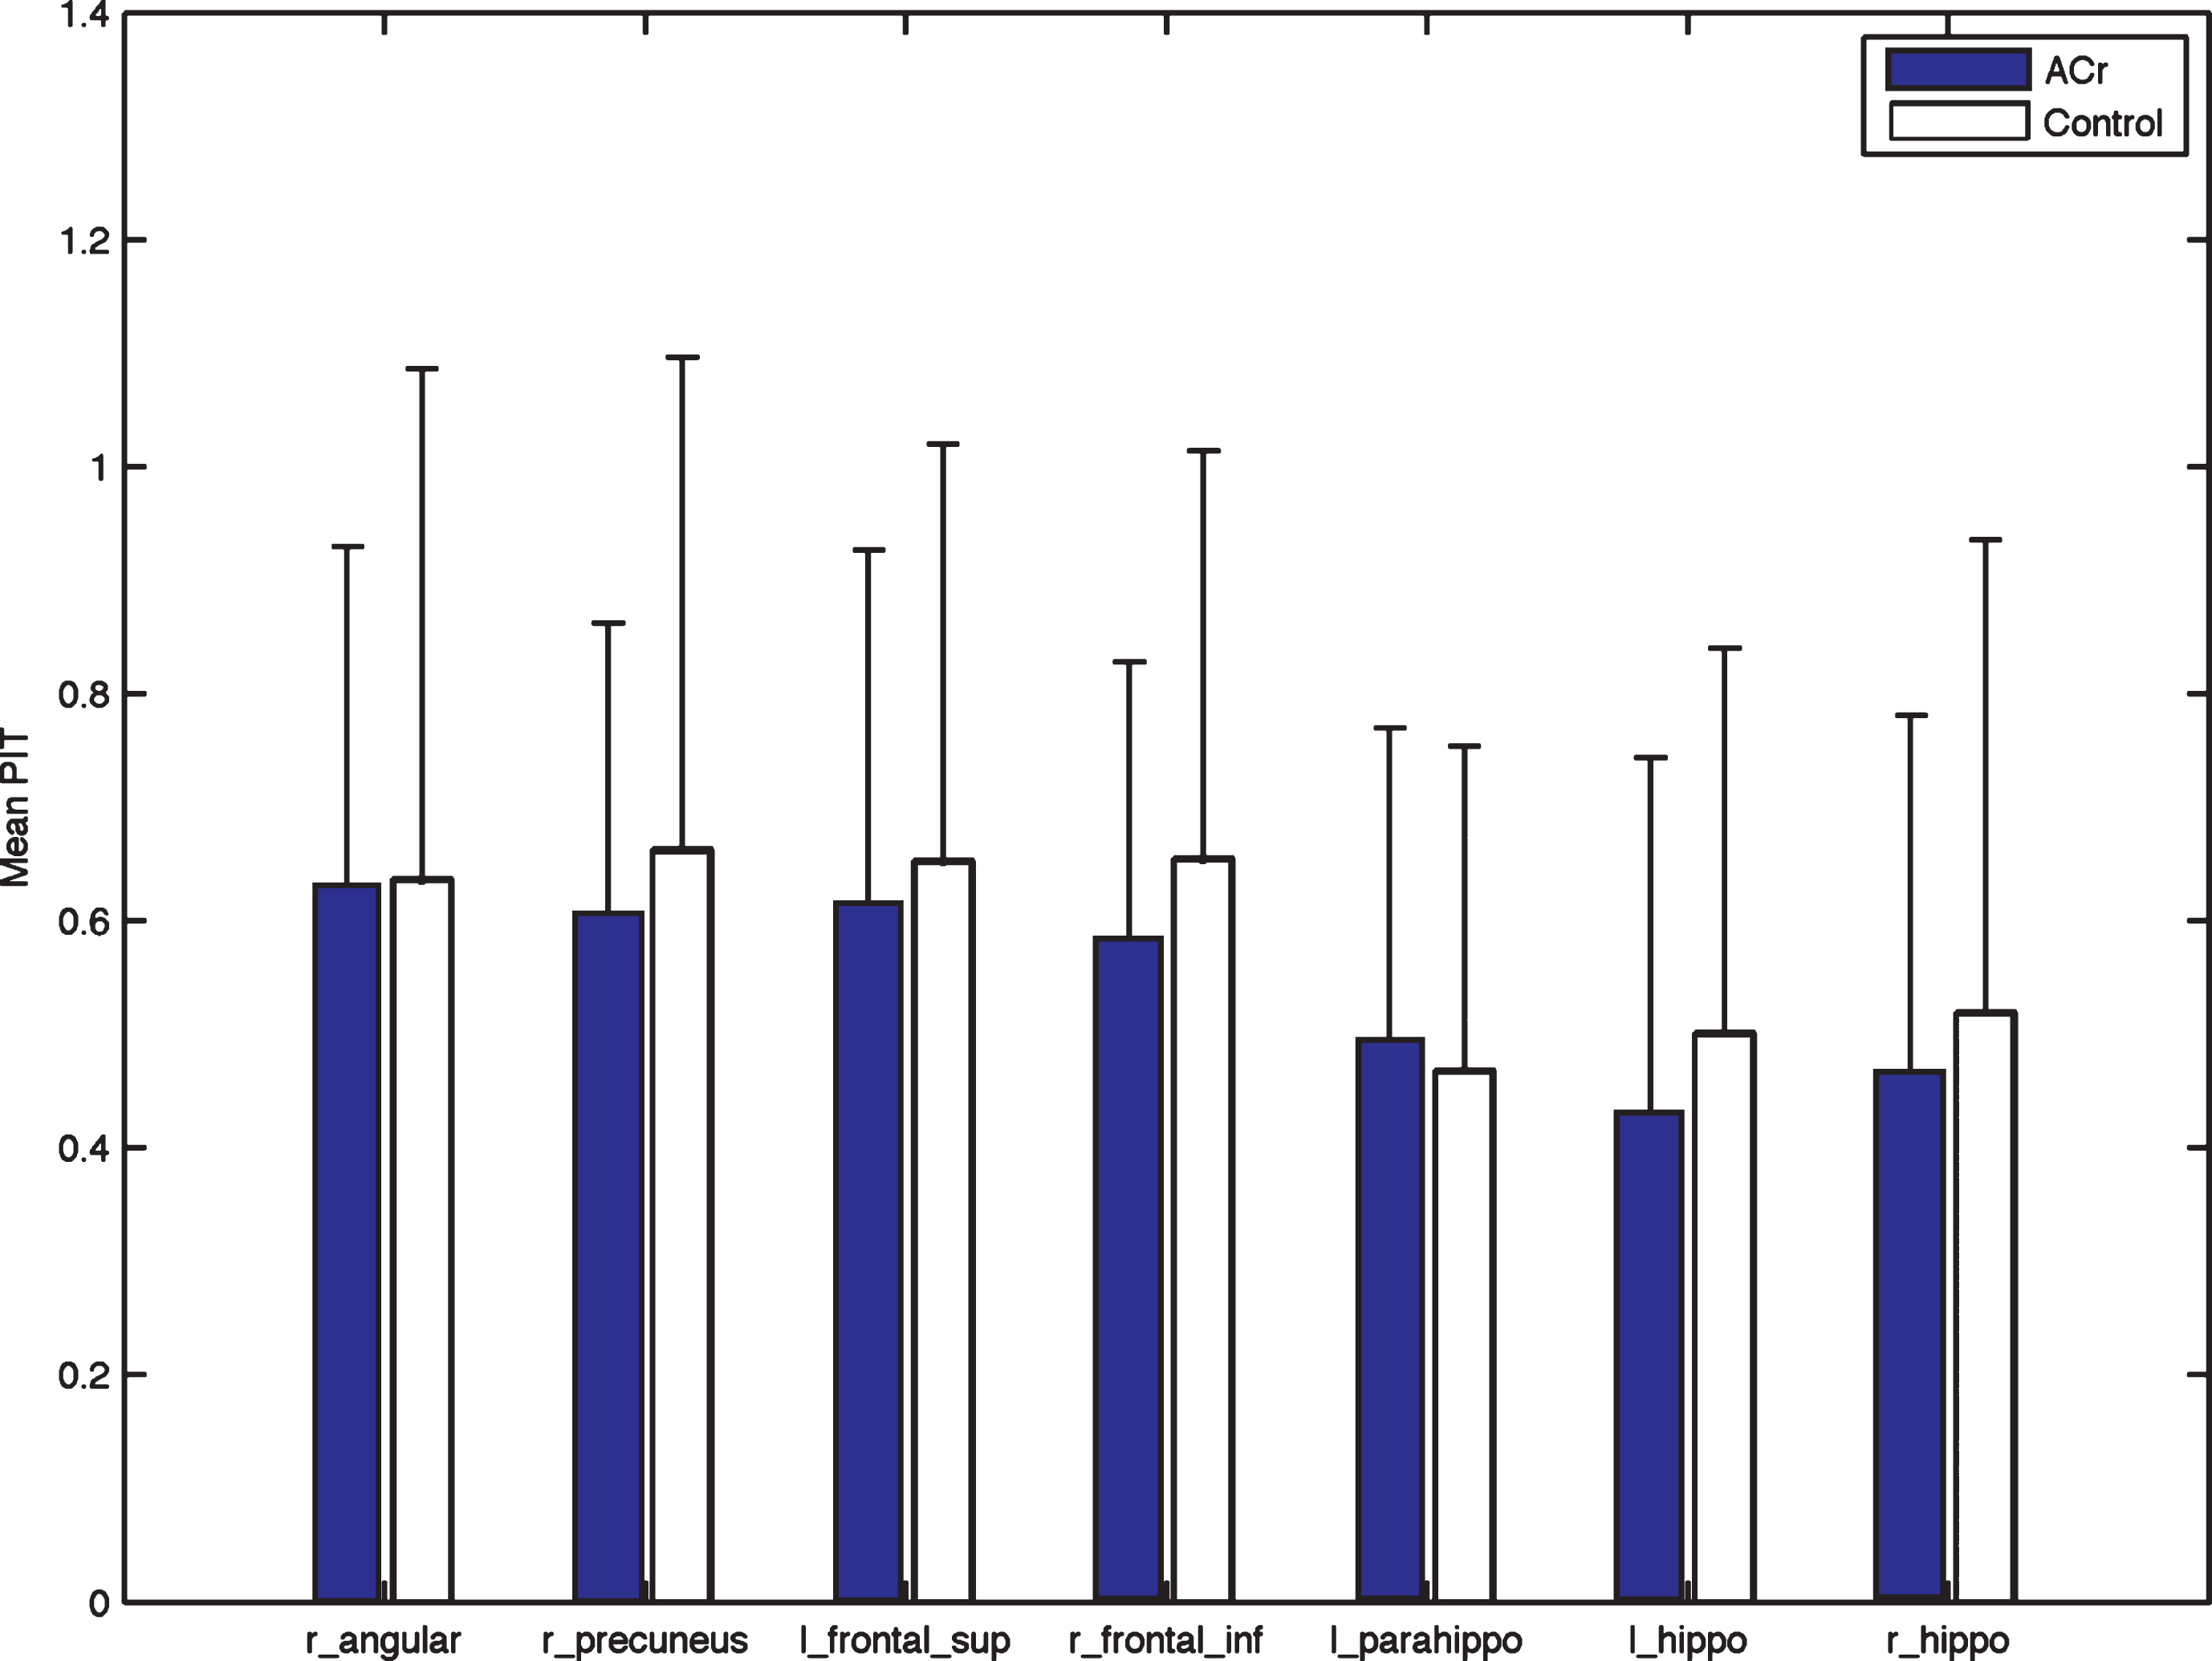
Fig.5
Connections with increased values for the ACr group during the ENC condition.
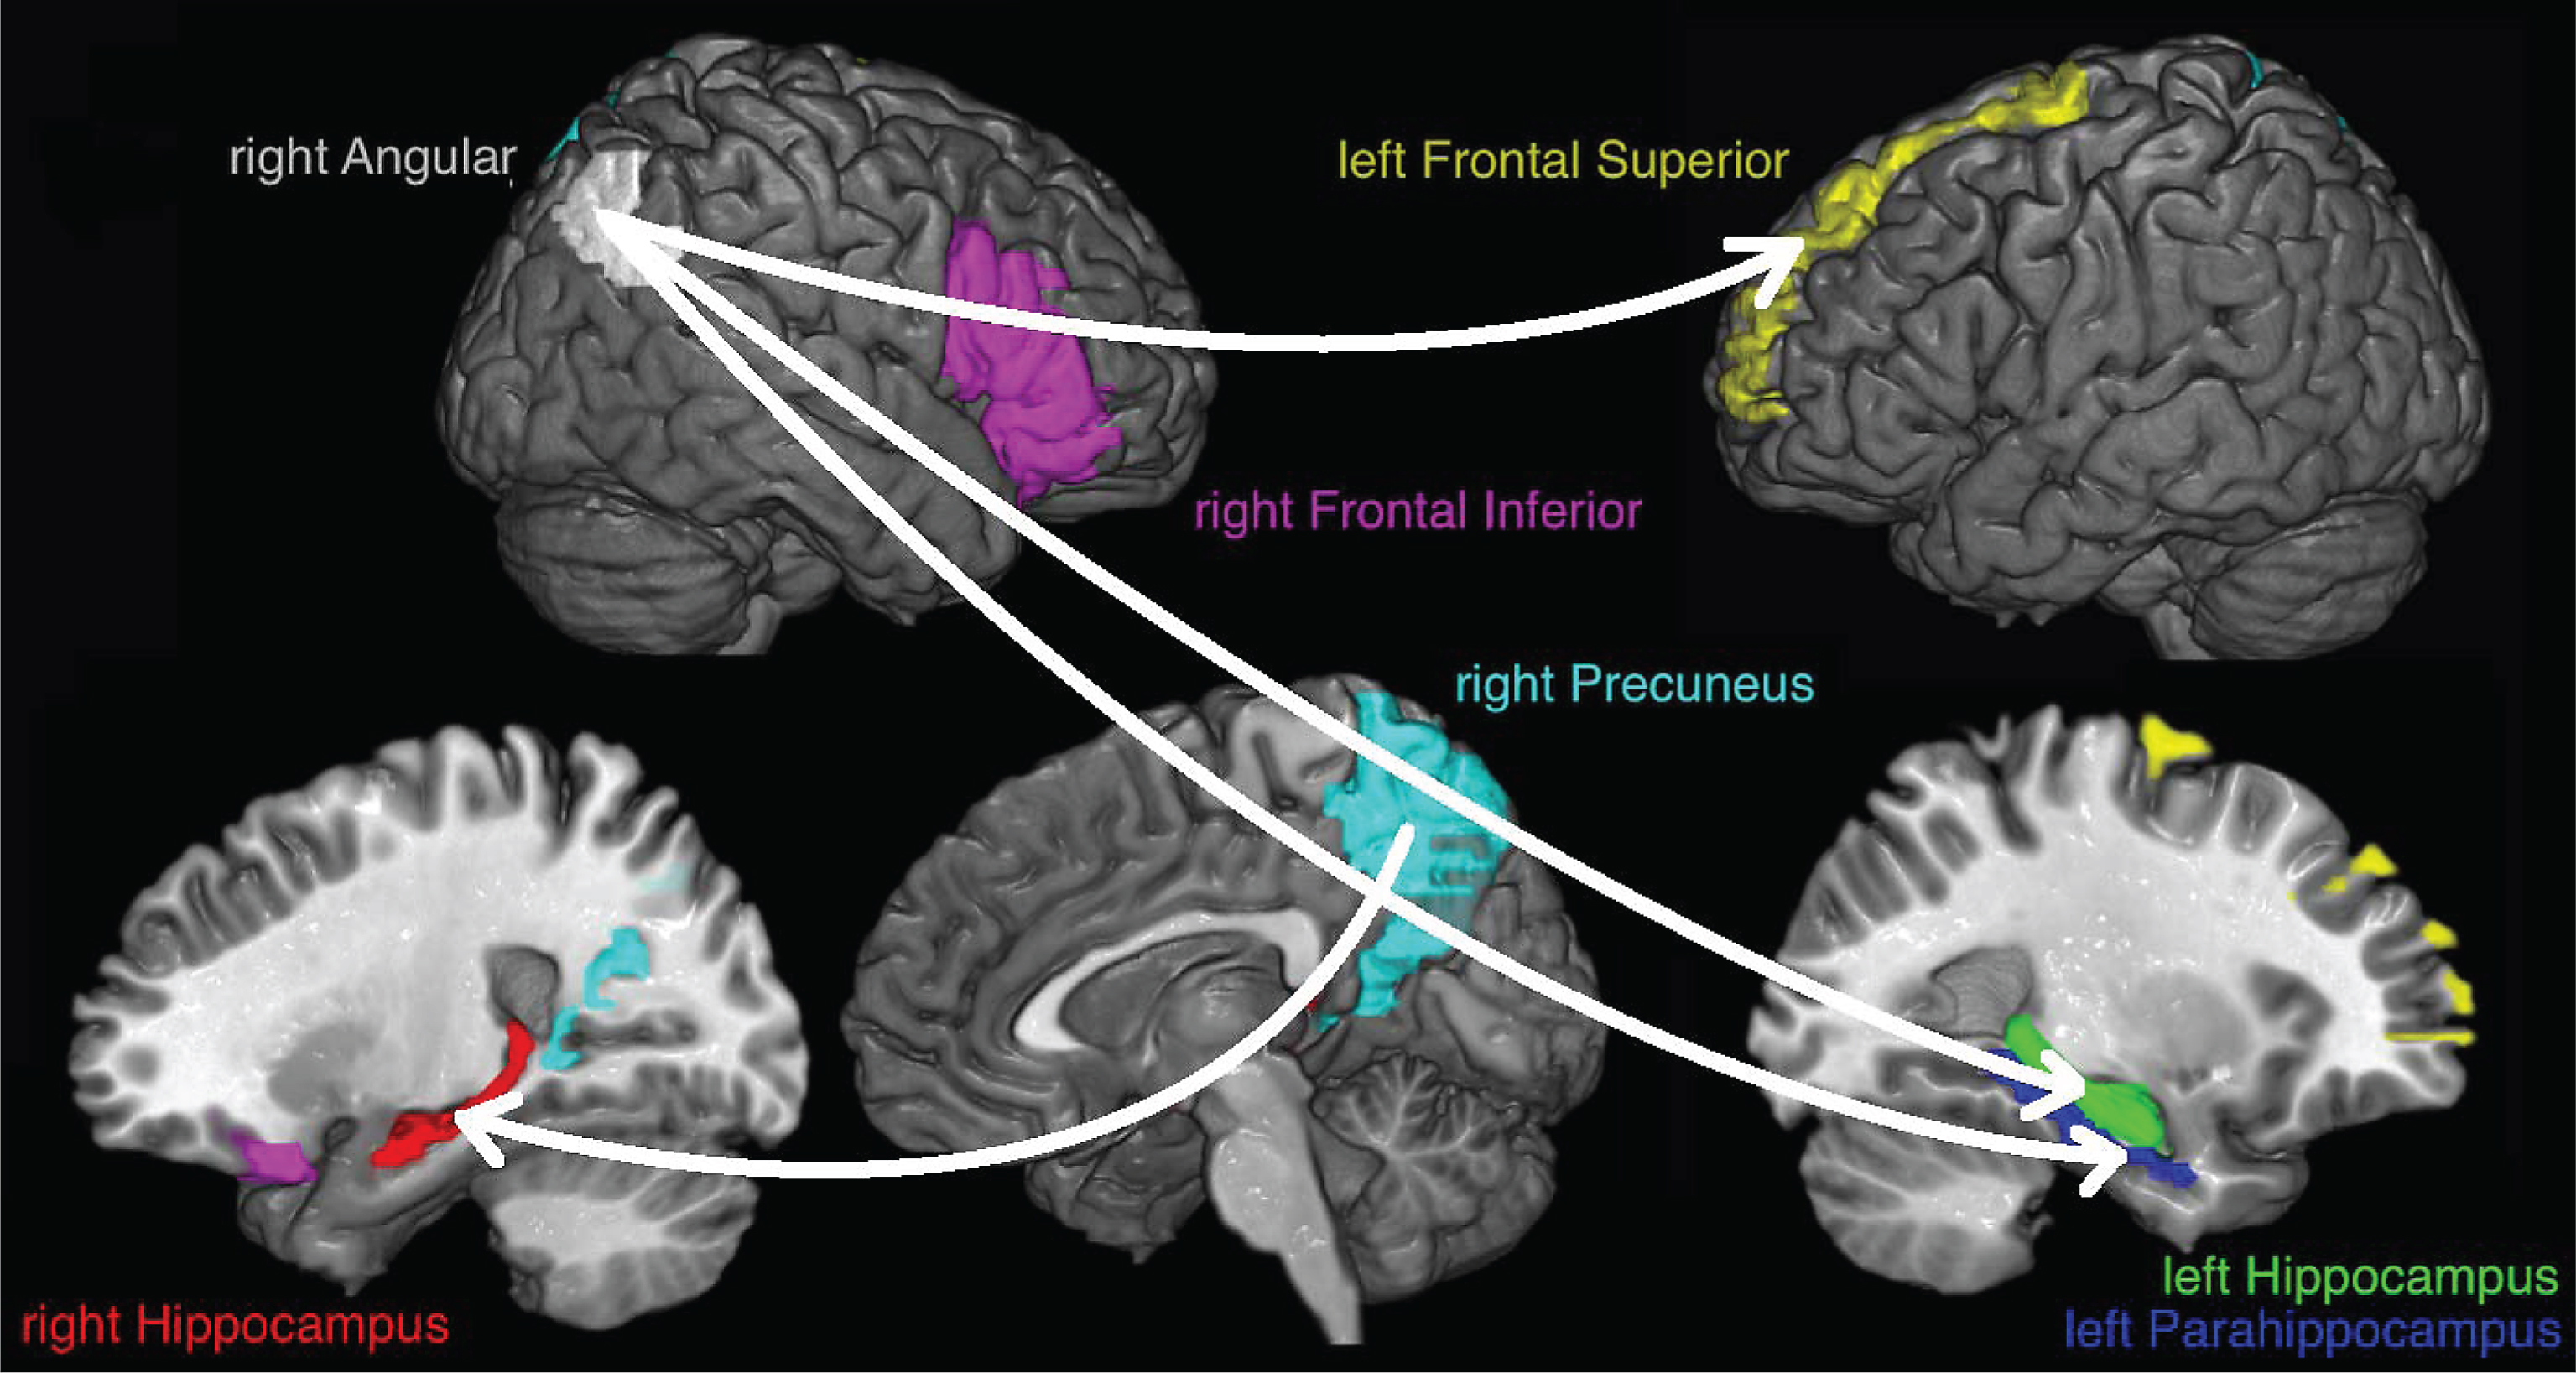
Table 1
Demographic and Mini-Mental State Examination (MMSE) of participants
| ACr Mean (±SD) | Control Mean (±SD) | T-Test | |
| 15 | 15 | ||
| Age (years) | 28 (±4.1) | 31.5 (±5.8) | T = –1.93 df = 28 p = 0.06 |
| Gender (F/M) | 9/6 | 9/6 | – |
| Education (years) | 12.1 (±3.3) | 11.2 (±3.4) | T = 0.75 df = 28 p = 0.46 |
| MMSE/30 | 29.7 (±0.6) | 29.5 (±0.9) | T = 0.22 df = 28 p = 0.83 |
Values denote mean (±Standard deviation). ACr, asymptomatic mutation carriers.
Table 2
Parameters used for Transfer Entropy analysis. The parameters are given like are used in TRENTOOL software
| Range of delays (u) | Delay (u) | Autocorrelation | Minimum acceptable | Range of embedding | Range of embedding | Samples to |
| evaluated | step size | time (ACT) | number of trials | dimension (d) evaluated | delays (τ) | predict |
| 1–20 | 1 | 40 | 45 | 2:5 | 0.2–1.5 | 100 |
Table 3
Differences in connectivity between groups for the encoding condition. For all nodes the ACr subjects have higher connectivity
| ROI | pval | Size | Confidence |
| (FDR corrected) | effect | interval | |
| r_angular | 0.01 | 1.05 | (0.33, 2.25) |
| r_precuneus | 0.01 | 1.22 | (0.56, 2.20) |
| l_frontal_sup | 0.01 | 0.95 | (0.27, 1.99) |
| r_frontal_inf | 0.01 | 0.88 | (0.18, 1.96) |
| l_parahippo | 0.01 | 1.17 | (0.43, 2.30) |
| l_hippo | 0.02 | 0.9 | (0.21, 1.8) |
| r_hippo | 0.01 | 1.01 | (0.35, 2.05) |
Table 4
Difference between groups comparing the difference of connectivity of the ROIs in the Encoding condition against the Resting condition (ENC – REST)
| ROI | pval (FDR corrected) | Size effect | Confidence interval |
| r_angular | 0.01 | 0.93 | (0.29, 1.73) |
| r_precuneus | 0.01 | 1.02 | (0.34, 1.99) |
| l_frontal_sup | 0.01 | 0.93 | (0.25, 1.91) |
| r_frontal_inf | 0.01 | 1 | (0.3, 2.05) |
| l_parahippo | 0.02 | 0.78 | (0.09, 1.84) |
| l_hippo | 0.01 | 1.04 | (0.28, 2.37) |
| r_hippo | 0.00 | 1.55 | (0.76, 3.15) |


