
Sample Size Estimation for Alzheimer’s Disease Trials from Japanese ADNI Serial Magnetic Resonance Imaging
Abstract
Background: Little is known about the sample sizes required for clinical trials of Alzheimer’s disease (AD)-modifying treatments using atrophy measures from serial brain magnetic resonance imaging (MRI) in the Japanese population.
Objective: The primary objective of the present study was to estimate how large a sample size would be needed for future clinical trials for AD-modifying treatments in Japan using atrophy measures of the brain as a surrogate biomarker.
Methods: Sample sizes were estimated from the rates of change of the whole brain and hippocampus by the k-means normalized boundary shift integral (KN-BSI) and cognitive measures using the data of 537 Japanese Alzheimer’s Neuroimaging Initiative (J-ADNI) participants with a linear mixed-effects model. We also examined the potential use of ApoE status as a trial enrichment strategy.
Results: The hippocampal atrophy rate required smaller sample sizes than cognitive measures of AD and mild cognitive impairment (MCI). Inclusion of ApoE status reduced sample sizes for AD and MCI patients in the atrophy measures.
Conclusion: These results show the potential use of longitudinal hippocampal atrophy measurement using automated image analysis as a progression biomarker and ApoE status as a trial enrichment strategy in a clinical trial of AD-modifying treatment in Japanese people.
INTRODUCTION
Alzheimer’s disease (AD), the most common type of dementia in elderly individuals, slowly and progressively diminishes cognitive function, impairs activities of daily living, and imposes physical, mental, and economic burdens on patients and their caregivers [1]. The pathophysiological process in AD begins years before the onset of cognitive symptoms [2]. Patients in the predementia phase of AD, called mild cognitive impairment (MCI) due to AD, are converted to AD dementia at a rate of 16.1% over 1 year [3] and 36.3% over 2 years [4] according to studies by the Alzheimer’s Disease Neuroimaging Initiative (ADNI). According to a systematic review by Ward et al. [5], conversion rates from MCI or amnestic MCI to AD dementia over 5 or more years were greater than 33% in most clinic-based and community-based studies [6–9]. Although disease-modifying treatments for AD dementia or MCI due to AD— therapeutic agents that can inhibit progression of the disease by acting on the pathophysiological process and delaying neurodegeneration or neuronal loss— remain to be approved, vigorous development of novel disease-modifying treatments and their clinical trials are ongoing.
Clinical trials of AD-modifying treatments require longer periods of time and larger sample sizes than those of symptomatic drugs (e.g., acetylcholinesterase inhibitors or N-methyl-D-aspartate receptor antagonists) [10]. To reduce the duration of clinical trials and sample sizes required, it is essential to establish a valid biomarker suitable for tracking disease progression that has higher precision and lower variance than the current gold-standard outcome measures based on neuropsychological examinations such as the Clinical Dementia Rating Scale Sum of Boxes (CDR-SB) [11] or Alzheimer’s Disease Assessment Scale-Cognitive Subscale (ADAS-Cog) [12, 13]. Furthermore, the biomarker should have high sensitivity for disease progression, high biological plausibility, and a strong relationship with the clinical features of AD [14].
Quantitative brain atrophy measurement over months or years calculated from serial magnetic resonance imaging (MRI) scans is one of the most promising progression biomarkers being explored. This biomarker could enable physicians to track disease progression and the therapeutic effects of disease-modifying treatments. Such approaches are a potential alternative to conventional neuropsychological measures and have shown greater statistical power to detect longitudinal changes than neuropsychological measures in ADNI studies [15–21]. Such a surrogate biomarker may play a key role in clinical trials and accelerate the development of novel drugs, as noted by Cummings et al. [22].
Among patients with AD and MCI, several studies showed greater atrophic rates of change in the hippocampus and temporal lobe of carriers of theapolipoprotein E gene allele ɛ4 (ApoE ɛ4)— the strongest risk factor for AD [23]— than in those of ApoE ɛ4 non-carriers [24, 25]. These two research groups also found that sample sizes estimated from ApoE ɛ4 carriers with MCI are smaller than those estimated from ApoE ɛ4 non-carriers with MCI. Thus, ApoE status could contribute to AD drug trial enrichment.
Although many reports have been published by the ADNI estimating sample sizes using cerebral atrophic rates or amounts derived from serial structural MRI [15–21], no reports are available on power calculations or estimates of sample size in Japan. While about 90% of the ADNI participants were white [3], all of the Japanese ADNI (J-ADNI) participants were Asian (Japanese). Thus, it is crucial to estimate how large a sample size would be needed for future clinical trials in Japan using atrophy measures from serial MRI as a surrogate biomarker. Accordingly, in the present study, we used an automated segmentation technique for the whole brain and hippocampus and the k-means normalized boundary shift integral (KN-BSI) to calculate the atrophy rates and estimate the sample sizes from serial MRI scans in the J-ADNI study for boosting the development of AD-modifying treatments. The automated segmentation of the hippocampus conformed to the standard segmentation protocol— harmonized protocol— that was recently developed by the ADNI and European Alzheimer’s Disease Consortium working group [26]. The BSI was adopted in the present study because it has been used in several clinical trials for AD therapies, including those of the first anti–β-amyloid vaccine (AN1792) [27], acetylcholinesterase inhibitors [28–30], and an N-methyl-D-aspartate receptor antagonist [31]. In addition, we examined whether ApoE status contributed to drug trial enrichment in the J-ADNI dataset.
METHODS
Participants
Participants were recruited in the J-ADNI study. The J-ADNI was a multicenter study assessing neuroimaging in diagnosis and longitudinal monitoring that was started in 2008 in Japan by the New Energy and Industrial Technology Development Organization (NEDO) and the Ministry of Health, Labour and Welfare (MHLW). All of the participants were recruited at 38 Japanese clinical sites. They were followed up for 2–3 years using 1.5-T MRI, positron emission tomography (PET), biological fluid analysis, and neuropsychological batteries. All of the protocols were designed to be as compatible as possible to those of the ADNI. For additional details about the J-ADNI, see the previous article by the J-ADNI [32].
Participants were 60 to 84 years of age, generally healthy, spoke Japanese, lived at home, and had a study partner. Details of the J-ADNI inclusion and exclusion criteria can be found at https://upload.umin.ac.jp/cgi-open-bin/ctr_e/ctr_view.cgi?recptno=R000001668. Briefly, the inclusion criteria for cognitively normal (CN) participants included the following: a score of 24–30 on the Mini-Mental State Examination (MMSE) [33], Japanese version; a global score of 0 on the CDR, Japanese version; and an education-adjusted score above the cutoff level on the Wechsler Memory Scale-Revised (WMS-R) Logical Memory II [34], Japanese version (education for 0–9 years was ≥3, for 10–15 years was ≥5, and for >15 years was ≥9). The inclusion criteria for the MCI subjects were a score of 24–30 on the MMSE, memory disturbance identified by the study partner with or without the subjective complaint of the participant, a score of 0.5 on the CDR, and an education-adjusted score below the cutoff level on the WMS-R Logical Memory II (education for 0–9 years was ≤2, for 10–15 years was ≤4, and for >15 years was ≤8). The inclusion criteria for AD subjects was a score of 20–26 on the MMSE score, a score of 0.5 or 1 on the CDR, and an education-adjusted score below the cutoff level on the WMS-R Logical Memory II (same as for MCI). AD subjects also had to meet the criteria of the NINCDS-ADRDA (the National Institute of Neurological and Communicative Diseases and Stroke and the Alzheimer’s Disease and Related Disorders Association) [35] for probable AD. Exclusion criteria included brain lesions on screening or baseline MRI, neurological and psychiatric disorders other than AD, addiction to alcohol or other drugs, and use of psychoactive drugs or warfarin.
The institutional review boards at all participating sites approved the data collection procedures and written informed consent was obtained from all participants. If participants were not capable of agreeing, their study partner signed the informed consent form in substitution.
A total of 750 participants were first recruited at the 38 clinical sites in Japan. Those who provided written informed consent and passed screening based on the above inclusion/exclusion criteria were enrolled in the J-ADNI study. Finally, 537 participants were enrolled. The 537 participants underwent brain MRI at baseline. Follow-up MRI was performed at 6, 12, and 24 months for all participants and at 36 months only for MCI and CN participants. MCI participants additionally underwent MRI at 18 months. Clinical and cognitive assessments were also performed for all participants at the time of the baseline and follow-up scans. These assessments included MMSE, ADAS-Cog, and CDR-SB. Data were used for analysis from 149 AD, 234 MCI, and 154 CN participants. Clinical and demographic data are shown in Table 1. The participants’ IDs and visits used in the present study are listed in Supplementary Material A.
Data for the automated segmentation atlas set
Data used in the preparation of the atlas set for the automated segmentation described in Supplementary Material B were obtained from the ADNI database (http://adni.loni.usc.edu). The ADNI was launched in 2003 as a public–private partnership, led by Principal Investigator Michael W. Weiner, MD. The primary goal of ADNI has been to test whether serial MRI, PET, other biological markers, and clinical and neuropsychological assessment can be combined to measure the progression of MCI and early AD. For up-to-date information, see http://www.adni-info.org.
MRI acquisition and image correction
Structural MR images were acquired on 1.5-T MRI scanners from three vendors (GE Healthcare, Milwaukee, WI; Siemens Medical Solutions, Erlangen, Germany; and Philips Medical Systems, Best, The Netherlands) using a three-dimensional sagittal magnetization-prepared rapid gradient-echo imaging (MPRAGE) sequence. Typical acquisition parameters were an inversion time of 1000 ms, repetition time of 2400 ms, minimum echo time, flip angle of 8°, field of view of 240×240 mm2, and in-plane resolution of 192×192 (1.25×1.25 mm2) or 256×256 (0.94×0.94 mm2) with slice thickness of 1.2 mm.
In this study, 3D MR images were acquired at 38 sites using scanners from the three different vendors. We performed the following three-step approach to minimize variations among scanners. First, we used a consistent MRI pulse sequence for MPRAGE over time. The MPRAGE sequence was used for all scanners to enhance gray/white matter contrast for superior gray/white matter segmentation. The parameters of the MPRAGE were chosen to be as close as possible to those of the MRI sequence of the US-ADNI [36]. For GE scanners, we installed a customized MPRAGE sequence with the permission of the University of Virginia.
Second, we checked whether any images suffered serious degradation due to motion artifacts, aliasing artifacts inside the skull, low signal-to-noise ratio, signal loss, or metal artifacts. Seriously degraded images were excluded to alleviate the influences of degradation on the results of the longitudinal and cross-sectional analyses.
Third, original MR images were pre-processed with the N3 intensity inhomogeneity correction [37] for all scanners and the B1 correction for scanners with a phased array receive coil to reduce intensity inhomogeneity due to non-uniform sensitivity of the receive coil [38]. Subsequently, phantom-based distortion correction [39] was performed to correct geometric distortion caused by the gradient non-linearity and static magnetic field inhomogeneity of each scanner.
Image processing
Our fully automated measurement procedure for the assessment of whole brain and hippocampalatrophy in serial MRI scans consists of two components: (1) automated segmentation of the whole brain and hippocampus using the multi-atlas image segmentation approach [40] and the corrective learning technique [41]; and (2) KN-BSI using multi-time-point symmetric affine registration with symmetric differential bias correction [19, 42–46]. For full details and assessments of this quantification procedure, see Supplementary Material B. Moreover, for head-to-head comparison with this procedure using the same dataset of the J-ADNI, one of the current state-of-the-art image analysis methods— FreeSurfer version 5.3 cross-sectional and longitudinal stream [47–49]— was used to estimate the atrophic changes of specific regions, including the hippocampal volume, lateral ventricle volume, and entorhinal cortical thickness, from serial MRI scans. The lateral ventricle consisted of the left and right lateral ventricles and inferior lateralventricles.
Recently, FreeSurfer has been shown to have similar reproducibility for atrophic measurements as manual hippocampal segmentation [50]. In the present study, no manual editing or exclusion due to processing failure was done at any stage of our procedure using KN-BSI and FreeSurfer. Note that FreeSurfer did not complete the cross-sectional stream for one participant (ID = JADNI0563, at 18 months) and the longitudinal stream for two participants (ID = JADNI0048, at 24 months and ID = JADNI0602, at 6 months).
ApoE genotyping
Of the 537 participants, 534 agreed to blood sampling for ApoE genotyping. Genomic DNA was extracted from peripheral blood using a QIAamp DNA Blood Maxi Kit (Qiagen, Dusseldorf, Germany) and was examined fluorometrically using a PicoGreen dsDNA quantification kit (Molecular Probes, Eugene, OR). ApoE genotyping of all samples was determined by single nucleotide polymorphism (SNP) typing and was confirmed by DNA sequencing. SNP genotyping of individual samples was done using an ABI PRISM 7900HT instrument using TaqMan technology. TaqMan SNP Genotyping Assays were purchased from Applied Biosystems (Foster City, CA). Sequencing was carried out by direct cycle sequencing with an ABI 3100 sequencer and a BigDye Terminator v3.1 kit (Applied Biosystems) using the following primers: C19APOE001-F (sense 5′-GCCTACAAAT CGGAACTGGA-3′) and C19APOE001-R (antisense 5′-ACCTGCTCCT TCACCTCGT-3′).
ApoE ɛ2 may protect against AD development [51]. In fact, when ApoE ɛ3/ɛ3 carriers have a reference odds ratio of 1.0, the odds ratio for AD development for ApoE ɛ2/ɛ4 carriers is 2.4, with its 95% confidence interval including the value 1.0 (0.4 to 15.4); in contrast, the odds ratios (95% confidence interval) for AD development for ApoE ɛ3/ɛ4 carriers and ApoE ɛ4/ɛ4 carriers are 5.6 (3.9 to 8.0) and 33.1 (13.6 to 80.5) in Japanese subjects, respectively [52]. However, in the present study, the frequency of ApoE ɛ2/ɛ4 carriers was very small: 1.3% both for AD and CN participants while no MCI individuals were carriers (Table 1). Therefore, we regarded ApoE ɛ2/ɛ4 carriers as ApoE ɛ4 carriers.
Statistical analyses
We used sample size estimation to evaluate the neuropsychological examination scores (CDR-SB, ADAS-Cog (the modified 13-item version) [13], and MMSE) and the measures from serial MRI using KN-BSI. Statistical analyses were separately performed for the MRI brain atrophy measures and cognitive measures. At each visit, if an MPRAGE scan was judged not to be suitable for image analysis at quality control assessments (e.g., due to gross motion artifacts) or the image processing resulted in failure, only cognitive measures at the same visit of the same participant were included in the statistical analysis (Fig. 1). Please note that cognitive measures were obtained at every visit for all participants. Adopting a previous method [25], we considered two-arm and equal allocation trials for a hypotheticalAD-modifying treatment versus placebo with the scores and above measures as the longitudinal outcomes and with two durations, 1 year and 2 years. In this setting, we calculated sample sizes to detect a 25% reduction in the mean rate of change (annual change) in the outcomes during the trial period with 80% power and a two-sided significance level of 5% with and without comparison to normal aging.
The power analysis is based on a linear mixed-effects model with random intercepts and slopes. Let Yij be the longitudinal outcome for the i-th subject and j-th measurement time and tj be the j-th measurement time in year, then our model is considered as follows:
(1)
where β0 and β1 are a fixed intercept and slope, respectively, α0 and α1 are a random intercept and slope, respectively, assuming bivariate normal distribution, and ɛij is the error term with a normal distribution and mean equal and variance
(2)
For the 1-year trial, data at baseline, 6 months, and 12 months were used. For the 2-year trial, data at baseline, 6 months, 12 months, and 24 months were analyzed. In addition, data at 18 months were included in the analyses of the MCI participants. Furthermore, sample sizes were separately estimated for ApoE ɛ4 carriers and non-carriers.
In addition, to perform head-to-head comparisons of sample sizes between cognitive and MRI-derived measures, the confidence intervals of the paired differences in the sample sizes from the two measures were calculated using a bootstrap sampling procedure. Samples were drawn randomly from the original samples with replacement and the number of samples was the same as the original. The sampling was repeated 10000 times, that is, 10000 bootstrap samples were obtained. When the 95% confidence interval (from the 2.5th to the 97.5th percentiles) did not include the null value of zero, the difference was assessed to be statistically significant at the 5% level.
All statistical analyses were performed using R version 3.2.1 [55] and the “longpower” package [56].
RESULTS
Sample size comparison between neuropsychological measuresand MRI-derived measures
The rates of change of the hippocampal volume using KN-BSI consistently provided a smaller sample size than the neuropsychological examination scores in AD and MCI with and without controlling for normal aging, assuming a 12-month trial (see Tables 2 and 3) and a 24-month trial (see Supplementary Table C1 and C2 in Supplementary Material C). Although the rates of change estimated from the whole brain volume provided a smaller sample size than those from CDR-SB, ADAS-Cog, and MMSE in AD and MCI patients without controlling for normal aging, they provided comparable or larger sample sizes than those from the cognitive measures CDR-SB and ADAS-Cog after controlling for normal aging. The sample sizes after controlling for normal aging in a 12-month trial were 2.5 to 3.5 times larger for the atrophic changes of the whole brain and about 1.5 times larger for the atrophic changes of the hippocampus than those obtained without controlling for normal aging in AD and MCI patients. KN-BSI, FreeSurfer, and cognitive measures are compared in Tables 5 and 6. As shown in Table 5, the best measure among MRI-derived measures using KN-BSI and FreeSurfer was the rate of change in the hippocampus using KN-BSI, followed by the rates of change in the cortical thickness in the entorhinal cortex and hippocampus by the FreeSurfer longitudinal stream and the whole brain using KN-BSI after controlling for normal aging. Table 6 shows the sample size comparison of KN-BSI, FreeSurfer, and cognitive measures using a bootstrap sampling procedure. KN-BSI hippocampus offered significantly smaller sample sizes than almost all of the FreeSurfer-derived and cognitive measures in AD and MCI patients with and without controlling for normal aging.
Overall, the hippocampal atrophy rates obtained using KN-BSI provided a smaller sample size than the other MRI and cognitive measures in a 12-month trial after controlling for normal aging in AD and MCI patients with statistical significance based on the bootstrap sampling procedure, except for the hippocampal atrophy rates obtained using the FreeSurfer longitudinal stream in AD.
Effects of ApoE ɛ4 status on sample sizes and atrophic rates of change
Table 4 presents the mean rates of change of the whole brain volume and hippocampal volume with 95% confidence intervals estimated from baseline, 6-month, and 12-month scans using the linear mixed-effects model in ApoE ɛ4 carriers and non-carriers with AD and MCI. The mean rates of change of the hippocampus of ApoE ɛ4 carriers were higher than those of ApoE ɛ4 non-carriers in the AD and MCI groups (p < 0.05), whereas the whole brain of ApoE ɛ4 carriers offered a non-significant trend toward a higher mean rate of change than that of ApoE ɛ4 non-carriers with AD (p = 0.13) or MCI (p = 0.13). The sample sizes estimated from the rates of change of the whole brain volume and hippocampal volume of ApoE ɛ4 carriers were smaller than those of ApoE ɛ4 non-carriers, with the hippocampal rate of change in ApoE ɛ4 carriers requiring 116 patients with AD and 145 patients with MCI after controlling for normal aging in a 12-month trial. In a 12-month clinical trial of MCI, sample sizes estimated from ApoE ɛ4 carriers after controlling for normal aging were 28.9% smaller in the KN-BSI whole brain (from 785 to 558 subjects/arm) and 47.7% smaller in the KN-BSI hippocampus (from 277 to 145 subjects/arm) than those estimated without information on ApoE status. In a 12-month trial of AD, sample sizes estimated from ApoE ɛ4 carriers while controlling for normal aging were 36.3% smaller in the KN-BSI whole brain (from 386 to 246 subjects/arm) and 34.1% smaller in the KN-BSI hippocampus (from 176 to 116 subjects/arm) than those estimated without information on ApoE status.
DISCUSSION
Our results indicate that atrophic changes in the hippocampus using KN-BSI on serial MRI offers a significantly smaller sample size for detecting a reduced disease progression by a hypothetical AD- and MCI-modifying treatment than that estimated from neuropsychological examination scores in ethnic Japanese. In addition, the results show that assessment of ApoE ɛ4 status is a promising drug trial enrichment strategy to reduce sample size. The image analysis procedure used automated segmentation of the whole brain and hippocampus, symmetric affine registration, and KN-BSI and was evaluated in terms of symmetry, transitivity, comparison with the state-of-the-art FreeSurfer tool, and reproducibility using short-interval scan pairs, based on cautionary notes proposed by Fox et al. [57], as well as the accuracy of the automated segmentation (see Tables 5 and 6 and Supplementary Material B).
In a 12-month trial for AD, the KN-BSI hippocampus offered 40.8% and 15.7% of the sample size of ADAS-Cog and 40.8% and 30.2% of that of CDR-SB with and without controlling for normal aging, respectively (see Tables 2 and 3). Holland et al. [17] reported that the longitudinal hippocampal measure in AD patients provided 40.8% and 17.8% of the sample size of that of ADAS-Cog and 38.6% and 23.2% of that of CDR-SB with and without controlling for normal aging, respectively. In a 12-month trial for MCI, the KN-BSI hippocampus offered 26.7% and 13.7% of the sample size of ADAS-Cog and 42.0% and 30.1% of that of CDR-SB with and without controlling for normal aging, respectively (see Tables 2 and 3). In Holland et al. [17], the authors reported that the longitudinal hippocampal measure in MCI patients provided 34.8% and 5.6% of the sample size of ADAS-Cog and 64.9% and 26.9% of that of CDR-SB with and without controlling for normal aging, respectively. Taken together, the sample sizes estimated from the KN-BSI hippocampus in AD patients with and without controlling for normal aging showed similar reductions in sample sizes as those reported by Holland et al. when they are compared with those estimated from the cognitive measures. However, the sample sizes estimated from the KN-BSI hippocampus in MCI patients while controlling for normal aging showed larger reductions in sample sizes than those in Holland et al. when compared with those estimated from the cognitive measures. One possible interpretation is that the proportion of MCI patients with more advanced disease status was larger in the present study than in the study by Holland et al. because the sample size reduction rates by the KN-BSI hippocampus in MCI patients compared with the cognitive measures were similar to those in AD patients.
In the present study, atrophic changes in structures in the medial temporal lobe, including the KN-BSI hippocampus and FreeSurfer longitudinal stream entorhinal cortex, offered smaller sample sizes than those estimated from other brain regions in AD and MCI patients (see Table 5). These findings support the view that the medial temporal lobe exhibits the first atrophic changes during the progression of AD [58]. In contrast, sample sizes estimated by the rates of change in the KN-BSI whole brain and FreeSurfer longitudinal stream lateral ventricle were not as small as those in the KN-BSI hippocampus or FreeSurfer longitudinal stream entorhinal cortex after controlling for normal aging. Although sample sizes are relatively small without controlling for normal aging, the difference may be due to the larger sample sizes after controlling for normal aging because the regions did not show specific AD-related atrophy.
In comparison with the FreeSurfer longitudinal stream, the longitudinal volume change in the KN-BSI hippocampus offered a significantly smaller sample size after controlling for normal aging (see Table 6). Both the FreeSurfer longitudinal stream [48] and the KN-BSI hippocampus compute brain volume changes of serial scans on a subject-specific template to minimize within-subject variability and maximize statistical power. However, the BSI “directly” computes volume changes by calculating voxel intensity differences between two serial scans at the boundary region of the whole brain or hippocampus, whereas the FreeSurfer longitudinal stream “indirectly” computes volume changes by separately calculating segmentations of the whole brain or hippocampus at each time point. The direct measurement has been reported to greater reduce within-group variability and increase statistical power than the indirect measurement [20, 59]. Moreover, the segmentation accuracies of our method using the multi-atlas image segmentation approach (see Supplementary Table B1 in Supplementary Material B) in the Dice similarity coefficient are higher than those of FreeSurfer for the hippocampus, even though the validation data sets were different from each other. That is, the accuracies of our method versus those of FreeSurfer were 0.899±0.016 versus 0.82±0.015 for the left hippocampus and 0.894±0.016 versus 0.82±0.028 for the right hippocampus [60]. These factors might have caused the significant differences in sample size estimates between our method and the FreeSurfer longitudinal stream.
ApoE ɛ4 carriers with AD and MCI provided smaller sample sizes than ApoE ɛ4 non-carriers and those of all of the participants in volume changes of the whole brain and hippocampus. These findings concur with the reports by Hua et al. and McEvoy et al. [24, 25]. In light of these results— that ApoE status enabled reductions in sample sizes in the atrophy measures— ApoE status could enrich future clinical trials of AD-modifying treatments. However, a trial enrichment strategy using ApoE status would require caution because a recent study has reported that ApoE ɛ4 carriers have a higher risk of amyloid-related imaging abnormalities than ApoE ɛ4 non-carriers in clinical trials of immunotherapy for reducing cerebral amyloid burden using bapineuzumab [61]. For ApoE ɛ4 non-carriers, on the other hand, other clinical enrichment strategies based on a machine learning method that handles data from imaging biomarkers such as those of MRI and/or PET could enrich clinical trials by enabling the selection of participants who will show future cognitive and neural decline [62].
To date, brain atrophy measurement using serial MRI scans has not been qualified as a surrogate endpoint for AD-modifying trials. However, the recent US Food and Drug Administration (FDA) draft guidance on the development of drugs for early-stage AD [63] stated that they “are open to considering the argument that a positive biomarker result (generally included as a secondary outcome measure in a trial) in combination with a positive finding on a primary clinical outcome measure may support a claim of disease modification in AD”, given that there is “widespread evidence-based agreement in the research community that the chosen biomarker reflects a pathophysiologic entity that is fundamental to the underlying disease process”. Although brain atrophy measurement does not reflect the molecular pathophysiologic processes of AD, it could serve as an approximate surrogate biomarker of the severity of neuronal loss, neuronal shrinkage, and synaptic loss [64]. Because the present study was a longitudinal observation study without any preventive or curative interventions, we could not reveal the effect of a disease-modifying therapy on brain atrophy measurement. In past clinical trials of drugs for mild-to-moderate AD patients using brain atrophy measure as an imaging endpoint, an unexpected paradoxical treatment effect— increased brain volume loss— was found in some study arm patients [27, 65]. In future clinical trials, it will be necessary to examine the effects of disease-modifying treatments on brain atrophy measurement and whether the paradoxical effect is transitory by long-term follow-up using MRI [65].
The present study has several strengths. First, it includes a large number of participants who were followed up for 2 or 3 years using identical protocols for neuropsychological examinations and image acquisitions over 38 clinical sites in Japan. Second, it has ApoE genotype information on almost all of the participants, which enables less biased examination of the trial enrichment strategy using ApoE status. Third, a linear mixed-effects model was used to perform power analyses because it can handle missing data in longitudinal studies. Fourth, automated segmentation using the multi-atlas fusion provides high accuracies for the whole brain and hippocampus (see Supplementary Material B1 in Supplementary Material B). Fifth, the image analysis procedures for calculating the longitudinal volume change using automated segmentation and KN-BSI were assessed using the methods proposed by Fox et al. [57], including symmetry, transitivity, linearity, reproducibility, and comparison with the known pathophysiology of AD, in addition to the head-to-head comparison with FreeSurfer (see Tables 5 and 6 and Supplementary Tables B2–B4 in Supplementary Material B).
Conversely, the present study has several limitations. First, the participants’ diagnoses were not based on neuropathological confirmation. Therefore, some participants assigned to the AD and MCI groups may have had cognitive decline due to causes other than AD. Cerebrospinal fluid biomarkers and/or brain PET imaging of amyloid and tau could help to exclude participants with other causes of cognitive decline. Second, we did not take into account the attrition rate in the sample size estimation. In a clinical trial of an AD-modifying treatment, some participants would drop out of the trial due to a large time commitment, a lack of incentive to continue the trial, or health problems. Sample sizes estimated when accounting for attrition are larger than those estimated without accounting for attrition. In the present study, the sample sizes were estimated from data that included images that underwent failed automated image processing in order to amplify the sample sizes and somewhat reflect the effect of attrition [66]. Third, we did not perform manual editing or exclusion due to processing failure at any stage of our procedure using KN-BSI and FreeSurfer. If treatment and placebo arms are not equally balanced across MR scanners, lower segmentation quality due to scanner-specific susceptibility artifacts would induce an artifactual difference of treatment effect between the arms.
In conclusion, this study demonstrates the potential of longitudinal atrophic changes of the hippocampus using automated segmentation andthe KN-BSI on serial MRI as a progression biomarker that could offer a significantly smaller sample size than cognitive measures in a clinical trial of an AD-modifying treatment in a Japanese population. Moreover, ApoE ɛ4 status offers promise as a drug trial enrichment strategy to reduce sample size. Because some participants who had cognitive decline due to causes other than AD may have been included in the present study, future studies with inclusion/exclusion criteria using amyloid PET, tau PET, and/or cerebrospinal fluid biomarkers would provide more plausible sample size estimation for a clinical trial of AD-modifying treatments.
DATA AVAILABILITY
Access to the original data of the J-ADNI is available on request from the NBDC Human Database (http://humandbs.biosciencedbc.jp/en/) hosted by the National Bioscience Database Center (NBDC) of the JST.
Acknowledgements
ACKNOWLEDGMENTS
For the J-ADNI
This work was partly carried out under the Brain Mapping by Integrated Neurotechnologies for Disease Studies (Brain/MINDS) project (grant number 16dm0207017h0003), funded by the Japan Agency for Medical Research and Development (AMED). The J-ADNI was supported by a Grant-in-Aid for Translational Research Promotion Project (Research Project for the Development of a Systematic Method for the Assessment of Alzheimer’s Disease) (grant number 20100000001577) from the New Energy and Industrial Technology Development Organization of Japan (NEDO), by Health Labour Sciences Research Grants (Research on Dementia) (grant numbers H19-Dementia Research-024, H22-Dementia Research-009) from the Japanese Ministry of Health, Labour and Welfare (MHLW), and by a Grant-in-Aid for Life Science Database Integration Project (Database Integration Coordination Program) from the Japan Science and Technology Agency(JST).
For the ADNI
Data collection and sharing for this project was funded by the Alzheimer’s Disease Neuroimaging Initiative (ADNI) (National Institutes of Health Grant U01 AG024904) and DOD ADNI (Department of Defense award number W81XWH-12-2-0012). ADNI is funded by the National Institute on Aging, the National Institute of Biomedical Imaging and Bioengineering, and through generous contributions from the following: AbbVie, Alzheimer’s Association; Alzheimer’s Drug Discovery Foundation; Araclon Biotech; BioClinica, Inc.; Biogen; Bristol-Myers Squibb Company; CereSpir, Inc.; Eisai Inc.; Elan Pharmaceuticals, Inc.; Eli Lilly and Company; EuroImmun; F. Hoffmann-La Roche Ltd. and its affiliated company Genentech, Inc.; Fujirebio; GE Healthcare; IXICO Ltd.; Janssen Alzheimer Immunotherapy Research & Development, LLC.; Johnson & Johnson Pharmaceutical Research & Development LLC.; Lumosity; Lundbeck; Merck & Co., Inc.; Meso Scale Diagnostics, LLC.; NeuroRx Research; Neurotrack Technologies; Novartis Pharmaceuticals Corporation; Pfizer Inc.; Piramal Imaging; Servier; Takeda Pharmaceutical Company; and Transition Therapeutics. The Canadian Institutes of Health Research is providing funds to support ADNI clinical sites in Canada. Private sector contributions are facilitated by the Foundation for the National Institutes of Health (http://www.fnih.org). The grantee organization is the Northern California Institute for Research and Education, and the study is coordinated by the Alzheimer’s Disease Cooperative Study at the University of California, San Diego. ADNI data are disseminated by the Laboratory for Neuro Imaging at the University of Southern California.
Authors’ disclosures available online (http://j-alz.com/manuscript-disclosures/16-0621r2).
Appendices
The supplementary material is available in the electronic version of this article: http://dx.doi.org/10.3233/JAD-160621.
REFERENCES
[1] | Alzheimer’s Association ((2015) ) 2015 Alzheimer’s disease facts and figures. Alzheimers Dement 11: , 332–384. |
[2] | Sperling RA , Aisen PS , Beckett LA , Bennett DA , Craft S , Fagan AM , Iwatsubo T , Jack CR , Kaye J , Montine TJ , Park DC , Reiman EM , Rowe CC , Siemers E , Stern Y , Yaffe K , Carrillo MC , Thies B , Morrison-Bogorad M , Wagster M V , Phelps CH ((2011) ) Toward defining the preclinical stages of Alzheimer’s disease: Recommendations from the National Institute on Aging-Alzheimer’s Association workgroups on diagnostic guidelines for Alzheimer’s disease. Alzheimers Dement 7: , 280–292. |
[3] | Petersen RC , Aisen PS , Beckett LA , Donohue MC , Gamst AC , Harvey DJ , Jack CR , Jagust WJ , Shaw LM , Toga AW , Trojanowski JQ , Weiner MW ((2010) ) Alzheimer’s Disease Neuroimaging Initiative (ADNI): Clinical characterization. Neurology 74: , 201–209. |
[4] | Gomar JJ , Bobes-Bascaran MT , Conejero-Goldberg C , Davies P , Goldberg TE , Alzheimer’s Disease Neuroimaging Initiative ((2011) ) Utility of combinations of biomarkers, cognitive markers, and risk factors to predict conversion from mild cognitive impairment to Alzheimer disease in patients in the Alzheimer’s disease neuroimaging initiative. Arch Gen Psychiatry 68: , 961–969. |
[5] | Ward A , Tardiff S , Dye C , Arrighi HM ((2013) ) Rate of conversion from prodromal Alzheimer’s disease to Alzheimer’s dementia: A systematic review of the literature. Dement Geriatr Cogn Dis Extra 3: , 320–332. |
[6] | Li J , Wang YJ , Zhang M , Xu ZQ , Gao CY , Fang CQ , Yan JC , Zhou HD , Chongqing Ageing Study Group ((2011) ) Vascular risk factors promote conversion from mild cognitive impairment to Alzheimer disease. Neurology 76: , 1485–1491. |
[7] | Xu W , Caracciolo B , Wang H , Winblad B , Bäckman L , Qiu C , Fratiglioni L ((2010) ) Accelerated progression from mild cognitive impairment to dementia in people with diabetes. Diabetes 59: , 2928–2935. |
[8] | Visser PJ , Verhey FRJ ((2008) ) Mild cognitive impairment as predictor for Alzheimer’s disease in clinical practice: Effect of age and diagnostic criteria. Psychol Med 38: , 113–122. |
[9] | Ramakers IHGB , Visser PJ , Aalten P , Kester A , Jolles J , Verhey FRJ ((2010) ) Affective symptoms as predictors of Alzheimer’s disease in subjects with mild cognitive impairment: A 10-year follow-up study. Psychol Med 40: , 1193–1201. |
[10] | Cummings JL , Morstorf T , Zhong K ((2014) ) Alzheimer’s disease drug-development pipeline: Few candidates, frequent failures. Alzheimers Res Ther 6: , 37. |
[11] | Morris JC ((1993) ) The Clinical Dementia Rating (CDR): Current version and scoring rules. Neurology 43: , 2412–2414. |
[12] | Rosen WG , Mohs RC , Davis KL ((1984) ) A new rating scale for Alzheimer’s disease. Am J Psychiatry 141: , 1356–1364. |
[13] | Mohs RC , Knopman D , Petersen RC , Ferris SH , Ernesto C , Grundman M , Sano M , Bieliauskas L , Geldmacher D , Clark C , Thai LJ ((1997) ) Development of cognitive instruments for use in clinical trials of antidementia drugs. Alzheimer Dis Assoc Disord 11: , 13–21. |
[14] | Frisoni GB , Fox NC , Jack CR , Scheltens P , Thompson PM ((2010) ) The clinical use of structural MRI in Alzheimer disease. Nat Rev Neurol 6: , 67–77. |
[15] | Nestor SM , Rupsingh R , Borrie M , Smith M , Accomazzi V , Wells JL , Fogarty J , Bartha R ((2008) ) Ventricular enlargement as a possible measure of Alzheimer’s disease progression validated using the Alzheimer’s disease neuroimaging initiative database. Brain 131: , 2443–2454. |
[16] | Schuff N , Woerner N , Boreta L , Kornfield T , Shaw LM , Trojanowski JQ , Thompson PM , Jack CR , Weiner MW ((2009) ) MRI of hippocampal volume loss in early Alzheimer’s disease in relation to ApoE genotype and biomarkers. Brain 132: , 1067–1077. |
[17] | Holland D , Brewer JB , Hagler DJ , Fennema-Notestine C , Dale AM ((2009) ) Subregional neuroanatomical change as a biomarker for Alzheimer’s disease. Proc Natl Acad Sci U S A 106: , 20954–20959. |
[18] | Hua X , Lee S , Hibar DP , Yanovsky I , Leow AD , Toga AW , Jack CR , Bernstein MA , Reiman EM , Harvey DJ , Kornak J , Schuff N , Alexander GE , Weiner MW , Thompson PM ((2010) ) Mapping Alzheimer’s disease progression in 1309 MRI scans: Power estimates for different inter-scan intervals. Neuroimage 51: , 63–75. |
[19] | Leung KK , Clarkson MJ , Bartlett JW , Clegg S , Jack CR , Weiner MW , Fox NC , Ourselin S ((2010) ) Robust atrophy rate measurement in Alzheimer’s disease using multi-site serial MRI: Tissue-specific intensity normalization and parameter selection. Neuroimage 50: , 516–523. |
[20] | Leung KK , Barnes J , Ridgway GR , Bartlett JW , Clarkson MJ , Macdonald K , Schuff N , Fox NC , Ourselin S ((2010) ) Automated cross-sectional and longitudinal hippocampal volume measurement in mild cognitive impairment and Alzheimer’s disease. Neuroimage 51: , 1345–1359. |
[21] | Aisen PS , Petersen RC , Donohue MC , Gamst A , Raman R , Thomas RG , Walter S , Trojanowski JQ , Shaw LM , Beckett LA , Jack CR , Jagust W , Toga AW , Saykin AJ , Morris JC , Green RC , Weiner MW ((2010) ) Clinical core of the Alzheimer’s disease neuroimaging initiative: Progress and plans. Alzheimers Dement 6: , 239–246. |
[22] | Cummings JL ((2010) ) Integrating ADNI results into Alzheimer’s disease drug development programs. Neurobiol Aging 31: , 1481–1492. |
[23] | Corder EH , Saunders AM , Strittmatter WJ , Schmechel DE , Gaskell PC , Small GW , Roses AD , Haines JL , Pericak-Vance MA ((1993) ) Gene dose of apolipoprotein E type 4 allele and the risk of Alzheimer’s disease in late onset families. Science 261: , 921–923. |
[24] | Hua X , Hibar DP , Ching CR , Boyle CP , Rajagopalan P , Gutman BA , Leow AD , Toga AW , Jack CR , Harvey D , Weiner MW , Thompson PM ((2012) ) Unbiased tensor-based morphometry: Improved robustness and sample size estimates for Alzheimer’s disease clinical trials. Neuroimage 66: , 648–661. |
[25] | McEvoy LK , Edland SD , Holland D , Hagler DJ , Roddey JC , Fennema-Notestine C , Salmon DP , Koyama AK , Aisen PS , Brewer JB , Dale AM ((2010) ) Neuroimaging enrichment strategy for secondary prevention trials in Alzheimer disease. Alzheimer Dis Assoc Disord 24: , 269–277. |
[26] | Boccardi M , Bocchetta M , Apostolova LG , Barnes J , Bartzokis G , Corbetta G , DeCarli C , DeToledo-Morrell L , Firbank M , Ganzola R , Gerritsen L , Henneman W , Killiany RJ , Malykhin N , Pasqualetti P , Pruessner JC , Redolfi A , Robitaille N , Soininen H , Tolomeo D , Wang L , Watson C , Wolf H , Duvernoy H , Duchesne S , Jack CR , Frisoni GB , EADC-ADNI Working Group on the Harmonized Protocol for Manual Hippocampal Segmentation ((2015) ) Delphi definition of the EADC-ADNI Harmonized Protocol for hippocampal segmentation on magnetic resonance. Alzheimers Dement 11: , 126–138. |
[27] | Fox NC , Black RS , Gilman S , Rossor MN , Griffith SG , Jenkins L , Koller M , AN1792(QS-21)-201 Study ((2005) ) Effects of Abeta immunization (AN1792) on MRI measures of cerebral volume in Alzheimer disease. Neurology 64: , 1563–1572. |
[28] | Jack CR , Petersen RC , Grundman M , Jin S , Gamst A , Ward CP , Sencakova D , Doody RS , Thal LJ ((2008) ) Longitudinal MRI findings from the vitamin E and donepezil treatment study for MCI. Neurobiol Aging 29: , 1285–1295. |
[29] | Schuff N , Suhy J , Goldman R , Xu Y , Sun Y , Truran-Sacrey D , Murthy A ((2011) ) An MRI substudy of a donepezil clinical trial in mild cognitive impairment. Neurobiol Aging 32: , 2318.e31–e41. |
[30] | Prins ND , van der Flier WA , Knol DL , Fox NC , Brashear H , Nye JS , Barkhof F , Scheltens P ((2014) ) The effect of galantamine on brain atrophy rate in subjects with mild cognitive impairment is modified by apolipoprotein E genotype: Post-hoc analysis of data from a randomized controlled trial. Alzheimers Res Ther 6: , 47. |
[31] | Weiner MW , Sadowsky C , Saxton J , Hofbauer RK , Graham SM , Yu SY , Li S , Hsu HA , Suhy J , Fridman M , Perhach JL ((2011) ) Magnetic resonance imaging and neuropsychological results from a trial of memantine in Alzheimer’s disease. Alzheimer’s Dement 7: , 425–435. |
[32] | Iwatsubo T ((2010) ) Japanese Alzheimer’s Disease Neuroimaging Initiative: Present status and future. Alzheimers Dement 6: , 297–299. |
[33] | Folstein MF , Folstein SE , McHugh PR ((1975) ) “Mini-mental state”. A practical method for grading the cognitive state of patients for the clinician. J Psychiatr Res 12: , 189–198. |
[34] | Wechsler D ((1987) ) WMS-R: Wechsler Memory Scale-Revised: Manual, Psychological Corporation, San Antonio. |
[35] | McKhann G , Drachman D , Folstein M , Katzman R , Price D , Stadlan EM ((1984) ) Clinical diagnosis of Alzheimer’s disease: Report of the NINCDS-ADRDA Work Group under the auspices of Department of Health and Human Services Task Force on Alzheimer’s Disease. Neurology 34: , 939–944. |
[36] | Jack CR , Bernstein MA , Fox NC , Thompson P , Alexander G , Harvey D , Borowski B , Britson PJ , L Whitwell J , Ward C , Dale AM , Felmlee JP , Gunter JL , Hill DLG , Killiany R , Schuff N , Fox-Bosetti S , Lin C , Studholme C , DeCarli CS , Krueger G , Ward HA , Metzger GJ , Scott KT , Mallozzi R , Blezek D , Levy J , Debbins JP , Fleisher AS , Albert M , Green R , Bartzokis G , Glover G , Mugler J , Weiner MW ((2008) ) The Alzheimer’s Disease Neuroimaging Initiative (ADNI): MRI methods. J Magn Reson Imaging 27: , 685–691. |
[37] | Sled JG , Zijdenbos AP , Evans AC ((1998) ) A nonparametric method for automatic correction of intensity nonuniformity in MRI data. IEEE Trans Med Imaging 17: , 87–97. |
[38] | Narayana PA , Brey WW , Kulkarni MV , Sievenpiper CL ((1988) ) Compensation for surface coil sensitivity variation in magnetic resonance imaging. Magn Reson Imaging 6: , 271–274. |
[39] | Maikusa N , Yamashita F , Tanaka K , Abe O , Kawaguchi A , Kabasawa H , Chiba S , Kasahara A , Kobayashi N , Yuasa T , Sato N , Matsuda H , Iwatsubo T ((2013) ) Improved volumetric measurement of brain structure with a distortion correction procedure using an ADNI phantom. Med Phys 40: , 062303. |
[40] | Wang H , Suh JW , Das SR , Pluta J , Craige C , Yushkevich PA ((2012) ) Multi-atlas segmentation with joint label fusion. IEEE Trans Pattern Anal Mach Intell 35: , 611–623. |
[41] | Wang H , Das SR , Suh JW , Altinay M , Pluta J , Craige C , Avants B , Yushkevich PA ((2011) ) A learning-based wrapper method to correct systematic errors in automatic image segmentation: Consistently improved performance in hippocampus, cortex and brain segmentation. Neuroimage 55: , 968–985. |
[42] | Freeborough P , Fox N , Kitney R ((1997) ) Interactive algorithms for the segmentation and quantitation of 3-D MRI brain scans. Comput Methods Programs Biomed 53: , 15–25. |
[43] | Leung KK , Ridgway GR , Ourselin S , Fox NC ((2012) ) Consistent multi-time-point brain atrophy estimation from the boundary shift integral. Neuroimage 59: , 3995–4005. |
[44] | Lewis EB , Fox NC ((2004) ) Correction of differential intensity inhomogeneity in longitudinal MR images. Neuroimage 23: , 75–83. |
[45] | Modat M , Cash DM , Daga P , Winston GP , Duncan JS , Ourselin S ((2014) ) A symmetric block-matching framework for global registration. In SPIE Medical Imaging, Ourselin S , Styner MA , eds., p. 90341D. |
[46] | Modat M , Cash DM , Daga P , Winston GP , Duncan JS , Ourselin S ((2014) ) Global image registration using a symmetric block-matching approach. J Med Imaging 1: , 024003. |
[47] | Fischl B , Salat DH , Busa E , Albert M , Dieterich M , Haselgrove C , Van Der Kouwe A , Killiany R , Kennedy D , Klaveness S , Montillo A , Makris N , Rosen B , Dale AM ((2002) ) Whole brain segmentation: Automated labeling of neuroanatomical structures in the human brain. Neuron 33: , 341–355. |
[48] | Reuter M , Schmansky NJ , Rosas HD , Fischl B ((2012) ) Within-subject template estimation for unbiased longitudinal image analysis. Neuroimage 61: , 1402–1418. |
[49] | Desikan RS , Ségonne F , Fischl B , Quinn BT , Dickerson BC , Blacker D , Buckner RL , Dale AM , Maguire RP , Hyman BT , Albert MS , Killiany RJ ((2006) ) An automated labeling system for subdividing the human cerebral cortex on MRI scans into gyral based regions of interest. Neuroimage 31: , 968–980. |
[50] | Mulder ER , de Jong RA , Knol DL , van Schijndel RA , Cover KS , Visser PJ , Barkhof F , Vrenken H ((2014) ) Hippocampal volume change measurement: Quantitative assessment of the reproducibility of expert manual outlining and the automated methods FreeSurfer and FIRST. Neuroimage 92: , 169–181. |
[51] | Corder EH , Saunders AM , Risch NJ , Strittmatter WJ , Schmechel DE , Gaskell PC , Rimmler JB , Locke PA , Conneally PM , Schmader KE ((1994) ) Protective effect of apolipoprotein E type 2 allele for late onset Alzheimer disease. Nat Genet 7: , 180–184. |
[52] | Farrer LA , Cupples LA , Haines JL , Hyman B , Kukull WA , Mayeux R , Myers RH , Pericak-Vance MA , Risch N , van Duijn CM ((1997) ) Effects of age, sex, and ethnicity on the association between apolipoprotein E genotype and Alzheimer disease. A meta-analysis. APOE and Alzheimer Disease Meta Analysis Consortium. JAMA 278: , 1349–1356. |
[53] | Fitzmaurice GM , Laird NM , Ware JH ((2011) ) Applied Longitudinal Analysis, John Wiley & Sons, Inc., Hoboken, NJ. |
[54] | Ard MC , Edland SD ((2011) ) Power calculations for clinical trials in Alzheimer’s disease. J Alzheimers Dis 26: (Suppl 3), 369–377. |
[55] | R Core Team ((2015) ) R: A Language and Environment for Statistical Computing, R Foundation for Statistical Computing, Vienna, Austria. |
[56] | Donohue MC , Gamst AC , Edland SD ((2013) ) longpower: Power and sample size calculators for longitudinal data. R package version 1.0–11. |
[57] | Fox NC , Ridgway GR , Schott JM ((2011) ) Algorithms, atrophy and Alzheimer’s disease: Cautionary tales for clinical trials. Neuroimage 57: , 15–18. |
[58] | Jack CR , Knopman DS , Jagust WJ , Shaw LM , Aisen PS , Weiner MW , Petersen RC , Trojanowski JQ ((2010) ) Hypothetical model of dynamic biomarkers of the Alzheimer’s pathological cascade. Lancet Neurol 9: , 119–128. |
[59] | Frost C , Kenward MG , Fox NC ((2004) ) The analysis of repeated “direct” measures of change illustrated with an application in longitudinal imaging. Stat Med 23: , 3275–3286. |
[60] | Morey RA , Petty CM , Xu Y , Hayes JP , Wagner HR , Lewis D V , LaBar KS , Styner M , McCarthy G ((2009) ) A comparison of automated segmentation and manual tracing for quantifying hippocampal and amygdala volumes. Neuroimage 45: , 855–866. |
[61] | Sperling RA , Salloway S , Brooks DJ , Tampieri D , Barakos J , Fox NC , Raskind M , Sabbagh M , Honig LS , Porsteinsson AP , Lieberburg I , Arrighi HM , Morris KA , Lu Y , Liu E , Gregg KM , Brashear HR , Kinney GG , Black R , Grundman M ((2012) ) Amyloid-related imaging abnormalities in patients with Alzheimer’s disease treated with bapineuzumab: A retrospective analysis. Lancet Neurol 11: , 241–249. |
[62] | Ithapu VK , Singh V , Okonkwo OC , Chappell RJ , Dowling NM , Johnson SC ((2015) ) Imaging-based enrichment criteria using deep-learning algorithms for efficient clinical trials in mild cognitive impairment. Alzheimers Dement 11: , 1489–1499. |
[63] | US Food and Drug Administration ((2013) ) Guidance for Industry. Alzheimer’s Disease: Developing Drugs for the Treatment of Early Stage Disease. Available from: http://www.fda.gov/downloads/Drugs/GuidanceComplianceRegulatoryInformation/Guidances/UCM338287.pdf. |
[64] | Jack CR ((2011) ) Alliance for aging research AD biomarkers work group: Structural MRI. Neurobiol Aging 32: , S48–S57. |
[65] | Cash DM , Rohrer JD , Ryan NS , Ourselin S , Fox NC ((2014) ) Imaging endpoints for clinical trials in Alzheimer’s disease. Alzheimers Res Ther 6: , 87. |
[66] | Wyman BT , Harvey DJ , Crawford K , Bernstein MA , Carmichael O , Cole PE , Crane PK , Decarli C , Fox NC , Gunter JL , Hill D , Killiany RJ , Pachai C , Schwarz AJ , Schuff N , Senjem ML , Suhy J , Thompson PM , Weiner M , Jack CR ((2013) ) Standardization of analysis sets for reporting results from ADNI MRI data. Alzheimers Dement 9: , 332–337. |
Figures and Tables
Fig.1
Flow diagram showing the inclusion and exclusion of atrophy measures and cognitive measures in the statistical analyses.
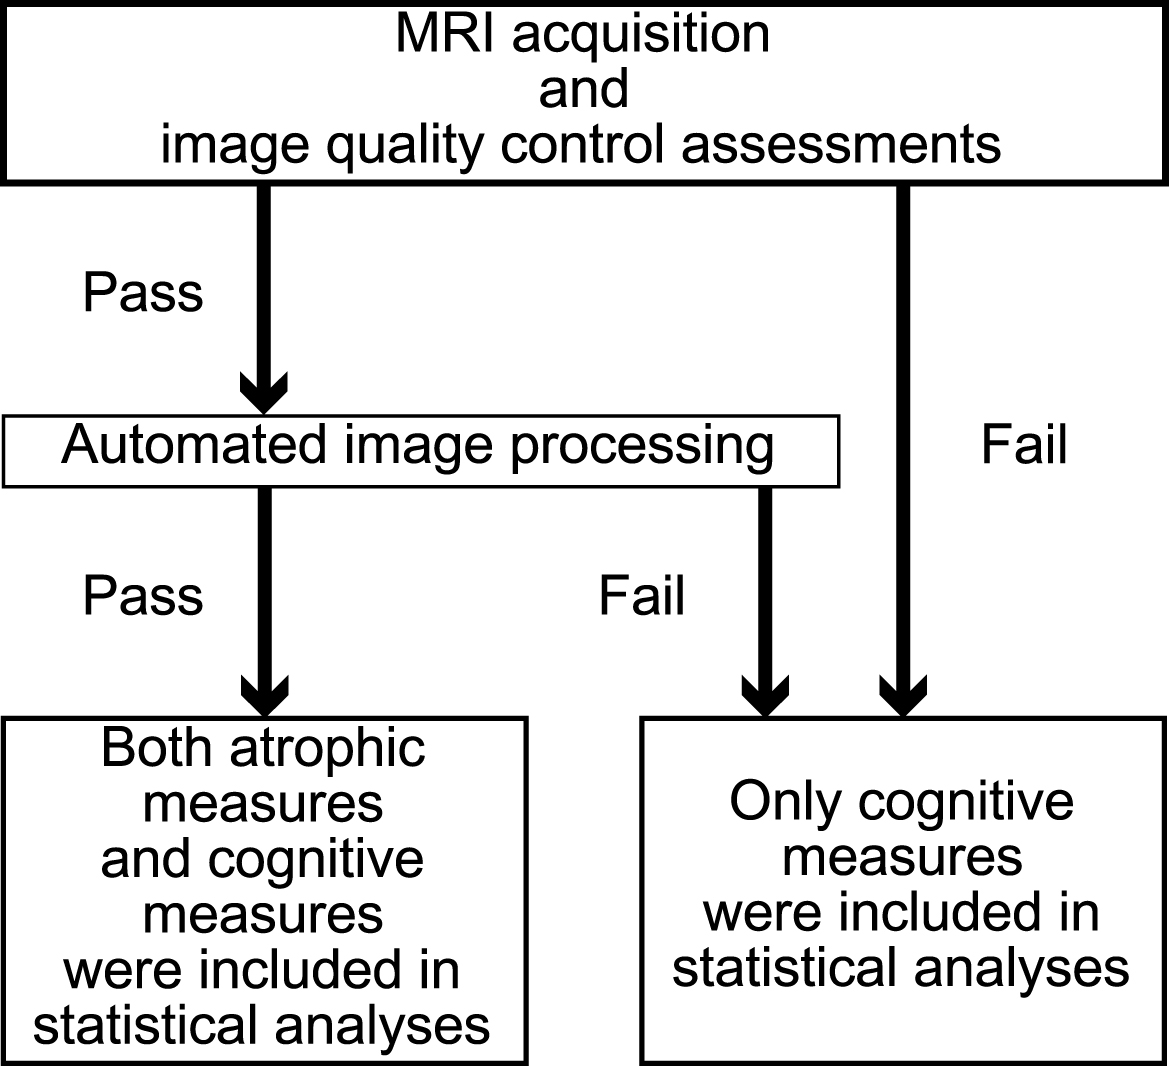
Table 1
Demographics of the J-ADNI participants (n = 537)
| Group | n | Age, y | Sex, M/F | Baseline MMSE | ApoE status |
| mean ± SD | mean ± SD | (ɛ2-3/ɛ2-4/ɛ3-3/ɛ3-4/ɛ4-4/NA), % | |||
| AD | 149 | 73.7 ± 6.6 | 43.0% /57.0% | 22.5 ± 1.8 | 3.4/1.3/36.9/40.9/16.8/0.7 |
| MCI | 234 | 73.0 ± 5.9 | 49.6% /50.4% | 26.4 ± 1.7 | 4.3/0.0/43.2/44.4/7.3/0.8 |
| CN | 154 | 68.3 ± 5.8 | 48.1% /51.9% | 29.1 ± 1.3 | 5.8/1.3/70.1/21.4/1.3/0.0 |
AD, Alzheimer’s disease; ApoE, apolipoprotein E; F, female; CN, cognitively normal; M, male; MCI, mild cognitive impairment; MMSE, Mini-Mental State Examination; NA, not available; SD, standard deviation.
Table 2
Sample size estimates for the AD and MCI groups using a linear mixed-effects model for neuropsychological tests*
| Outcome measure | Annual change±SE |
|
| N/arm not controlling for | N/arm controlling for |
| [95% CI] | normal aging [95% CI] | normal aging [95% CI] | |||
| CDR-SB | |||||
| CN | 0.07±0.05 [−0.03, 0.17] | ||||
| All AD subjects | 1.61±0.17 [1.27, 1.95] | 3.36 | 0.38 | 398 [272, 637] | 434 [297, 694] |
| ApoE ɛ4 non-carriers with AD | 1.83±0.26 [1.30, 2.35] | 3.13 | 0.38 | 292 [178, 564] | 315 [192, 608] |
| ApoE ɛ4 carriers with AD | 1.46±0.23 [1.01, 1.92] | 3.51 | 0.38 | 504 [295, 1048] | 554 [324, 1153] |
| All MCI subjects | 1.02±0.10 [0.81, 1.22] | 1.61 | 0.38 | 575 [399, 897] | 660 [458, 1030] |
| ApoE ɛ4 non-carriers with MCI | 0.75±0.14 [0.48, 1.02] | 1.46 | 0.25 | 880 [477, 2130] | 1064 [577, 2576] |
| ApoE ɛ4 carriers with MCI | 1.26±0.15 [0.96, 1.56] | 1.64 | 0.49 | 414 [272, 707] | 463 [304, 790] |
| ADAS-Cog | |||||
| CN | −1.00±0.28 [−1.55, −0.44] | ||||
| All AD subjects | 2.99±0.46 [2.09, 3.89] | 11.00 | 8.13 | 766 [454, 1556] | 431 [255, 876] |
| ApoE ɛ4 non-carriers with AD | 2.70±0.73 [1.25, 4.16] | 6.82 | 10.39 | 948 [408, 4182] | 506 [218, 2233] |
| ApoE ɛ4 carriers with AD | 3.17±0.59 [2.00, 4.35] | 13.94 | 6.61 | 678 [365, 1672] | 393 [211, 968] |
| All MCI subjects | 2.53±0.33 [1.89, 3.18] | 7.53 | 8.03 | 922 [586, 1658] | 475 [302, 854] |
| ApoE ɛ4 non-carriers with MCI | 1.90±0.45 [1.00, 2.80] | 3.80 | 8.82 | 1491 [692, 5261] | 642 [298, 2264] |
| ApoE ɛ4 carriers with MCI | 3.11±0.47 [2.18, 4.04] | 10.34 | 7.32 | 648 [386, 1304] | 372 [222, 748] |
| MMSE | |||||
| CN | 0.14±0.14 [−0.14, 0.42] | ||||
| All AD subjects | −1.39±0.27 [−1.93, −0.85] | 3.49 | 3.10 | 1263 [660, 3330] | 1039 [542, 2738] |
| ApoE ɛ4 non-carriers with AD | −1.65±0.44 [−2.53, −0.77] | 3.57 | 3.30 | 944 [408, 4119] | 799 [345, 3489] |
| ApoE ɛ4 carriers with AD | −1.20±0.35 [−1.89, −0.51] | 3.43 | 2.98 | 1631 [665, 8653] | 1303 [532, 6915] |
| All MCI subjects | −1.57±0.17 [−1.91, −1.22] | 1.87 | 2.34 | 670 [453, 1091] | 563 [380, 916] |
| ApoE ɛ4 non-carriers with MCI | −0.88±0.24 [−1.36, −0.40] | 1.45 | 2.34 | 1982 [837, 9329] | 1468 [620, 6913] |
| ApoE ɛ4 carriers with MCI | −2.19±0.23 [−2.65, −1.73] | 1.72 | 2.27 | 327 [224, 523] | 288 [197, 461] |
*The number of subjects per arm required to detect a 25% reduction in the mean rate of
decline at the p < 0.05 level with 80% power, assuming a 12-month trial with neuropsychological
examinations every 6 months, is shown before and after controlling for normal aging. CDR-SB, Clinical Dementia
Rating Scale Sum of Boxes score; ADAS-Cog, Alzheimer’s Disease Assessment Scale-Cognitive Subscale score; SE,
standard error of the mean; CI, confidence interval; AD, Alzheimer’s disease; MCI, mild cognitive impairment;
Table 3
Sample size estimates for the AD and MCI groups using a linear mixed-effects model for KN-BSI*
| Outcome measure | Annual % change±SE |
|
| N/arm not controlling for | N/arm controlling for |
| [95% CI] | normal aging [95% CI] | normal aging [95% CI] | |||
| KN-BSI whole brain | |||||
| CN | −0.38±0.06 [−0.49, −0.26] | ||||
| All AD subjects | −1.00±0.07 [−1.13, −0.87] | 0.44 | 0.08 | 150 [117, 199] | 386 [301, 511] |
| ApoE ɛ4 non-carriers with AD | −0.87±0.12 [−1.11, −0.64] | 0.58 | 0.08 | 243 [152, 447] | 750 [470, 1381] |
| ApoE ɛ4 carriers with AD | −1.08±0.08 [−1.24, −0.93] | 0.34 | 0.07 | 105 [80, 142] | 246 [188, 334] |
| All MCI subjects | −0.82±0.05 [−0.93, −0.72] | 0.45 | 0.09 | 231 [182, 304] | 785 [616, 1033] |
| ApoE ɛ4 non-carriers with MCI | −0.74±0.08 [−0.89, −0.58] | 0.44 | 0.09 | 289 [198, 460] | 1210 [829, 1929] |
| ApoE ɛ4 carriers with MCI | −0.90±0.07 [−1.05, −0.76] | 0.45 | 0.08 | 189 [141, 269] | 558 [414, 792] |
| KN-BSI hippocampus | |||||
| CN | −0.58±0.14 [−0.87, −0.30] | ||||
| All AD subjects | −3.34±0.20 [−3.74, −2.94] | 4.14 | 0.60 | 120 [96, 154] | 176 [141, 226] |
| ApoE ɛ4 non-carriers with AD | −2.68±0.32 [−3.32, −2.03] | 4.54 | 0.50 | 194 [127, 331] | 317 [208, 541] |
| ApoE ɛ4 carriers with AD | −3.78±0.24 [−4.26, −3.29] | 3.36 | 0.67 | 83 [65, 109] | 116 [91, 152] |
| All MCI subjects | −2.76±0.16 [−3.07, −2.46] | 4.27 | 0.49 | 173 [140, 218] | 277 [225, 351] |
| ApoE ɛ4 non-carriers with MCI | −2.02±0.22 [−2.46, −1.59] | 4.01 | 0.44 | 299 [204, 480] | 590 [402, 947] |
| ApoE ɛ4 carriers with MCI | −3.44±0.20 [−3.84, −3.03] | 3.61 | 0.54 | 100 [80, 128] | 145 [116, 185] |
*The number of subjects per arm required to detect a 25% reduction in the mean rate of
decline at the p < 0.05 level with 80% power, assuming a 12-month trial with MRI scans every 6 months,
is shown before and after controlling for normal aging. SE, standard error of the mean; CI, confidence interval;
KN-BSI, k-means normalized boundary shift integral; CN, cognitively normal; AD, Alzheimer’s disease; MCI, mild
cognitive impairment;
Table 4
Comparison of 1-year atrophy rates in the whole brain and hippocampus between ApoE ɛ4 carriers and non-carriers*
| Outcome measure | Annual % change±SE [95% CI]* | p value | |
| ApoE ɛ4 carriers | ApoE ɛ4 non-carriers | ||
| KN-BSI whole brain | |||
| AD | −1.08±0.08 [−1.24, −0.93] | −0.87±0.12 [−1.11, −0.64] | 0.13 |
| MCI | −0.90±0.07 [−1.05, −0.76] | −0.74±0.08 [−0.89, −0.58] | 0.13 |
| KN-BSI hippocampus | |||
| AD | −3.78±0.24 [−4.26, −3.29] | −2.68±0.32 [−3.32, −2.03] | <0.01 |
| MCI | −3.44±0.20 [−3.84, −3.03] | −2.02±0.22 [−2.46, −1.59] | <0.001 |
*The mean atrophy rates were estimated from baseline, 6-month, and 12-month scans using the linear mixed-effects model. SE, standard error of the mean; KN-BSI, k-means normalized boundary shift integral; AD, Alzheimer’s disease; MCI, mild cognitive impairment.
Table 5
Sample size estimates for the AD and MCI groups using a linear mixed-effects model*
| Outcome measure | AD | MCI | ||
| N/arm not controlling for | N/arm controlling for | N/arm not controlling for | N/arm controlling for | |
| normal aging [95% CI] | normal aging [95% CI] | normal aging [95% CI] | normal aging [95% CI] | |
| KN-BSI hippocampus | 120 [96, 154] | 176 [141, 226] | 173 [140, 218] | 277 [225, 351] |
| KN-BSI whole brain | 150 [117, 199] | 386 [301, 511] | 231 [182, 304] | 785 [616, 1033] |
| FS entorhinal cortex | 317 [223, 484] | 348 [245, 532] | 412 [300, 599] | 467 [341, 679] |
| FS hippocampus | 270 [196, 398] | 347 [251, 510] | 341 [255, 477] | 474 [356, 663] |
| FS lateral ventricle | 480 [316, 819] | 1538 [1010, 2622] | 203 [162, 261] | 690 [551, 891] |
| FSx entorhinal cortex | 642 [397, 1213] | 870 [537, 1644] | 1025 [636, 1923] | 1502 [931, 2818] |
| FSx hippocampus | 753 [450, 1510] | 1169 [699, 2342] | 870 [558, 1541] | 1458 [936, 2582] |
| FSx lateral ventricle | 536 [345, 947] | 1815 [1166, 3204] | 1321 [778, 2721] | 5907 [3478, 12169] |
| CDR-SB | 398 [272, 637] | 434 [297, 694] | 575 [399, 897] | 660 [458, 1030] |
| ADAS-Cog | 766 [454, 1556] | 431 [255, 876] | 922 [586, 1658] | 475 [302, 854] |
| MMSE | 1263 [660, 3330] | 1039 [542, 2738] | 670 [453, 1091] | 563 [380, 916] |
*The number of subjects per arm required to detect a 25% reduction in the mean rate of decline at the p < 0.05 level with 80% power, assuming a 12-month trial with MRI scans every 6 months, is shown with and without controlling for normal aging. AD, Alzheimer’s disease; MCI, mild cognitive impairment; KN-BSI, k-means normalized boundary shift integral; FS, FreeSurfer v5.3 longitudinal stream; FSx, FreeSurfer v5.3 cross-sectional; CDR-SB, Clinical Dementia Rating Scale Sum of Boxes; ADAS-Cog, Alzheimer’s Disease Assessment Scale-Cognitive Subscale; MMSE, Mini-Mental State Examination.
Table 6
Sample size comparison using bootstrap sampling*
| Outcome measure | AD | MCI | ||
| N/arm difference not | N/arm difference | N/arm difference not | N/arm difference | |
| controlling for normal | controlling for normal | controlling for normal | controlling for normal | |
| aging [95% CI] | aging [95% CI] | aging [95% CI] | aging [95% CI] | |
| KN-BSI hippocampus | ||||
| versus KN-BSI whole brain | −30 [−62, 1] | −210 [−405, −97]† | −58 [−102, −16]† | −507 [−1053, −248]† |
| versus FS entorhinal cortex | −196 [−305, −108]† | −172 [−331, −56]† | −239 [−359, −139]† | −190 [−419, −29]† |
| versus FS hippocampus | −150 [−250, −1]† | −170 [−358, 37] | −168 [−263, −79]† | −197 [−465, −32]† |
| versus FS lateral ventricle | −360 [−805, −1]† | −1362 [−4524, −133]† | −30 [−91, 35] | −413 [−948, −138]† |
| versus CDR-SB | −278 [−383, −181]† | −257 [−391, −133]† | −402 [−563, −256]† | −382 [−624, −182]† |
| versus ADAS-Cog | −645 [−1150, −358]† | −254 [−505, −88]† | −749 [−1163, −491]† | −197 [−426, −33]† |
| versus MMSE | −1143 [−2128, −681]† | −863 [−1746, −469]† | −497 [−758, −315]† | −285 [−570, −96]† |
| KN-BSI whole brain | ||||
| versus FS entorhinal cortex | −167 [−279, −76]† | 38 [−157, 272] | −180 [−304, −77]† | 318 [−17, 899] |
| versus FS hippocampus | −120 [−223, 38] | 39 [−173, 358] | −109 [−218, −5]† | 311 [−41, 861] |
| versus FS lateral ventricle | −331 [−773, 31] | −1152 [−4228, 97] | 28 [−32, 95] | 94 [−310, 538] |
| versus CDR-SB | −248 [−352, −153]† | −48 [−219, 196] | −344 [−506, −195]† | 125 [−229, 718] |
| versus ADAS-Cog | −616 [−1120, −326]† | −45 [−332, 236] | −691 [−1110, −434]† | 310 [−46, 897] |
| versus MMSE | −1114 [−2074, −650]† | −653 [−1492, −223]† | −439 [−708, −257]† | 222 [−167, 816] |
*The sample sizes were estimated assuming a 12-month trial with assessments every 6 months. †Statistically significant based on the bootstrap sampling procedure. AD, Alzheimer’s disease; MCI, mild cognitive impairment; KN-BSI, k-means normalized boundary shift integral; FS, FreeSurfer v5.3 longitudinal stream; CDR-SB, Clinical Dementia Rating Scale Sum of Boxes; ADAS-Cog, Alzheimer’s Disease Assessment Scale-Cognitive Subscale; MMSE, Mini-Mental State Examination.


